Article

Final Seed Size in Soybean Is Determined during Mid-Seed Filling Stage

College of Agriculture, Health, and Natural Resources, Kentucky State University, Frankfort, KY 40601, USA
*
Author to whom correspondence should be addressed.
Agronomy 2024, 14(4), 763; https://doi.org/10.3390/agronomy14040763
Submission received: 9 March 2024 / Revised: 19 March 2024 / Accepted: 5 April 2024 / Published: 8 April 2024
(This article belongs to the Section Soil and Plant Nutrition)

Abstract

:
Potential seed size in many crops including major cereals is determined during early seed developmental stages. However, the stage at which final seed size is determined in soybean (Glycine max [L.] Merr.) under field conditions is not known. Hence, this study was conducted with the main objective to assess seed growth dynamics under controlled and increased assimilate supply conditions during different seed filling periods using two maturity group soybean cultivars. Treatments consisted of a control, and a de-podding (pod removal) treatment at weekly intervals after the beginning of the seed filling stage up until physiological maturity. Only four to six pods were maintained per plant in de-podding treatments in order to provide a higher assimilate supply to remaining seeds. A higher assimilate supply until around the mid-seed filling stage increased unit seed weight in both the cultivars, indicating that the maximum seed size in soybean crops is determined during the mid-seed filling stage. The increase in seed weight under higher assimilate supply was associated with an extended seed filling duration and a uniform seed filling rate over a longer period. The results also suggested a possible source limitation during the early seed filling stage in soybean, indicating opportunities to improve its yield using supplemental inputs and other improved crop cultivation practices.

1. Introduction

The production of photoassimilates in a source (leaf) and their transport to the sink (grain) is an important physiological process that largely determines crop yield. Limitations at either the source or the sink during crop developmental stages can reduce productivity [1]. Hence, understanding source–sink dynamics is essential, in order to identify and address such limitations and improve crop yields. Artificially increasing or decreasing source and sink strength is a widely used technique in source–sink manipulation studies to aid understanding of source and sink dynamics and identify any limitations in source or sink related components. Such studies are useful for developing strategies to improve yield-related components and subsequently crop yield. Manipulating assimilate supply for developing seeds has been extensively used to understand source and sink dynamics in several crops. Differences in assimilate supply (source) have been found to result in variable responses with regard to seed size (sink), depending on the crop. Studies have reported no improvement in final seed size in wheat (Triticum aestivum L.) and maize (Zea mays) with an increase in the assimilate supply during seed filling [2,3]. A compilation of several source and sink manipulation studies [2] documented very little to no improvement in seed size with increased assimilate supply during seed filling in wheat and maize. Interestingly, there was no seed size reduction in wheat, even with reduced assimilate supply. These results indicate that the final seed size in wheat is highly conserved and that it is determined before the beginning of the seed filling stage. A study in maize [3] reported no increase in final kernel weight, even when half of the kernels were removed. Rice (Oryza sativa) also has a highly consistent seed size, and increasing seed size is not the primary focus of most rice yield improvement programs [4,5]. The size of the ovary before anthesis playing a crucial role in final seed size determination has been reported in sorghum (Sorghum bicolor) [6]. This mechanism may explain, in part, the lack of response in cereal seed size under higher assimilate supply. Hence, there is wide agreement among previous studies that maximum seed size in most cereal crops is determined during the seed formation stage. As a result, cereal crop yield cannot be increased significantly with higher assimilate supply during seed growth, mainly due to limitations in sink strength.
In comparison to monocot cereals, there is limited information regarding the effect of source–sink manipulation on seed weight, and consequently the window when the final seed size is determined, in dicotyledonous plants such as soybean (Glycine max [L.] Merr.). However, in contrast to cereals, most of the studies in dicots have found that increased assimilate supply improves unit seed weight, such as in canola (Brassica napus L.) [7,8,9], sesame (Sesamum indicum L.) [10], oilseed rape (Brassica napus L.) [11], sunflower (Helianthus annuus L.) [12], pea (Pisum sativum L.) [13], French bean (Phaseolus vulgaris L.) [14], mung bean (Phaseolus aureus Roxb.) [15], faba bean (Vicia faba L.) [16], and lupin (Lupinus angustifolius L.) [13]. In soybean, numerous studies incorporating an increased assimilate supply for developing seeds have reported significant increases in unit seed weight [17,18,19,20,21,22,23,24,25,26,27,28,29,30]. A study [2], after analyzing data from previous studies in soybean, reported a 46% average increase in seed weight with higher assimilate supply during seed growth. These results indicate that unlike cereals, final seed size in soybean may be determined at later developmental stages, and is more dependent on assimilate supply during the seed filling phase. Studies have reported large amounts of carbohydrate remobilization from the leaf, stem, and roots to developing seeds during seed filling in soybean, indicating their photosynthesis rate is not enough to meet the high carbohydrate demands during seed growth [31]. Results from previous studies suggest potential source limitations in soybean under current normal growing environments. Hence, there is an opportunity to improve soybean seed size if we can avoid these limitations, such as via increased assimilate supply during seed filling. However, it is not yet clearly understood exactly when the final seed size is determined in soybean during the seed filling phase, and beyond that, not responds to an increased assimilate supply.
In several other crops such as wheat [32] and corn [33], systematic experiments with increased assimilate supply at different growth stages have identified the stage at which yield-related components, such as seed number and weight, are determined. However, similar studies manipulating source and sink during different seed filling stages have not been conducted in soybean under actual field conditions. In all of the previous field studies in soybean, source and sink were manipulated across the entire pod growth period. A recent study in a greenhouse setting [34] employing increased assimilate supply during different seed filling stages found that soybean seed size responds to an increase in assimilate supply until the late seed filling phase. This result suggests that seed size in soybean is determined during the late seed filling stage. However, similar information is not available for soybean grown under field conditions. Therefore, this study was conducted to employ increased assimilate supply at different seed filling stages under field growth conditions in order to identify the stage at which final seed and pod size and related compositions are determined.

2. Materials and Methods

2.1. Crop Husbandry

Two experiments (Experiment 1 and Experiment 2) were conducted at Kentucky State University’s Harold R. Benson Research and Demonstration Farm, Frankfort, KY, USA (38°07′09″ N and 84°53′22″ W). An early season maturity group 2 (MG2) soybean cultivar (PB 2623) was planted in Experiment 1, and a full season maturity group 4 (MG4) soybean cultivar (PB 423) was planted in Experiment 2. Both soybean cultivars were of a determinate growth habit. The MG2 cultivar in Experiment 1 was sown on 15 May 2023, and the MG4 cultivar in Experiment 2 was sown on 19 May 2023, both at a rate of 35 seeds m−2. Each plot consisted of five rows, 38 cm (15 inches) apart and 7.3 m (24 feet) long. The soil was tested before planting, and the recommended K fertilizer was provided with muriate of potash applications.

2.2. Experimental Design and Treatments

Both the experiments were set up in a randomized complete block design with four replications. Treatments consisted of control and de-podding treatments at weekly intervals after the beginning of seed filling phase (R5), continuing until physiological maturity (R7). The MG2 cultivar used in Experiment 1 developed mature pod color at the sixth week after R5. Hence, Experiment 1 underwent one control and six de-podding treatments; the first was applied at R5, and the second, third, fourth, fifth, and sixth were applied at one, two, three, four, and five weeks post-R5, respectively. The MG4 cultivar used in Experiment 2 developed mature pod color in the seventh week after R5. Hence, Experiment 2 had one control and seven de-podding treatments—the first at R5, and the second, third, fourth, fifth, sixth, and seventh at one, two, three, four, five, and six weeks post-R5, respectively. Two plants were selected and tagged for each treatment in each plot (a total of eight plants per treatment). To facilitate the de-podding process, four to six pods in each plant at the R5 stage (pods having seeds with approximately 3 mm diameter) were marked with acrylic paint in all tagged plants. At the time of de-podding, only one marked pod was left in each node; the rest were removed to provide increased assimilate supply to developing seeds in the remaining pod. In all de-podding treatments, newly emerged pods were removed after the de-podding treatments started. De-podding treatments continued until marked pods reached mature color, i.e., physiological maturity (R7 stage).

2.3. Observations

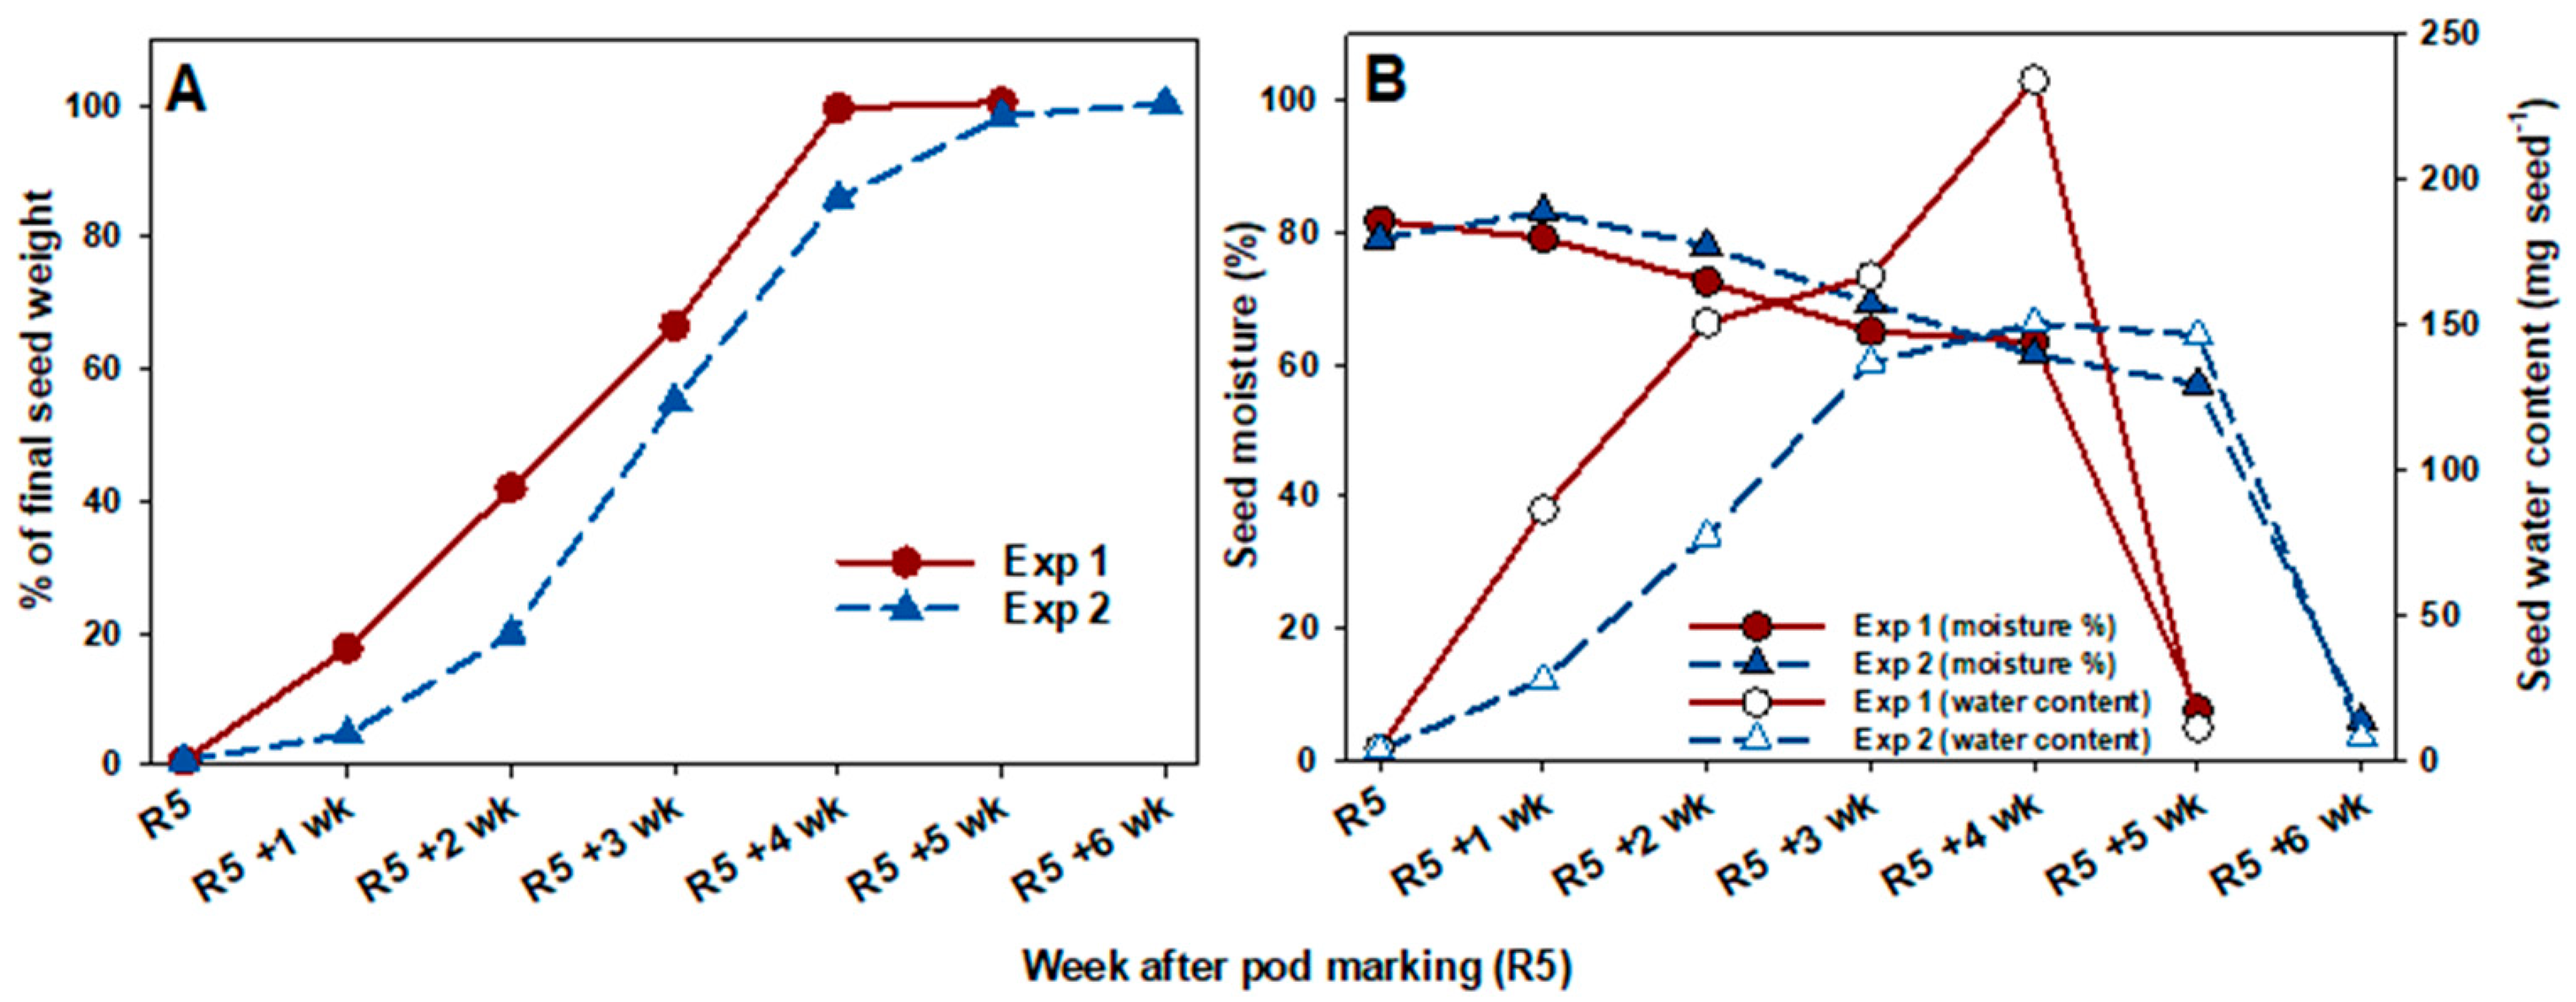
2.3.1. Temporal Seed Growth Dynamics under Control Conditions

At the time of each de-podding treatment, marked pods from two control plants in each replication were harvested to monitor temporal seed growth and moisture to assess seed development stage at the time of de-podding. Seeds were isolated from the pods and fresh seed weight, shell weight, and seed numbers per pod were recorded. After that, seeds were oven dried at 60 °C until constant weight was achieved, and dry seed weight and shell weight were recorded. The seed moisture % was calculated using fresh and dry seed weight data.

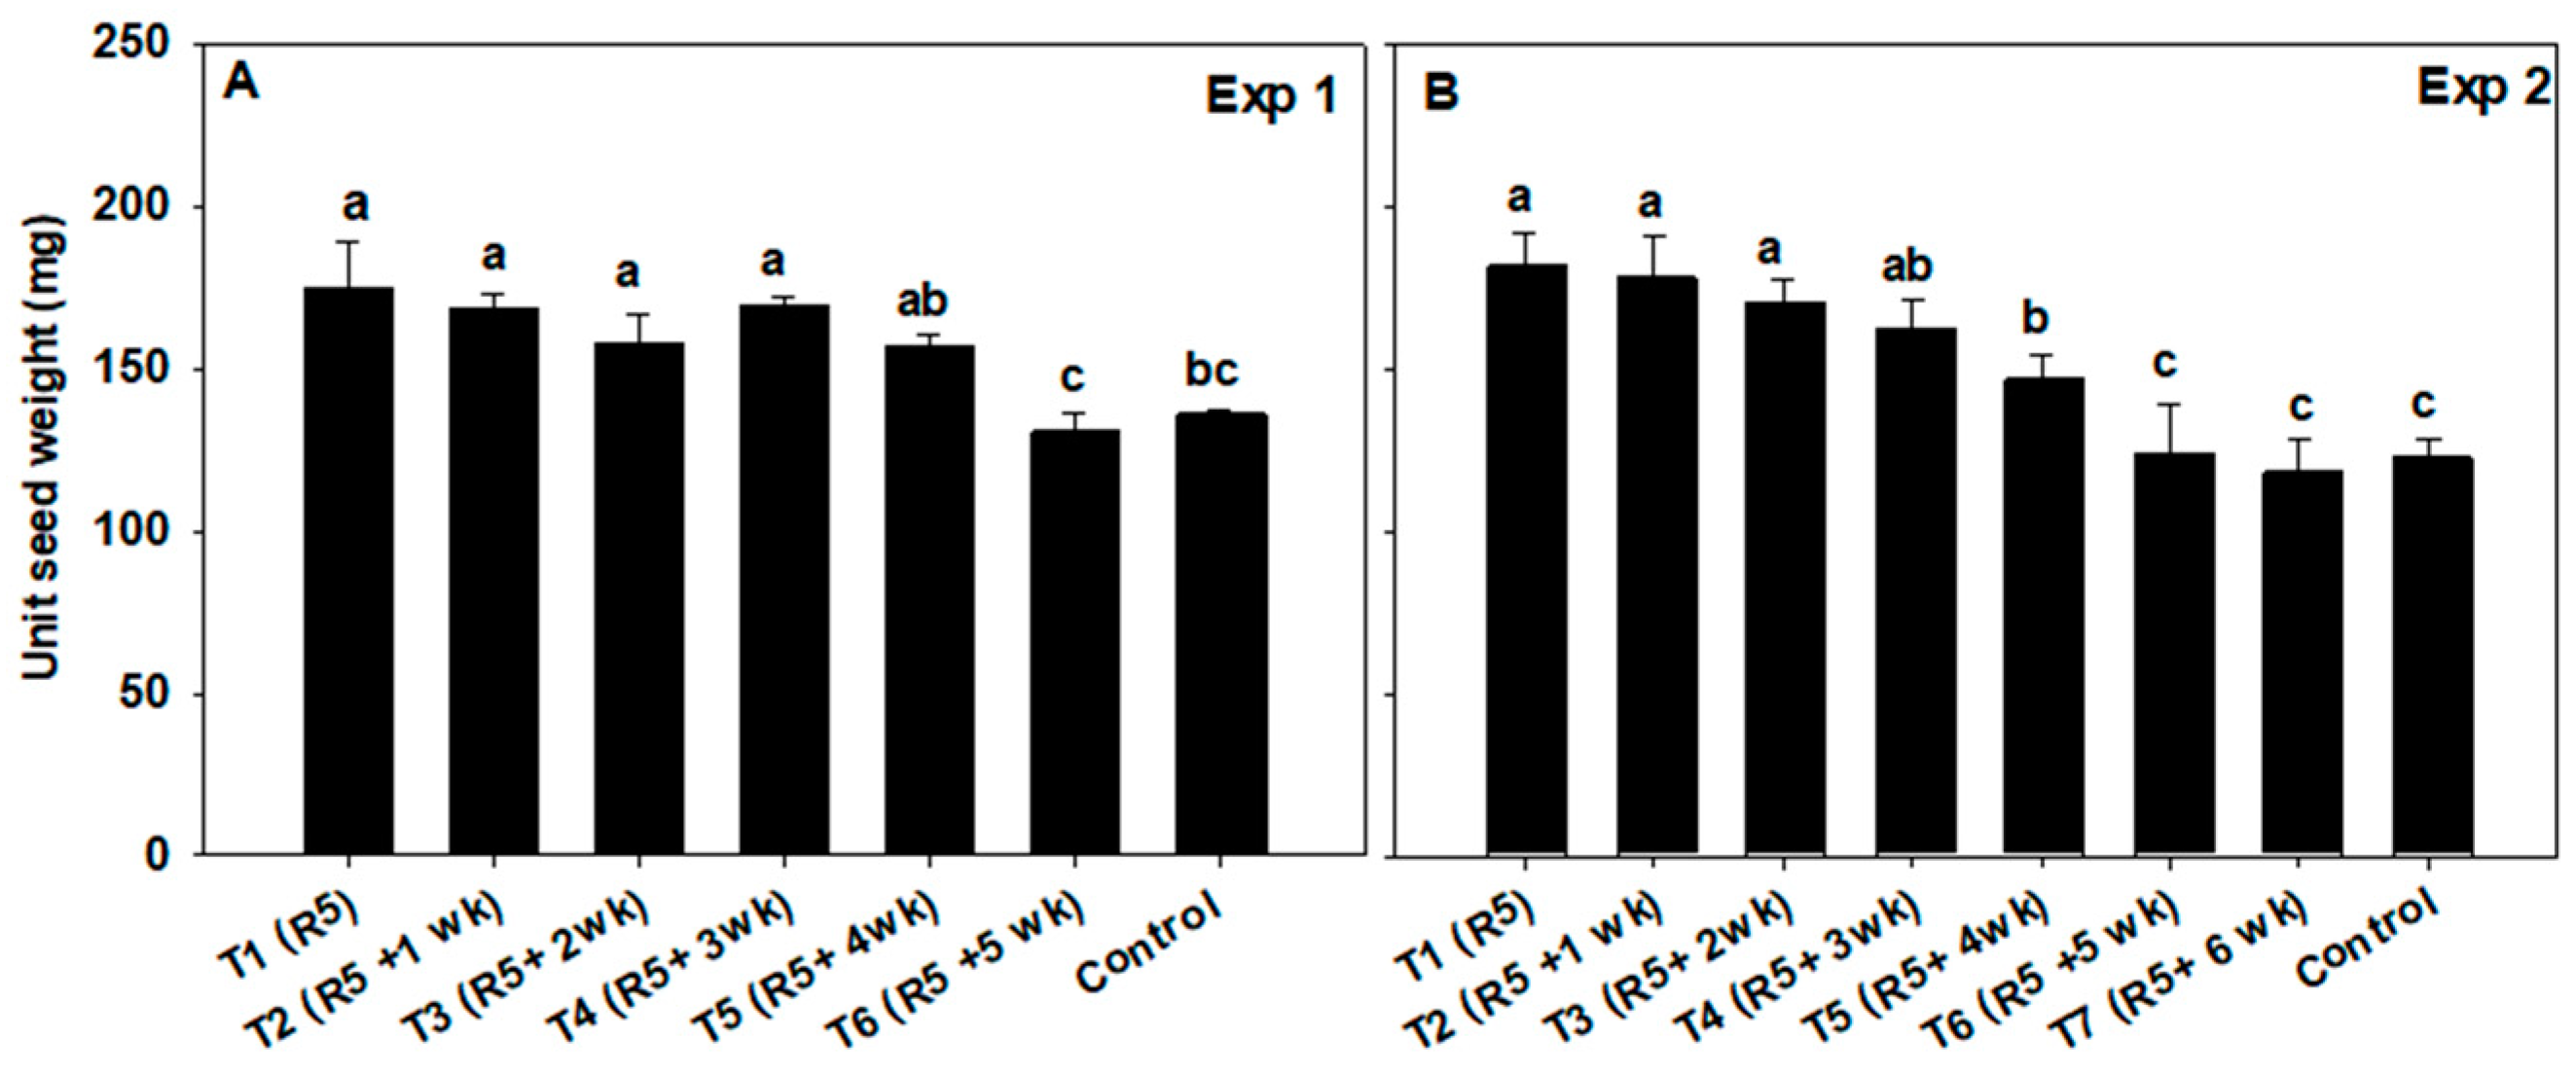
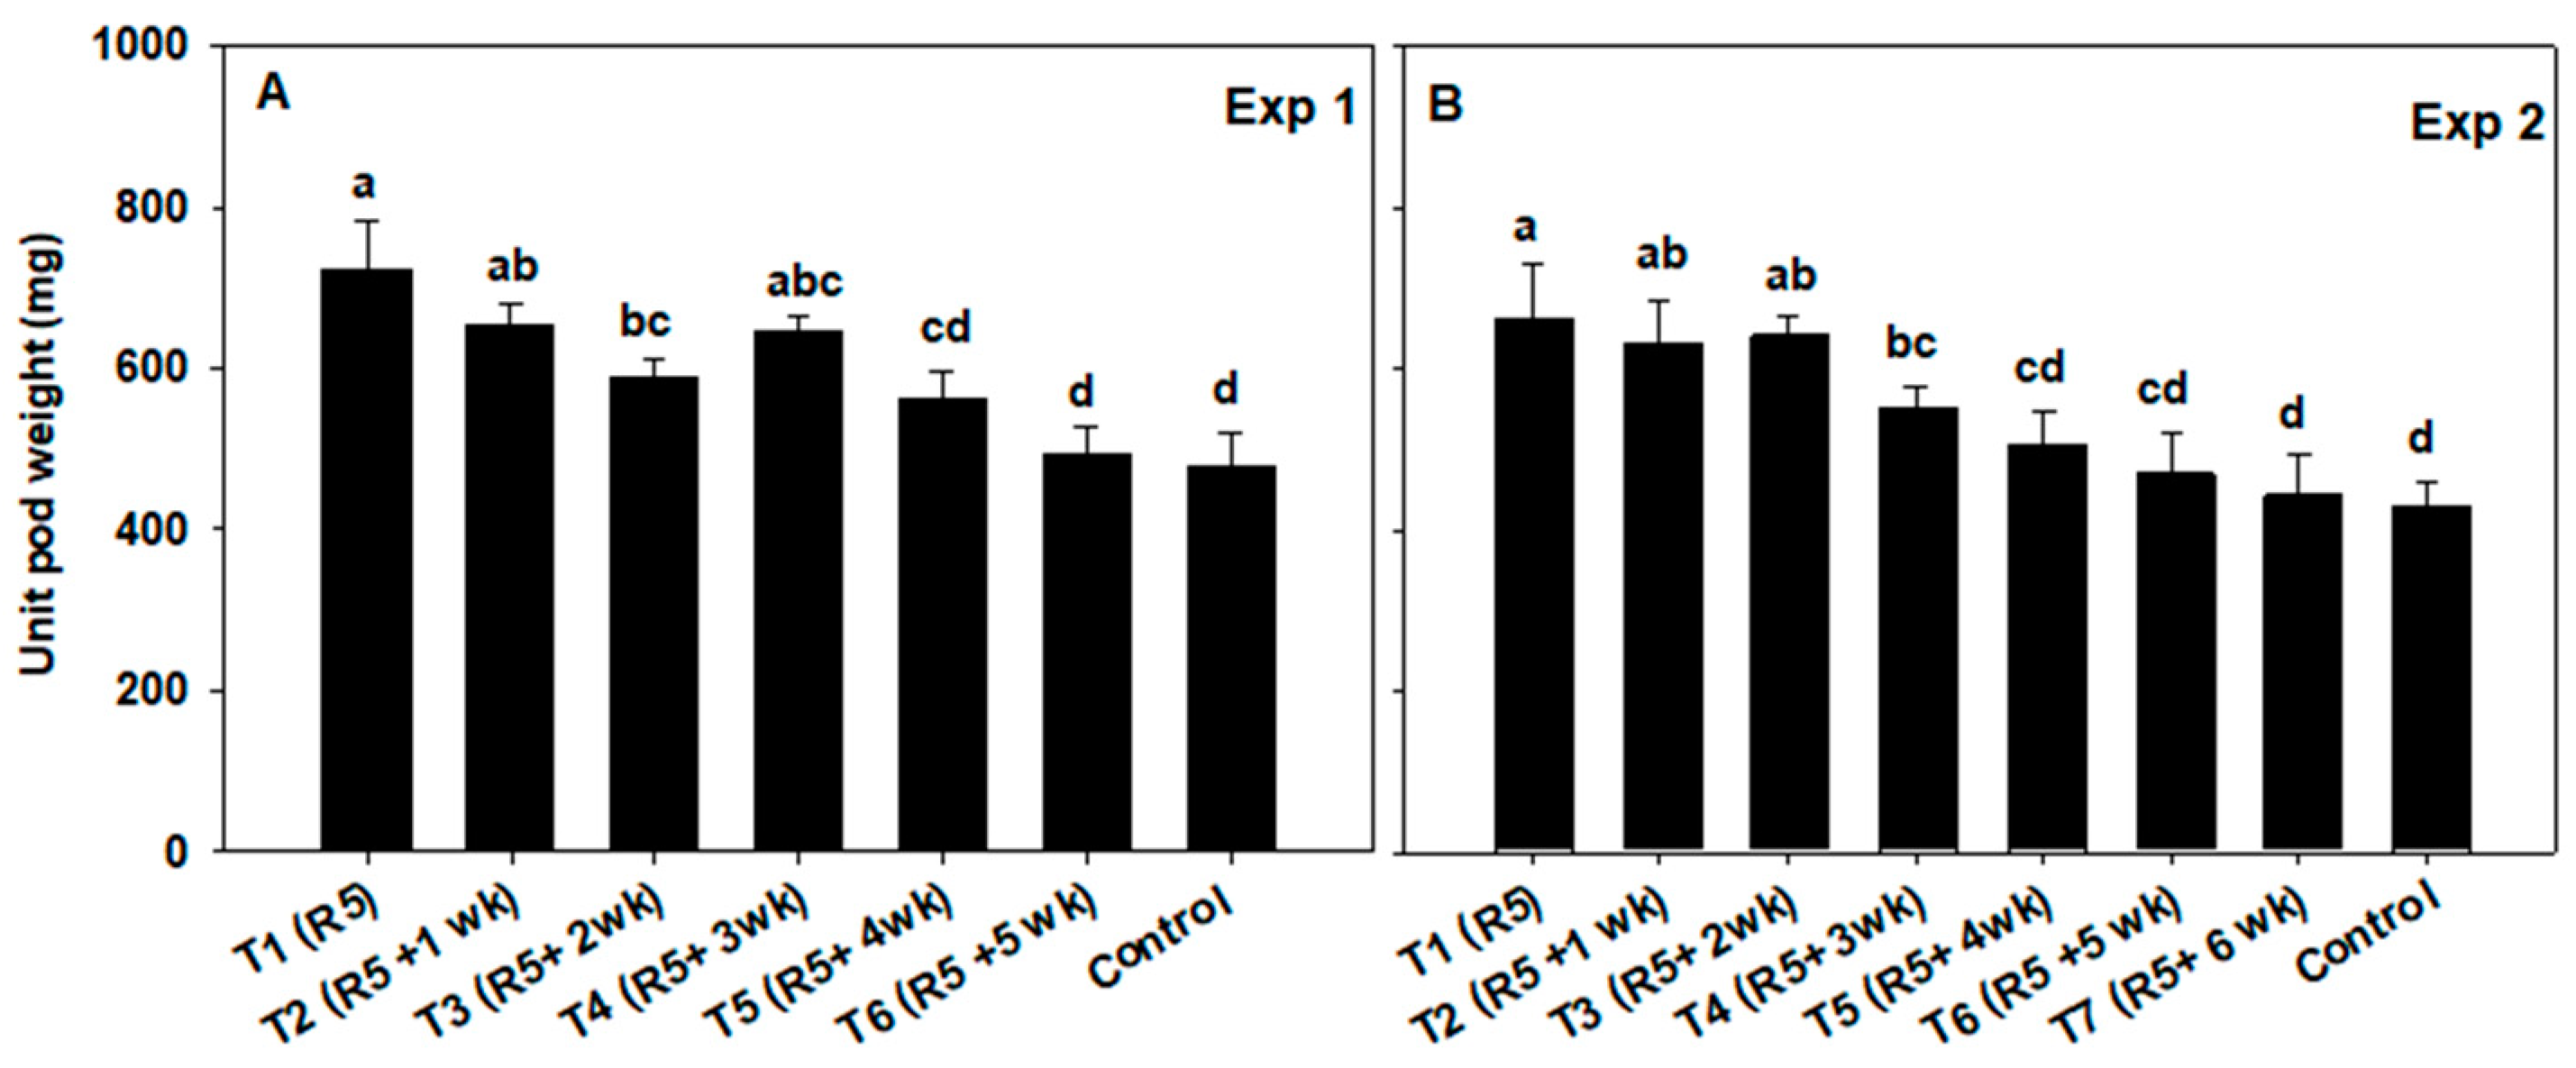
2.3.2. Final Seed Weight, Pod Weight, Seed Filling Duration and Rate

All of the marked pods across all of the treatments were harvested after reaching harvest maturity (R8 stage) and final seed weight, pod weight, seed numbers per pod were recorded. Days from R5 to R7 was recorded as the seed filling duration. Seed growth rate was calculated following the equation: seed growth rate = final seed weight/seed filling duration. Seed growth rate from the time of each de-podding to maturity was calculated using the following equation: seed growth rate = seed weight gained from time of de-podding to maturity/days from de-podding to maturity. The seed weight gained from the time of de-podding to maturity was calculated as the difference between the final seed weight at the given de-podding treatment and the seed weight under control at the time of de-podding.

2.3.3. Seed Composition

Moisture, protein, and oil concentrations in the matured seeds were determined using a DA 7250™ near infrared spectroscopy (NIRs) analyzer (Perkin Elmer, Hägersten, Sweden). Due to the low number of seeds in each plant, seeds from two plants from each treatment in a plot were combined together. Each sample was repacked and analyzed two times using a small mirror cup, which is designed to analyze samples with few seeds.

2.4. Statistical Analysis

Data were analyzed with an analysis of variance using the GLIMMIX procedure (SAS Software Version 9.4, SAS Institute, Cary, NC, USA). De-podding treatments were considered a fixed effect, while replication and plant (nested within replication) were considered as random effects. Means were separated using the least significant difference when treatments and interactions were significant at p ≤ 0.05.

3. Results

3.1. Climatic Conditions during Plant Growth

The average daily temperature between VE (crop emergence) and R1 (beginning of flowering) was 19.1 °C and 21.3 °C in Experiments 1 and 2, respectively (Table 1). Similarly, the average daily temperature between R1 and R5 was 23.3 °C in Experiment 1 and 22.5 °C in Experiment 2, and between R5 and R7 it was 23.7 °C in Experiment 1 and 21.8 °C in Experiment 2 (Table 1). Total precipitation between VE and R1 was 180.3 mm in Experiment 1 and 221.5 mm in Experiment 2; between R1 and R5 it was 172.5 mm in Experiment 1, and 288.5 mm in Experiment 2; and between R5 and R7 it was 65.8 mm in Experiment 1 and 58.2 mm in Experiment 2 (Table 1).

3.2. Seed Weight and Moisture Dynamics under Control

Temporal seed growth and moisture in both cultivars under the control conditions is presented in Figure 1. At the R5 stage, i.e., the beginning of the de-podding treatment, the MG2 and MG4 cultivars had a seed moisture percentage of 82% and 79%, respectively (Figure 1B). Both cultivars attained less than 1% of their final seed weight (Figure 1A) at the R5 stage. The MG2 cultivar attained 99% of its final weight in the fourth week after R5, when the seed moisture percentage was 63% (Figure 1A,B). Similarly, the MG4 cultivar attained 98% of its final weight in the fifth week after R5, when the moisture percentage was 57% (Figure 1A,B). Both the cultivars continued to accumulate water until one week before R7 (Figure 1B).

3.3. Seed and Pod Weight

Unit seed and pod weight were significantly affected by de-podding treatments in both experiments (Table 2).
The unit seed weight under control conditions was 135.75 mg seed−1 and 122.23 mg seed−1 in Experiments 1 and 2, respectively. In the de-podding treatments, it ranged between 130 to 174 mg seed−1 in Experiment 1, and from 118 to 181.42 mg seed−1 in Experiment 2 (Figure 2). Unit seed weight increased significantly by 24–28% with de-podding up to three weeks after R5 (Figure 2A) in Experiment 1, and by 33–48% with de-podding up to four weeks after R5 in Experiment 2 (Figure 2B).
The unit pod weight under control treatment was 478.5 mg pod−1 in Experiment 1, and 427.07 mg pod−1 in Experiment 2. It ranged from 492 to 721 mg pod−1 in Experiment 1, and from 441.65 to 659 mg pod−1 in Experiment 2 under the de-podding treatments. Unit pod weight increased significantly by 37–51% with de-podding up to three weeks after R5 in Experiment 1, and by 48–51% with de-podding up to three weeks after R5 in Experiment 2 (Figure 3). The number of seeds per pod was not significantly affected by de-podding treatments in either experiment (Table 2).

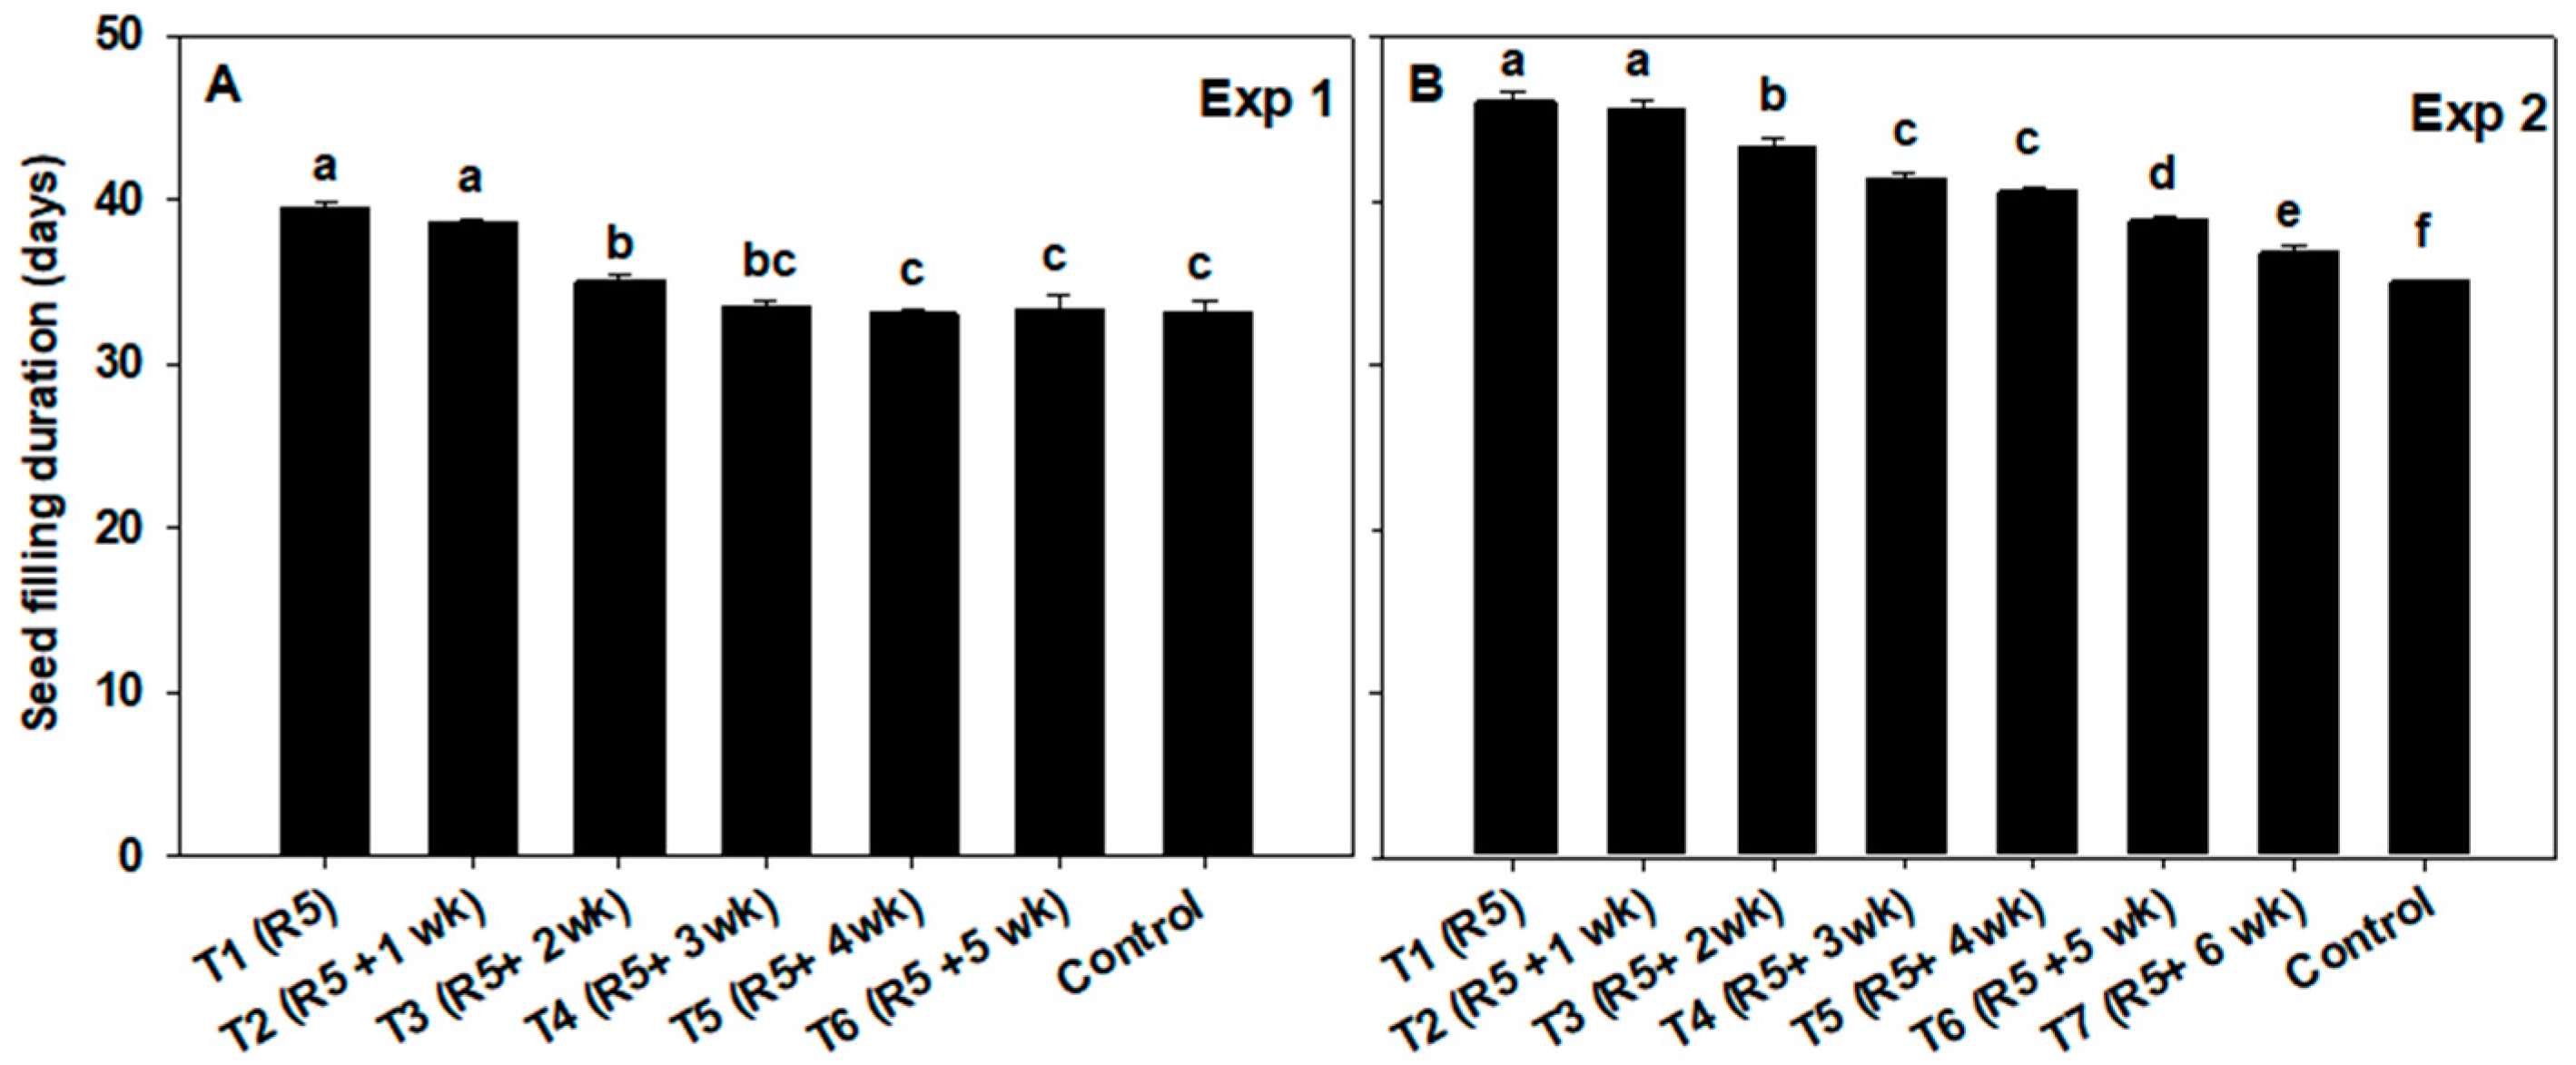
3.4. Seed Filling Duration

Seed filling duration was significantly affected by de-podding treatments in both experiments (Table 2). The seed filling duration under the control treatment was 33 days in Experiment 1 and 55 days in Experiment 2. Under the de-podding treatments, seed filling duration ranged from 33.25 to 39.5 days in Experiment 1, and from 36.75 to 46 days in Experiment 2. Seed filling duration increased significantly with de-podding up to one week after R5 by 6.06–19.69% (2 to 7 days) in Experiment 1, and by 10.71–31.43% (2 to 11 days) in Experiment 2 (Figure 4).

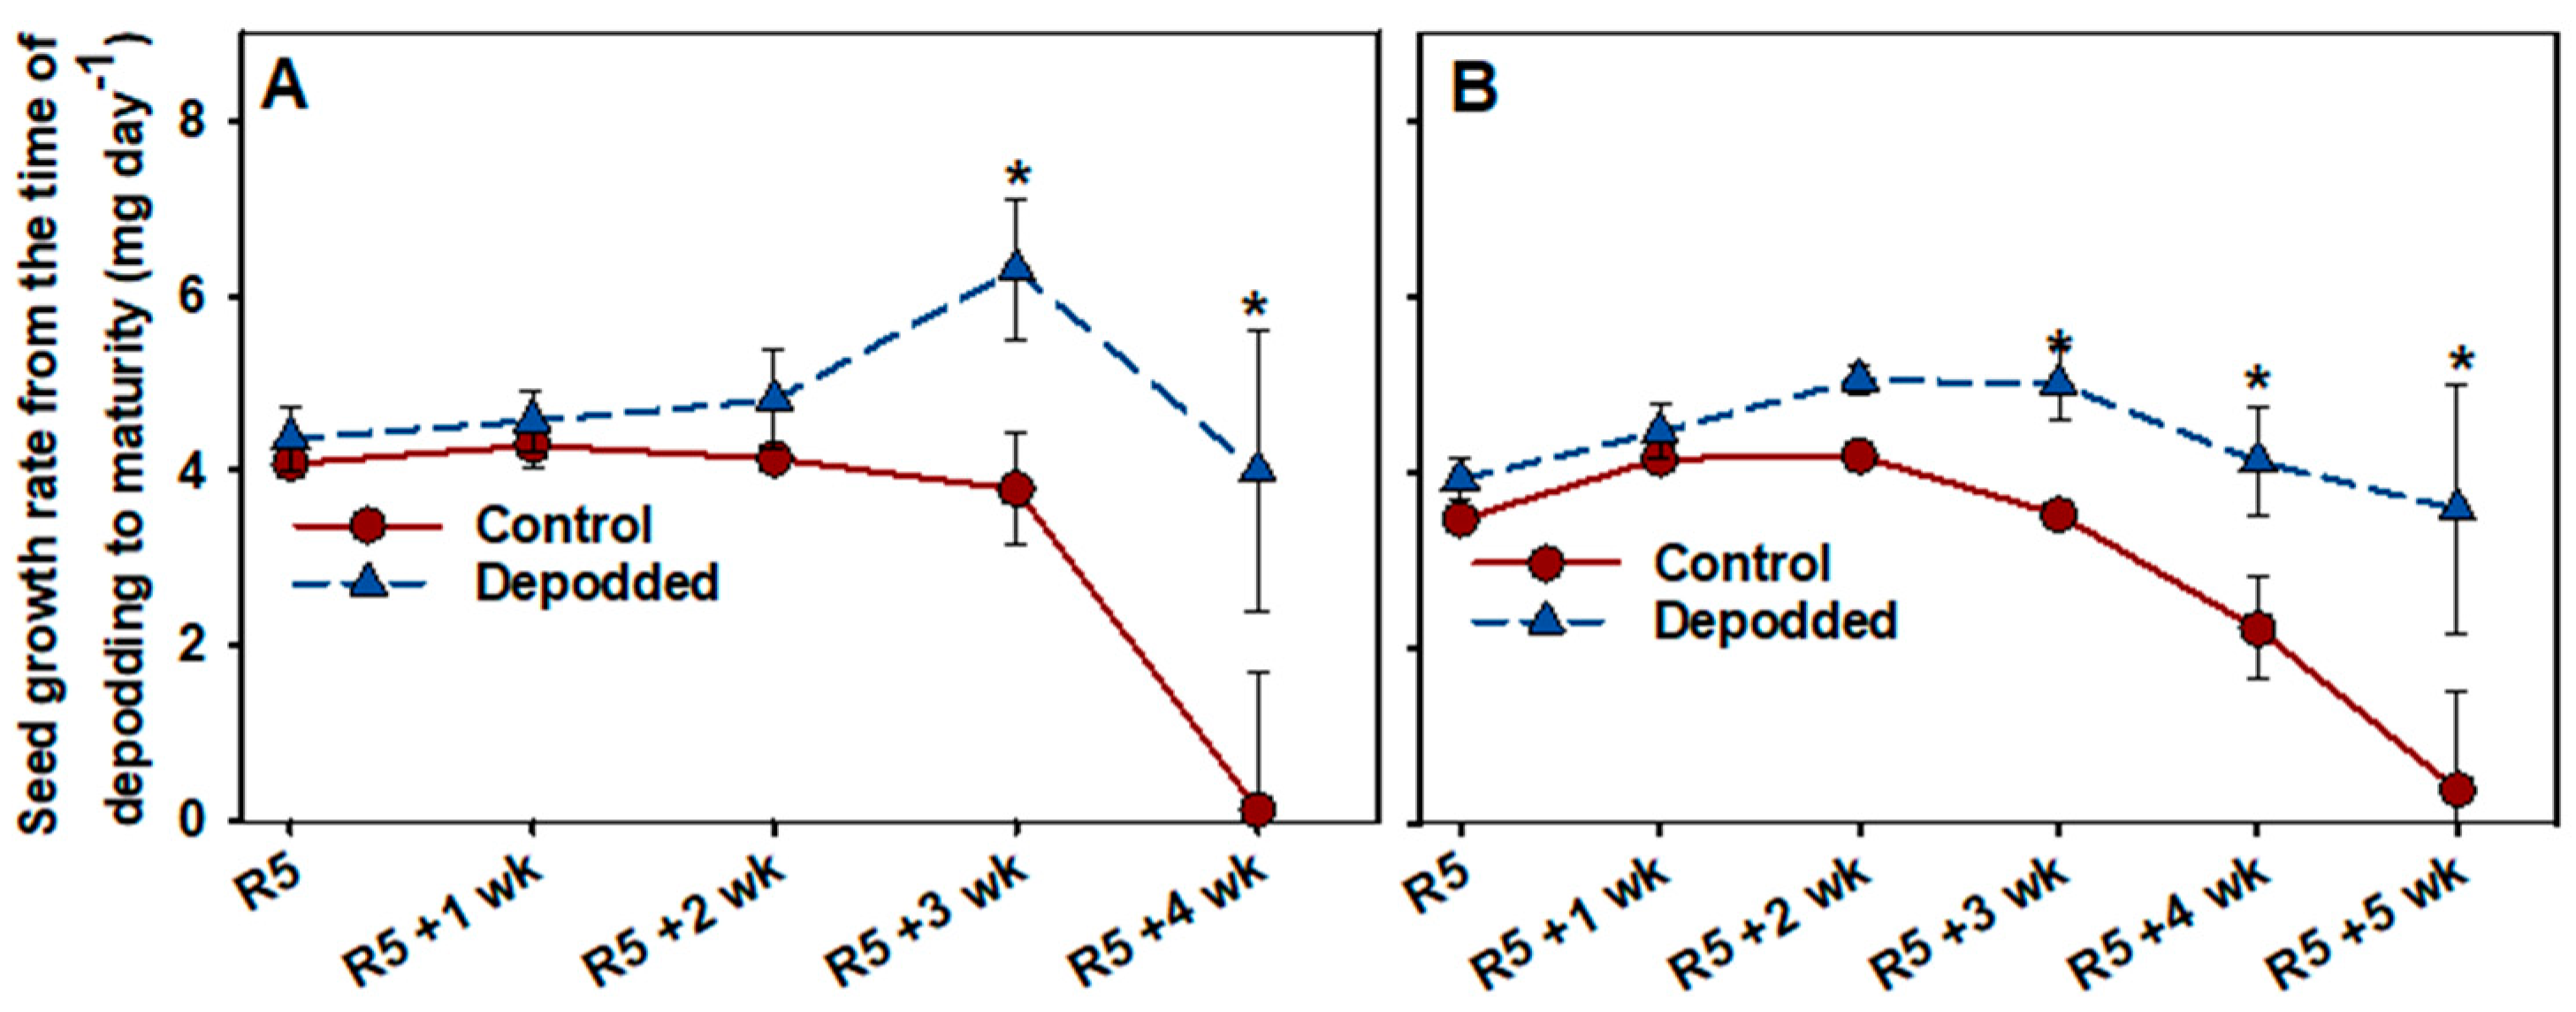
3.5. Seed Growth Rate

Seed growth rate was significantly affected by de-podding treatments in both experiments (Table 2). Seed growth rate started to decline three weeks after R5 under control conditions in both experiments (Figure 5). However, under de-podding treatments, high seed growth rate was maintained for an extended period (a few more weeks) (Figure 5). As a result, seed growth rate from the time of de-podding until maturity was higher under the de-podding treatments three weeks after R5 than in the control during the same period in Experiment 1 (Figure 5A). Similarly, it was higher under de-podding treatments three weeks after R5 than in the control during the same period in Experiment 2 (Figure 5B).

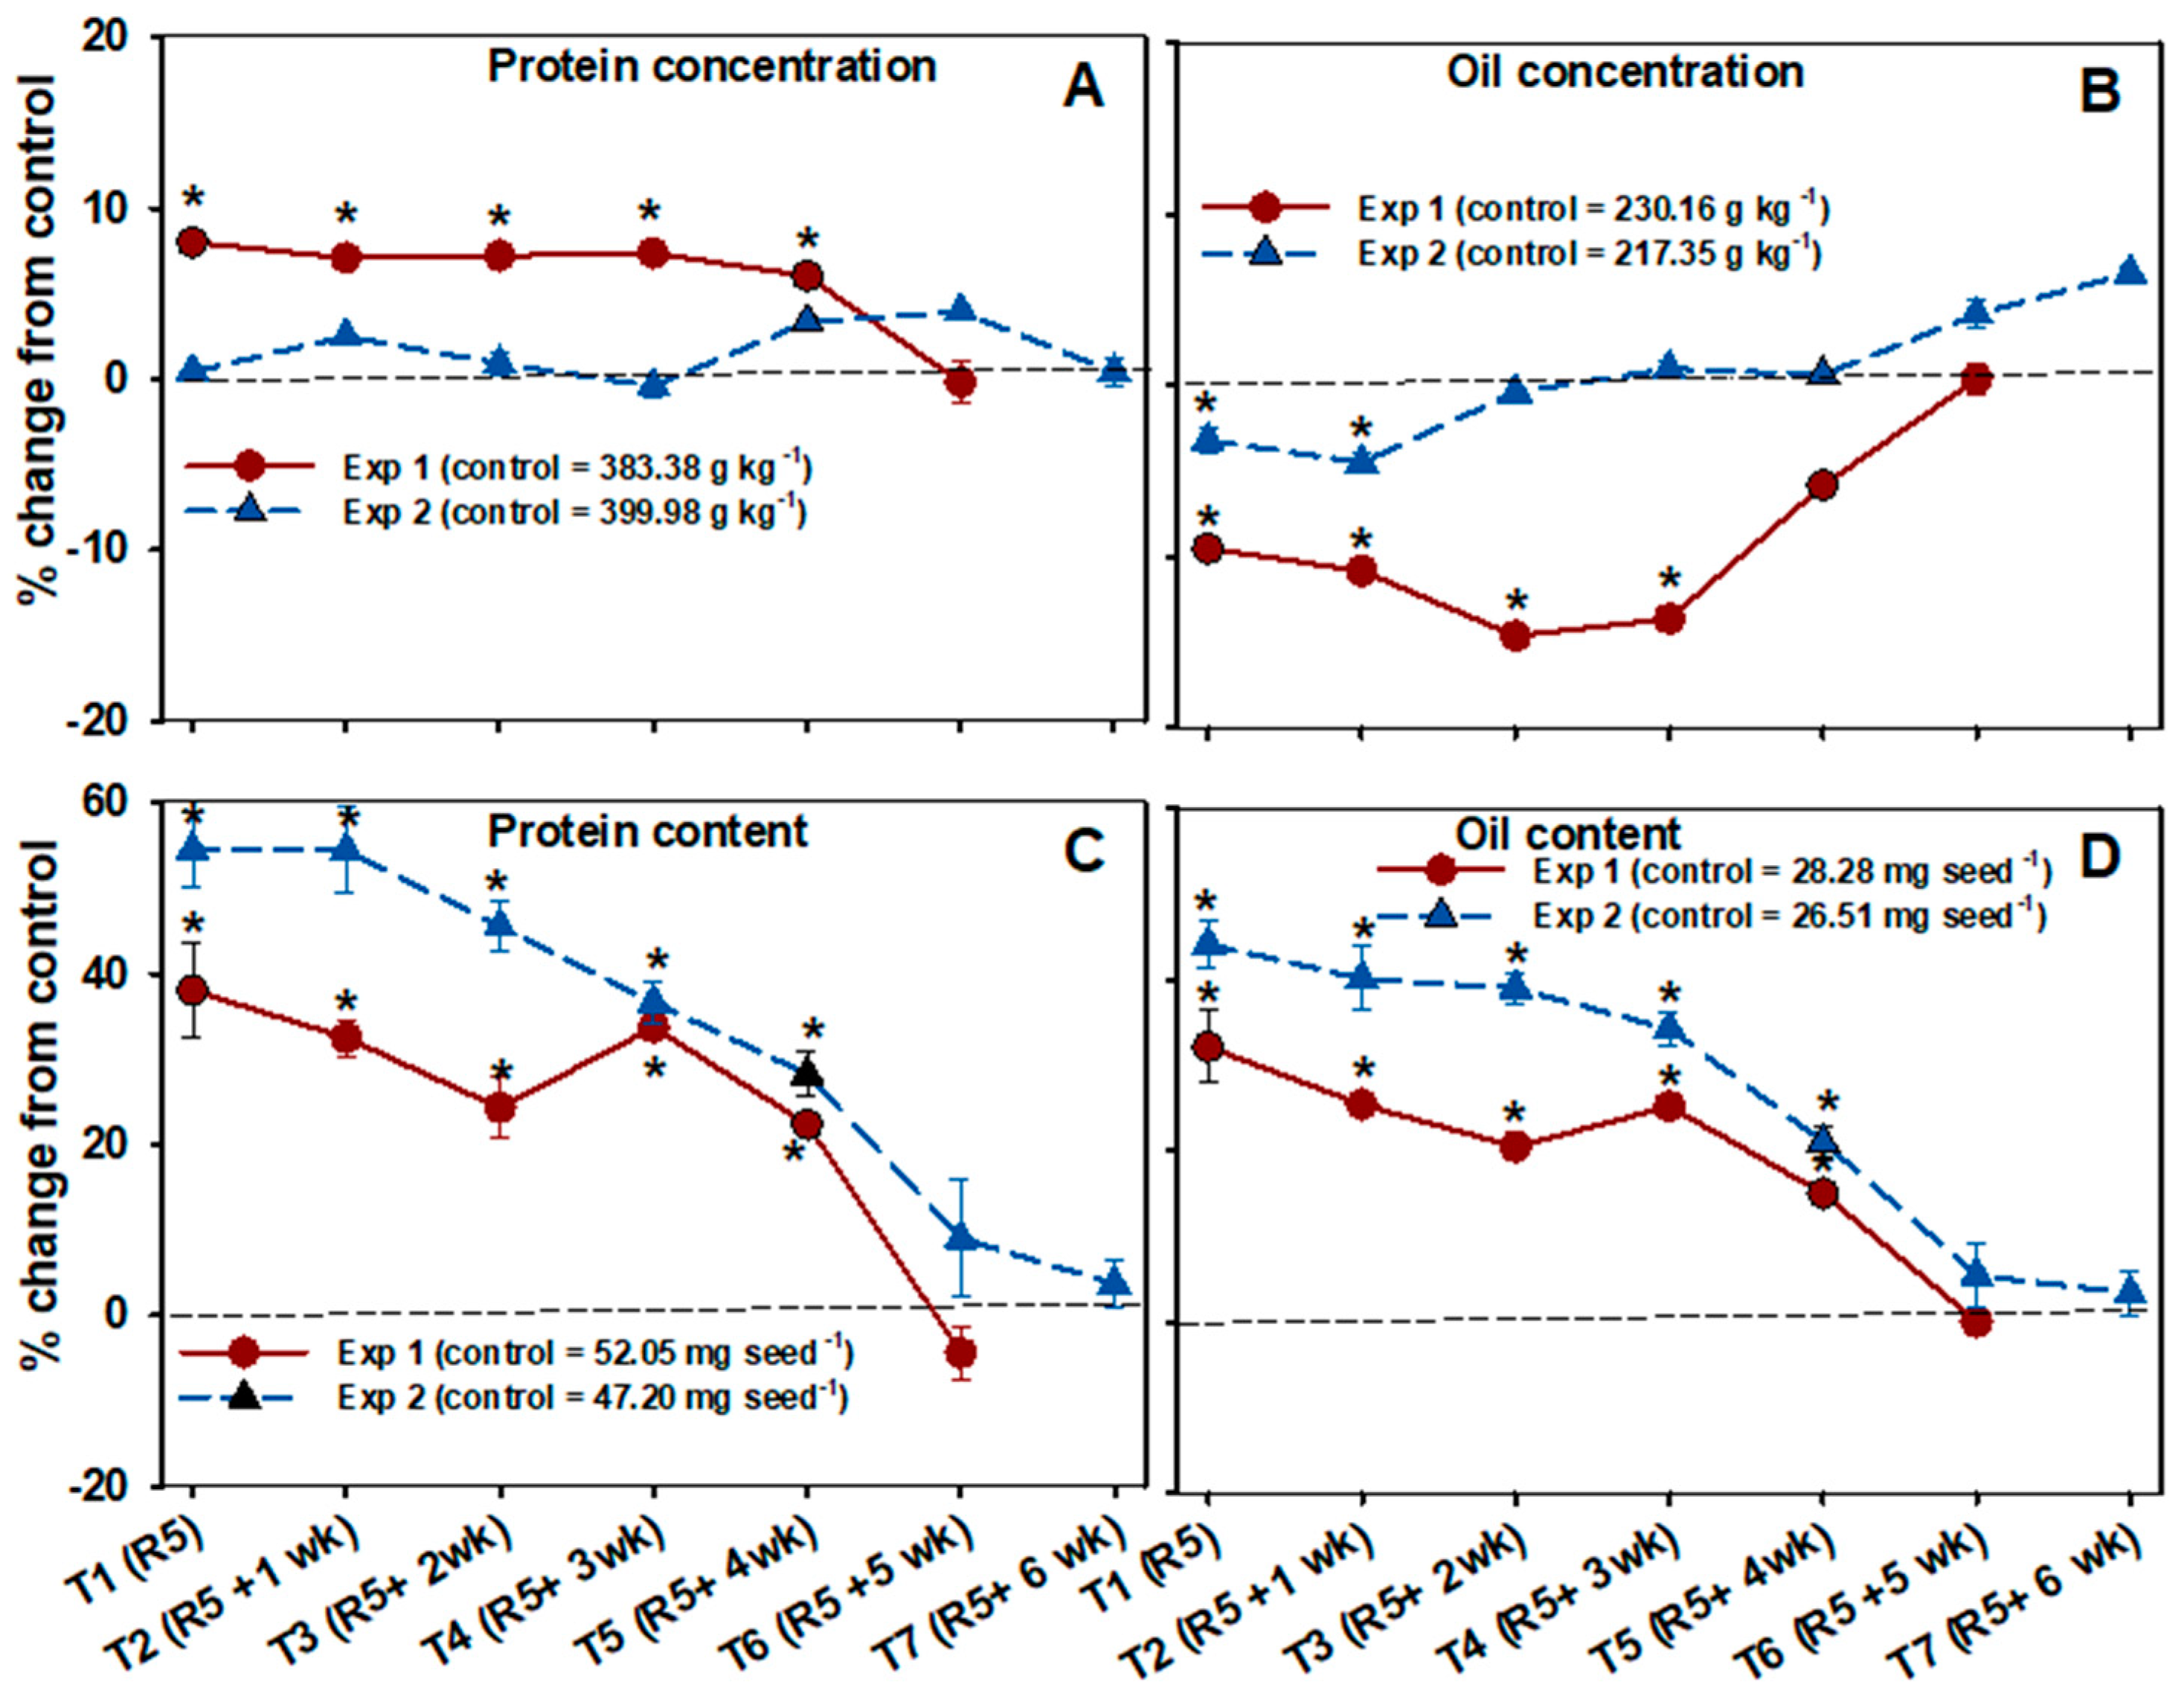
3.6. Seed Composition

Protein concentration was significantly affected by de-podding treatments in Experiment 1, but not in Experiment 2 (Table 2). Protein concentration under the control treatment was 383.38 g kg−1 and 399.98 g kg−1 in Experiments 1 and 2, respectively. In de-podding treatments, it ranged from 382.72 to 414.11 g kg−1 in Experiment 1, and from 401.63 to 401.75 g kg−1 in Experiment 2. In Experiment 1, protein concentration increased significantly by 6–8% with de-podding up to four weeks after R5 (Figure 6A). Oil concentration was significantly affected by de-podding treatments in both experiments (Table 2). Oil concentration ranged from 196.54 to 231.15 g kg−1 across all treatments in Experiment 1. In Experiment 1, oil concentration was 230.16 g kg−1 under the control treatment. In Experiment 2, oil concentration was 217.35 g kg−1 under the control treatment, and from 210.46 to 231.7 g kg−1 in the de-podding treatments. Oil concentration decreased significantly by 10–14% with de-podding up to three weeks after R5 in Experiment 1 and by 3–4% with de-podding up to one week after R5 in Experiment 2 (Figure 6B). However, oil content (in mg of oil per seed) was not affected due to larger seeds in de-podding treatments (Figure 2). Both protein and oil content were significantly higher in de-podding treatments up to four weeks after R5 in both the experiments (Figure 6C,D). The relationship between the % change in seed weight and % change in protein and oil content indicates that seeds accumulated protein at a relatively greater rate compared to that of total seed weight and oil (Figure 7).

4. Discussion

4.1. Source Limitation in Soybean and Its Implication

Several source–sink manipulations in soybean have been conducted to test the effect of increased assimilate supply during pod development and seed growth on unit seed weight. The results of our study are in line with most previous studies, where increased assimilate supply increased unit seed weight [17,18,19,20,21,22,23,24,25,26,27,28,29,30]. The results of our study provide additional evidence supporting the presence of potential source limitations in soybean under normal growing conditions. In contrast, some previous studies [17,19,35] have also reported no significant improvement in soybean seed size even with increased assimilate supply. However, source or sink size manipulation was relatively less in those studies, which suggest that large source–sink manipulation is necessary to minimize any source limitations in soybean. A higher assimilate supply during the entire seed filling period may not be viable, hence previous studies have doubted the effectiveness of this technique in improving soybean productivity under field conditions [21]. However, all of the previous field studies have tested increased assimilate supplies across the entire seed filling stage. None of them have attempted to test increased assimilate supply only during specific periods of the seed filling stage. In this study, we tested increased assimilate supply during different stages of seed filling. We found that increased assimilate supply until three to four weeks after R5 could improve unit seed weight by 24–28%. These results suggest possible source limitations during the early seed filling stage, indicating opportunities to improve seed size and soybean productivity if we can avoid these limitations. Providing supplemental inputs with improved crop cultivation practices or developing soybeans with higher source strength could be some of the ways to close the gap between actual and potential seed size in soybean and optimize soybean productivity.

4.2. Soybean Respond to Increases in Assimilate Supply until Mid-Seed Filling Stage under Field Conditions

Seed size in both the cultivars used in the study responded to an increase in assimilate supply until around the mid-seed filling stage, i.e., three to four weeks after the beginning of the seed filling stage, or three weeks before physiological maturity. The results suggest that maximum seed size in soybean is determined around the mid-seed filling stage, as seed size no longer responded to an increase in assimilate supply after that. There are no previous field studies that can be used for comparison. However, the result from this study is different from a recent study conducted in a greenhouse setting, which found soybean seed size responded to increased assimilate supply until one week before physiological maturity. It is interesting to note that the short season cultivar used in that study matured within five weeks after R5. Hence, the seed size responded to an increase in assimilate supply up to four weeks after R5, similar to the response in this field study.
It is well known that cereal seeds accumulate maximum water content very early in the seed filling stage. A study [2] after compiling data from previous studies reported wheat and maize contained maximum water content when the seed reached 35% of its final dry weight. As a result, maximum seed volume in cereals is determined at a very early stage of seed growth. In contrast, the study reported that soybean seeds accumulated maximum water when they reached 80% of their final dry weight. Another study found that soybean continued to accumulate water until the seed reached 90% of its final weight [36]. The beginning of water content loss indicates the end of seed growth [36]. The ability of soybean to continue to accumulate water allows cell growth and dry matter accumulation until the late seed filling stage [21,37]. As a result, soybean crops have an extended period in the seed filling stage to modify their seed size in response to increased assimilate supply. The results of this study also showed that soybean continued to accumulate water until 1 week before R7 (Figure 4). Hence, it was not surprising to see the effect of increased assimilate supply on unit seed weight until the mid-seed filling stage in this study.
The results of our study are in agreement with findings from previous studies that have indicated that the linear phase of seed filling starts when the seed moisture percentage is around 85% [38,39]. It is well known that soybean seeds, at the time of physiological maturity, contain around 60% moisture [36,39,40,41]. Since moisture percentage at physiological maturity is highly conserved in soybean, it is used as a reliable indicator to assess physiological maturity in soybean. However, we did not record seed moisture percentage at physiological maturity in this study. Seeds under control conditions attained around 97% of their final weight at the time of last de-podding treatment (four to five weeks after the beginning of linear seed filling phase). The seed moisture percentage was 63% and 57% in Experiments 1 and 2, respectively, at the time of the last de-podding treatment (Figure 1B). The results indicate that the seeds might have reached physiological maturity when the seed moisture percentage was around 60%. We did not monitor seed moisture percentage in de-podding treatments in this study. However, a previous study [39] reported no changes in seed moisture percentage at physiological maturity in response to de-podding; thus, there might not have been any difference in seed moisture percentage at the time of physiological maturity between the control and de-podding treatments.

4.3. Increased Seed Filling Duration and Uniform Seed Filling Rate over Extended Period Associated with Higher Seed Weight under Increased Assimilate Supply

Seed filling duration and seed growth rate are two important parameters which cumulatively determine final seed weight. Previous studies have reported higher seed size with increased assimilate supply in soybean related to either increased seed filling duration [25,26], higher seed growth rate [19,35,42], or both [21,24]. We found that increased assimilate supply extended seed filling duration (2 to 7 days or 2 to 11 days, depending on cultivar). Similarly, high seed growth rate was maintained over an extended period under increased assimilate supply when compared to the control treatment (Figure 5).
Seed filling duration depends on the ability of plant to keep up with high carbohydrate and N demands during seed filling. When the photosynthesis rate is not enough to meet the demand, rapid remobilization of carbohydrate and N from the stem, leaves, and root reserve begins, which initiates seed maturation phase and reduces seed filling duration [25,31]. Under the control conditions in this study, the seed filling rate started to decline rapidly two to three weeks after the beginning of the seed filling phase (Figure 4), which indicates that the leaf photosynthesis rate was insufficient to meet carbohydrate demand. Hence, plants might have started to remobilize assimilate reserves and gradually progress towards maturity. On the other hand, the assimilate supply in the de-podding treatments was enough to meet the demand over an extended seed filling period. Hence, seeds continued to accumulate dry matter at similar rates, which delayed the maturation phase and consequently extended the seed filling duration. Previous studies have reported higher sugar in stems and leaves under de-podding treatments, and lower sugar under defoliation treatments, than in control groups [17,19,42]. Similar to reports from a previous study [25], some of the leaves in this study under de-podding treatments were green and photosynthetically active until physiological maturity, which indicated little to no leaf assimilate reserves remobilizations under de-podding treatments.

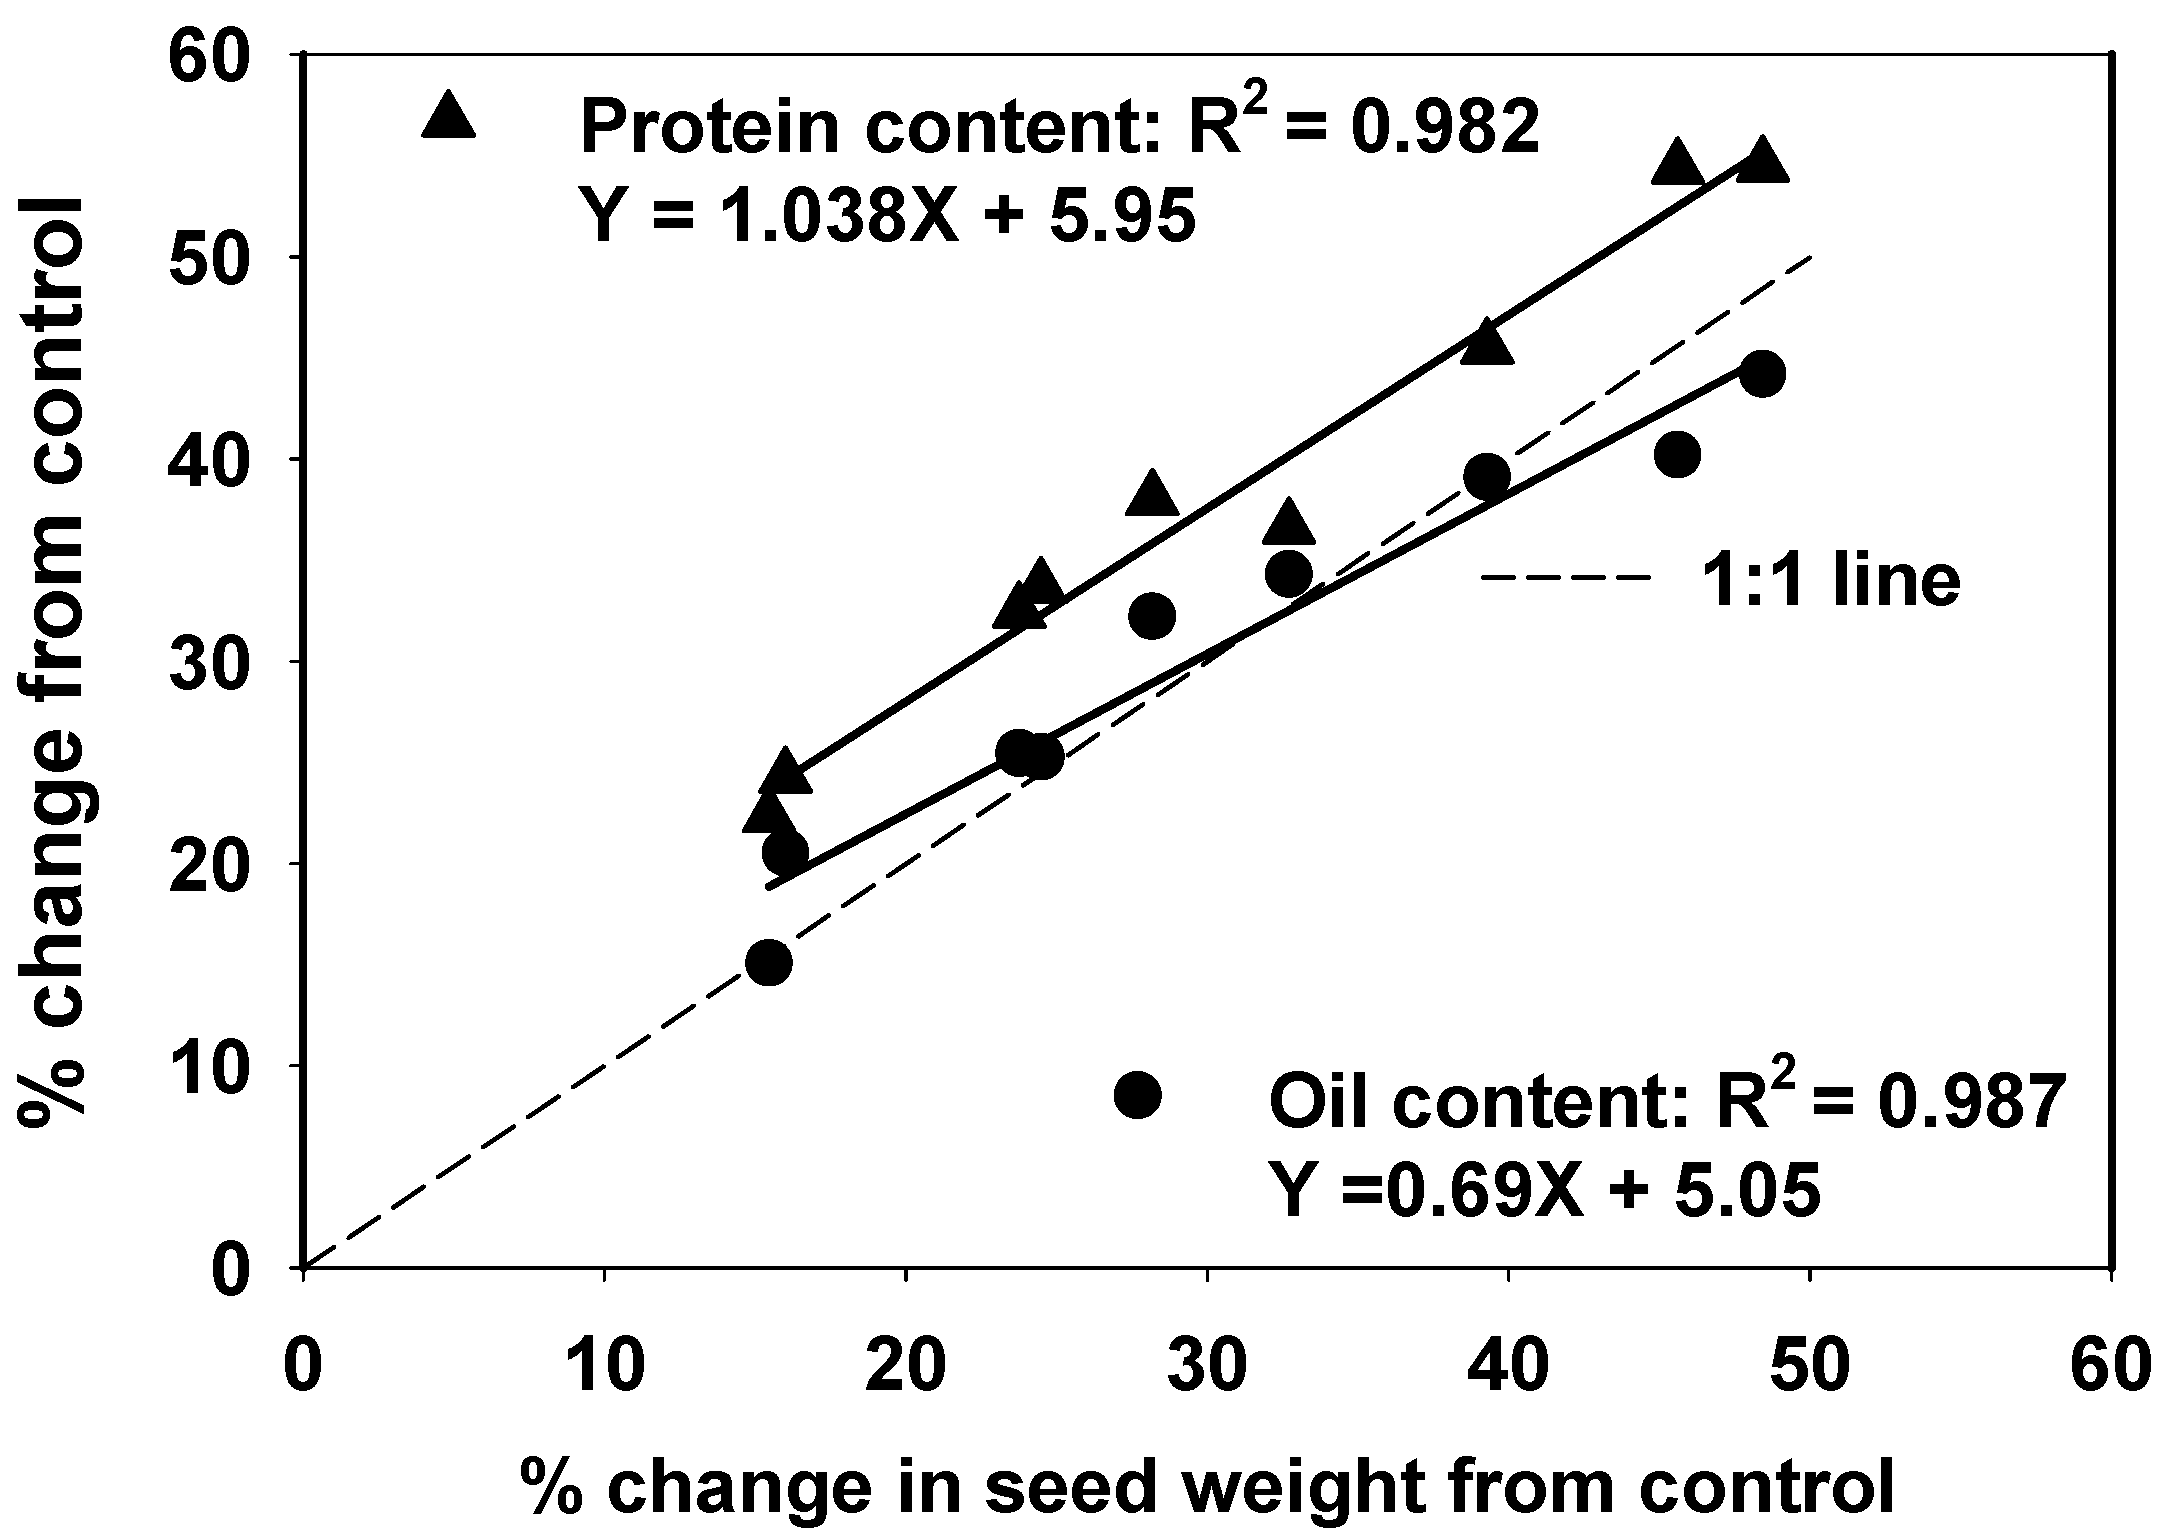
4.4. Protein Respond More Favorably under Increased Assimilate Supply Than Other Seed Constituents

The effects of increased assimilate supply on alterations in seed composition have been documented in several studies. De-podding treatments in this study either increased protein concentration, decreased oil concentration, or had no significant effect. Similar results with de-podding resulting in higher protein concentration [17,20,29,42], lower oil concentration [17,20], or having no effect on protein [18,23] and oil [42] have been reported in several previous studies.
The results of this study showed that protein responded more favorably than carbohydrate and oil components in response to increased assimilate supply (Figure 7). Similar results have been reported in a previous study [43], where proteins accumulated at a higher rate than oils and carbohydrates in response to de-podding. A meta-analysis study [29] reported a 60% average increase in seed protein content with unlimited N supply under in vitro culture, demonstrating that proteins are much more responsive to increased assimilate supply than other components. The seed protein concentration in soybean crops within the United States has decreased gradually over the years. As a result, seed protein concentration in modern soybean cultivars is lower relative to ancestral varieties, which has become a major concern for the U.S. soybean industry [44,45,46,47]. Since a higher assimilate supply during the seed filling period has been found to increase protein at a higher rate, it could also be used as a method to improve seed protein concentration in soybean.

5. Conclusions

We found that a higher assimilate supply until around the mid-seed filling stage increased unit seed size in soybean. The results were consistent in both the cultivars used in the study, indicating maximum seed size in soybean is determined during its mid-seed filling stage. Increased assimilate supply extended the seed filling duration, and a uniform seed filling rate was maintained over a longer period, which resulted in higher seed weight under de-podding treatments. Overall, protein responded more favorably than carbohydrate and oil components in response to increased assimilate supply. The results from the study also suggest potential source limitations during the first half of the seed filling phase in soybean under current normal growing conditions. Hence, providing supplemental inputs with improved crop cultivation practices or developing soybean with higher source strength could help improve soybean productivity by minimizing the gap between actual and potential seed size. Similar studies with other soybean cultivars in different agroclimatic regions would provide more insight into soybean seed growth and composition dynamics under diverse genetic and environmental conditions.

Author Contributions

Conceptualization, S.P. and A.C.; methodology, S.P., D.K., L.P.M., S.K. and A.C.; formal analysis, S.P.; investigation, S.P., D.K., L.P.M., S.K. and A.C.; resources, A.C.; data curation, S.P.; writing—original draft preparation, S.P. and A.C.; writing—review and editing, S.P., D.K., L.P.M., S.K., A.M., S.L., M.G. and A.C.; supervision, A.M., S.L., M.G. and A.C.; project administration, S.P. and A.C.; funding acquisition, A.C. All authors have read and agreed to the published version of the manuscript.

Funding

This research was funded by USDA-NIFA Evans–Allen grant # 7004460 to the Kentucky State University.

Data Availability Statement

Data will be made available upon request.

Acknowledgments

The authors are thankful to the farm crew at the Harold R. Benson Research and Demonstration Farm, Kentucky State University for their help with experimental field management and related farm operations.

Conflicts of Interest

The authors declare no conflicts of interest.

References

  1. Smith, M.R.; Rao, I.M.; Merchant, A. Source-Sink Relationships in Crop Plants and Their Influence on Yield Development and Nutritional Quality. Front Plant Sci 2018, 9, 420465. [Google Scholar] [CrossRef] [PubMed]
  2. Borrás, L.; Slafer, G.A.; Otegui, M.E. Seed dry weight response to source–sink manipulations in wheat, maize and soybean: A quantitative reappraisal. Field Crops Res. 2004, 86, 131–146. [Google Scholar] [CrossRef]
  3. Ordóñez, R.A.; Savin, R.; Cossani, C.M.; Slafer, G.A. Maize Grain Weight Sensitivity to Source–Sink Manipulations under a Wide Range of Field Conditions. Crop Sci. 2018, 58, 2542–2557. [Google Scholar] [CrossRef]
  4. Sheehy, J.E.; Dionora, M.J.A.; Mitchell, P.L. Spikelet numbers, sink size and potential yield in rice. Field Crops Res. 2001, 71, 77–85. [Google Scholar] [CrossRef]
  5. Yoshida, S. Fundamentals of Rice Crop Science; International Rice Research Institute: Manila, Phillipines, 1981. [Google Scholar]
  6. Yang, Z.; van Oosterom, E.J.; Jordan, D.R.; Hammer, G.L. Pre-anthesis ovary development determines genotypic differences in potential kernel weight in sorghum. J. Exp. Bot. 2009, 60, 1399–1408. [Google Scholar] [CrossRef]
  7. Fortescue, J.A.; Turner, D.W. Changes in seed size and oil accumulation in Brassica napus L. by manipulating the source–sink ratio and excluding light from the developing siliques. Aust. J. Agric. Res. 2007, 58, 413–424. [Google Scholar] [CrossRef]
  8. Faraji, A. Seed weight in canola as a function of assimilate supply and source-sink ratio during seed filling period. Int. J. Plant Prod. 2014, 8, 1735. [Google Scholar]
  9. Zhang, H.; Flottmann, S. Source-sink manipulations indicate seed yield in canola is limited by source availability. European J. Agron. 2018, 96, 70–76. [Google Scholar] [CrossRef]
  10. Howlader, M.H.K.; Bain, S.K.; Hasan, M.M.; Khan, A.; Biswas, S. Source-sink manipulation on yield contributing characters and yield of Sesame (Sesamum indicum L.). Progress. Agric. 2018, 29, 1–9. [Google Scholar] [CrossRef]
  11. Iglesias, F.M.; Miralles, D.J. Changes in seed weight in response to different sources: Sink ratio in oilseed rape. J. Agric. Res. Innov. Technol. 2014, 4, 44–52. [Google Scholar] [CrossRef]
  12. Alkio, M.; Schubert, A.; Diepenbrock, W.; Grimm, E. Effect of source-sink ratio on seed set and filling in sunflower (Helianthus annuus L.). Plant Cell Env. 2003, 26, 1609–1619. [Google Scholar] [CrossRef]
  13. Sandana, P.; Calderini, D.F. Comparative assessment of the critical period for grain yield determination of narrow-leafed lupin and pea. Eur. J. Agron. 2012, 40, 94–101. [Google Scholar] [CrossRef]
  14. Binnie, R.C.; Clifford, P.E. Effects of Some Defoliation and Decapitation Treatments on the Productivity of French Beans. Ann. Bot. 1980, 46, 811–813. [Google Scholar] [CrossRef]
  15. Clifford, P.E. Source Limitation of Sink Yield in Mung Beans. Ann. Bot. 1979, 43, 397–399. [Google Scholar] [CrossRef]
  16. Chapman, G.P.; Guest, H.L.; Peat, W.E. Top-removal in single stem plants of Vicia faba L. Z. Für Pflanzenphysiol. 1978, 89, 119–127. [Google Scholar] [CrossRef]
  17. McAlister, D.F.; Krober, O.A. Response of Soybeans to Leaf and Pod Removal. Agron. J. 1958, 50, 674–677. [Google Scholar] [CrossRef]
  18. Lawn, R.J.; Brun, W.A. Symbiotic Nitrogen Fixation in Soybeans. I. Effect of Photosynthetic Source-Sink Manipulations. Crop Sci. 1974, 14, 11–16. [Google Scholar] [CrossRef]
  19. Egli, D.B.; Leggett, J.E. Rate of Dry Matter Accumulation in Soybean Seeds with Varying Source-Sink Ratios. Agron. J. 1976, 68, 371–374. [Google Scholar] [CrossRef]
  20. Openshaw, S.J.; Hadley, H.H.; Brokoski, C.E. Effects of POD Removal Upon Seeds of Nodulating and Nonnodulating Soybean Line. Crop Sci. 1979, 19, 289. [Google Scholar] [CrossRef]
  21. Egli, D.B.; Guffy, R.D.; Meckel, L.W.; Leggett, J.E. The Effect of Source-Sink Alterations on Soybean Seed Growth. Ann. Bot. 1985, 55, 395–402. [Google Scholar] [CrossRef]
  22. Egli, D.B.; Ramseur, E.L.; Zhen-wen, Y.; Sullivan, C.H. Source-Sink Alterations Affect the Number of Cells in Soybean Cotyledons. Crop Sci. 1989, 29, 732. [Google Scholar] [CrossRef]
  23. Schonbeck, M.W.; Hsu, F.C.; Carlsen, T.M. Effect of Pod Number on Dry Matter and Nitrogen Accumulation and Distribution in Soybean. Crop Sci 1986, 26, 783. [Google Scholar] [CrossRef]
  24. Board, J.; Harville, B. Late-Planted Soybean Yield Response to Reproductive Source/Sink Stress. Crop Sci. 1998, 38, 763. [Google Scholar] [CrossRef]
  25. Munier-Jolain, N.G.; Munier-Jolain, N.M.; Roche, R.; Ney, B.; Duthion, C. Seed growth rate in grain legumes I. Effect of photoassimilate availability on seed growth rate. J. Exp. Bot. 1998, 49, 1963–1969. [Google Scholar] [CrossRef]
  26. Egli, D.B.; Bruening, W.P. Source-sink Relationships, Seed Sucrose Levels and Seed Growth Rates in Soybean. Ann. Bot. 2001, 88, 235–242. [Google Scholar] [CrossRef]
  27. Liu, X.; Herbert, S.J.; Baath, K.; Hashemi, A.M. Soybean (Glycine max) seed growth characteristics in response to light enrichment and shading. Plant Soil Environ. 2006, 52, 176. [Google Scholar] [CrossRef]
  28. Proulx, R.; Naeve, S. Pod Removal, Shade, and Defoliation Effects on Soybean Yield, Protein, and Oil. Agron. J. 2009, 101, 971. [Google Scholar] [CrossRef]
  29. Rotundo, J.L.; Borrás, L.; Westgate, M.E.; Orf, J.H. Relationship between assimilate supply per seed during seed filling and soybean seed composition. Field Crops Res. 2009, 112, 90–96. [Google Scholar] [CrossRef]
  30. Pereira Flores, M.; Justino, F.; Ruiz Vera, U.; Stordal, F.; Melo, A.; De, R.; Rodrigues, Á. Response of soybean yield components and allocation of dry matter to increased temperature and CO2 concentration. Aust. J. Crop Sci. 2016, 10, 808–818. [Google Scholar]
  31. Da Silva, A.J.; Magalhães Filho, J.R.; Sales, C.R.G.; de Pires, R.C.M.; Machado, E.C. Source-sink relationships in two soybean cultivars with indeterminate growth under water deficit. Bragantia 2018, 77, 23. [Google Scholar] [CrossRef]
  32. Fischer, R.A.; Laing, D.R. Yield potential in a dwarf spring wheat and response to crop thinning. J. Agric. Sci. 1976, 87, 113–122. [Google Scholar] [CrossRef]
  33. Prine, G.M. A Critical Period for Ear Development in Maize. Crop Sci. 1971, 11, 782. [Google Scholar] [CrossRef]
  34. Chiluwal, A.; Kawashima, T.; Salmeron, M. Soybean seed weight responds to increases in assimilate supply during late seed-fill phase. J. Crop Improv. 2022, 36, 222–238. [Google Scholar] [CrossRef]
  35. Liu, B.; Liu, X.-B.; Wang, C.; Jin, J.; Herbert, S.J.; Hashemi, M. Responses of soybean yield and yield components to light enrichment and planting density. Int. J. Plant Prod. 2010, 4, 1735–8043. [Google Scholar]
  36. Swank, J.C.; Egli, D.B.; Pfeiffer, T.W. Seed Growth Characteristics of Soybean Genotypes Differing in Duration of Seed Fill. Crop Sci. 1987, 27, 85. [Google Scholar] [CrossRef]
  37. Egli, D.B. Seed water relations and the regulation of the duration of seed growth in soybean. J. Exp. Bot. 1990, 41, 243–248. [Google Scholar] [CrossRef]
  38. Munier-Jolain, N.G.; Ney, B.; Duthion, C. Sequential Development of Flowers and Seeds on the Mainstem of an Indeterminate Soybean. Crop Sci. 1993, 33, 768. [Google Scholar] [CrossRef]
  39. Poeta, F.; Rotundo, J.; Borrás, L.; Westgate, M. Seed Water Concentration and Accumulation of Protein and Oil in Soybean Seeds. Crop Sci. 2014, 54, 2752. [Google Scholar] [CrossRef]
  40. Fraser, J.; Egli, D.B.; Leggett, J.E. Pod and Seed Development in Soybean Cultivars with Differences in Seed Size. Agron. J. 1982, 74, 81–85. [Google Scholar] [CrossRef]
  41. Tekrony, D.M.; Egli, D.B.; Balles, J.; Pfeiffer, T.; Fellows, R.J. Physiological Maturity in Soybean. Agron. J. 1979, 71, 771–775. [Google Scholar] [CrossRef]
  42. Andrade, F.H.; Ferreiro, M.A. Reproductive growth of maize, sunflower and soybean at different source levels during grain filling. Field Crops Res. 1996, 48, 155–165. [Google Scholar] [CrossRef]
  43. Rotundo, J.L.; Borrás, L.; Westgate, M.E. Linking assimilate supply and seed developmental processes that determine soybean seed composition. Eur. J. Agron. 2011, 35, 184–191. [Google Scholar] [CrossRef]
  44. Chiluwal, A.; Haramoto, E.R.; Hildebrand, D.; Naeve, S.; Poffenbarger, H.; Purcell, L.C.; Salmeron, M. Late-Season Nitrogen Applications Increase Soybean Yield and Seed Protein Concentration. Front Plant Sci. 2021, 12, 715940. [Google Scholar] [CrossRef] [PubMed]
  45. Specht, J.E.; Hume, D.J.; Kumudini, S. V Soybean Yield Potential—A Genetic and Physiological Perspective. Crop Sci. 1999, 39, 1560–1570. [Google Scholar] [CrossRef]
  46. Mahmoud, A.A.; Natarajan, S.S.; Bennett, J.O.; Mawhinney, T.P.; Wiebold, W.J.; Krishnan, H.B. Effect of Six Decades of Selective Breeding on Soybean Protein Composition and Quality: A Biochemical and Molecular Analysis. J. Agric. Food Chem. 2006, 54, 3916–3922. [Google Scholar] [CrossRef]
  47. Rowntree, S.C.; Suhre, J.J.; Weidenbenner, N.H.; Wilson, E.W.; Davis, V.M.; Naeve, S.L.; Casteel, S.N.; Diers, B.W.; Esker, P.D.; Specht, J.E.; et al. Genetic Gain × Management Interactions in Soybean: I. Planting Date. Crop Sci. 2013, 53, 1128–1138. [Google Scholar] [CrossRef]
Figure 1. Temporal seed weight and moisture dynamics under control conditions. (A) shows the seed weight gain over the seed filling stage and (B) shows the changes in seed moisture percentage and seed water content over the seed filling stage.
Agronomy 14 00763 g001
Figure 2. Effect of increased assimilate supply during different seed filling periods on unit seed weight in Experiment 1 (A) and Experiment 2 (B). Bars with different letters within a figure indicate a significant difference at 0.05 probability level. Error bars represent standard error of the mean.
Agronomy 14 00763 g002
Figure 3. Effect of increased assimilate supply during different seed filling periods on unit pod weight in Experiment 1 (A) and Experiment 2 (B). Bars with different letters within a figure indicate a significant difference at 0.05 probability level. Error bars represent standard error of the mean.
Agronomy 14 00763 g003
Figure 4. Effect of increased assimilate supply during different seed filling periods on seed filling duration in Experiment 1 (A) and Experiment 2 (B). Bars with different letters within a figure indicate a significant difference at 0.05 probability level. Error bars represent standard error of the mean.
Agronomy 14 00763 g004
Figure 5. Seed growth rate (mg day−1) from the time of de-podding to maturity between de-podding and control treatments in Experiment 1 (A) and Experiment 2 (B). * Represents significantly different seed growth rate values versus the respective treatments at 0.05 probability level.
Agronomy 14 00763 g005
Figure 6. Effect of increased assimilate supply during different seed filling periods on protein concentration (A), oil concentration (B), protein content (C), and oil content (D). * Represents actual protein and oil values in the de-podding treatment that were significantly different from the control at 0.05 probability level.
Agronomy 14 00763 g006
Figure 7. Relationship between percentage change in seed weight with percentage changes in protein and oil content.
Agronomy 14 00763 g007
Table 1. Average daily temperature and total precipitation in each experiment during different crop development stages. Data Source: Kentucky Mesonet- https://www.kymesonet.org (accessed on 17 March 2024).
Average Daily Temperature (°C)Total Precipitation (mm)
* VE to R1R1 to R5R5 to R7VE to R1R1 to R5R5 to R7
Experiment 119.123.323.7180.3172.565.8
Experiment 221.322.521.8221.5288.558.2
* VE—emergence; R1—beginning of flowering; R5—beginning of seed filling phase; R7—physiological maturity.
Table 2. Summary of analysis of variance for the recorded traits in both experiments.
Traitsp-Value
Experiment 1Experiment 2
Unit seed weight (mg seed−1)0.0031<0.0001
Unit pod weight (mg pod−1)0.0002<0.0001
Seeds per podNS *NS
Seed filling duration (days)<0.0001<0.0001
Seed filling rate (mg day−1)0.00010850.04278
Protein concentration (g kg−1)0.0165NS
Oil concentration (g kg−1)0.00220.02003
* NS—non-significant (p-Value > 0.05)
Disclaimer/Publisher’s Note: The statements, opinions and data contained in all publications are solely those of the individual author(s) and contributor(s) and not of MDPI and/or the editor(s). MDPI and/or the editor(s) disclaim responsibility for any injury to people or property resulting from any ideas, methods, instructions or products referred to in the content.

