Article

Research on Soil Pesticide Residue Detection Using an Electronic Nose Based on Hybrid Models

1
College of Horticulture, Jilin Agricultural University, Changchun 130118, China
2
College of Medical Information, Changchun University of Chinese Medicine, Changchun 130118, China
3
School of Mechanical and Aerospace Engineering, Jilin University, Changchun 130022, China
*
Author to whom correspondence should be addressed.
Agronomy 2024, 14(4), 766; https://doi.org/10.3390/agronomy14040766
Submission received: 11 March 2024 / Revised: 3 April 2024 / Accepted: 5 April 2024 / Published: 8 April 2024
(This article belongs to the Section Precision and Digital Agriculture)

Abstract

:
At present, the electronic nose has became a new technology for the rapid detection of pesticides. However, the technique may misidentify them for samples that have not been involved in training. Therefore, a hybrid model based on unsupervised and supervised learning was proposed for the first time in this paper. The model divided the detection process of soil pesticide residues into two steps: (1) an unsupervised machine learning method was used to identify whether the soil was contaminated with pesticides; (2) when the soil was contaminated with pesticides, a supervised classifier was further used to predict the types of pesticides in the soil. The experimental results showed that the model had a recognition accuracy of 99.3% and 99.27% for whether the soil was contaminated with pesticides and the pesticide type of the contaminated soil, respectively, with a detection time of 0.03 s. The results revealed that the proposed hybrid model can quickly and comprehensively reflect the soil information’s status.

1. Introduction

Pesticides play an important role in modern agricultural production, as they are the main way to reduce agricultural product losses, solve the problems of plant diseases and pests, and increase yields [1]. However, only about 30% of pesticides can effectively exert their effects [2,3]. Pesticides that are not effectively utilized enter the environment. Although they undergo varying degrees of degradation or migration under natural conditions, soils that have been contaminated for a long time face problems such as acidification, nutrient loss, a decrease in porosity [4,5]. Research has shown that the pesticide content in plant roots, stems, and leaves increases with the increase of a pesticide residue’s concentration in the soil [6,7]. Pesticides in these plants ultimately cause harm to human beings through the material cycle of the ecosystem [8]. Pesticide residues in soil can be released into the atmosphere as volatile organic compounds (VOCs). This is mainly because pesticides are volatile by nature, allowing them to transition directly from a liquid or solid to a gaseous form. Under the influence of sunlight, they decompose into smaller molecules or VOCs. Moreover, soil microorganisms can convert pesticides into VOCs through biodegradation [9]. The early detection of soil pollution is of great significance for soil protection and human safety. And the remediation methods used for different types of pesticide pollution vary, so it is crucial to accurately identify the types of residual pesticides in the soil [10,11,12].
At present, chromatography, mass spectrometry, and spectroscopy are the most mature methods for detecting pesticide residues, with advantages such as their high sensitivity, wide detection range, and strong reliability [13]. However, these methods rely on large instruments, which are expensive and costly, making it difficult to conduct on-site testing. In addition, sample preprocessing is cumbersome and time-consuming, requiring professional technical personnel to perform it. These defects make it difficult for them to achieve fast and real-time detection and limit their widespread use. The chemicals used for pretreatment before testing may also cause environmental pollution [14]. Therefore, it is necessary to continue to develop new, fast, accurate, easy-to-operate, and low-cost pesticide residue detection methods to meet practical needs and minimize negative impacts on the environment.
An electronic nose is a device that simulates mammalian olfactory organs’ ability to identify odors [15]. Compared with traditional methods, electronic noses have the advantages of having a small size, no sample pretreatment, a fast detection speed, being non-destructive, and having environmental protection. Therefore, they are widely used in various fields such as the food industry [16], chemical industry [17] and medical field [18]. In recent years, electronic noses have also received increasing attention in the field of soil information detection. For example, in order to solve problems such as time-consuming, laborious, and complex operations in traditional soil nutrient testing, Dorji et al. [19] developed an electronic nose that detects volatile organic compounds to monitor the soil’s status, successfully classifying soils with different organic matter contents using PCA. Fabrizio et al. [20] used electronic nose technology to measure the volatile organic compounds released by soil microorganisms and calculate their activity. Bieganowski et al. [21] measured the volatile organic compounds released by soil microorganisms and calculated their activity using electronic nose technology. Andrzej et al. [22] successfully differentiated the gasoline and diesel pollution levels in soil using electronic nose technology, PCA, and an ANN. At present, studies have applied electronic nose systems for the detection of pesticide residues in soil. Kong et al. [23], inspired by bionics, proposed a biomimetic strategy for detecting unknown pesticide residues in soil using electronic noses. These findings indicate the broad application potential of electronic noses in soil pollution monitoring, including pesticide residue detection [24].
Machine learning plays a crucial role in soil information and pollution recognition, which use electronic nose technology. The choice of machine learning methods directly impacts recognition accuracy. Unlike other fields, soil pesticide residue detection requires the careful selection of machine learning techniques. Firstly, the selected method should be able to detect pesticide contamination in soil, regardless of whether the pesticide has been previously detected. This step is essential for subsequent actions. Secondly, the precise identification of pesticide types is necessary for effective soil management and remediation. However, due to the limited availability of training samples covering all pesticide types, achieving accurate identification through supervised learning using an electronic nose is challenging [25,26,27]. It is difficult to obtain training samples covering all pesticide types. This can easily lead to contaminated samples being misjudged as healthy samples and missing the best opportunity for soil management. Currently, most research has overlooked the distinction between a contaminated soil that did not participate in training and a healthy soil.
We proposed a model which combines supervised and unsupervised learning in this paper. A hybrid model based on a one-class SVM and supervised learning was used to realize the reliable identification of soil health and the accurate identification of pesticide types. The proposed hybrid model adopts a distributed framework, which includes two steps: pollution detection and pesticide identification. An unsupervised learning system called a one-class SVM is used to model healthy soil in the first step. It can realize the real-time detection of soil pollution and obtain healthy soil sample information. Even if there are pesticides that have never appeared in the soil, the pollution can be accurately identified. In the second step, a supervised learning classifier is used for accurately identify the types of pesticide residue in the soil. This model addressed the issue in current research where contaminated soil that did not participate in training may be incorrectly identified as healthy soil. In addition, the effects of different feature extraction methods and supervised learning classifiers on the recognition of soil pesticide residues are studied in this paper.

2. Experimental Materials and Methods

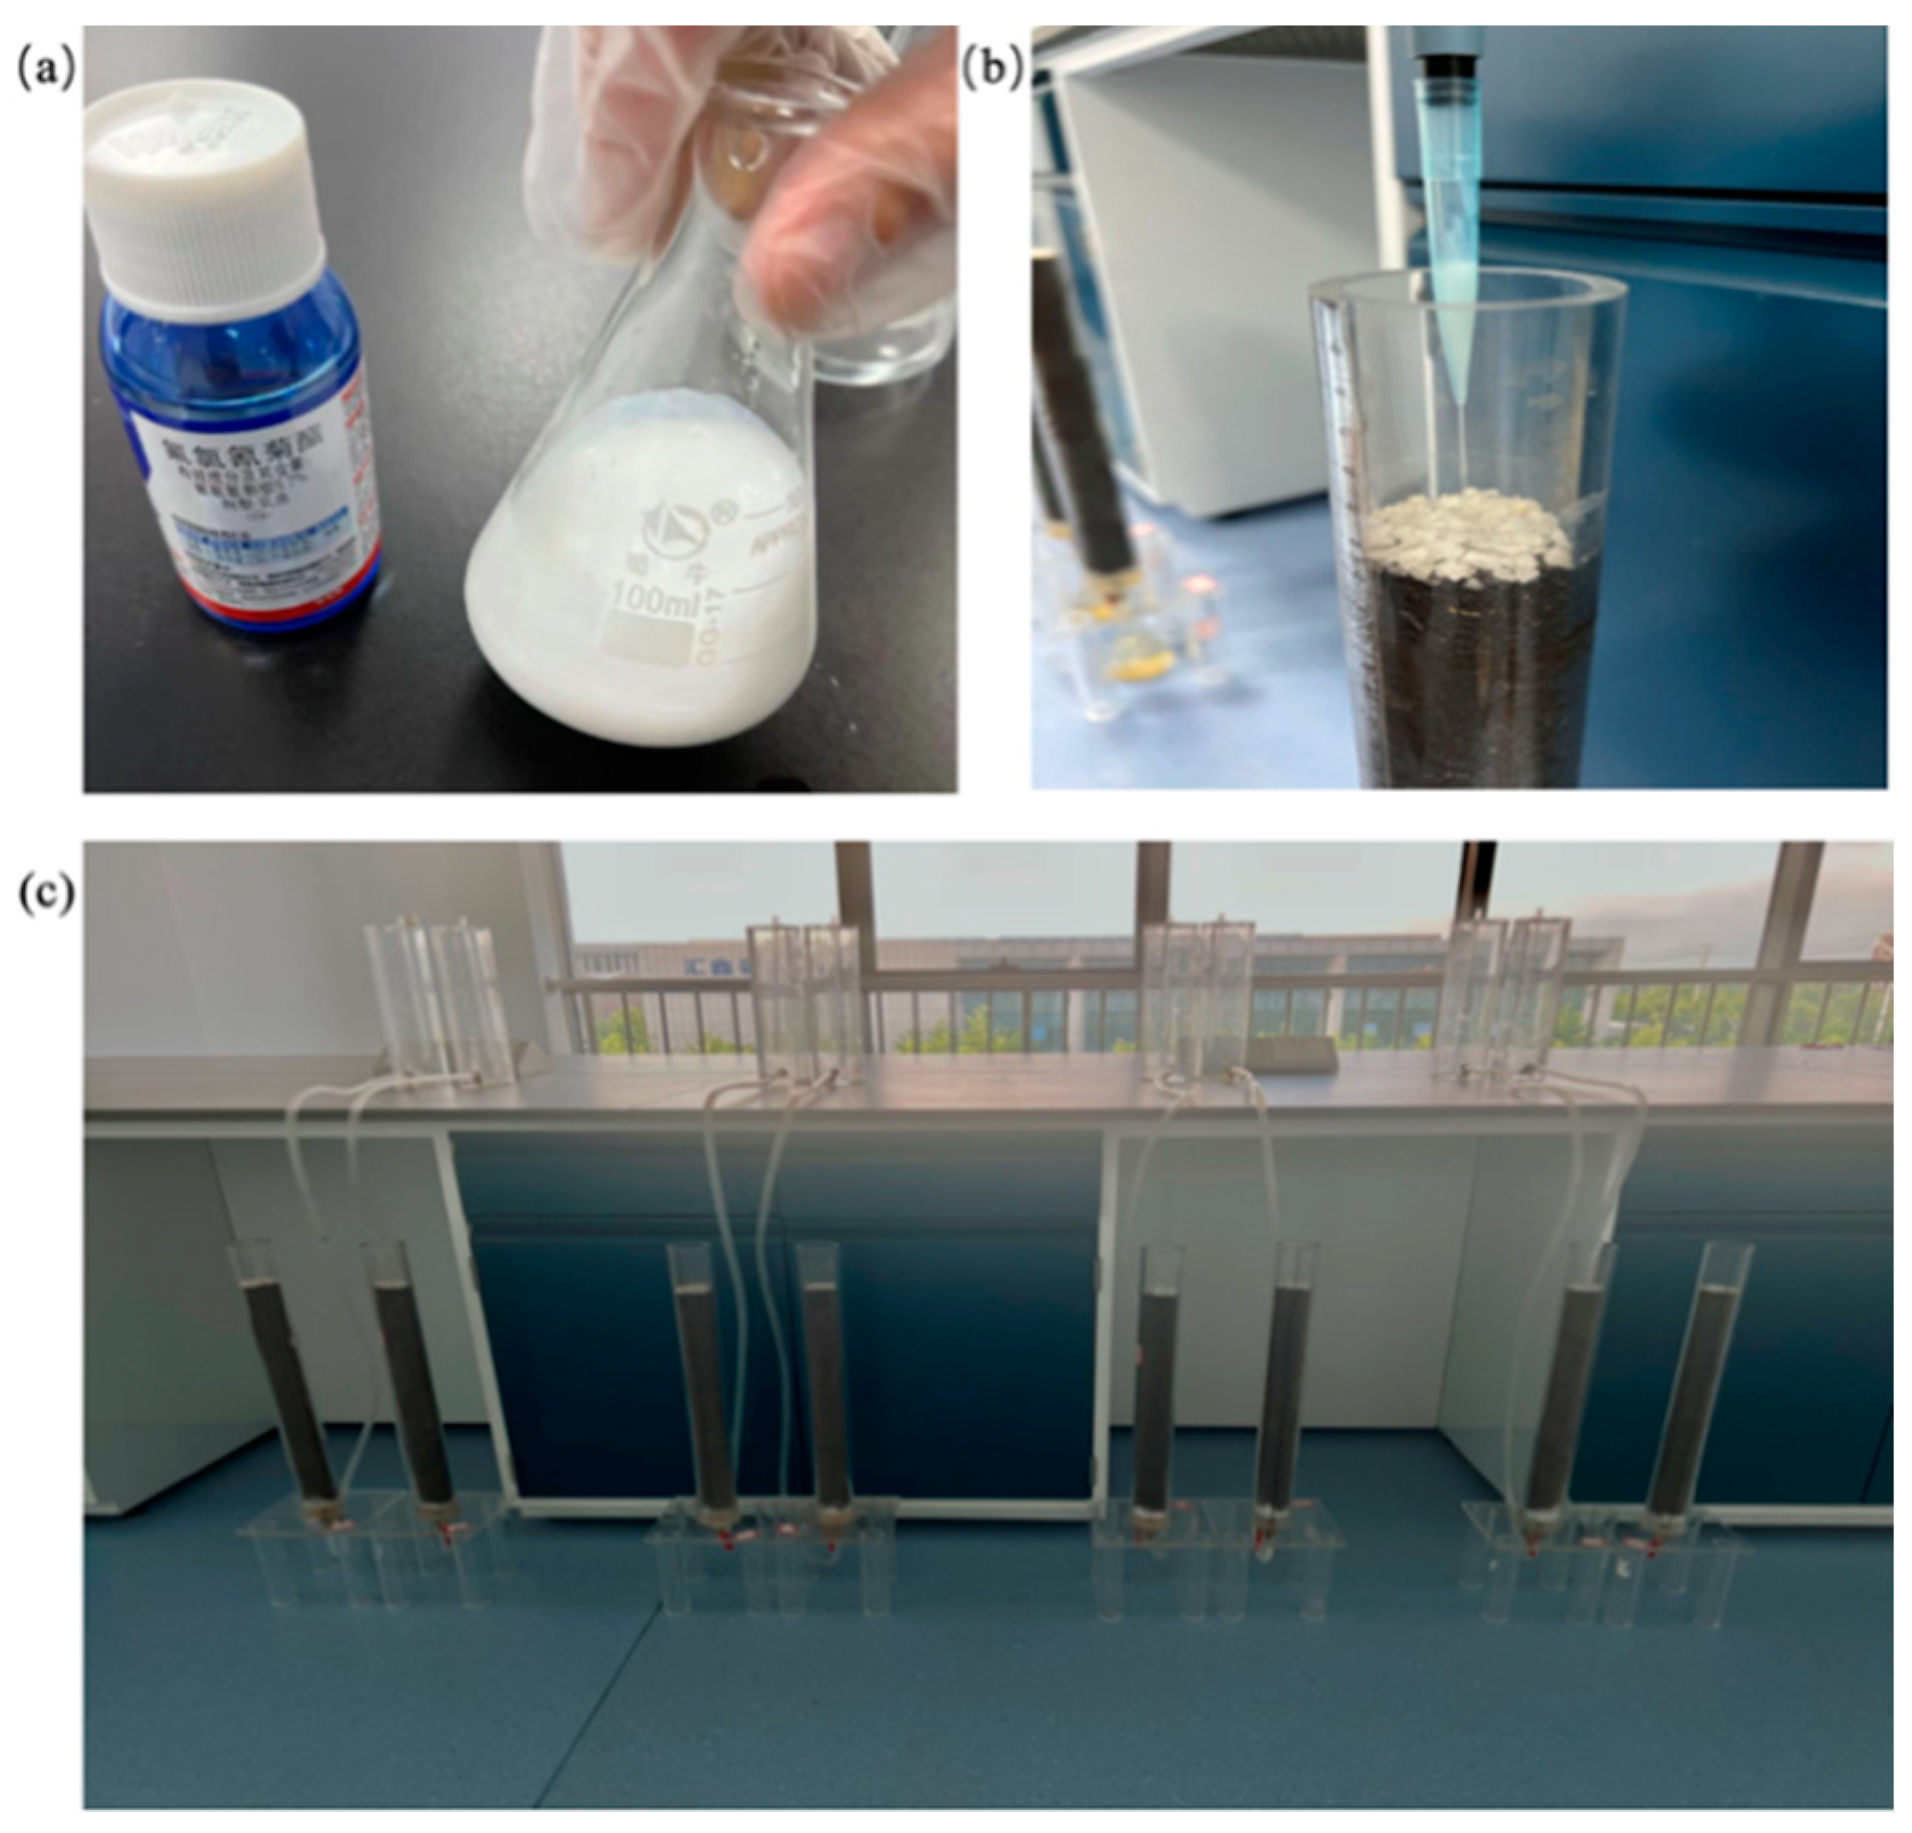
2.1. Sample Preparation

Soil was collected from the Jilin University Experimental Farmland (at 43°51′41″ N and 125°20′27″ E) and was confirmed to be unpolluted before sampling. Gas chromatography–mass spectrometry was used to determine that the collected samples were not contaminated with pesticides. Twenty sampling points were randomly selected in the sampling field, stones and weeds were removed from the soil surface, and the soil was collected from a depth of 0–20 cm. All soils were placed at room temperature (24 °C) for natural air drying, were evenly mixed, sieved through a 1 mm sieve, and evenly mixed again for later use. Taking the representativeness and severity of the pesticide pollution to be the criteria, we comprehensively considered the types of pesticides, the amount of pesticides used, the types of pesticide applications, and the pollution hazards. Six pesticides were selected, namely Dithane (65%, Zhongxun, Jiangxi China), Mancozeb (80%, Guoguang, Sichuang China), Chlorpyrifos (40%, Xinnong, Zhejiang China), Cyfluthrin (5.7%, Weierda, Zhejiang China), Glyphosate (41%, Weiyuan Tiansheng, Zhejiang China), and Deltamethrin (25 g/L, Bayer, Leverkusen Germany). The six selected pesticides involved organophosphorus, organosulfur, and pyrethroid, which were widely used and severely harmful pesticides. And, they contain herbicides, insecticides, and fungicides in their type of application, and vary in their remediation measures. The pesticide solution was diluted according to the recommended dosage in the pesticide user manual (Figure 1a).
In order to obtain a sufficient number of soil samples contaminated with various types of pesticides, it is necessary to manually prepare the soil to be tested. The use of leaching experiments to prepare soil pollution samples is more in line with the diffusion law of pesticides in natural soil. The preparation of 7 soil-leaching devices (pollution-free, Dithane, Mancozeb, Chlorpyrifos, Flumethrin, Glyphosate, and Deltamethrin) was conducted. A layer of glass wool and quartz sand were placed on the bottom of the leaching column, 40 cm of soil was poured into the leaching column, and compacted and wet (Figure 1c). One mL of six diluted pesticide solutions were and evenly dropped onto the soil surface of the leaching column. The distilled water leaching column was used as a pollution-free control (Figure 1b). Then, the leaching of soil by rainwater was simulated using an 800 mL CaCl2 solution of 0.01 mol/L. After leaching, the soil was removed from the leaching column and stored in a plastic bag [28].

2.2. Gas Chromatography–Mass Spectrometry Detection

The analysis of volatile components within the samples was conducted utilizing headspace gas chromatography–mass spectrometry (HS-GC/MS). The extraction of volatile organic compounds was achieved through the application of a PDMS/DVB fiber (65 μm; Supelco, Bellefonte, PA, USA). An Agilent Technologies 5975 gas chromatography–mass spectrometer (Agilent Technologies, Palo Alto, CA, USA) was utilized for analysis, paired with an HP-5MS-fused silica capillary column (30 m × 0.25 mm, 0.25 μm). The procedure for detection entailed the equilibration of pesticide samples at 60 °C for 30 min, followed by the extraction of volatile organic compounds using PDMS/DVB fibers (65 μm; US Supelco) for 20 min at the same temperature. Subsequent to extraction, the fibers were introduced into the GC-MS inlet and desorbed at 250 °C for 1 min, during which data collection ensued. The separation of volatile compounds was facilitated by an HP-5MS-fused quartz capillary column (30 m × 0.25 mm, 0.25 μm), employing a specialized temperature schedule: initiating at 40 °C for 3 min, followed by incrementing up to 280 °C at a rate of 10 °C/min, and then being sustained for 15 min. Helium was used as the carrier gas, with a flow rate maintained at 1 mL/min. The mass-selective detector operated with an electron impact potential of 70 eV, a centrifugal source temperature of 230 °C, a quadrupole temperature of 150 °C, and a scan range from 20 to 550 Amu. The identification of compounds was achieved through a comparison with the NIST 2008 library database.

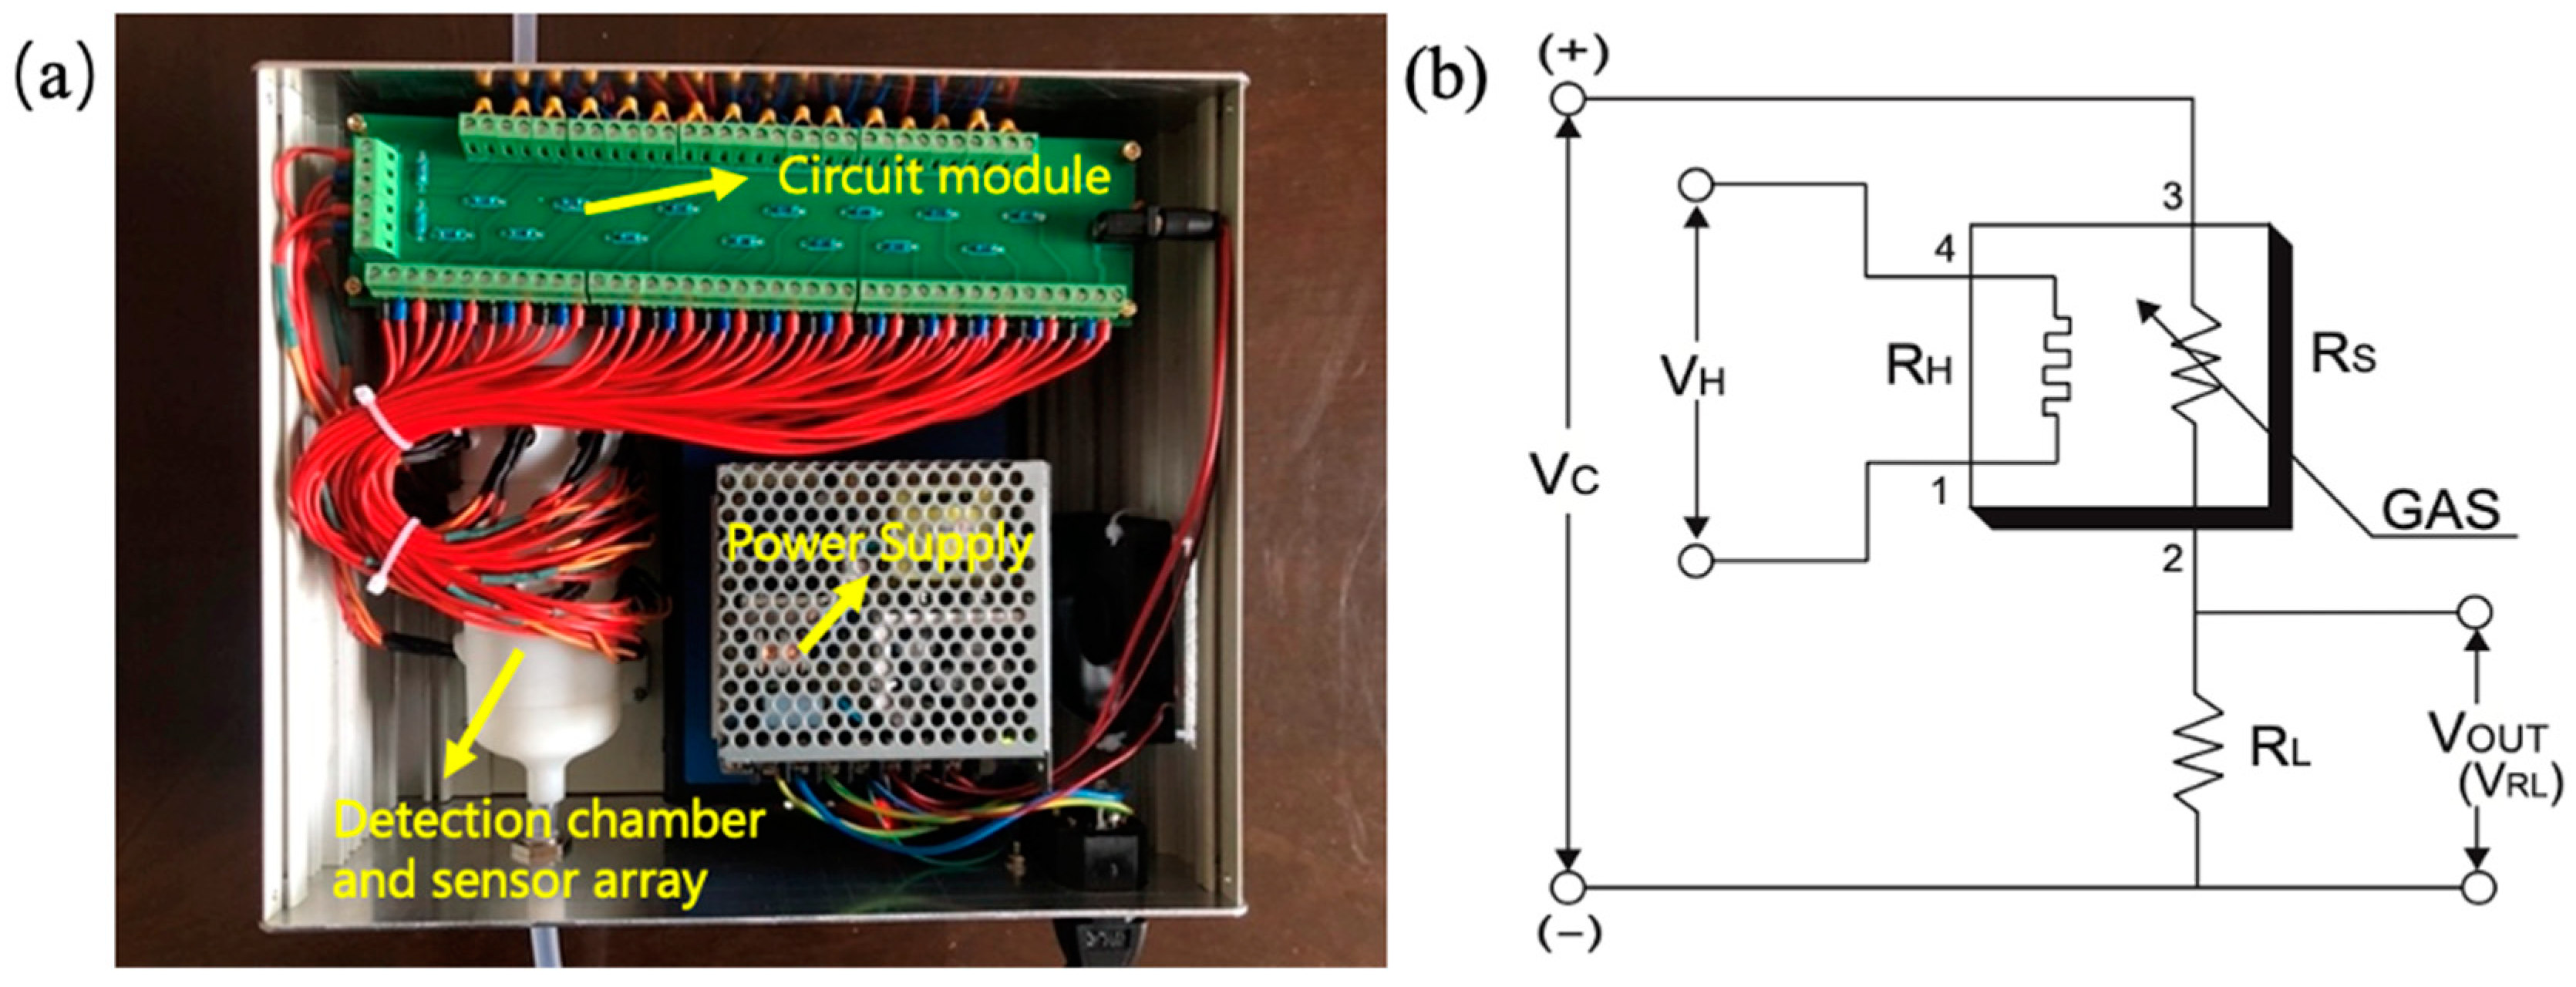
2.3. Soil Pesticide Odor Data Collection

In this study, a self-developed electronic nose (Figure 2) is used to collect soil pesticide odor signals. The developed electronic nose consists of an air pump (D15S), a circuit board, a detection chamber, a gas sensor array, and a signal acquisition card (USB5631). The sensor array is the core component of the electronic nose system and is applied to sense the gas to be measured. When the gas comes into contact with the sensor, the resistance of the sensor decreases. Due to the variety of gases in the soil, we selected 26 semiconductor metal oxide sensors (Table 1) to form a sensor array. The change in the sensor will be reflected by the circuit diagram (Figure 2b). The decreases in the sensor resistance Rs will cause the output voltage across the load resistor RL to rise. The output voltage is read by a data acquisition card and converted to a digital signal to be stored in a computer-specified path. In addition, the air pump provides the power for gas transmission, and the detection chamber is the place where the sensor reacts with the gas. Its sealing has an important impact on the sensitivity of the detection system. The air pump and data acquisition card were purchased from Chengdu Hailin Technology (Chengdu, China) and ART Technology (Beijing, China).
The electronic nose system is activated 30 min prior to collect data, which will allow the sensor surface to reach the operating temperature and clean the sensor surface with dry air. An amount of 10 g of the collected soil is taken and placed in a sealed beaker. The volatile soil gas is transported to the sensor surface via an air pump, causing a chemical reaction on the sensor’s surface. This is converted into an electrical signal using the data acquisition card and uploaded to a computer via a data cable. After collecting the gas from a soil sample, it is necessary to pass the clean gas into the chamber for 1 min to completely exhaust the residual gas and bring the sensor signal to the baseline level before collecting the gas from the next sample. A total of 160 samples were collected for each pesticide, and 40 samples were collected for healthy soil. Finally, a total of 1000 odor samples were collected.

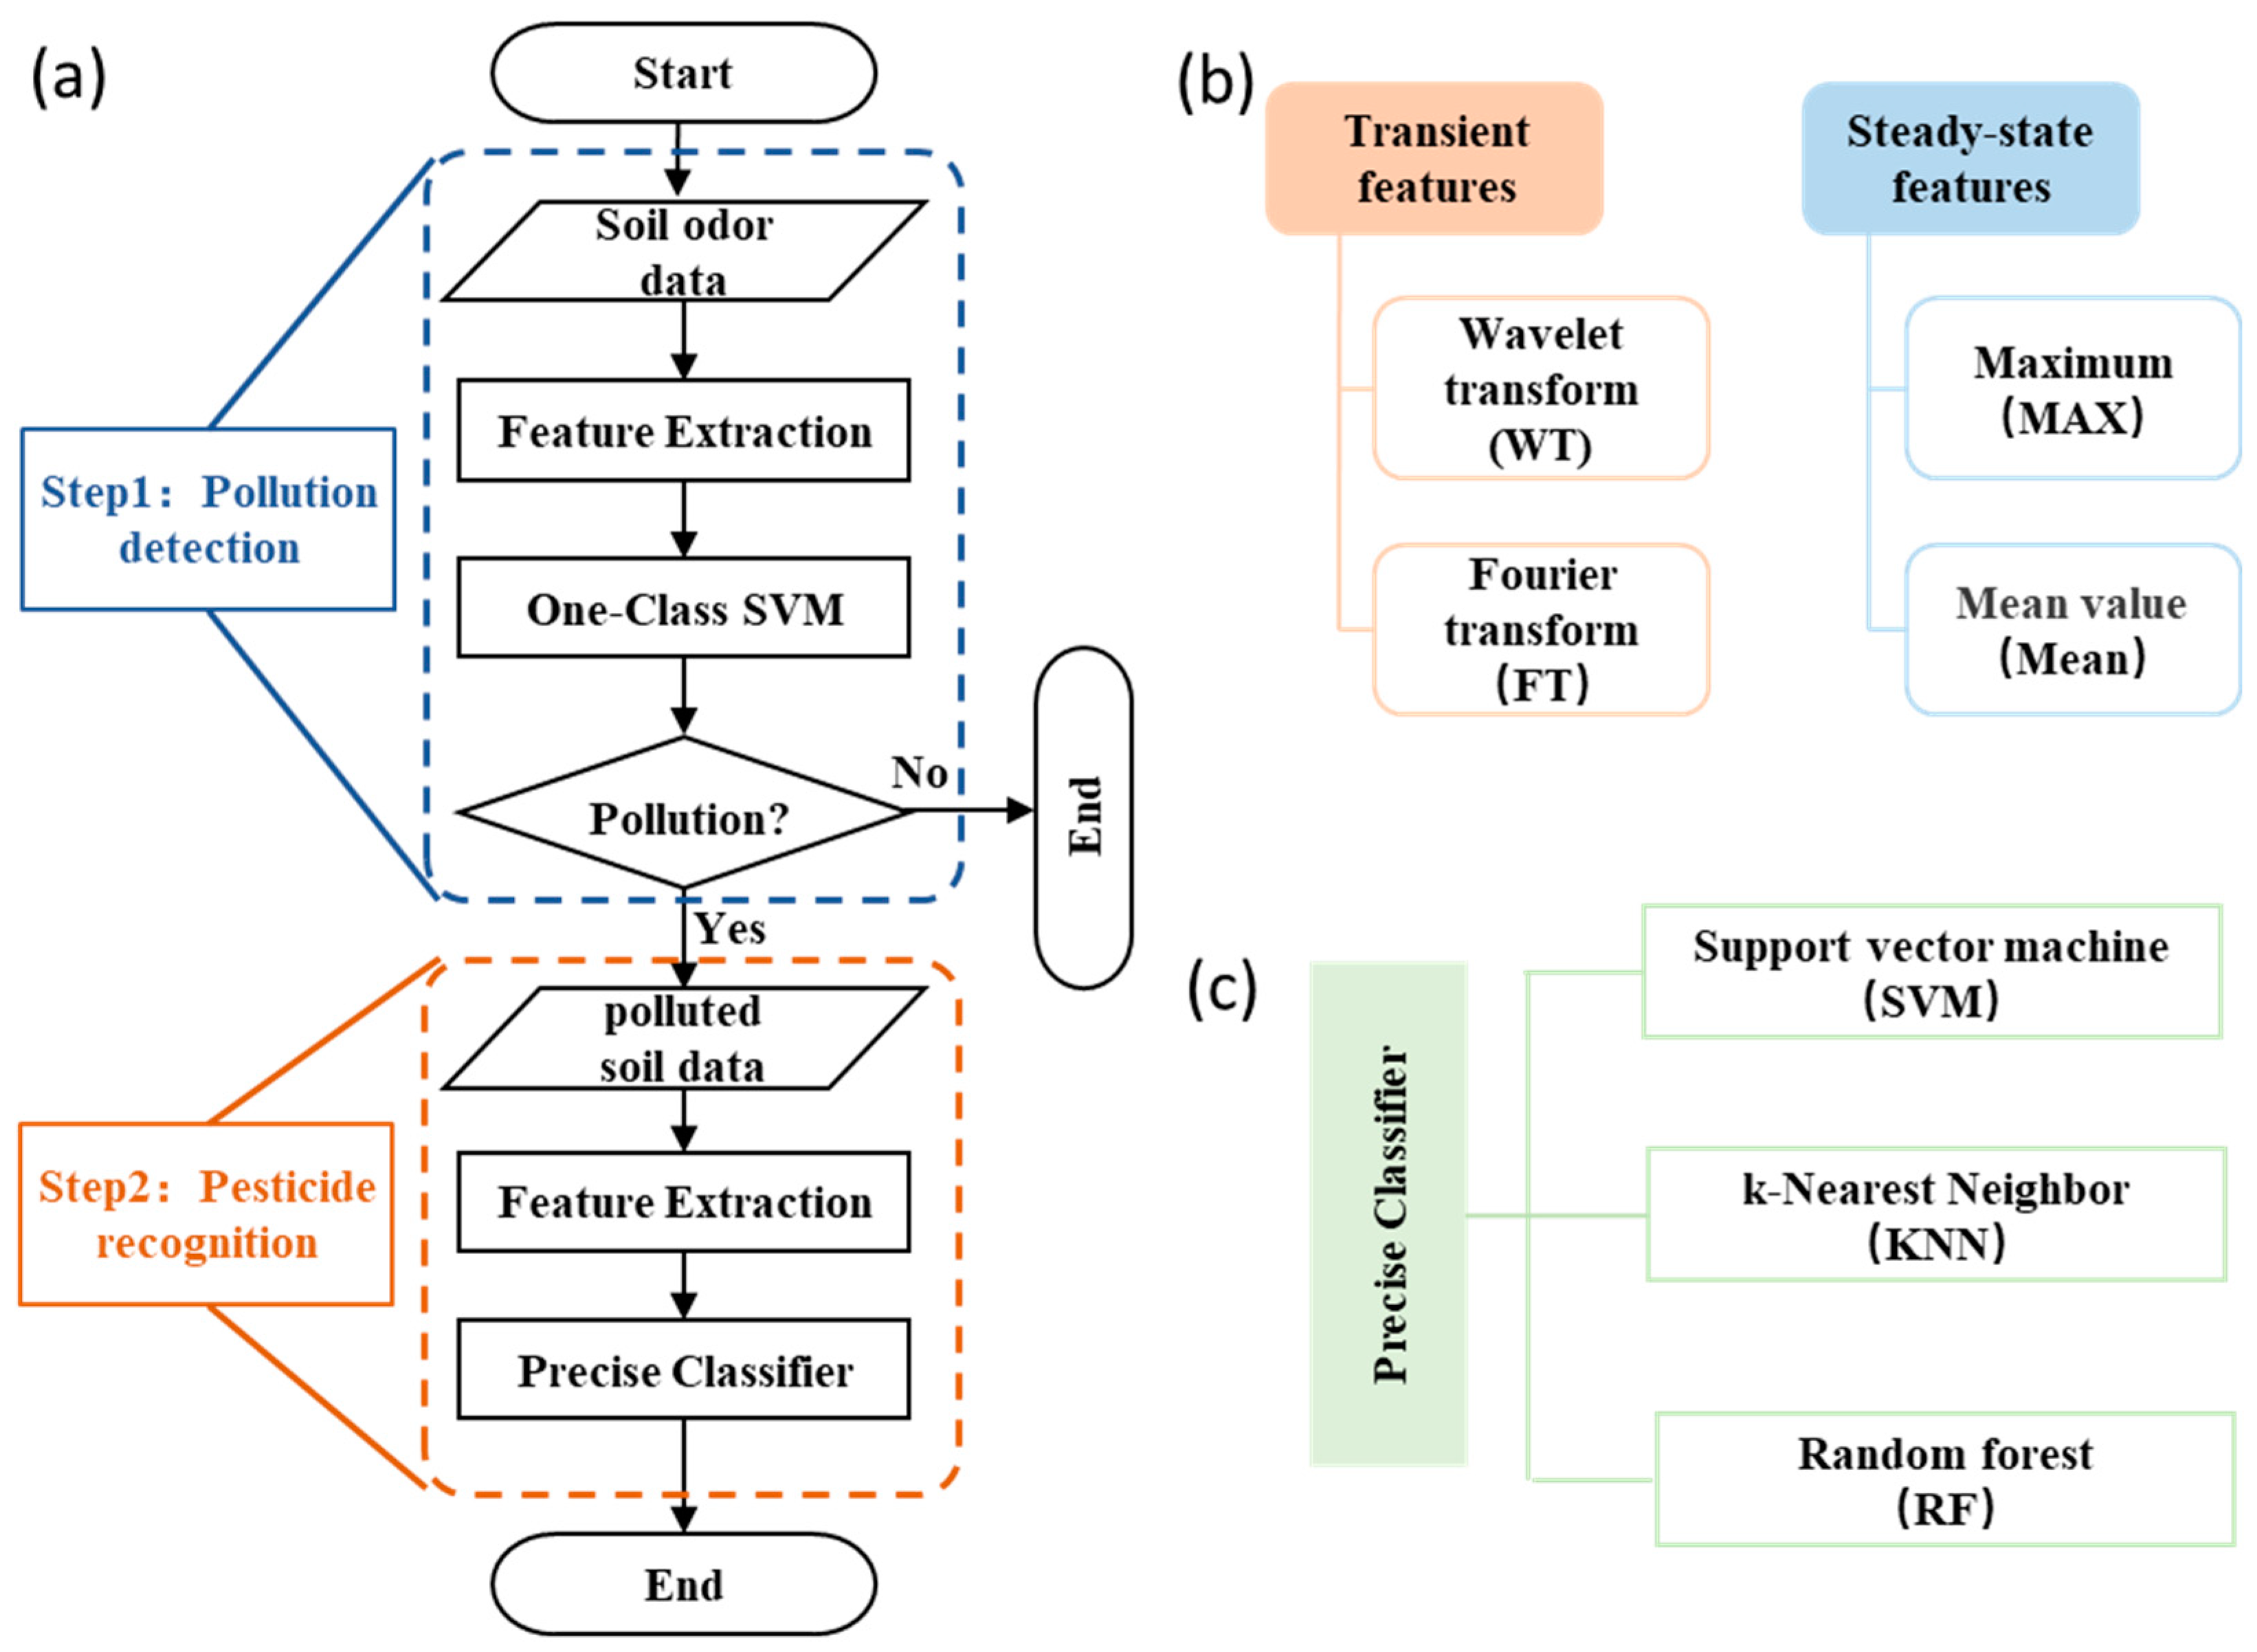
2.4. Experimental Data Analysis Methods

For the reliable detection of soil pollution and an accurate identification of pesticide types, a hybrid model based on unsupervised learning one-class SVM and supervised learning was proposed. The proposed hybrid model adopts a distributed framework, which includes two steps: pollution detection and pesticide identification, as shown in Figure 3. The hybrid model proposed in this paper first determines whether the soil is contaminated, and if pollution exists, and accurately identifies the type of pollution. Even if there are no such contaminated samples in the training set, the model can successfully detect soil contamination. Moreover, this step-by-step detection framework can greatly improve detection efficiency and accuracy by identifying pesticide types only when pollution is detected.
The main purpose of pollution detection is to quickly determine whether the soil is contaminated, and the main responsibility of pesticide identification is to accurately identify the type of pesticide. Among them, pollution detection is mainly carried out by a one-class SVM. A one-class SVM operates as a uni-class classifier, capable of executing the training of classifiers utilizing solely a singular category of target samples. It compensates for the shortcomings of traditional multi-class classifiers that rely too much on samples, and its decision-making method is more accurate in identifying minor faults, which are used to model healthy soil samples and obtain the boundaries of healthy soil samples. Therefore, as long as the soil is contaminated, it can be quickly identified based on the learned boundaries.
Pesticide recognition is accurately recognized by a supervised learning classifier. Three mainstream classifiers are used in this paper including a support vector machine (SVM), K-nearest neighbor (KNN), and random forest (RF). An SVM [29] is a linear classifier with the largest interval in the feature space. It performs machine learning in the cases of small samples. Because of the use of a kernel function, it overcomes the curse of dimensionality and the problem of non-linear separability. A KNN [30] is a simple and powerful classifier, which has the advantages of having a fast model training time, good prediction effect, and being insensitive to an outlier. The RF [31] classifier is constituted by an ensemble of decision trees, where the classification outcome is ascertained by the modal output type derived from the individual trees. It has high accuracy, can handle a large number of input variables, and can balance the error for unbalanced classification sets. The overall process for identifying soil pesticide residue hybrid models is as follows: Firstly, feature extraction is performed on the obtained soil odor data to significantly reduce data redundancy and obtain essential odor information. Then, a one-class support vector machine is used for pollution detection to determine whether the soil is contaminated. If no pollution is identified, the entire identification is complete. If pollution is identified, the odor data enters the pesticide identification step. The contaminated soil is also first subjected to feature extraction to obtain essential odor information, and then precise classifiers are used to identify pesticides. Based on the identification results, corresponding soil remediation measures can be taken to achieve safe and efficient soil remediation.
Under the objective of soil residue analysis, we divide the analysis into soil health detection tasks and precise pesticide identification tasks. In the soil health detection task, considerations such as the speed of detection, training efficiency, and model scalability are addressed by employing unsupervised learning with a one-class SVM. For the precise pesticide identification task, the focus is on the accuracy of identification and whether supervised learning models were utilized. This framework of combining unsupervised and supervised models in a hybrid model allows for the rapid and accurate detection of soil residues with minimal training requirements.
The feature extraction that runs through the entire process is crucial for soil pollution and pesticide identification. In this paper, wavelet transform (WT), Fourier transform (FT), maximum (MAX), and mean (Mean) are selected as candidate feature schemes [32]. WT and FT can effectively reflect the transient information of odor, while the MAX and Mean can effectively reflect the steady-state information of an odor.
The wavelet transform (WT) disassembles the original response into components of lower and higher frequencies, exhibiting a robust resistance to interference. It facilitates multi-resolution analysis, possessing the capability to delineate local attributes of the signal across both time and frequency domains. The WT feature extraction formula is as follows:
W T a , τ = 1 a f t ψ t τ a d t ,
where t represents time and f(t) represents the sensor’s response value.
Fourier transform (FT) constitutes the transformation of unprocessed data into a novel domain, effectuating the decomposition of the raw response into a confluence of direct current (DC) elements and various harmonic constituents. The amplitude attributes of each constituent facilitate both qualitative and quantitative assessments. The FT feature extraction formula is as follows:
F ω = F f t = f ( t ) e i w t d t ,
where t represents time and f(t) represents the sensor’s response value.
The MAX epitomizes the ultimate steady-state attributes of the entire dynamical response sequence at equilibrium, encapsulating the maximal variation in the sensor’s reaction to olfactory stimuli. This parameter is commonly employed as a predominant method for feature extraction. The MAX feature extraction formula is as follows:
x i = V i m a x ,
where i represents the i-th sensor, V i m a x represents the maximum voltage value of the i-th sensor.
The Mean is a calculation method used to measure the average value of data. It can not only reflect the central tendency of a group of data, but also compare different data to see the difference between different datasets. The Mean feature extraction formula is as follows:
x = i = 1 n x i n ,
where x represents the average value, xi is the response value of the sensor.

3. Results and Analysis

3.1. Main Volatiles in Pesticide Samples

A total of 128 volatile compounds were detected in the pesticide samples vis gas chromatography-mass spectrometry, which are shown in Table 2. According to the results, there are two obvious characteristics of the pesticide volatiles. First, there are many types of pesticide volatiles, including alcohol, aromatic hydrocarbon, phenol, halogenated hydrocarbon, and soon. The complexity of pesticide volatiles has been a difficult problem in the detection of pesticide gases. Over the years, many scholars have been committed to trying to break through the limitations of sample preparation procedures, separation and detection techniques [33], but there is still no optimal solution. Therefore, the electronic nose system designed in this paper contains more gas sensors so that it can detect more volatiles, thus improving the accuracy of its pesticide detection. The second significant characteristic of the pesticide volatiles is that different pesticides have both the same and different volatiles. This is the key premise of using an electronic nose to detect pesticides in soil. The same volatile matter between pesticides allows electronic noses to quickly distinguish healthy soil from contaminated soil, with the distinguishing markers being the same compounds emitted by these pesticides. Then, the different volatiles between pesticides make it possible to distinguish the different types and brands of pesticides in the contaminated soil.
The chromatographic results of the pesticide samples further proved the feasibility of using an electronic nose to detect pesticide residues in soil and the rationality of selecting the core components of an electronic nose (sensor array).

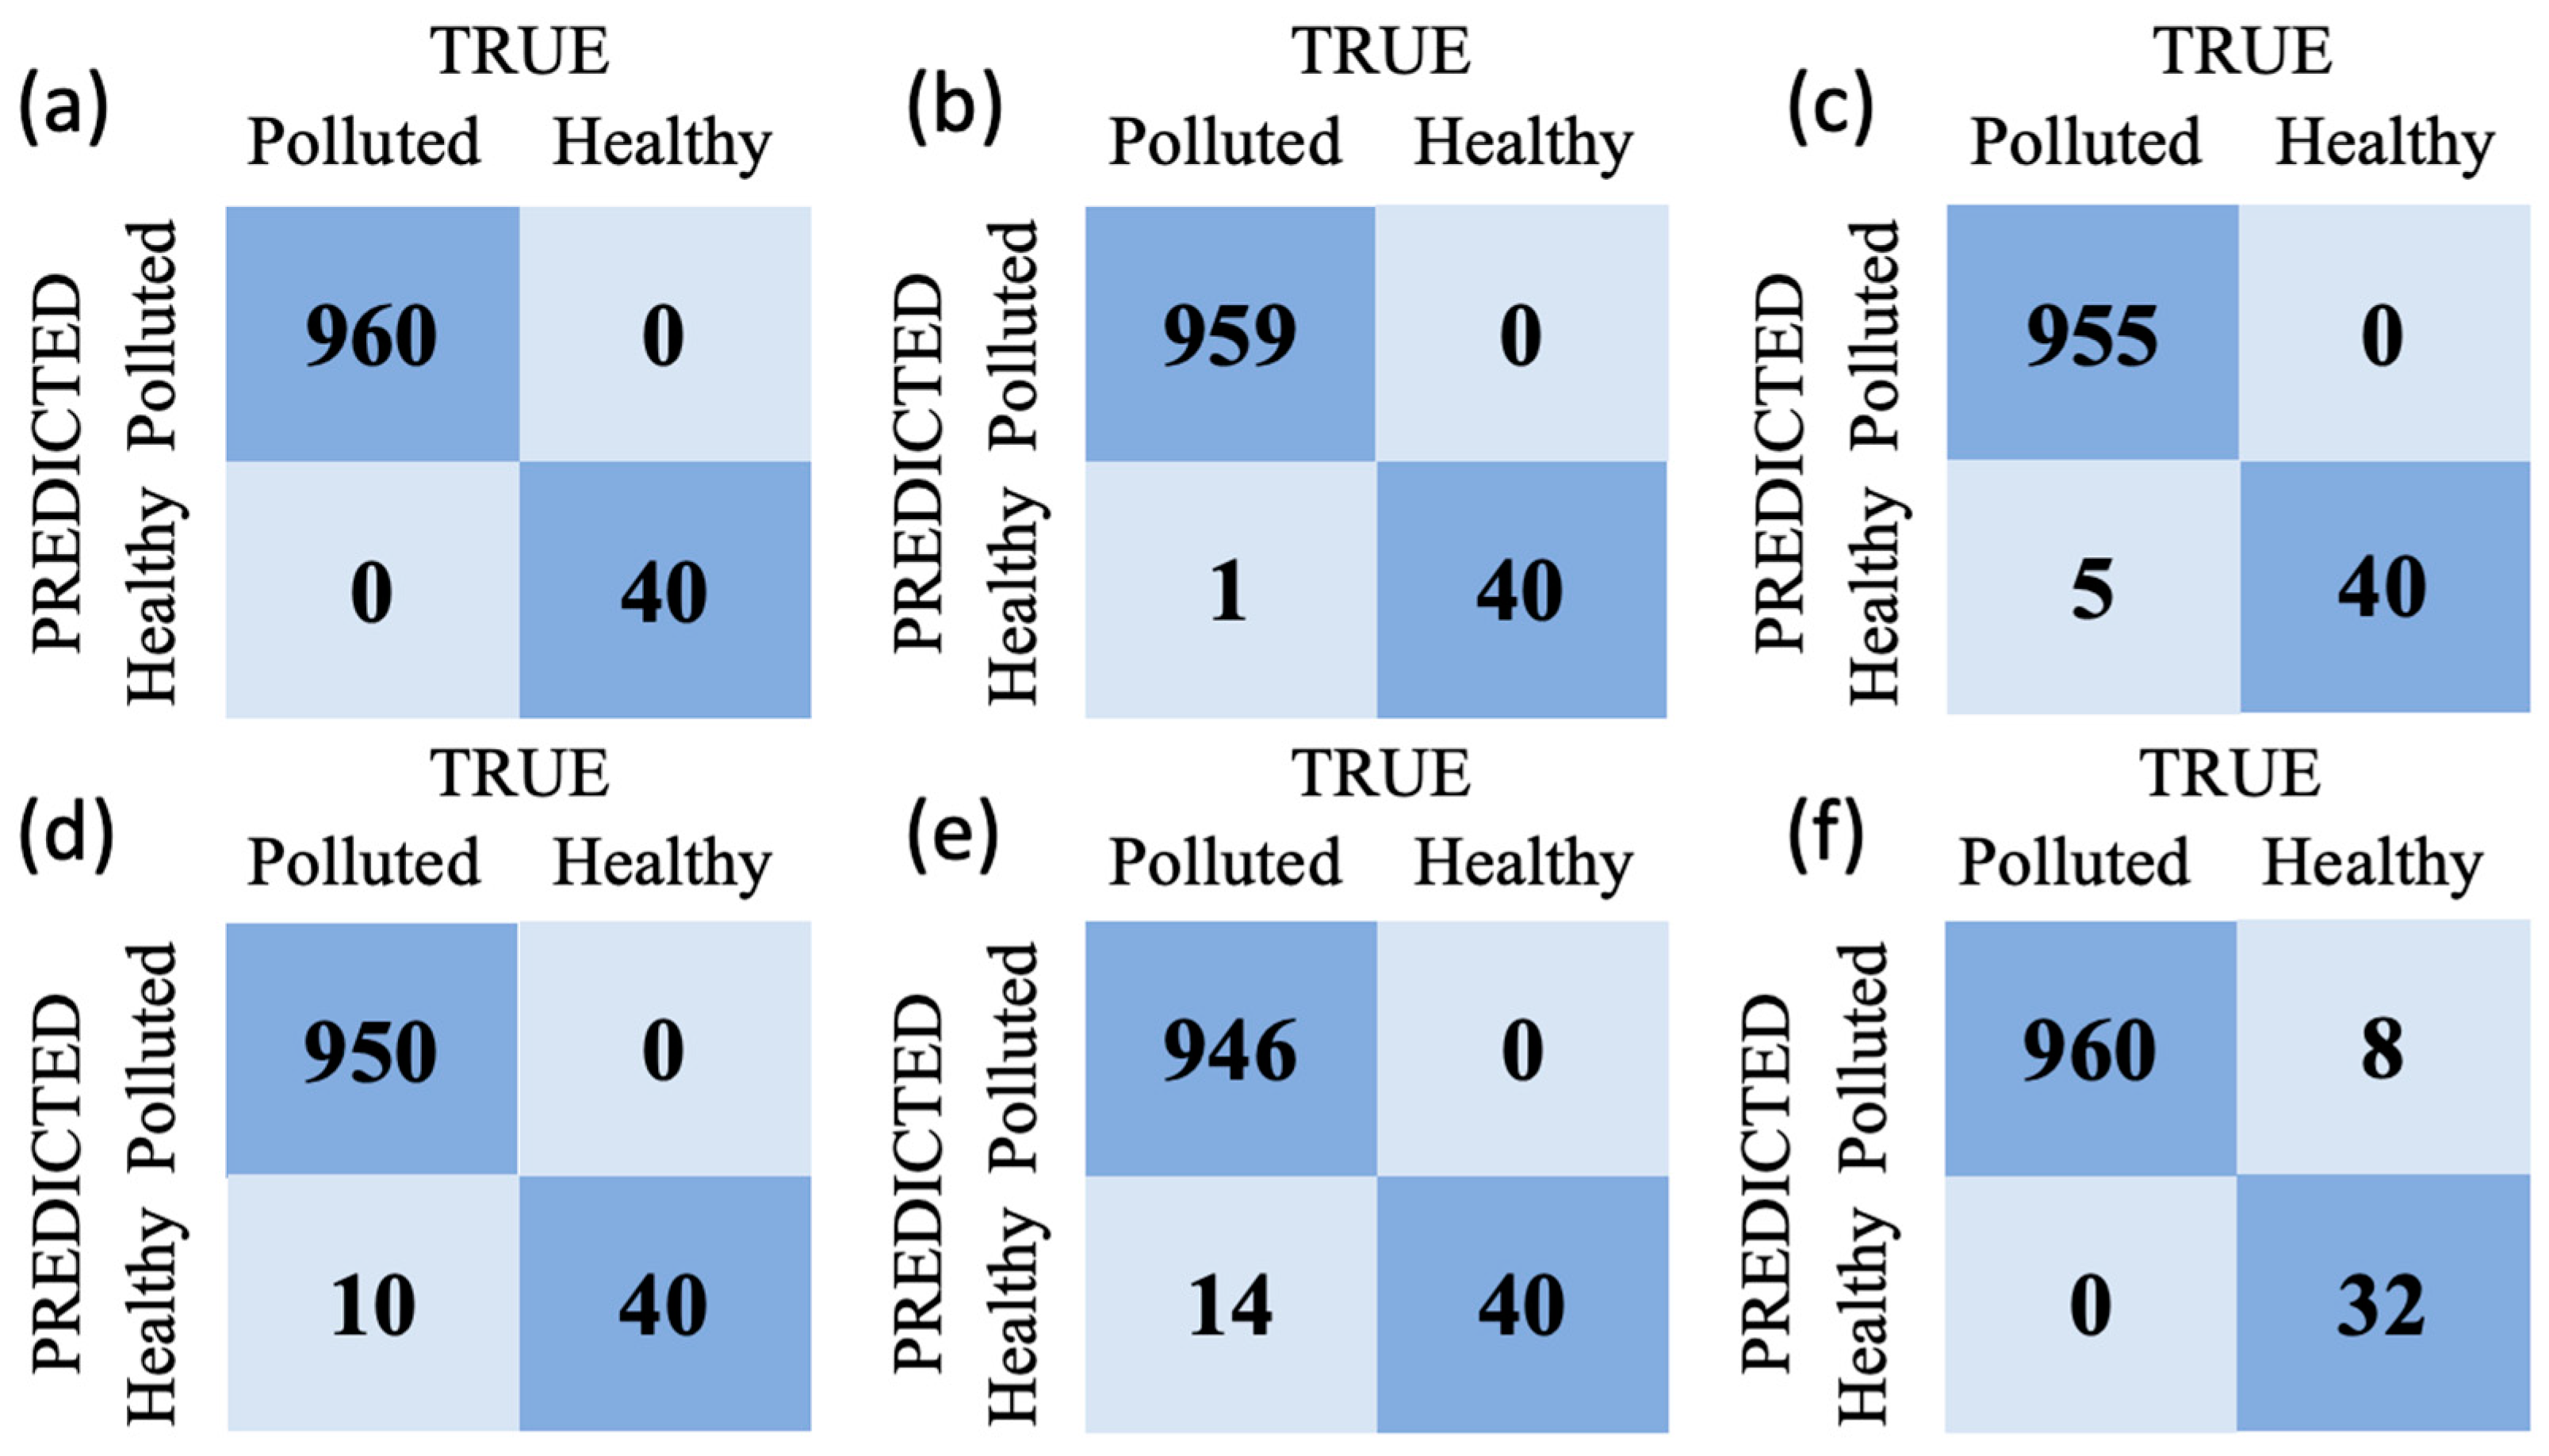
3.2. Unsupervised Soil Contamination Test Results

Each detection model was trained using 40 samples and health testing was conducted on 1000 samples. The results of the soil pesticide residue pollution detection are shown in Table 3. As shown in Table 3, in the soil pollution detection module, the recognition rates of FT, MAX, Mean, and WT combined with the one-class SVM have all reached over 99.00%, with the highest recognition rate being that of the WT, reaching 99.40%, and the lowest being that of the FT, reaching 99.00%. This indicates that a one-class SVM machine combined with feature extraction can not only extract soil contamination information, but also can use the extracted soil contamination information to effectively distinguish whether the soil is contaminated or not. One-class SVMs only require healthy soil samples during the training process of pollution detection models, learning the rules of healthy samples, and do not require additional pollution samples. While the current, commonly used, supervised learning classifier can slightly outperform the one-class SVM in some cases, it needs healthy soil samples and pesticide-contaminated soil samples for pollution detection. However, in most cases, it is difficult to obtain training samples covering all pesticide types, and the accuracy of the established model in detecting newly measured soil pollution samples will be greatly affected in practical applications. Moreover, with the reduction in the pollution sample size during model training, it can be found that the effect of supervised learning on soil health detection will decline, becoming even lower than that of the one-class SVM. This is because as the number of contaminated samples decreases, the pollution feature information is greatly reduced, which will reduce the machine’s recognition ability for contaminated samples. Figure 4 lists the confusion matrix of each detection model established using the MAX eigenvalue. From the confusion matrix, it can be seen that once the monitoring model identifies errors, it will misjudge the contaminated samples to be healthy samples. This will prevent the contaminated soil from being discovered, resulting in its continuous pollution and deterioration, which is not conducive to soil remediation and management. However, the one-class SVM often misjudges healthy samples as contaminated samples when identifying errors. As a preliminary screening method for soil pollution, the electronic nose will perform more accurate measurements on predicted pollution samples after identification, so the impact of this misjudgment on soil governance and remediation is minimal.
Meanwhile, the electronic nose system applied in this paper performs real-time detecting of soil pollution. After using different feature extraction methods, the recognition time required for using the one-class SVM is within 0.1 s. The recognition time using the Mean combined with the one-class SVM is the fastest method, taking only 0.03 s. The slowest one is the use of FT combined with the one-class SVM, which only takes 0.08 s. The efficiency of this pollution detection is unmatched by commonly used chromatography methods.
Furthermore, in order to consider the impact of different sample sizes during the model training stage on the recognition performance of the one-class SVM, different numbers of training samples were used to establish an unsupervised detection model, and the results are shown in Figure 5. As the number of training samples increases, the soil pollution detection effect is better, which is consistent with the traditional supervised learning model [34]. However, it is not difficult to find that the one-class SVM can still achieve good recognition performance when using only five training samples to establish the model. The recognition rate exceeds 96% under different feature extraction methods.
It can be seen from the above analysis that the proposed unsupervised learning model requires fewer training samples when conducting soil pollution detection, and only five healthy soil samples can be used to at least complete the model’s establishment. Its recognition accuracy is comparable to that of traditional supervised learning, but when identifying errors, the proposed supervised learning method does less harm to soil governance and restoration.

3.3. Results of the Supervised Identification of Pesticide Types

The results of identifying the pesticide residue types are shown in Table 4, which shows the effectiveness of using KNN, RF, and an SVM in the pesticide residue pollution type detection module. From the table, it can be seen that different feature extraction methods combined with different classifiers have a significant impact on the recognition results, which are the same as the traditional research methods of the electronic nose [35]. In specific detection applications, the selection of different feature extraction methods and classifiers is the key to optimizing the performance of electronic nose systems. The recognition rates of four feature extraction methods, FT, MAX, Mean, and WT, combined with three pattern recognition methods, KNN, RF, and an SVM, demonstrate that the electronic nose can fully recognize the types of organophosphorus, organosulfur, and pyrethroid pesticides, providing the accurate basis for subsequent contaminated soil remediation work. Using MAX or Mean as the feature extraction method and an SVM as the supervised learning classifier achieves the highest pesticide type recognition rate of 99.27%.
Considering the impact of different feature extraction methods on pesticide type recognition, the average recognition rates of FT, MAX, Mean, and WT in the three classifiers were calculated to be 96.68%, 98.13%, 98.37%, and 98.54%, respectively. WT achieved the highest average recognition rate, indicating its effectiveness in accurately identifying soil pesticide types. In evaluating the impact of different supervised learning classifiers on pesticide type recognition, the average recognition rates of KNN, RF, and the SVM using different features were found to be 98.03%, 97.48%, and 98.28%, respectively. The SVM displayed the highest average recognition rate, possibly due to its advantages in solving nonlinear problems and handling small sample problems [36].

4. Discussion

This paper proposed a hybrid model based on an electronic nose system to prevent the electronic nose system from misjudging samples that have not participated in training. The experimental results showed that the combination of the electronic nose system and the model could classify healthy soil with an accuracy of 99.3%, and the pesticide type recognition accuracy was 99.27%. This result indicated that the proposed model combined with the electronic nose system has significant application value in the field of soil pesticide residue detection. In Table 5, we summarized the papers on the application of an electronic nose in pesticide detection. As can be seen from the table, the previous research had shown that electronic nose systems could be used to detect pesticide residues, and the results of this study supported such conclusions. Unlike the previous works, this paper considered the problem that untrained samples might lead to the misjudgment of the electronic nose system and solved this problem using the proposed hybrid model, which greatly enhanced the potential of the electronic nose system in the field of pesticide residue detection.
Although the hybrid model combined with an electric nose proposed in this study can accurately predict pesticide residues in soil, its study was conducted in a laboratory with fewer interference factors. In the future, it can be applied to agricultural detection to verify the reliability of this method.

5. Conclusions

In this study, an electronic nose device was utilized to collect odor samples from different types of pesticide-contaminated soils. A hybrid model combining unsupervised and supervised learning approaches was proposed. Among the detection methods for soil pesticide residue contamination, the combination of the one-class SVM and the Mean achieved the shortest detection time and a recognition rate of 99.30%. In the module for detecting the types of pesticide residue contamination in soils, the combination of the Mean and SVM achieved the highest recognition rate of 99.27%. Overall, using an electronic nose system and the Mean as a feature extraction method resulted in the optimal recognition accuracy and the fastest detection time. This demonstrates the ability of the electronic nose system to collect soil odor information and, when combined with feature extraction and machine learning methods, to effectively identify whether the soil is contaminated with a pesticide residue and the type of residue. Moreover, it can quickly identify soil pesticide residue even with a small sample size during the precise soil remediation process.

Author Contributions

Conceptualization, J.Q. and Y.L.; methodology, J.Q., Y.F. and X.W.; investigation, Y.F. and J.L.; supervision, Y.Z. and S.L.; writing—original draft, J.Q. and Y.L.; writing—review and editing, C.L. and X.W.; validation, Y.L., Y.Z. and J.L.; software, Y.L.; visualization, Y.Z., J.L. and S.L.; supervision, Y.Z. and S.L.; project administration, C.L. and X.W.; resources, J.Q. and X.W.; formal analysis, Y.F. and C.L.; data curation, Y.F. and S.L.; funding acquisition, X.W. All authors have read and agreed to the published version of the manuscript.

Funding

This work was supported by the National Natural Science Foundation of China (U22A20184), the Science-Technology Development Plan Project of Jilin Province (YDZJ202101ZYTS003, 20210203004SF, 20230203149SF, 20230201069GX), and the Special Project of Industrial Technology Research and Development of Jilin Province (2022C045-6).

Data Availability Statement

The datasets presented in this study can be found in online repositories. The names of the repository/repositories and accession number can be found in the article.

Conflicts of Interest

The authors declare no conflicts of interest.

Abbreviations List

Abbreviation:Full name:
PCAPrincipal component analysis
ANNArtificial neural network
WTWavelet transform
FTFourier transform
MAXMaximum
MeanMean value
One-Class SVMOne-class support vector machine
KNNK-nearest neighbor
RFRandom forest
SVMSupport vector machine

References

  1. Fu, H.Y.; Tan, P.; Wang, R.J.; Li, S.N.; Liu, H.Z.; Yang, Y.; Wu, Z.L. Advances in organophosphorus pesticides pollution: Current status and challenges in ecotoxicological, sustainable agriculture, and degradation strategies. J. Hazard. Mater. 2021, 424, 127494. [Google Scholar] [CrossRef] [PubMed]
  2. Li, Y.; Long, L.; Ge, J.; Li, H.C.; Zhang, M.; Wan, Q.; Yu, X.Y. Effect of Imidacloprid Uptake from Contaminated Soils on Vegetable Growth. J. Agric. Food Chem. 2019, 67, 7232–7242. [Google Scholar] [CrossRef] [PubMed]
  3. Xiao, J.J.; Chen, L.; Pan, F.; Deng, Y.J.; Ding, C.C.; Liao, M.; Su, X.Y.; Cao, H.Q. Application method affects pesticide efficiency and effectiveness in wheat fields. Pest Manag. Sci. 2020, 76, 1256–1264. [Google Scholar] [CrossRef] [PubMed]
  4. Chang, J.N.; Fang, W.; Chen, L.; Zhang, P.Y.; Zhang, G.M.; Zhang, H.B.; Liang, J.S.; Wang, Q.Y.; Ma, W.F. Toxicological effects, environmental behaviors and remediation technologies of herbicide atrazine in soil and sediment: A comprehensive review. Chemosphere 2022, 307, 136006. [Google Scholar] [CrossRef] [PubMed]
  5. Singh, D.; Singh, S.K.; Modi, A.; Singh, P.K.; Zhimo, V.Y.; Kumar, A. Impacts of agrochemicals on soil microbiology and food quality. In Agrochemicals Detection, Treatment and Remediation; Butterworth-Heinemann: Oxford, UK, 2020; pp. 101–116. [Google Scholar]
  6. Sandanayake, S.; Hettithanthri, O.; Buddhinie, P.K.C.; Vithanage, M. Plant uptake of pesticide residues from agricultural soils. In Pesticides in Soils: Occurrence, Fate, Control and Remediation; Springer International Publishing: Cham, Switzerland, 2022; pp. 197–223. [Google Scholar]
  7. Kaur, R.; Singh, D.; Kumari, A.; Sharma, G.; Rajput, S.; Arora, S. Pesticide residues degradation strategies in soil and water: A review. Int. J. Environ. Sci. Technol. 2021, 20, 3537–3560. [Google Scholar] [CrossRef]
  8. Rodrigues, S.M.; Römkens, P.F. Human health risks and soil pollution. In Soil Pollution; Academic Press: Cambridge, MA, USA, 2018; pp. 217–250. [Google Scholar]
  9. Insam, H.; Seewald, M.S.A. Volatile organic compounds (VOCs) in soils. Biol. Fertil. Soils 2010, 46, 199–213. [Google Scholar] [CrossRef]
  10. Bokade, P.; Gaur, V.K.; Tripathi, V.; Bobate, S.; Manickam, N.; Bajaj, A. Bacterial remediation of pesticide polluted soils: Exploring the feasibility of site restoration. J. Hazard. Mater. 2023, 441, 129906. [Google Scholar] [CrossRef]
  11. Zhang, H.; Yuan, X.; Xiong, T.; Wang, H.; Jiang, L. Bioremediation of co-contaminated soil with heavy metals and pesticides: Influence factors, mechanisms and evaluation methods. Chem. Eng. J. 2020, 398, 125657. [Google Scholar] [CrossRef]
  12. Mali, H.; Shah, C.; Raghunandan, B.H.; Prajapati, A.S.; Patel, D.H.; Trivedi, U.; Subramanian, R.B. Organophosphate pesticides an emerging environmental contaminant: Pollution, toxicity, bioremediation progress, and remaining challenges. J. Environ. Sci. 2023, 127, 234–250. [Google Scholar] [CrossRef]
  13. Xu, L.; El-Aty, A.M.A.; Eun, J.B.; Shim, J.H.; Zhao, J.; Lei, X.; Gao, S.; She, Y.; Jin, F.; Wang, J. Recent Advances in Rapid Detection Techniques for Pesticide Residue: A Review. J. Agric. Food Chem. 2022, 70, 13093–13117. [Google Scholar] [CrossRef]
  14. Brack, W.; Hollender, J.; de Alda, M.L.; Müller, C.; Krauss, M. High-resolution mass spectrometry to complement monitoring and track emerging chemicals and pollution trends in European water resources. Environ. Sci. Eur. 2019, 31, 62. [Google Scholar] [CrossRef]
  15. Park, S.Y.; Kim, Y.; Kim, T.; Eom, T.H.; Kim, S.Y.; Jang, H.W. Chemoresistive materials for electronic nose: Progress, perspectives, and challenges. InfoMat 2019, 1, 289–316. [Google Scholar] [CrossRef]
  16. Ali, M.M.; Hashim, N.; Abd Aziz, S.; Lasekan, O. Principles and recent advances in electronic nose for quality inspection of agricultural and food products. Trends Food Sci. Technol. 2020, 99, 1–10. [Google Scholar]
  17. Nie, J.Y.; Li, R.; Jiang, Z.T.; Wang, Y.; Tan, J.; Tang, S.H.; Zhang, Y. Antioxidant activity screening and chemical constituents of the essential oil from rosemary by ultra-fast GC electronic nose coupled with chemical methodology. J. Sci. Food Agric. 2020, 100, 3481–3487. [Google Scholar] [CrossRef] [PubMed]
  18. Farraia, M.V.; Rufo, J.C.; Paciência, I.; Mendes, F.; Delgado, L.; Moreira, A. The electronic nose technology in clinical diagnosis: A systematic review. Porto Biomed. J. 2019, 4, e42. [Google Scholar] [CrossRef] [PubMed]
  19. Dorji, U. Electronic nose based wireless sensor network for soil monitoring in precision farming system. In Proceedings of the 2017 9th International Conference on Knowledge and Smart Technology (KST), Chonburi, Thailand, 1–4 February 2017; IEEE: Piscataway, NJ, USA, 2017. [Google Scholar]
  20. De Cesare, F.; Di Mattia, E.; Pantalei, S.; Zampetti, E.; Vinciguerra, V.; Canganella, F.; Macagnano, A. Use of electronic nose technology to measure soil microbial activity through biogenic volatile organic compounds and gases release. Soil Biol. Biochem. 2011, 43, 2094–2107. [Google Scholar] [CrossRef]
  21. Bieganowski, A.; Jaromin-Glen, K.; Guz, Ł.; Łagód, G.; Jozefaciuk, G.; Franus, W.; Suchorab, Z.; Sobczuk, H. Evaluating Soil Moisture Status Using an e-Nose. Sensors 2016, 16, 886. [Google Scholar] [CrossRef] [PubMed]
  22. Bieganowski, A.; Józefaciuk, G.; Bandura, L.; Guz, Ł.; Łagód, G.; Franus, W. Evaluation of Hydrocarbon Soil Pollution Using E-Nose. Sensors 2018, 18, 2463. [Google Scholar] [CrossRef] [PubMed]
  23. Kong, C.; Ren, L.; Zhang, T.; Sun, Y.; Chang, Z. Rapid identification of pesticides in soil by bionic sniffing sensing system with unknown category detection function. Comput. Electron. Agric. 2024, 217, 108667. [Google Scholar] [CrossRef]
  24. Shi, X.-H.; Qiao, Y.-H.; Luan, X.-Y.; Yuan, Y.-P.; Xu, L.; Chang, Z.-Y. A two-stage framework for detection of pesticide residues in soil based on gas sensors. Chin. J. Anal. Chem. 2022, 50, 100124. [Google Scholar] [CrossRef]
  25. Sanaeifar, A.; Li, X.; He, Y.; Huang, Z.; Zhan, Z. A data fusion approach on confocal Raman microspectroscopy and electronic nose for quantitative evaluation of pesticide residue in tea. Biosyst. Eng. 2021, 210, 206–222. [Google Scholar] [CrossRef]
  26. Tang, Y.; Xu, K.; Zhao, B.; Zhang, M.; Gong, C.; Wan, H.; Wang, Y.; Yang, Z. A novel electronic nose for the detection and classification of pesticide residue on apples. RSC Adv. 2021, 11, 20874–20883. [Google Scholar] [CrossRef]
  27. Aghili, N. Detection of toxic and nontoxic sweet cherries at different degrees of maturity using an electronic nose. J. Food Meas. Charact. 2021, 9, 15. [Google Scholar]
  28. GB/T 41667-2022; Chemical Soil Column Leaching Test. The Standardization Administration of the People’s Republic of China: Beijing, China, 2022.
  29. Malhotra, E.S.; Rajdavinder, E. Review of Machine Learning and Data Mining Methods in Diabetes Research. 2018. Available online: https://www.researchgate.net/publication/339527204_Review_of_Machine_Learning_and_Data_Mining_Methods_in_Diabetes_Research (accessed on 10 March 2024).
  30. Wang, L.; Zhou, W.; Wang, H.; Parmar, M.; Han, X. A Novel Density Peaks Clustering Halo Node Assignment Method Based on K-Nearest Neighbor Theory. IEEE Access 2019, 7, 174380–174390. [Google Scholar] [CrossRef]
  31. Andrianomena, S. Probabilistic learning for pulsar classification. J. Cosmol. Astropart. Phys. 2022, 2022, 016. [Google Scholar] [CrossRef]
  32. Yan, J.; Guo, X.; Duan, S.; Jia, P.; Wang, L.; Peng, C.; Zhang, S. Electronic Nose Feature Extraction Methods: A Review. Sensors 2015, 15, 27804–27831. [Google Scholar] [CrossRef]
  33. Madson, N.; Gisele, R.; Jailson, D.A. Pesticides in the atmospheric environment: An overview on their determination methodologies. Anal. Methods 2018, 10, 4484–4504. [Google Scholar]
  34. Wang, P.; Fan, E.; Wang, P. Comparative Analysis of Image Classification Algorithms Based on Traditional Machine Learning and Deep Learning. Pattern Recognit. Lett. 2020, 11, 141. [Google Scholar] [CrossRef]
  35. Chen, K.; Liu, L.; Nie, B.; Lu, B.; Fu, L.; He, Z.; Li, W.; Pi, X.; Liu, H. Recognizing lung cancer and stages using a self-developed electronic nose system. Comput. Biol. Med. 2021, 131, 104294. [Google Scholar] [CrossRef]
  36. Bonah, E.; Huang, X.; Yi, R.; Aheto, J.H.; Osae, R.; Golly, M. Electronic nose classification and differentiation of bacterial foodborne pathogens based on support vector machine optimized with particle swarm optimization algorithm. J. Food Process. Eng. 2019, 42, e13236. [Google Scholar] [CrossRef]
  37. Tang, X.; Xiao, W.; Shang, T.; Zhang, S.; Han, X.; Wang, Y.; Sun, H. An Electronic Nose Technology to Quantify Pyrethroid Pesticide Contamination in Tea. Chemosensors 2020, 8, 30. [Google Scholar] [CrossRef]
  38. Tan, S.L.; Teo, H.S.; Garcia-Guzman, J.; Soc, I.C. E-nose Screening of Pesticide Residue on Chilli and Double-Checked Analysis through Different Data-Recognition Algorithms. In Proceedings of the 2010 IEEE Electronics, Robotics and Automotive Mechanics Conference, Cuernavaca, Mexico, 28 September–1 October 2010; IEEE: Piscataway, NJ, USA, 2010; pp. 592–596. [Google Scholar]
  39. Amkor, A.; Maaider, K.; El Barbri, N. Mint treatment day prediction using a multi-sensors system and machine learning algorithms. Sens. Actuators A: Phys. 2021, 328, 112787. [Google Scholar] [CrossRef]
  40. Wang, B.; Chen, D.; Weng, X.; Chang, Z. Development an electronic nose to recognize pesticides in groundwater. Talanta 2024, 269, 125506. [Google Scholar] [CrossRef]
  41. Chen, D.; Wang, B.; Zhang, T.; Chang, Z. Towards accuracy recognition and content estimation of typical pesticides in groundwater via electronic nose. Sens. Actuators A Phys. 2023, 362, 114642. [Google Scholar] [CrossRef]
Figure 1. Experimental soil preparation of the (a) pesticide dilution, (b) drip irrigation pesticides, and (c) soil leaching.
Agronomy 14 00766 g001
Figure 2. A self-developed electronic nose system. (a) The electronic nose system; (b) The sensor circuit’s schematic diagram.
Agronomy 14 00766 g002
Figure 3. A schematic diagram of the analysis method for pesticide residue data. (a) A framework diagram of the soil pesticide residue hybrid model. (b) The feature extraction method, and the (c) supervised learning classifier.
Agronomy 14 00766 g003
Figure 4. Confusion matrix for each detection model using MAX eigenvalues, (a) KNN (20–20) and (30–10), (b) RF (20–20), (c) RF (30–10), (d) SVM (20–20), (e) SVM (30–10), and (f) one-class SVM (40–0).
Agronomy 14 00766 g004
Figure 5. Effect of different numbers of training samples on the recognition of single-classification support vector machines.
Agronomy 14 00766 g005
Table 1. Model and basic parameters of the gas sensor.
NO.SensorTarget GasesMarker
1TGS2612Methane, LP, etc.Figaro
2TGS2611Methane, natural gasFigaro
3TGS2620Ethanol, organic solventsFigaro
4TGS2603Trimethylamine, methanethiol, etc.Figaro
5TGS2602Ammonia, hydrogen sulfide, etc.Figaro
6TGS2610LP, propane, butaneFigaro
7TGS2600Hydrogen, alcohol, etc.Figaro
8GSBT11Volatile organic gasesOgam
9MS1100Toluene, formaldehyde, benzene, etc.Ogam
10MP135Hydrogen, alcohol, carbon monoxide, etc.Winsen
11MP901Alcohol, smoke, formaldehyde, toluene, benzene, acetone, paint, etc.Winsen
12MP-9Carbon monoxide, methaneWinsen
13MP-3BAlcoholWinsen
14MP-4Methane, natural gas, methaneWinsen
15MP-5PropaneWinsen
16MP-2Propane, smokeWinsen
17MP503Alcohol, smoke, isobutane, formaldehydeWinsen
18MP801Benzene, toluene, formaldehyde, alcohol, smokeWinsen
19MP905Benzene, toluene, formaldehyde, alcohol, smoke, lighter gas, paintWinsen
20MP402Methane, natural gas, methaneWinsen
21WSP1110Nitrogen dioxideWinsen
22WSP2110Toluene, formaldehyde, benzene, alcohol, acetone, etc.Winsen
23WSP7110Hydrogen sulfideWinsen
24MP-7Carbon monoxideWinsen
25MP-702AmmoniaWinsen
26TGS2618Butane, LP gasFigaro
Table 2. The detected volatiles in pesticides.
Type of CompoundGlyphosateChlorpyrifosCyfluthrinDeltamethrinMancozebDithane
Alcohol1000134
Aromatic hydrocarbon223351838
Phenol000100
Halogenated hydrocarbon011000
Nitrile000001
Ether200002
Aldehyde100031
Ketone000012
Alkane80001110
Olefin000003
Amide001000
Ester200006
Other310133
Table 3. Soil pesticide residue pollution test results.
Training SamplesHealthy
Sample
Polluted
Sample
Healthy
Sample
Polluted
Sample
Healthy
Sample
Polluted
Sample
Detection Model 20203010400
KNN-FT100.0100.0-
RF-FT99.997.6-
SVM-FT99.998.7-
One-class SVM-FT--99.0
KNN-MAX100.0100.0-
RF-MAX99.999.5-
SVM-MAX99.098.6-
One-class SVM-MAX--99.2
KNN-Mean100.0100.0-
RF-Mean99.999.6-
SVM-Mean98.7100.0-
One-class SVM-Mean--99.3
KNN-WT100.0100.0-
RF-WT100.099.2-
SVM-WT97.6100.0-
One-class SVM-WT--99.4
Table 4. Identification results of the pesticide residue contamination type detection module using KNN, RF, and an SVM.
Feature Extraction MethodsFTMAXMeanWT
ClassifierKNN
Recognition rate(%)98.9896.9897.9298.23
ClassifierRF
Recognition rate(%)95.6398.1397.9298.23
ClassifierSVM
Recognition rate(%)95.4299.2799.2799.17
Table 5. The summary of papers on the application of electronic noses in pesticide detection.
Application ScenarioPesticide BrandsRecognition RatesReferences
TeaCyhalothrin; bifenthrin; fenpropathrin>88%[37]
CherriesDiazinon>100%[27]
ApplesCypermethrin; chlorpyrifos>94.64%[26]
ChiliProfenofos/[38]
MintMalathion>97%[39]
SoilGlyphosate; chlorpyrifo; deltamethrin; cyfluthrin; mancozeb; dithane z-78>92.5%[23]
SoilChlorpyrifos; cyfluthrin; dithane>93.75%[24]
GroundwaterGlyphosate; chlorpyrifos; deltamethrin; cyfluthrin; mancozeb; zineb>98.08%[40]
GroundwaterChlorpyrifos; malathion; chlorothalonil; lindane>99.29%[41]
Disclaimer/Publisher’s Note: The statements, opinions and data contained in all publications are solely those of the individual author(s) and contributor(s) and not of MDPI and/or the editor(s). MDPI and/or the editor(s) disclaim responsibility for any injury to people or property resulting from any ideas, methods, instructions or products referred to in the content.

