Article

Phenotyping Seedling Root Biometry of Two Contrasting Bread Wheat Cultivars under Nutrient Deficiency and Drought Stress

1
Council for Agricultural Research and Economics, Research Centre for Animal Production and Aquaculture (CREA-ZA), 85051 Bella Muro, Italy
2
School of Agriculture, Forestry, Food and Environmental Sciences, University of Basilicata, 85100 Potenza, Italy
3
Council for Agricultural Research and Economics, Research Centre for Cereal and Industrial Crops (CREA-CI), 71122 Foggia, Italy
*
Author to whom correspondence should be addressed.
Agronomy 2024, 14(4), 775; https://doi.org/10.3390/agronomy14040775
Submission received: 7 March 2024 / Revised: 4 April 2024 / Accepted: 8 April 2024 / Published: 9 April 2024

Abstract

:
Roots play a key role in withstanding wheat abiotic stress. In this work, we phenotyped seedling root morphology of two semi-dwarf bread wheat cultivars, the Chinese cv Lankaodali and the Italian cv Rebelde, under the hypothesis that these two genotypes have contrasting root traits and could be used as donors in breeding programs. Root development was compared in a semi-hydroponic screening, where full-strength (FS) vs. half-strength (HS) complete Hoagland’s solution represented high and moderate nutrient availability, and a screening comparing HS solution with tap water corresponding to a condition of nutrient starvation. Genotypes were further compared in soil under full watering (100% of field capacity) vs. drought stress (50% of field capacity). Lankaodali outperformed Rebelde by producing 50% more leaf mass and 70% more root mass in FS solution, 125% more leaf mass and 106% more root mass in HS solution, and 65% more leaf mass and 36% more root mass under nutrient starvation. This cv also showed a positive correlation between leaf mass and root length and mass (between r = 0.82–0.9 and r = 0.83–0.87, respectively, p < 0.05). In the soil screening experiment, Lankaodali produced more biomass than Rebelde regardless of water availability, 48% more leaf mass, 32% more root mass, and 31% more absolute rhizosheath mass (average across water availability treatments). Lankaodali proved to be more responsive than Rebelde to both water and nutrient availability. High values of broad-sense heritability—ranging between 0.80 for root mass and 0.90 for length in a hydroponic screen and 0.85 for rhizosheath size in soil—indicate that these traits could be useful for breeding.

1. Introduction

Wheat (Triticum aestivum L. 2n = 6x = 42, AABBDD) is one of the most important cereal crops to meet the food needs of the world population. Globally, more than 2.5 billion people depend on wheat-based products, and for 35% of the population, wheat is a staple food [1]. In 2020, worldwide wheat production reached a significant milestone, totaling 760 million tons. Up to 41% of wheat global production is supplied by China, India, and Russia [2]. Global warming, as a result of climate change, is affecting wheat yield worldwide, thus increasing food insecurity and poverty in developing countries. Crop models predict an average decline in grain yields of 15% in African countries and 16% in South Asian countries by the mid-century [3]. According to these studies, climate change will reduce global wheat production by 1.9% by the mid-century, with the most negative impacts occurring in Africa and South Asia. Under the current scenario a very important breeding objective is achieving improved wheat varieties with a better resource-use efficiency and specifically adapted traits to low-input environments. In particular, exploring genotypic diversity and phenotypic plasticity in root traits could be crucial for selecting wheat ideotypes under climate change [4,5].
Wheat develops seminal roots first; these roots stay active throughout the plant’s life and play an important role in early vigor and water uptake from deep soil strata. In drought-prone environments, a high number of seminal roots descending with a narrow gravitropic angle are more efficient in extracting water from deep soil [6]. At later stages, deep water extraction may be crucial under terminal drought stress, when even a little extra water (10 mm) after flowering is very valuable since during grain filling, water use efficiency is at its maximum [7]. Bread and durum wheat varieties with larger root systems have shown a higher grain yield than varieties with smaller root systems in rainfed experiments carried out in Europe [8,9]. Root system size and morphology are also important traits for nutrient uptake: large root density and specific root length result in higher nutrient acquisition efficiency [5,10]. Beneficial root traits for abiotic stress resistance include root anatomical modifications [11]; plants that can actively modulate the biosynthesis and deposition of suberin in root endodermis and exodermis prevent radial water losses [12,13]. Ouyang et al. [14] highlighted how the suberization, lignification, and thickening of the endodermis of rice and wheat roots increased with the increase in water deficit and resulted in stronger radial barriers for the outflow of water. A further seedling root trait that is raising attention for selecting drought-tolerant phenotypes is the rhizosheath. It is commonly defined as the mass of root-adhering soil after roots are pulled out of soil and shaken [15,16,17]. First observed in desert plants [18,19], it is widely distributed along angiosperms [20], including wheat [21]. Composed of root hairs, root exudates, and root and bacterial mucilages, this heterogeneous hydrophilic matrix traps and binds soil particles around the root, facilitating root–soil contact and anchorage, protecting the root tips from dehydration [22]. Wheat genotypes with a large rhizosheath size have been shown to keep up with high transpiration rates during a dry period better than varieties with a small rhizosheath [23]. The rhizosheath facilitates nutrient uptake [24,25] and is considered a hot-spot of microbial diversity, playing a role in microbial recruitment and stabilizing micro-organism communities by reducing soil moisture fluctuation around the roots and thus increasing system resilience during stress events [26]. Since a rhizosheath is a highly heritable trait, it is also interesting for breeding [17].
In recent years, studies conducted on plant roots have grown significantly through the use of the most recent high-throughput phenotyping technologies for the image analysis and quantification of root systems [27]. The new phenotyping systems have given new boots to the understanding of the genetic and physiological mechanisms regulating root development, and this has opened new perspectives for incorporating root traits in improved wheat varieties.
However, many of these traits have quantitative genetic bases, strongly influenced by interacting genetic and environmental factors (i.e., climate, soil, agronomic management), representing a challenge for the selection of new varieties. In a previous study, two semi-dwarf bread wheat cultivars—namely the Chinese cv Lankaodali and the Italian cv Rebelde—were found to be different in above-ground phenotypic traits (i.e., plant height, juvenile growth habit, heading date, fertile tiller number, and total tiller number) and used as parents to develop a recombinant inbred line (RIL) population. This was genotyped using a single-nucleotide polymorphism (SNP) array platform and a next-generation sequencing (NGS) method to map genetic loci controlling the traits of agronomic interest [28,29]. We conducted a study in order to test the hypothesis that the two parental cultivars, Lankaodali and Rebelde, also exhibit differences in root traits since this might provide the basis for future work on the derived RIL population in order to identify the genetic bases of individual root phenes.

2. Materials and Methods

2.1. Plant Material

Experiments were conducted on bread wheat (Triticum aestivum L.) cultivars Lankaodali and Rebelde. Lankaodali is a Chinese bread wheat cultivar with very large kernels, low tillering capacity, and a medium flowering time. Rebelde is an Italian hard winter wheat cultivar with excellent technological quality traits, medium–late flowering time, and high tillering capacity [28].

2.2. Experiment 1—Starvation vs. Moderate Nutrient Availability in Semi-Hydroponic System

Seedling root growth was evaluated in response to two nutrient supply levels: moderate nutrient availability (HS) supplied by fertilizing plants with a half-strength Hoagland’s solution (Hoagland’s n. 2 basal salt mixture, Sigma Aldrich (St. Louis, MI, USA) [https://www.sigmaaldrich.com/IT/it/product/sigma/h2395, URL accessed on 1 April 2024]) vs. nutrient starvation (NS) obtained using tap water only. Uniform seeds of both species were selected based on median seed weight (Lankaodali median seed weight = 0.0639 g, standard deviation = 0.0098, Rebelde median seed weight 0.03155 g, standard deviation = 0.0037). Seeds were surface-sterilized with 0.6% Na-hypochlorite solution for 2 min, then rinsed three times with sterile distilled water and pre-germinated for 24 h in petri dishes (10 cm diameter) on moistened blotting paper. Plants were grown on germination paper (Anchor germination paper sheets of 25.4 × 38.1 cm, from Hoffman Manufacturing Inc., Albany, OR, USA) following the methodology used by [30]. The top of the sheet was folded (about 2 cm) to make a crease for the seed, and one seed, t, was placed in the mid-section of each sheet with the radicle facing down; sheets were then sprayed with water and rolled tightly to form an empty cylinder. Each roll was immersed in water or nutrients solution for the NS and HS treatments, respectively, and then placed in opaque PVC pots (16 cm diameter, 40 cm height). The pot was filled with 650 mL water of nutrient solution for the NS and HS treatments, respectively, in order to keep rolls moistened through capillary rise. Water/nutrient solution was changed after one week. Plants were grown for 11 days under artificial lighting (Mars Hydro 400 W LED Grow Lights Full Spectrum Plant Lamp, PAR = 600 µmol m−2 s−1), at an average temperature of 21 °C and an average relative humidity (min T °C 15.3 during the night, max T °C 25.6 during the day) of 40.35%. Random rolls were periodically checked to see if roots had reached the bottom of the pot. At the end of the experiments, rolls were opened and the following traits were determined: primary root length, the total number of seminal roots, the length of the longest leaf, and the total number of leaves. Roots were then separated from shoots and scanned using STD 4800 Image Acquisition System at 600 DPI, and image analysis was performed with the WinRhizo ArabidopsisV2009c image analysis software (Regent Instruments Inc., Québec, QC, Canada) to determine root length, diameter, volume, and projected area. Finally, the shoots and roots were oven-dried for 2 days at 70 °C and weighed. The following additional root parameters were calculated:
Specific root length = root length /root mass (cm g−1)
Root tissue density = root volume/root mass (cm3 g−1)
Root-to-shoot ratio = root mass/shoot mass (g g−1)

2.3. Experiment 2—High vs. Moderate Nutrient Availability in a Semi-Hydroponic System

Seedling root growth was evaluated in response to two nutrient supply levels: high nutrient availability (HS) supplying full-strength Hoagland solution vs. moderate nutrient availability (HS) corresponding to half-strength Hoagland solution. The same protocol described in Section 2.2 was followed. Plants were grown for 12 days at 22.94 °C average T (min T °C 15.3 during the night, max T °C 25.6 during the day) and 40.35% relative humidity.

2.4. Experiment 3—Rhizosheath Formation and Root Architecture in Response to Drought Stress

Plants were grown in cylindrical pots of 25 cm length and 2.8 cm diameter filled with 155.0 g of a field-collected silty loam soil with the following characteristics: sand (50–2000 μm) 43.6%, silt (2–50 μm) 34.2%, clay (<2 μm) 22.1%., pH 6.8; N 1.9 g kg−1; phosphates (P2O5) 50.3 g kg−1; and potassium oxide (K2O) 1430 g kg−1.

2.4.1. Water Supply Treatments

Two treatments with six replications were set on the basis of soil water content in pots:
(i) Well-watered control (WW) where potting soil was brought to field capacity. (ii) Drought stress (DS) where potting soil was brought to 50% of field capacity.
Field capacity was determined as the water retained at −0.033 MPa (in a pressure plate). Treatments were as follows:

2.4.2. Seedling Growth Conditions

Seeds selected for weight uniformity are described in Section 2.2 pre-germinated on filter paper with distilled water for 24 h and then planted in pots. Pots were arranged randomly in a custom-built growth cabinet (see experiment one for the lighting system) and grown until the 3rd leaf was fully expanded (stage 13 of Zadoks phenological scale) [31] [at average T = 22.94 °C (average night temperature of 22.2 °C, average day temperature of 23.37); average relative humidity of 46.06% to simulate germination in high-temperature conditions]. Pots were irrigated with 2 mL every 3 days in order to simulate night condensation during emergence without refilling the soil profile.

2.4.3. Measurements

Biometric measurements: plant height to the uppermost internode and the tip of the last fully expanded leaf were measured. Plants were clipped at the soil level. Leaves were cut at the node and scanned with STD 4800 Image Acquisition Systemat 1200 DPI. Leaf area was then measured on scanned images using WinRhizo (WinRhizo ArabidopsisV2009c image analysis software, Regent Instruments Inc., Québec, QC, Canada). Above-ground plant fresh and dry (after oven drying at 70 °C until constant weight) biomass was determined. The bottom of the pots was removed, and the soil was gently pushed from the bottom. On three replications, the root system was extracted by washing it over a mesh of 0.5 mm and placed in a transparent tray (200 × 250 mm) with a 4 mm to 5 mm deep layer of water and scanned with STD 4800 Image Acquisition Systemat 600 DPI. After scanning, roots were blotted and weighed to obtain the fresh root mass, then oven dried at 70 °C until constant weight to obtain the root dry mass. Root morphology was determined with the same image analysis software mentioned for the leaf area. The following traits were measured: total length (cm), surface area (cm2), mean diameter (mm), and volume (cm3). The root depth potential was measured as the maximum length of a root axis. All parameters were assessed on a plant basis. We then calculated root-to-shoot biomass ratio (g g−1), root depth-to-plant height ratio (cm cm−1), leaf-to-root area ratio (cm2 cm−2), root mass-to-volume ratio (root tissue density g cm−3), biomass-to-leaf area ratio (g cm−2), and shoot height-to-root depth ratio (cm cm−1). On three replications, the mass of rhizosheath soil was determined as follows: the root system was held by the plant basis and gently shaken free from bulk. The soil that remained attached to roots after shaking was considered rhizosheath soil. The rhizosheath–root complex was then weighed to determine the fresh mass (RRhizFM g plant−1), oven-dried at 105 °C, and weighed again to obtain the dry mass (RRhizDM g plant−1). Roots were thereafter washed over a 0.5 mm mesh, blotted, and weighed to obtain the fresh root mass (RFM g plant−1), then oven dried at 70 °C until constant weight to obtain the root dry mass (RDM g plant−1). The rhizosheath soil fresh (RhizFM) and dry (RhizDM) mass, and the “True rhizosheath” were then calculated as follows:
  • RhizFM = RRhizFM – RFM g plant−1;
  • RhizDM = RRhizDM − RDM g plant−1;
  • True rhizosheath: RhizDM/RDM g g−1.
As a consequence of the described procedures, we had 6 replicated for the following variables: plant height, shoot dry mass, root dry mass, and derived indices; the number of replicates was 3 for root length, surface area, diameter, volume, RhizFM, RhizDM, true rhizosheath, and derived indices.

2.5. Statistical Analysis

All the analyses were carried out within the R environment for statistical analysis [R Core Team (2021), R: A language and environment for statistical computing, R Foundation for Statistical Computing, Vienna, Austria, URL https://www.R-project.org/, accessed on 6 March 2024]. For all of the three screens, biometric data were analyzed within the framework of genotype by environment (GxE) analysis using the R library “statgenGxE” [32]. Two-way means tables were obtained computing two models: 1. a fully fixed model (Two-way ANOVA with interaction) and 2. a fully random model.
A fully fixed model was computed, all model terms are fixed, with the exception of the random error term:
Y i j = μ + G i   + E   j   + G E I i j   + ε i j
Yij, the response variable, is the mean of genotype i in environment j as a function of μ, a common fixed intercept term; Gi, a fixed genotypic main effect corresponding to genotype I; Ej, a fixed environmental main effect corresponding to environment j; GEIij, genotype-by-environment interaction term; and, finally, εij, the error term, typically assumed to be normally distributed, with a mean of zero and constant variance σ2; εij~N(0, σ2).
A fully random model, all model terms are included as random terms (terms are underlined to indicate that they are random).
Y i j = G _   i + E _   j   + ε _   i j  
Based on the variance components of this model, the magnitude of the variance of the genotypic main effect (σ2G) and of the variance of the environmental effect (σ2E) in relation to the sum of GEI and error (σ2ε) gives the importance of both the genotype and the environment.
The variance components were used to estimate broad-sense heritability. Broad-sense heritability (H2) is defined as the proportion of phenotypic variance that is attributable to an overall genetic variance for the genotype [33]. Heritability is calculated dividing the total genetic variance by the total phenotypic variance.:
H 2 =   σ G 2 σ G 2 + σ E 2 + σ ε 2  
The Finlay–Wilkinson analysis is used to describe genotype by environment interaction, assessing how the expected performance of a genotype varies as a function of the environmental effects; this is achieved by regressing the performance of each genotype on the environmental means [34]. Finlay–Wilkinson analysis was computed to assess the responsiveness of cultivars to the different environments; the analysis was done using R package ‘FW’ [35]. Post hoc mean comparison tests for the fully fixed models were carried out by computing post hoc Tukey test (p < 0.05). Finally, correlation matrixes were calculated to estimate the Pearson’s correlation coefficient among shoot and root biometric parameter data from different nutrient levels, which were pooled for individual cultivars. Regression analysis was computed to model the bivariate relationships between shoot and root biometrics, separating cultivar and nutritional treatment effects.

3. Results

3.1. Experiment 1—Starvation vs. Moderate Nutrient Availability in Semi-Hydroponic System

Experiment 1 aimed at comparing the shoot and root development of the two cultivars under two nutritional statuses: moderate nutrient availability (supplying the seedlings with half-strength Hoagland’s solution) and nutrient starvation, growing seedlings on tap water only. At the end of the experiment, shoot and root biometry was measured, and treatments were compared by computing a two-way ANOVA with the interaction. Table 1 reports the ANOVA results for experiment 1 along with the variance components, the results of the Finlay–Wilkinson Analysis used to assess genotype responsiveness to the environment, and the estimate of the broad-sense heritability.
The genotypic effect was significant for most traits and was associated with high values of broad-sense heritability (always above 80%) for all root traits, including specific root length and diameter, which proved to be constitutive traits of the two cultivars. The Finlay–Wilkinson analysis (Table 1) showed that Lankaodali was more responsive than Rebelde for most traits since shoot and root production sharply increased under a higher nutrient supply. Rebelde produced less biomass than Lankaodali under both nutritional regimens and was more stable across treatments. Figure 1 reports the bar plots of the mean values of shoot and root traits in response to the experimental treatments as main effects or in interaction between each other. Nutrient availability as a main effect (values averaged across genotypes) significantly affected the root–shoot ratio and root tissue density (p < 0.05), which increased under starvation in both genotypes. The specific root length was stimulated by moderate nutrient availability though differences between means and did not attain statistical significance (p = 0.06) (Figure 1a). Lankaodali outperformed Rebelde at both nutrient levels in terms of above- and below-ground productivity (Figure 1b), with a significant GxE interaction for leaf mass, root mass, and length (Figure 1c).
Lankaodali was much more productive than Rebelde under moderate nutrient availability since it developed 125% more leaf mass and 106% more root mass when grown supplying half-strength Hogland’s solution. Nutrient deficiency substantially hampered growth in Lankaodali; the leaf mass was halved (46% less), while Rebelde was proportionally less impacted (27% less leaf mass). The same trend was followed by roots with 26% less root mass and 28% less root length in Lankaodali, whereas the belowground productivity of Rebelde was almost unaltered or slightly increased (12% more root mass). Even under starvation, Lankaodali’s size was larger than Rebelde since it developed 65% more leaf mass, 60% more root length, and 36% more root mass. The root-to-shoot ratio increased under starvation from 0.6 to 0.8 (average across genotypes) and was higher in Rebelde (0.7) than in Lankaodali (0.61) (average across nutritional status). Specific root length was significantly higher in Lankaodali (average across treatments). In Lankaodali only, there was a significant correlation between shoot and root traits, while in Rebelde, there was only a weak correlation between root length and leaf mass (Table 2).
Biplots in Figure 2 show that for Lankaodali, a correlation was found between leaf mass and both root length (Figure 2 left) and root mass (Figure 2 right) under both nutritional levels, while in Rebelde, there was a positive trend under moderate nutrient availability only. In Lankaodali, there was also more scattering within each treatment.

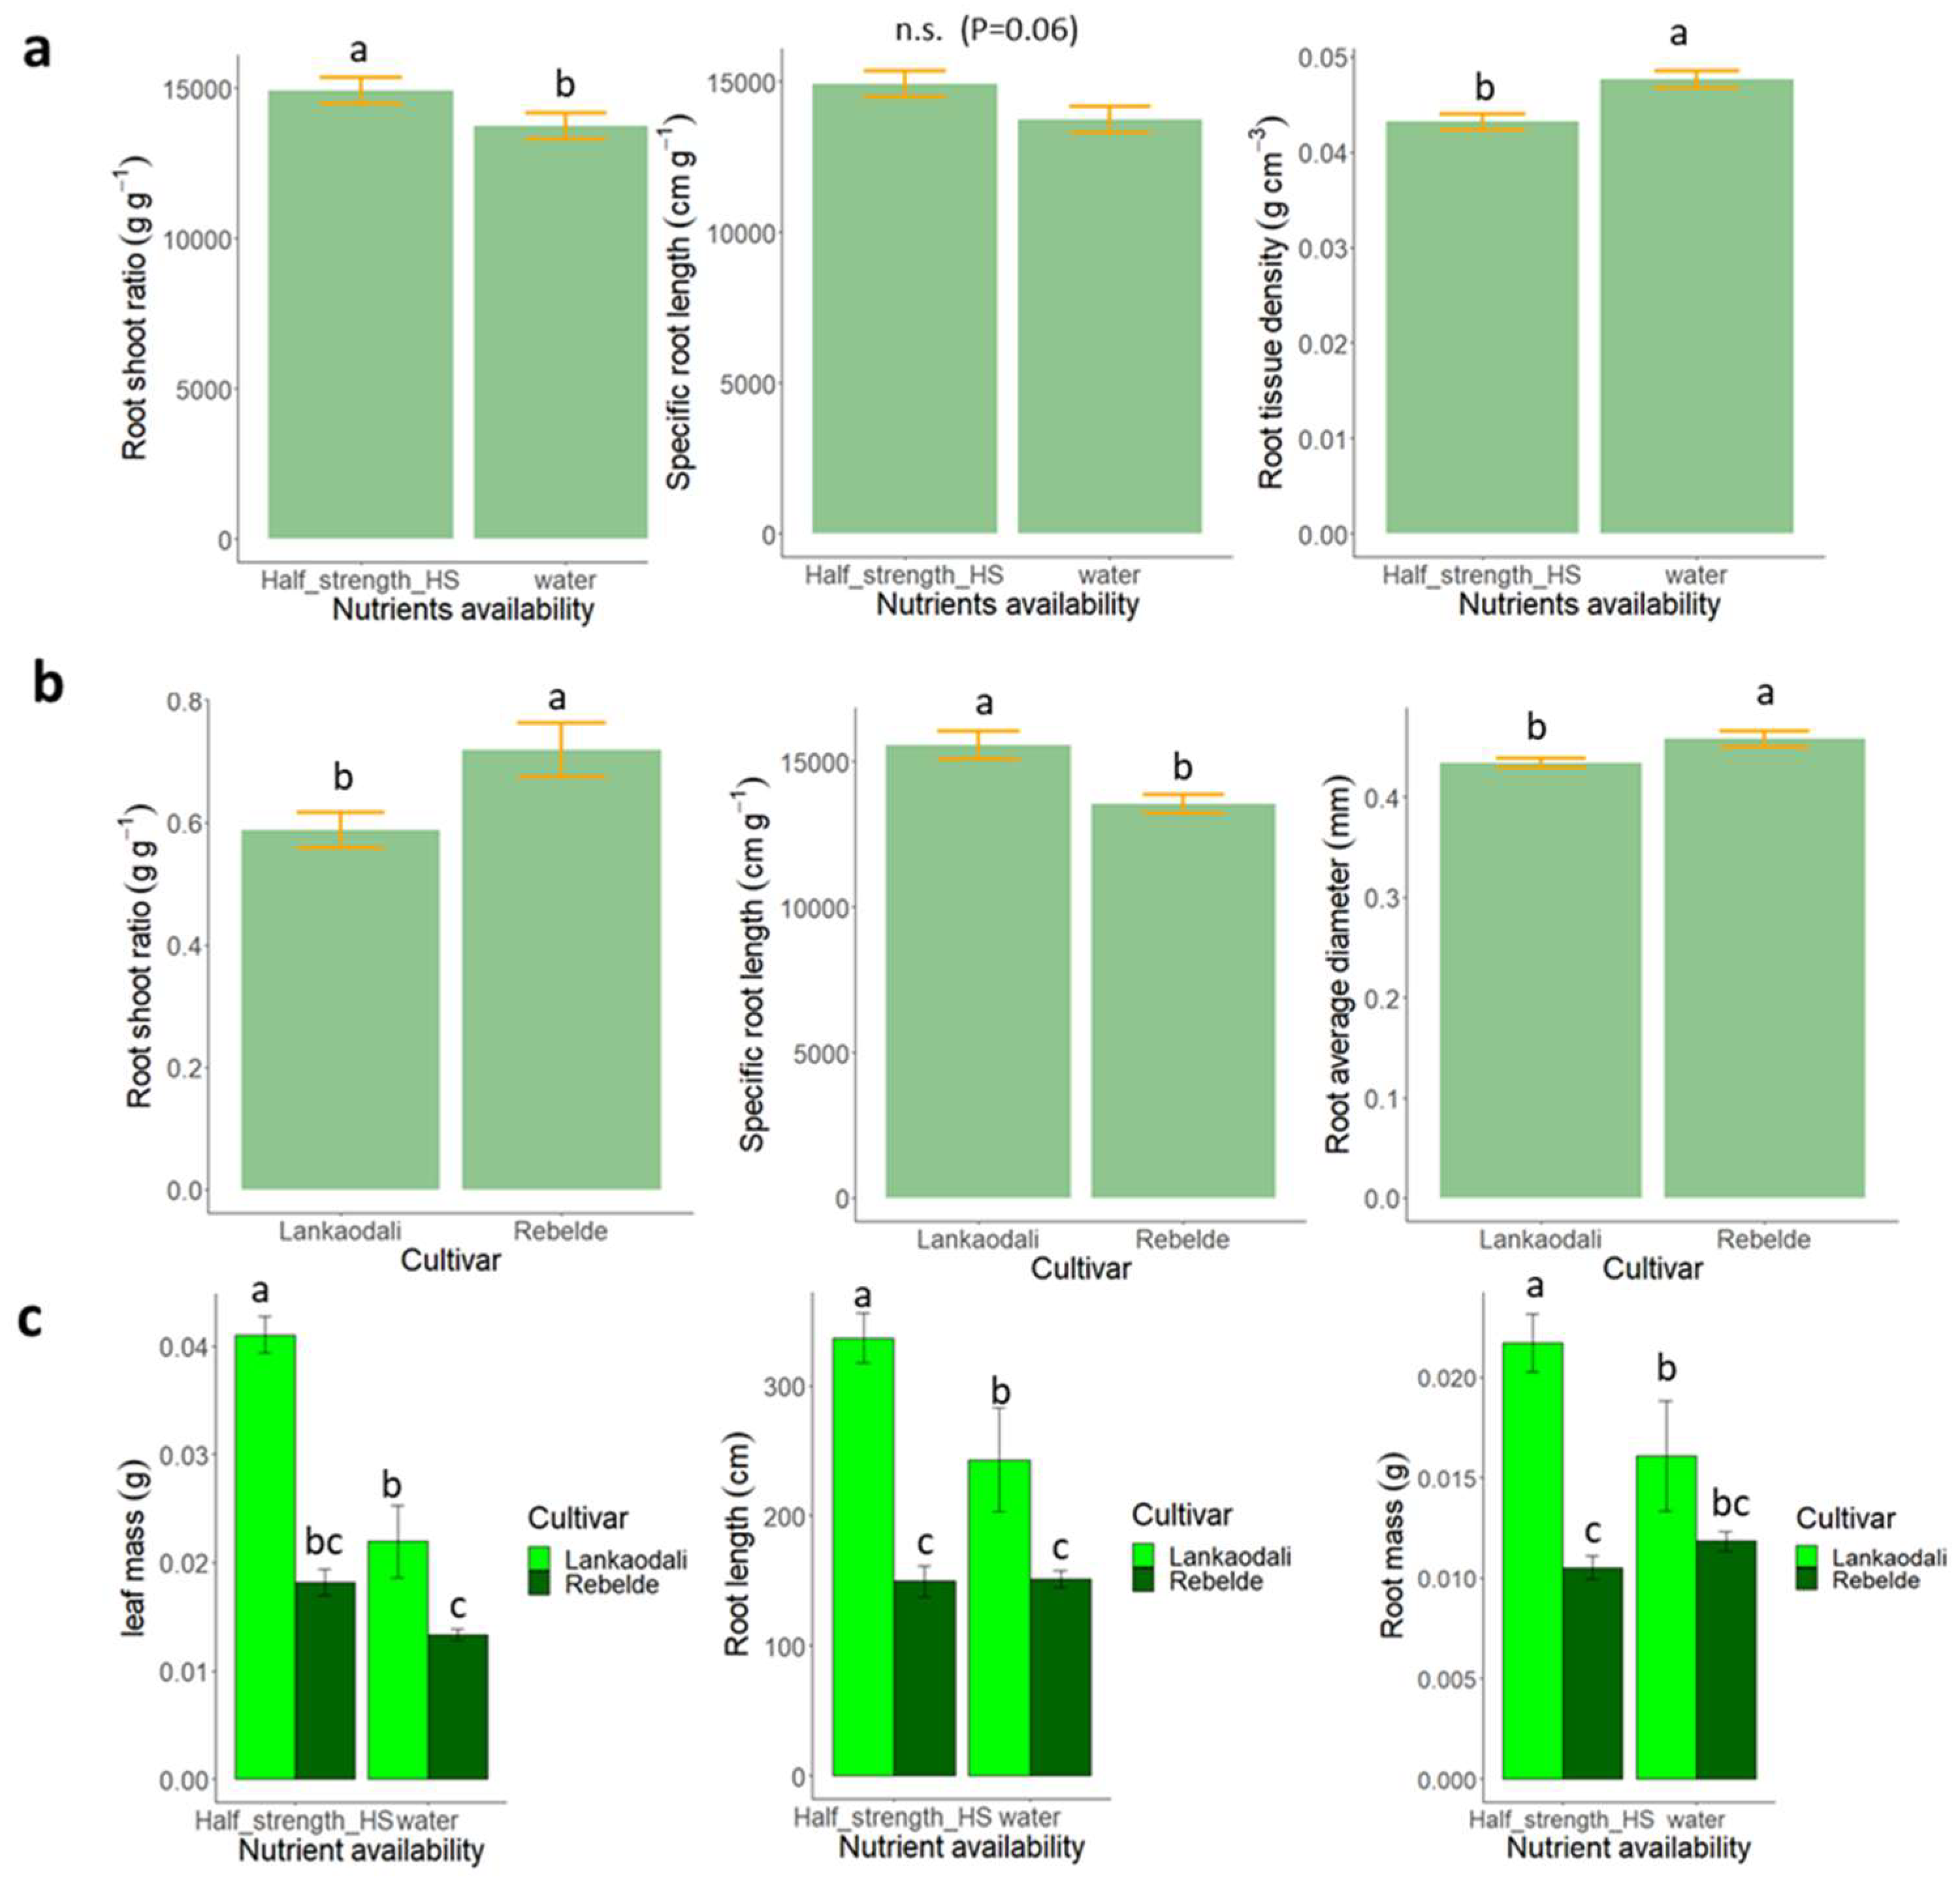
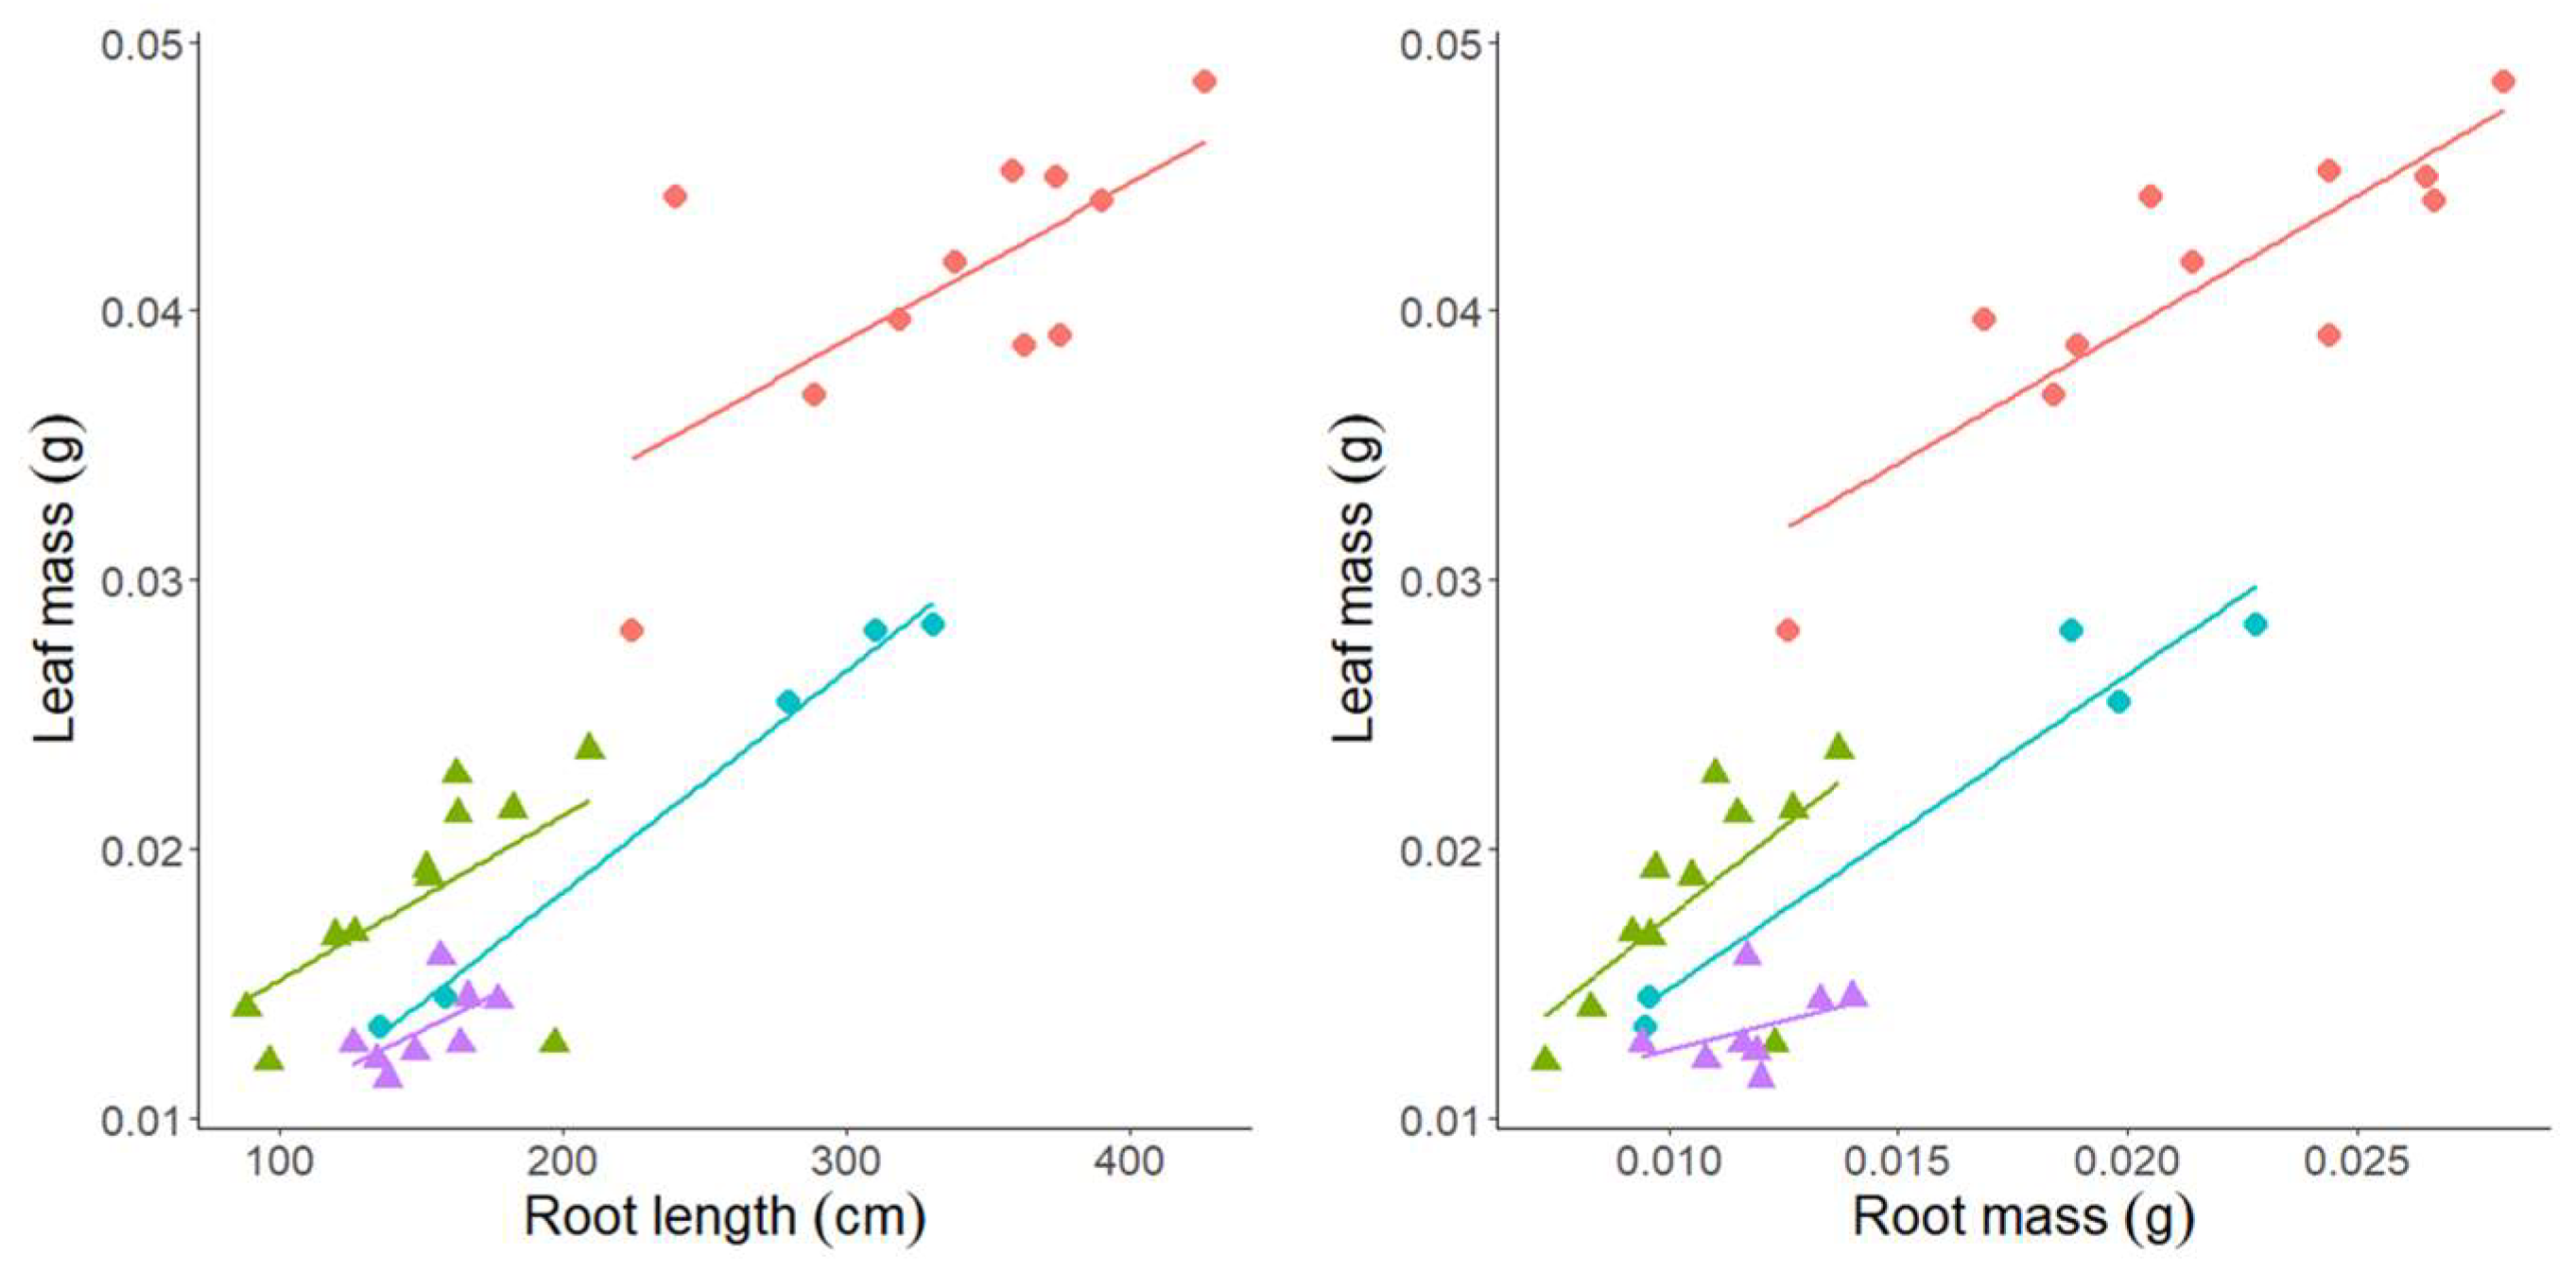
3.2. Experiment 2—High vs. Moderate Nutrient Availability in Semi-Hydroponic System

The experiment 2 was conducted using the same experimental setup of experiment 1 (semi-hydroponic screening in paper rolls), but in this case, the experiment was aimed at comparing seedling shoot and root growth growing under optimal nutrient availability (corresponding to the nutrient concentration of a full-strength Hoagland’s solution) vs. under a moderate nutrient availability (corresponding to the nutrient concentration of a half-strength Hoagland’s solution).
Table 3 shows the ANOVA results for the shoot and root traits of experiment 2. Increasing the nutrient availability from half-strength to full-strength Hoagland’s solution showed a limited effect on shoot and root growth. It only affected coleoptile length and primary root length (which was slightly lower under full strength), root volume and root-to-shoot area and mass ratio. Differences between genotypes were significant for most traits and were consistent with the previous experiment. The only significant GxE interaction was found for leaf area-to-root area ratio.
Average values for shoot and root traits are reported in Table 4.
Lankaodali was more vigorous than Rebelde, developing more shoot and root mass area. The coleoptile length was 26% longer than that of Rebelde. The largest differences between genotypes were found in the shoot Lankaodali developed (56% and 57% more leaf mass and leaf area, respectively) and root mass and area (68% and 73% more, respectively) (average across treatments). Lankaodali invested more in roots than Rebelde, with a root-to-shoot area ratio of 13% larger on average across the treatment. Rebelde showed a higher root tissue density (more than 7%, values averaged across treatments). The number of seminal roots did not differ significantly, but there is a trend for 6 vs. 4 seminals for Lankaodali and Rebelde, respectively. Consistently with the previous screen, Lankaodali showed a positive correlation between shoot and root traits (Table 5). Figure 3 shows the bivariate linear correlation between leaf area and root length.
Although the cultivar × nutrient supply interaction was not significant for the root length scatterplot in Figure 3, it shows a positive linear correlation between leaf area and root length for Lankaodali; this cultivar appears more responsive than Rebelde to the shift in nutrient availability since shoot and root parameters increase more under higher nutrient availability. The two treatments can be clearly separated at the graphical level.

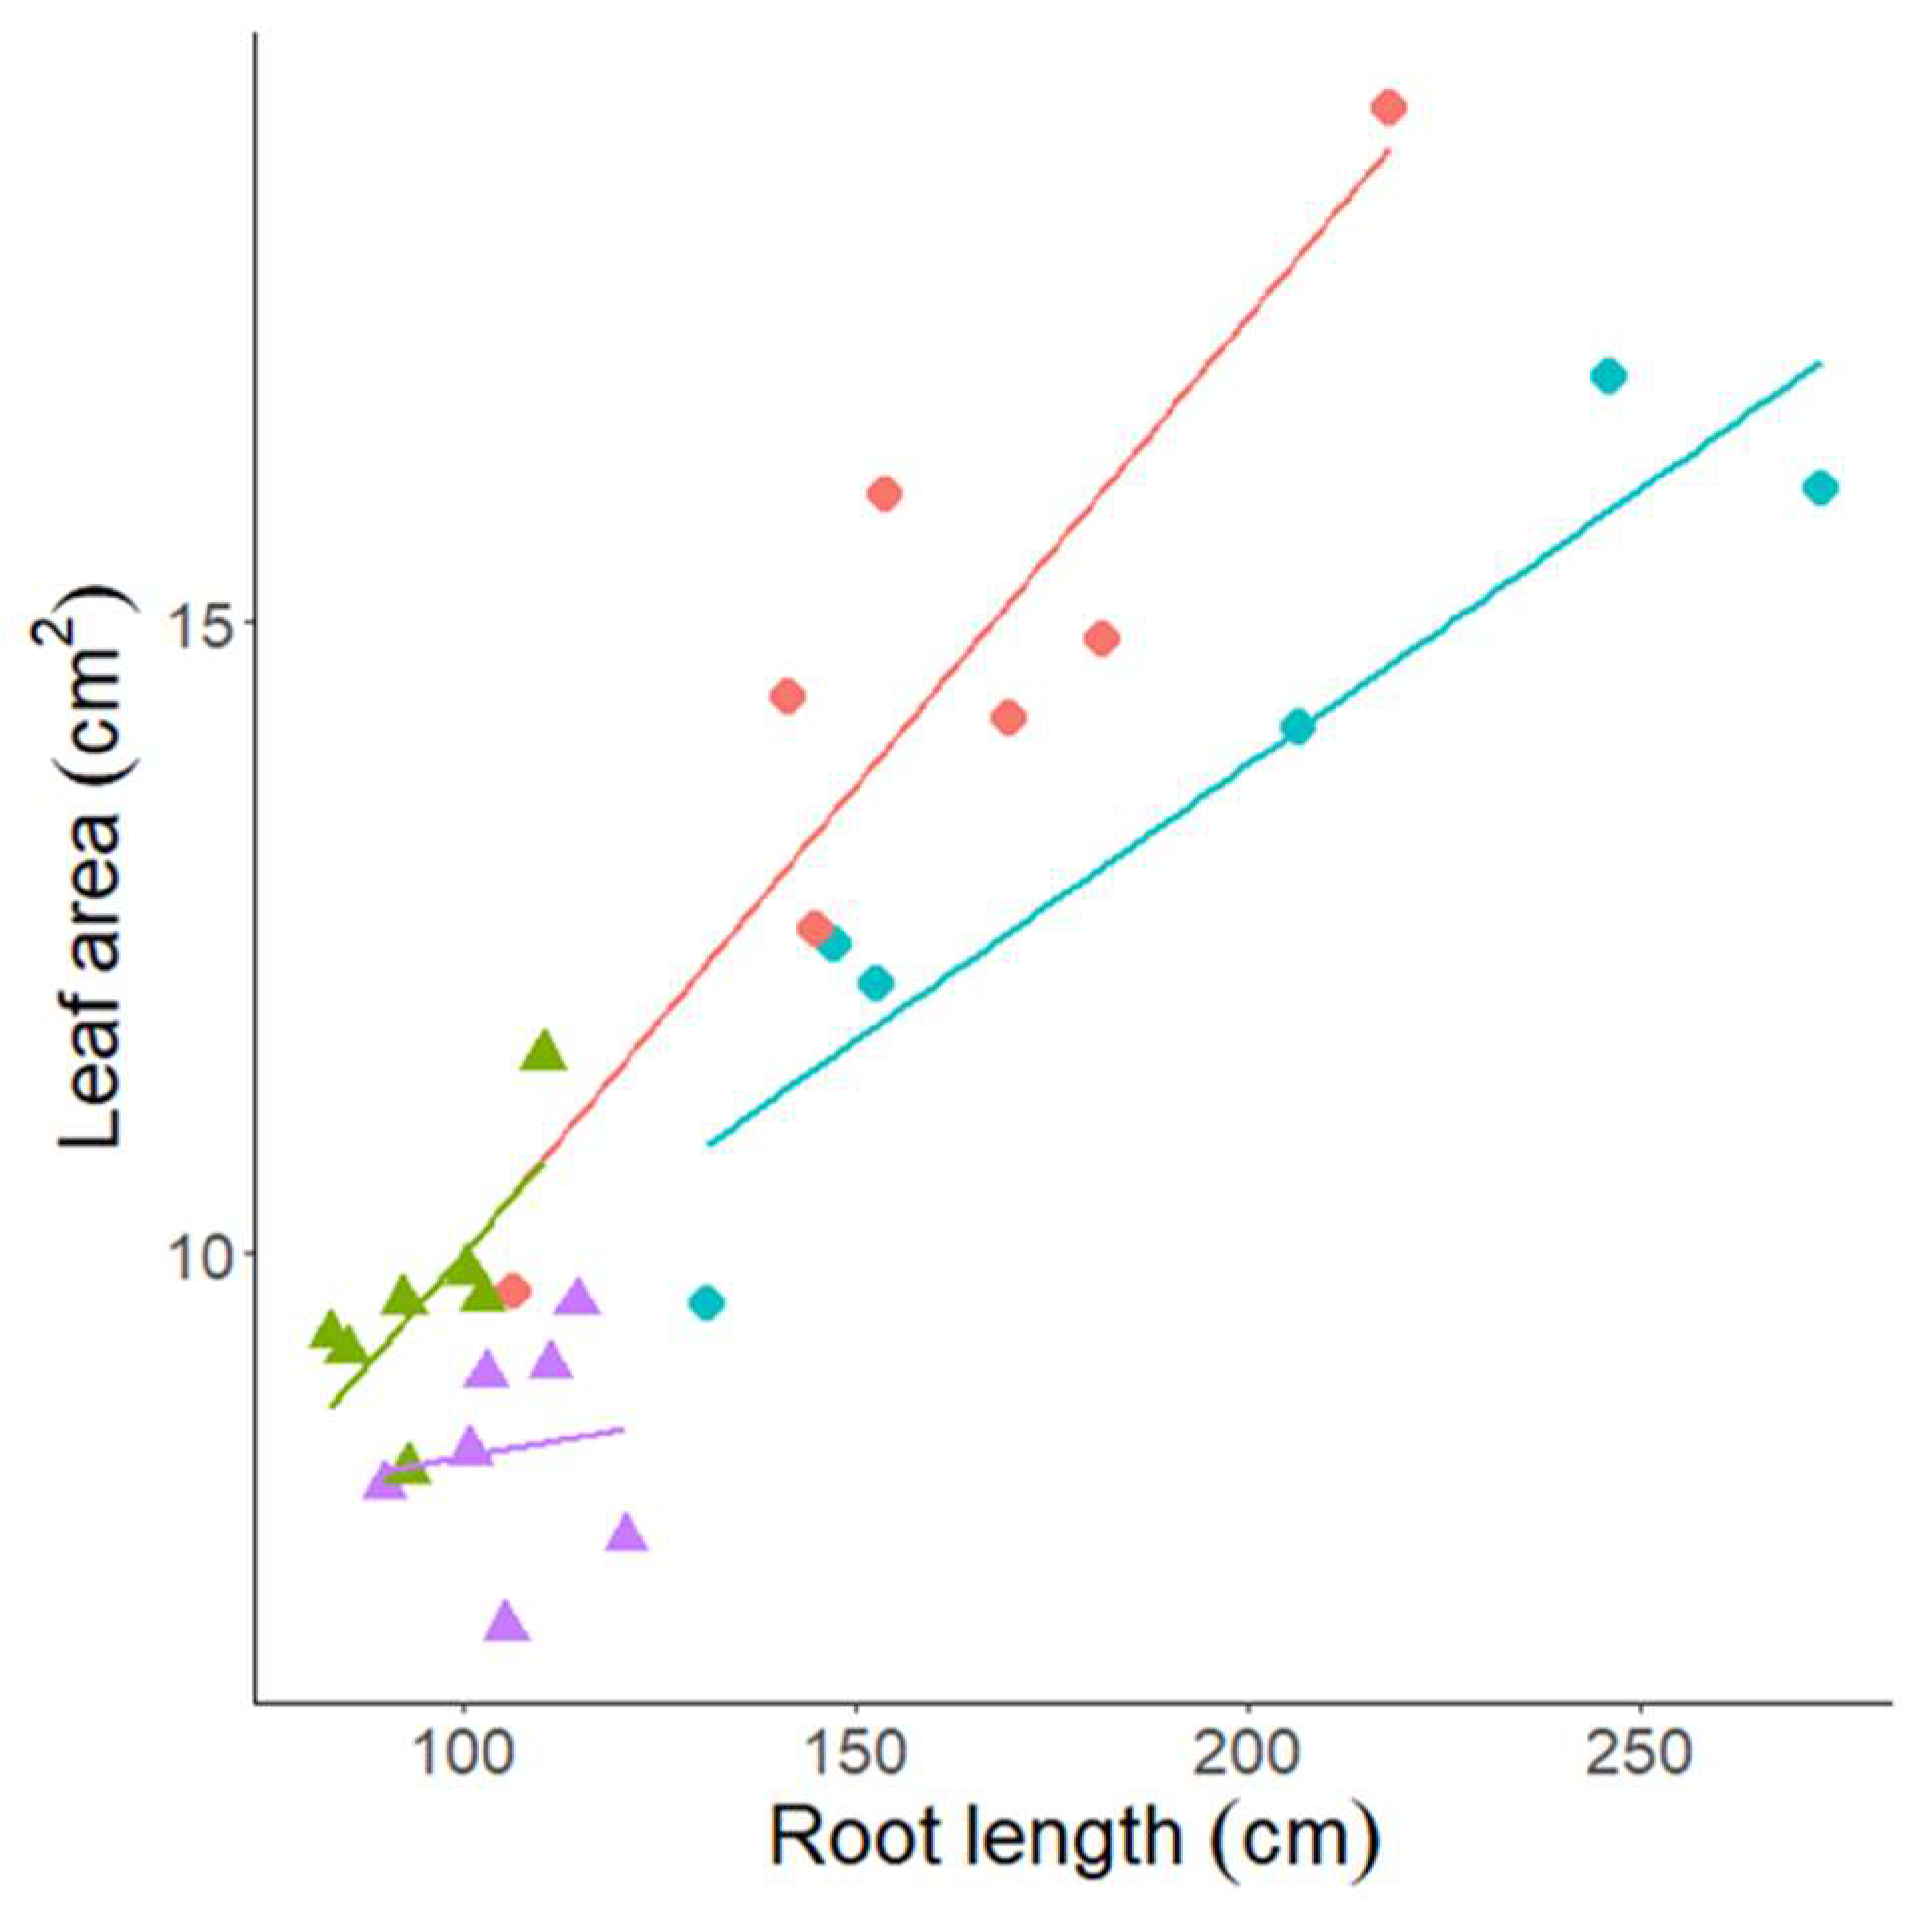
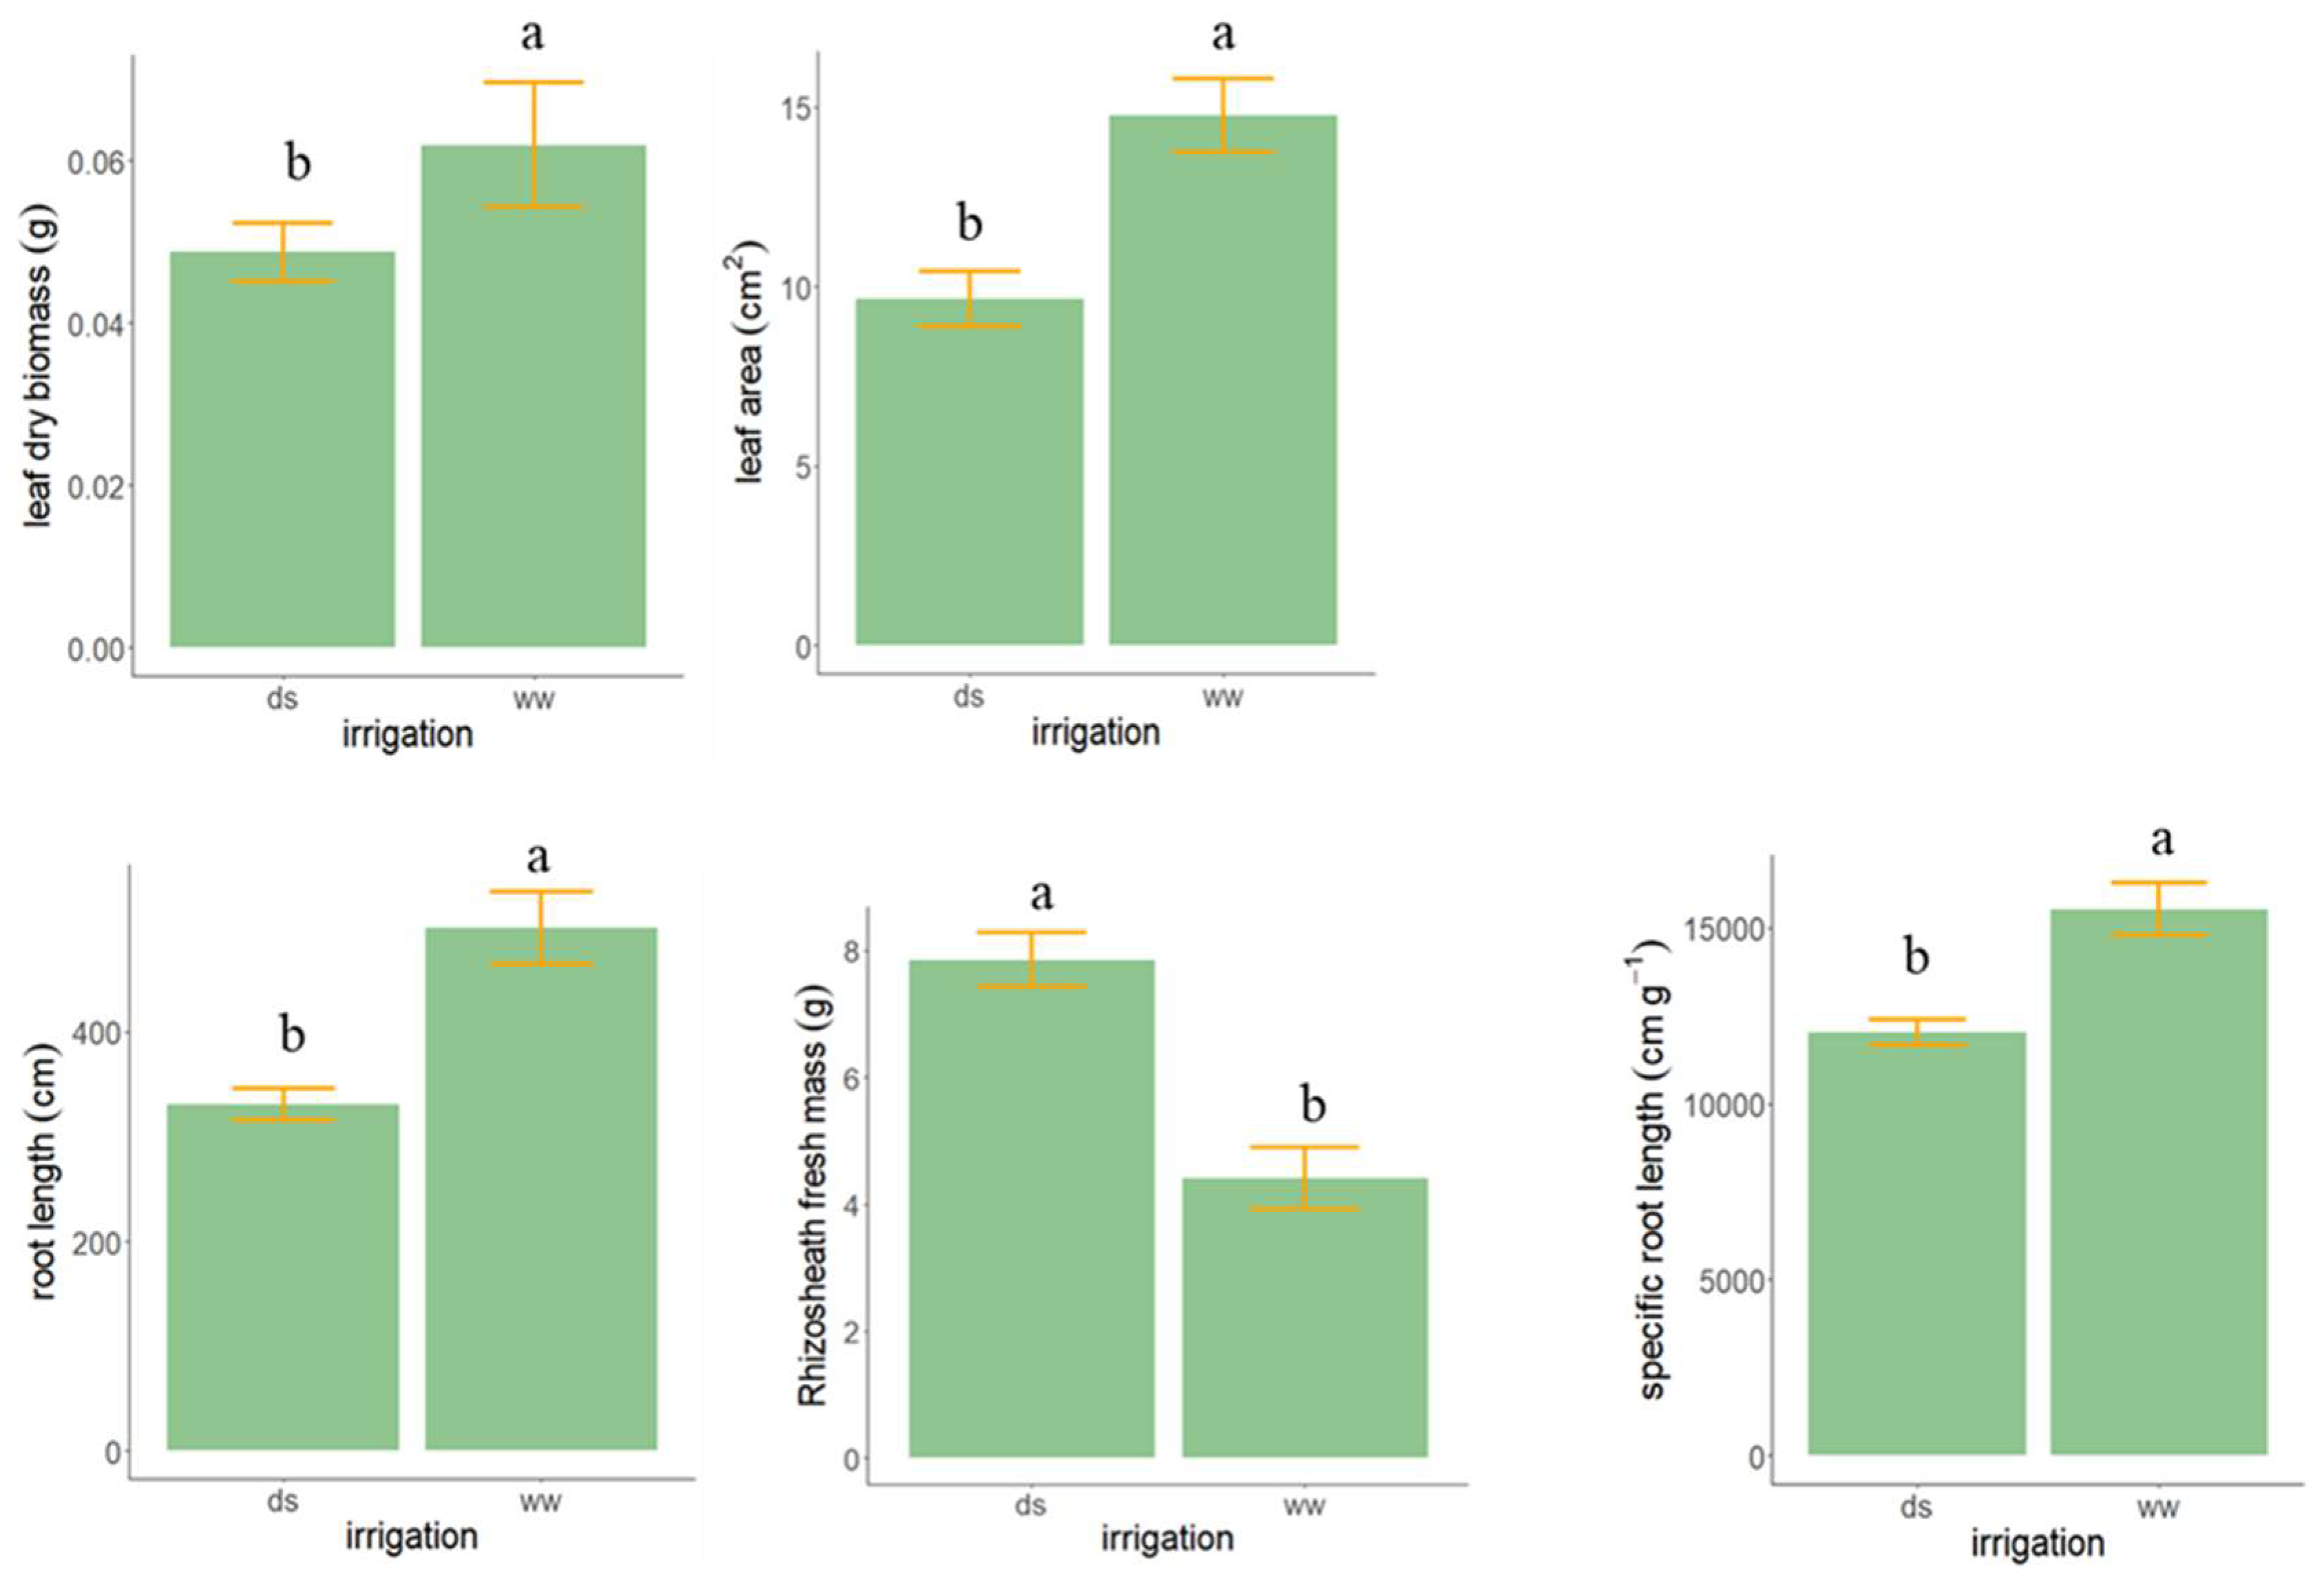
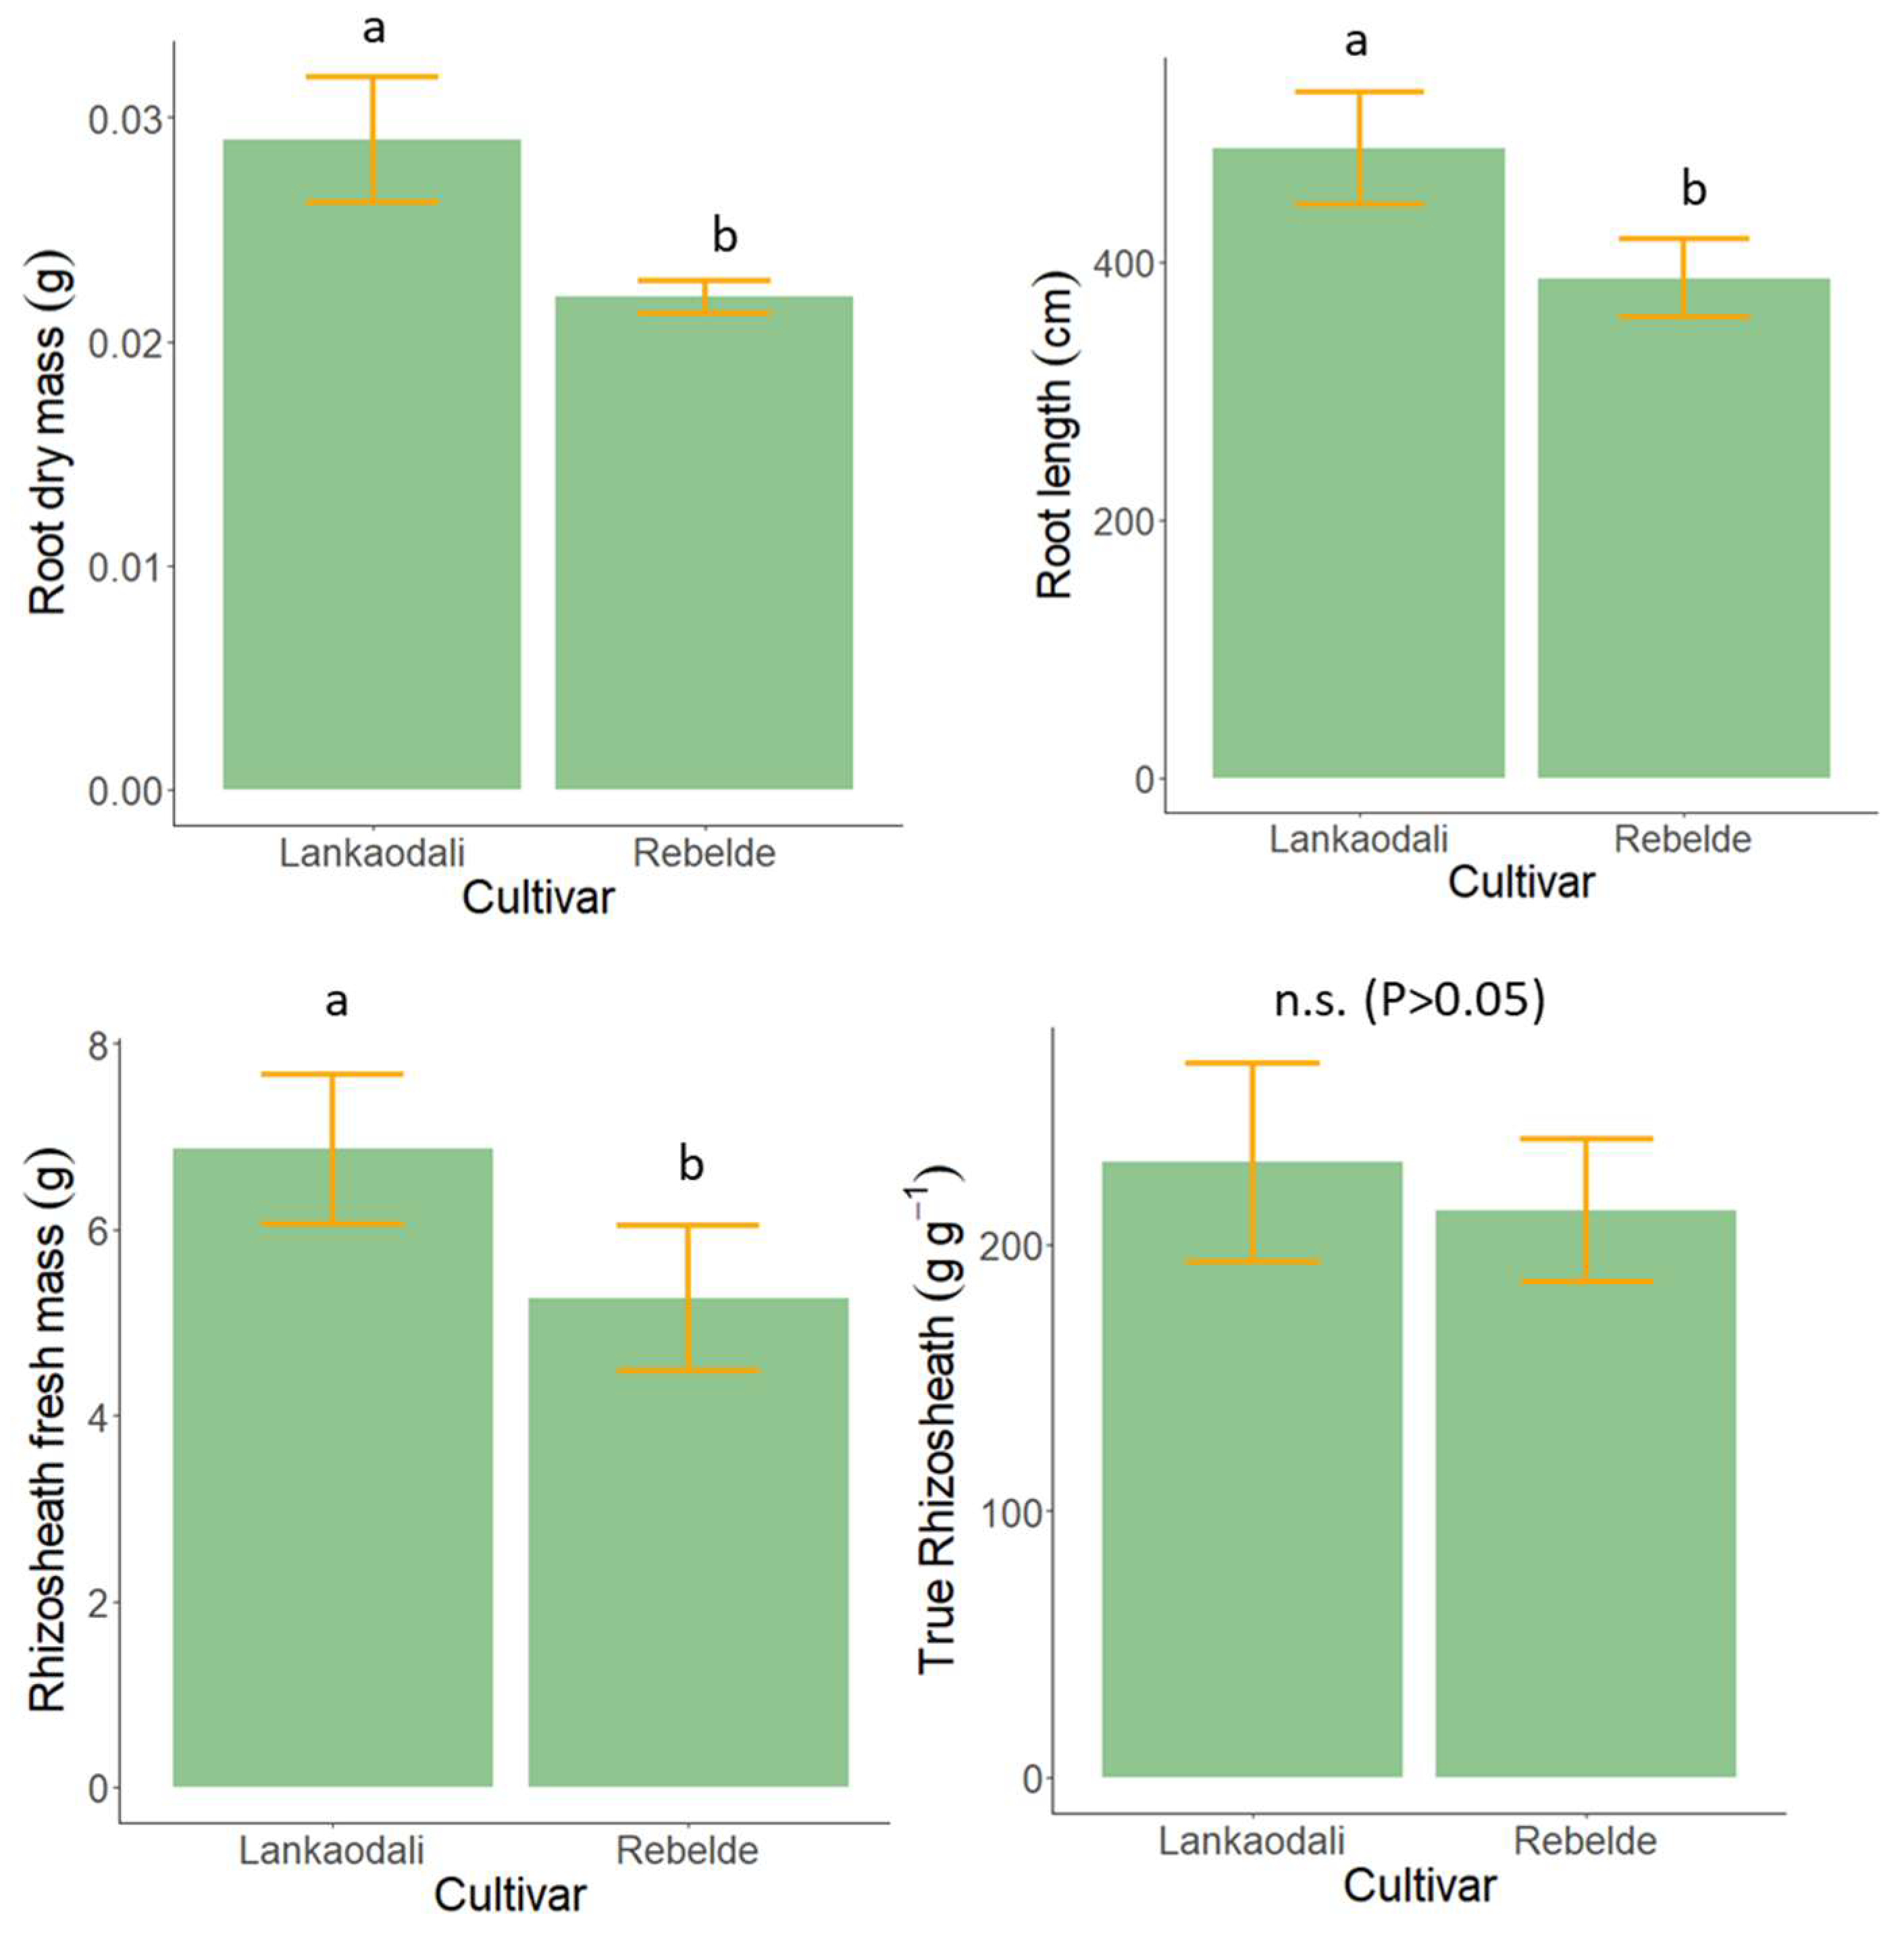
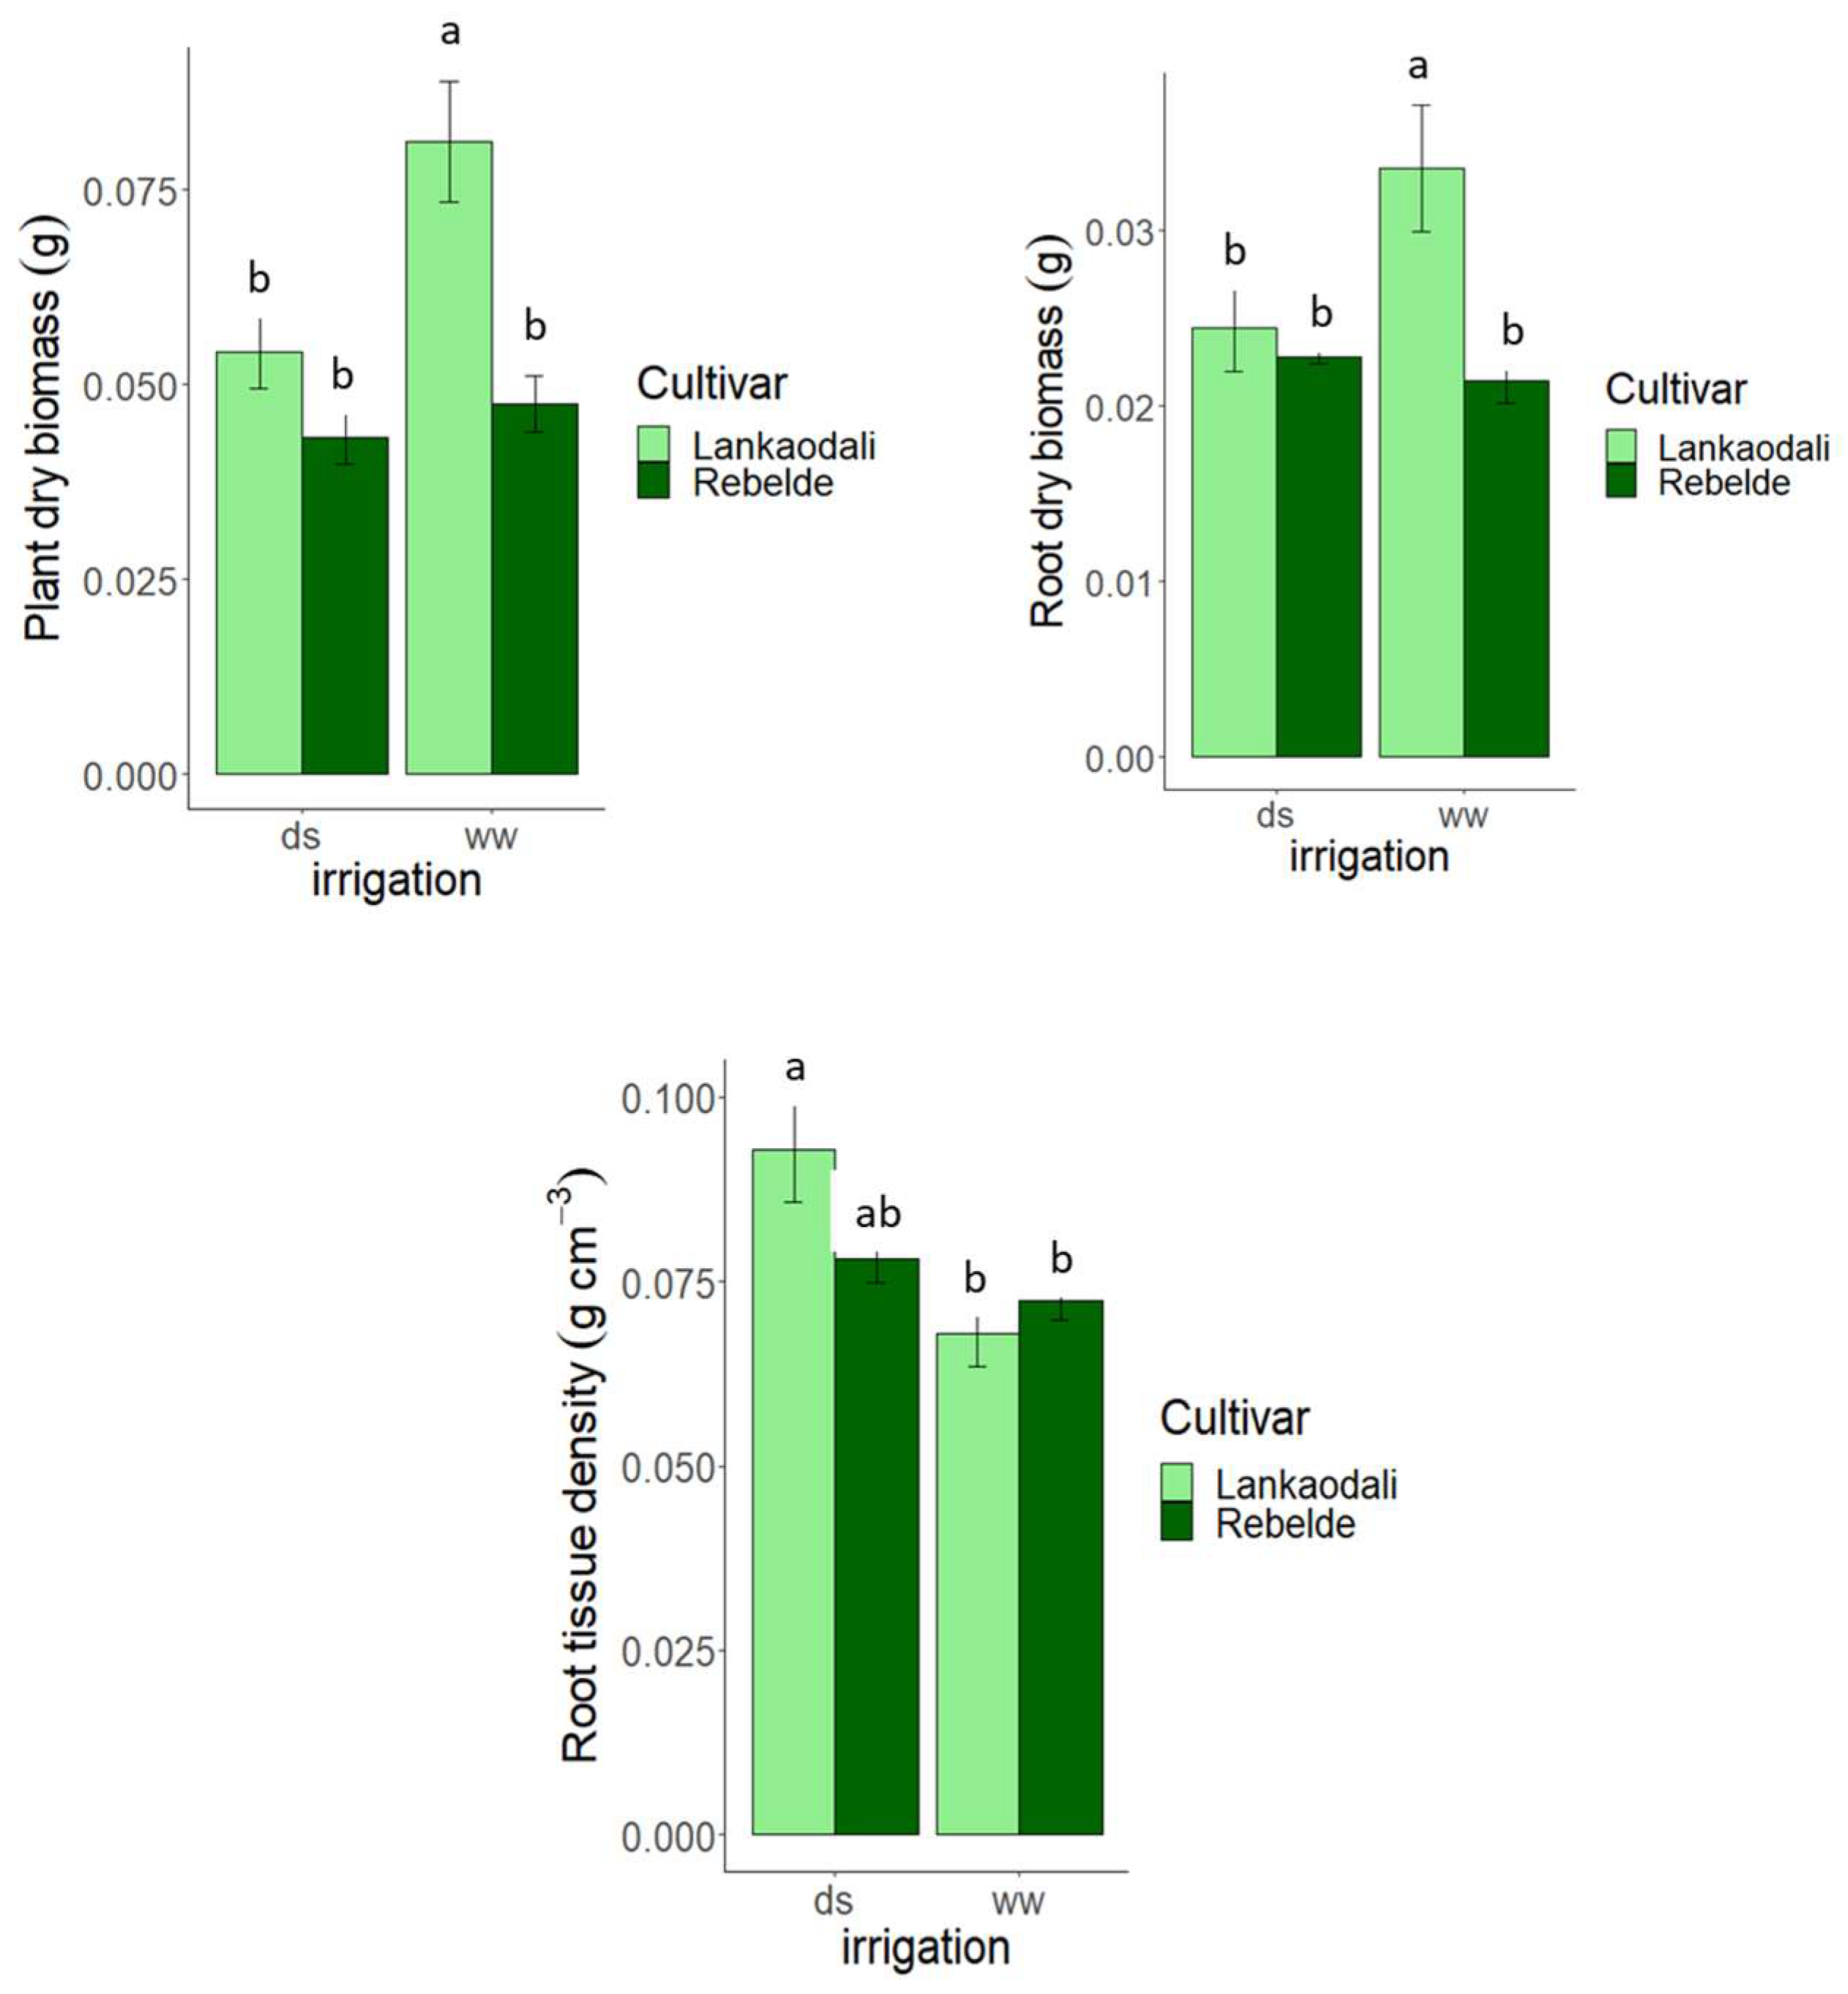
3.3. Experiment 3—Rhizosheath Formation and Root Architecture in Response to Drought Stress

In the third experiment, the two cultivar seedlings were screened in soil and compared in factorial combination of two different water levels, well watered (soil irrigated at the 100% of available water content) and limited water availabiliy (soil irrigated at and 50% of field capacity), corresponding to a moderate drought stress, to evaluate cultivar responses to either a water-favorable environment or to drought stress. Table 6 reports the results of the ANOVA for soil-grown plants (Experiment 3).
Drought stress significantly reduced most shoot and roots traits (Figure 4 top and bottom, respectively) (values averaged across cultivars).
For both genotypes, the leaf area was more affected by drought stress (34% less) than the leaf mass (21% less). The leaf dry matter increased under drought stress from 16% to 20% (average across genotypes). Similarly, drought stress reduced the root length more than the root mass. The specific root length was reduced (23% less), while the rhizosheath size increased both in absolute and in relative terms (78% and 79% more rhizosheat on fresh weight bases, respectively). Regarding the genotypic effect, significant differences between cultivars emerged. In coherence with the semi-hydroponic screens (experiments 1 and 2), the two genotypes showed constitutional differences between themselves; Lankaodali always produced more than Rebelde, even under drought stress (Figure 5). The seedlings of Lankaodali were taller by 11%, with a mean value of 22 cm, and they developed 33% more leaf area and 48% more leaf mass, 26% more root length, 32% more root mass, and 31% more absolute fresh rhizosheath mass than Rebelde but a similar true rhizosheath (values averaged across irrigation levels).
The root-to-shoot ratio increases under drought stress (values averaged across cultivars) and was higher in Rebelde. The cultivar x water supply interaction for leaf mass, root mass, and root tissue density did not attain statistical significance (p > 0.05) see Figure 6; however, Lankaodali showed a clear trend for a larger phenotypic plasticity in response to water availability, taking more advantage of the favorable water environment, especially in terms of aerial growth, while Rebelde was less responsive, with a root-to-shoot mass ratio that was always higher in Rebelde, moreso under drought stress (18% more) than in well-watered conditions (14% more), possibly due to the smaller aerial part compared to that of Lankaodali.
Absolute rhizosheath mass values ranged between 2.62 g of well-watered Rebelde and 8.59 g of drought-stressed Lankaodali, while the true rhizosheath ranged between the minimum value 131.15 g g−1 of well-watered Rebelde and the maximum value of 326 g g−1 of drought-stressed Lankaodali. Lankaodali produced 33% more rhizosheath mass than Rebelde but a similar true rhizosheath. The root-to-shoot mass ratio was higher in Rebelde, moreso under drought stress (18%) than in well-watered conditions (14% more). Plants also differed in root tissue density; maximum and minimum average values were found in drought-stressed and well-watered Lankaodali. Rebelde did not show significant variations in root mass and tissue density. Broad-sense heritability was high for root mass (0.74), relatively low for root length (0.43), and very high for the absolute rhizosheath mass (0.85). The true rhizosheath was a plastic trait, increased by 93% in drought-stressed plants (average across cultivars), and showed no significant differences between cultivars.

4. Discussion

Climate change poses unprecedented challenges for wheat cultivation, marked by erratic precipitation patterns and rising temperatures. To address this challenge, the scientific community is exploring innovative strategies, focusing on the development of wheat cultivars with root systems adapted to low-fertility conditions and capable of withstanding drought stress. In the present study, we evaluated the effects of nutrient starvation and drought stress on two bread wheat cultivars, with contrasting morpho-phenological traits and putatively varying root systems. These two cultivars were selected based on a previous QTL mapping study, as they were parents of a RIL population, potentially useful also for mapping root traits. Our results showed constitutional differences between the two cultivars. Differences between cultivars were consistent across screens. Lankaodali also outperformed Rebelde in terms of leaf area, mass, and root production under abiotic stress (e.g., severe nutrient starvation and drought stress). The differences between cultivars, however, increased under favorable conditions, indicating that Lankaodali took more advantage than Rebelde of a better nutritional and water status by sharply increasing biomass production and specific root length; this may indicate that this cultivar is suitable for high input environments but also for environments where transitient fluctuations of nutrients and water availabilty can be expected (as it is for low-input environments). The larger leaf area and coleoptile length at the seedling stage for Lankaodali could be considered indicators of early vigor. This trait is correlated with better seedling establishment and higher nutrient and water uptake efficiency [36,37]. It is considered a relevant breeding target for wheat [38]. In drought-prone environments, the fast development of the leaf area can reduce soil evaporation so that more water is available for transpiration [39]. Early shoot vigor in Lankaodali, probably associated with the larger seed size, was complemented by a larger root system in agreement with other studies [40,41]. Seed size has been reported to affect early seedling vigor in wheat species [37,42], although some evidence was contradictory [43]. In bread wheat, three GW2 homologue genes on A, B, and D genomes were identified, respectively [44], and two alleles of TaGW2-6A (Hap-6A-A and Hap-6A-G) were associated with grain size in wheat. In line with this observation, in Lankaodali, an insertion in the TaGW2-6A gene associated with a large kernel was identified [45]. Therefore, Lankaodali, which has a larger kernel than Rebelde, also developed a larger leaf area and a larger root length and mass. Several studies argue that embryo size [42,46] and/or seed size [47] are the main factors influencing both seedling early vigor and root mass. This work focuses on roots at the seedling stage, which is not fully representative of plant behavior at later stages. Nevertheless, drought stress at the wheat seedling stage affects architecture of seminal roots (Sanguineti et al.) [48], whose early growth may play a role in plant response to future drought stress events. A low water supply to wheat seedlings has been shown to result in a lower root depth and surface area [49] [Kimurto et al.], and it has been discussed in terms of the possible modification of tillering [50] [Hyles et al.] and, therefore, yield. In wheat seedlings grown in hydroponic conditions, QTLs for root dry weight were linked to QTLs for nitrogen uptake; the positive correlation and genetic linkage for the traits between the hydroponic screen and field trials demonstrated that shoot and root early vigor correlates with a better nitrogen uptake capacity [51] and that this also held if this character is phenotyped in simplified soil-less systems. Winter wheat early vigor was also associated with a higher phosphorus uptake efficiency [52]. In our study, the shift from 50% to full-strength Hoagland solution (exp. 2) did not produce sizeable changes in above- or below-ground production. Differences between cultivars, however, were consistent with the first experiment; even at a high nutrient availability, Lankaodali developed more shoot and root mass and area than Rebelde. The lack of difference between 0.5 vs. full-strength solution could be due to the short time window, during which even the lower nutrient concentration was sufficient to meet the small seedling requirements. A previous hydroponic screen study showed that differences in shoot and root growth between 0.5 and full-strength Hoagland solution only appeared 44 days after transplanting and that no differences were recorded at any time when nutrient availability was doubled, shifting from 1× to 2× full-strength solution [53], confirming our findings. The lack of differences between 0.5 and 1× full-strength solution we found could also be due to the counterbalancing effect of osmotic stress build-up. Indeed, a concentrated Hoagland solution was used as a non-specific osmoticum to separate the effect of water and salinity stress [54]. The plants slightly reduced the primary root length with the full-strength solution; this could be an early response to osmotic stress. In our experiment, the paper-rolls are not irrigated from the top, so nutrients were never flushed during the experiment and could build up in the upper strata, where evaporation is stronger, or at the bottom due to capillary rise when the nutrient solution is refilled. The biometry of the two cultivars (values averaged across half- and full-strength Hogland’s solution) can be considered a benchmark of cultivar seedling biometry under non-limiting nutrient availability. In the third screen, we tested the cultivar response to drought stress. As expected, plants responded to drought stress by reducing shoot and root growth. The reduction in the leaf area means less transpiring surface, as a reduction in root length may imply a reduced water uptake capacity. Reducing the root absorbing surface, however, can be adaptative in certain conditions (e.g., a soil with a poor water holding capacity and no subsoil water available) since it translates into a parsimonious use of remaining soil water. Increasing the root-to-shoot ratio generally improves plant water status; RSR increased in drought-stressed plants. Rebelde had a significantly higher RSR (values averaged across irrigation level); this is possibly due to the relatively small leaf size. The root tissue density increased under drought, especially in Lankaodali. The ecological role of root tissue density in drought stress tolerance has been discussed for xeric grassland communities; physiologically, drought tolerant species had denser roots, resulting from more investment in cell walls to avoid dehydratation [55]. Consistent with the semi-hydroponic screen, Lankaodali was always more vigorous than Rebelde under the worst condition also and was more responsive to the favorable environment. The higher root length of Lankaodali matched a higher value of absolute rhizosheath, confirming a previous study carried out by [56]. True rhizosheath, however, which reflects the soil binding capacity per root mass unit, did not differ between cultivars; both genotypes responded similarly to drought stress, that is, by increasing rhizosheath production. Recent research has shed light on the biophysical processes of the rhizosheath that have the potential to improve water availability on the root surface of several crop species [15,23,57]. The rhizosheath dry mass and true rhizosheath were in line with the values found by [58] under similar irrigation levels. Specific rhizosheath values were also in line with those reported for modern durum wheat cultivars, larger than the value reported for the Italian ancient durum cultivar, Saragolle lucana [59]. A rhizosheath screening of modern cultivars of maize showed true rhizosheath values similar to ours (from 16 to 29 g g−1 dry matter) [60]. True rhizosheath values vary widely among angiosperms (from 6.5 to 101.8 g g−1 fresh root); our averages in control conditions (50 g g−1 under optimal irrigation) fall within the range of Poales, which is a very large family that comprises several wild species (6.5 to 101.8 g g−1 root fresh), and is higher than that of maize sorghum and barley [17] In our study, the rhizosphere chemical composition and root exudate rates were not investigated, but it has been reported that root exudation is positively correlated to root length and specific root length [61,62]. ‘Aggressive’ root phenotypes characterized by a high proliferation rate are likely to also be more active exudate producers. Grasses defined as ‘explorative plants’ exude more than ‘conservative’ root phenotypes characterized by a reduced space-filling capacity [63]. Drought stress increased the rhizosheath size per unit mass, pointing toward the adaptive role of the rhizosheath in drought stress resistance [23], but there is a a lack of specific rhizosheath traits that differentiate the two cultivars. Lankaodali produced more roots and, hence, more rhizosheath in absolute terms and thus is likely to exert a stronger effect in terms of ecosystem services. Some root functions, such as soil mechanical reinforcement, tends to increase linearly with the root length [64,65]. The greater root length and foraging capacity of Lankaodali suggests that that this cultivar could be more suitable than Rebelde to low-input environments due to a better resource acquisition capacity [23] and could also be more suitable than Rebelde for improving the soil biophysical quality. The high heritability of both the root length and root mass of Lankaodali demonstrates that a large part of the phenotypic variation was under genetic control. This is in agreement with the literature, indicating that root size is a relatively stable inheritable trait and is therefore useful for breeding purposes. Large values of broad-sense heritability (from 50 to 73%) for wheat primary root length were found by [66]. High values of heritability for wheat root biomass were also found in well-watered and drought-stressed plants (79% and 78%, respectively) [67]. The large heritability found in our study suggests that a bi-parental RIL population derived from Lankaodali and Rebelde could be useful for root QTL mapping studies. Although it is essential to establish the correlation between traits measured on seedlings and agronomic performance of mature plants in the field, evaluating seedling morphology remains important. A seedling is at the most vulnerable plant stage; some traits are crucial for plant survival and uniform stand establishment (e.g., rhizosheath production and early vigor), or their influence remains relevant throughout the plant life cycle (e.g., seminal root architecture). Seedling root architecture has been found to be correlated with agronomic performance; for instance, [68] found that of the 48 QTLs detected for root seedling architecture, 15 overlapped with QTLs for agronomic traits and/or grain yield in two or more environments. Seedling root traits and seedling total root length were positively associated with yield grain; longer roots correlated with a higher number of grains per spike, higher above-ground biomass, and delayed maturity and extended grain filling [69]. In other studies, laboratory seedling root screens (cigar rolls or wax layer) were not predictive of mature wheat plant root architecture in the field [30,70]; however, seedling root depth did correlate with rooting depth in a field at the five-leaf stage [30]. Overall, in both the hydroponic and soil screen, the two cultivars could only be separated evenly with the base in their root length. Root length, which is a key root physiological parameter, is a relatively high-throughput root measure in semi-hydroponic screens, and therefore, it is suitable for screening a large number of genotypes in a short time. Maximum differences between cultivars were observed using half-strength Hoagland’s solution; therefore, this preliminary screen on parental genotypes, besides supporting the hypothesis that these two cultivars exhibit a contrasting root biometry, also provided methodological indications for scaling up phenotyping on the RIL population.

5. Conclusions

In this work, we phenotyped seedling shoot and root traits of two bread wheat cultivars that were previously compared for yield and grain quality but for which no information on roots was available. The simple and rapid root phenotyping screens used in this study allowed us to capture significant genotypic differences between these two cultivars, and this supports their use as parents to analyze the bi-parental RIL population with an expected gradient in root biometry. The fact that the genotypic differences were consistent across environments and screens provides strong evidence that differences in root biometry are constitutive. Lankaodali performed consistently better than Rebelde across nutrient and soil moisture gradients. This genotype also showed more plasticity and took a greater advantage than Rebelde of favorable conditions. The early vigor of this cultivar coupled with a larger plasticity in root traits suggests a possible use in low-input environments, where transient variation in resource availability can be expected. This cultivar can also be considered as a potential donor in breeding programs aimed at producing cultivars with a large root size. Rebelde displayed some conservative traits (larger root diameter, larger root tissue density, and reduced plasticity) that can be indicative of a larger productive stability. The lack of correlation between leaf and root traits for this cultivar suggests that the seedling survival strategy relies more on above-ground physiological traits than on root biometry. The large broad-sense heritability values for root traits suggests that these two parental cultivars could be used to analyse RIL population to identify their genetic bases.

Author Contributions

Conceptualization, M.A., P.D.V. and R.R.; methodology: M.A., R.R., R.B. and R.L.; software: R.B. and R.L.; formal analysis: R.B., R.L. and R.R.; data curation: R.L. and R.B.; writing—original draft preparation: R.R. and P.D.V.; writing—review and editing, M.A., P.D.V. and R.R.; funding acquisition, M.A. and R.R. All authors have read and agreed to the published version of the manuscript.

Funding

This study was carried out within the Agritech National Research Center and received funding from the European Union Next GenerationEU (PIANO NAZIONALE DI RIPRESA E RESILIENZA (PNRR)—MISSIONE 4 COMPONENTE 2, INVESTIMENTO 1.4—D.D. 1032 17/06/2022, CN00000022). This manuscript reflects only the authors’ views and opinions; neither the European Union nor the European Commission can be considered responsible for them. This study was also supported by ‘Tecnologie per la riduzione del gap proteico in sistemi agricoli destinati alla alimentazione umana ed animale (PROTEAGRI)’, CUP G49J19001360006, funded by PO FESR Basilicata 2014–2020.

Data Availability Statement

Data will be made available upon request.

Conflicts of Interest

The authors declare no conflicts of interest.

References

  1. Bentley, A.R. Breeding Wheat for the Future: Opportunities and Challenges. In Sustainable Agricultural Innovations for Resilient Agri-Food Systems; The Indian Ecological Society: Punjab, India, 2022; p. 7. [Google Scholar]
  2. Dadrasi, A.; Chaichi, M.; Nehbandani, A.; Soltani, E.; Nemati, A.; Salmani, F.; Heydari, M.; Yousefi, A.R. Global insight into understanding wheat yield and production through Agro-Ecological Zoning. Sci. Rep. 2023, 13, 15898. [Google Scholar] [CrossRef] [PubMed]
  3. Pequeno, D.N.; Hernandez-Ochoa, I.M.; Reynolds, M.; Sonder, K.; MoleroMilan, A.; Robertson, R.D.; Lopes, M.S.; Xiong, W.; Kropff, M.; Asseng, S. Climate impact and adaptation to heat and drought stress of regional and global wheat production. Environ. Res. Lett. 2021, 16, 054070. [Google Scholar] [CrossRef]
  4. Wasson, A.P.; Rebetzke, G.J.; Kirkegaard, J.A.; Christopher, J.; Richards, R.A.; Watt, M. Soil coring at multiple field environments can directly quantify variation in deep root traits to select wheat genotypes for breeding. J. Exp. Bot. 2014, 65, 6231–6249. [Google Scholar] [CrossRef] [PubMed]
  5. Comas, L.H.; Becker, S.R.; Cruz, V.M.V.; Byrne, P.F.; Dierig, D.A. Root traits contributing to plant productivity under drought. Front. Plant Sci. 2013, 4, 442. [Google Scholar] [CrossRef] [PubMed]
  6. Manschadi, A.M.; Hammer, G.L.; Christopher, J.T.; Devoil, P. Genotypic variation in seedling root architectural traits and implications for drought adaptation in wheat (Triticum aestivum L.). Plant Soil 2008, 303, 115–129. [Google Scholar] [CrossRef]
  7. Kirkegaard, J.A.; Lilley, J.M.; Howe, G.N.; Graham, J.M. Impact of subsoil water use on wheat yield. Aust. J. Agric. Res. 2007, 58, 303–315. [Google Scholar] [CrossRef]
  8. Motzo, R.; Attene, G.; Deidda, M. Genotypic variation in durum wheat root systems at different stages of development in a Mediterranean environment. Euphytica 1992, 66, 197–206. [Google Scholar] [CrossRef]
  9. Středa, T.; Dostál, V.; Horáková, V.; Chloupek, O. Effective use of water by wheat varieties with different root system sizes in rain-fed experiments in Central Europe. Agric. Water Manag. 2012, 104, 203–209. [Google Scholar] [CrossRef]
  10. Nguyen, V.L.; Stangoulis, J. Variation in root system architecture and morphology of two wheat genotypes is a predictor of their tolerance to phosphorus deficiency. Acta Physiol. Plant. 2019, 41, 109. [Google Scholar] [CrossRef]
  11. Lynch, J.P. Root phenotypes for improved nutrient capture: An underexploited opportunity for global agriculture. New Phytol. 2019, 223, 548–564. [Google Scholar] [CrossRef]
  12. Lynch, J.P.; Strock, C.F.; Schneider, H.M.; Sidhu, J.S.; Ajmera, I.; Galindo-Castañeda, T.; Klein, S.P.; Hanlon, M.T. Root anatomy and soil resource capture. Plant Soil 2021, 466, 21–63. [Google Scholar] [CrossRef]
  13. Enstone, D.E.; Peterson, C.A.; Ma, F. Root endodermis and exodermis: Structure, function, and responses to the environment. J. Plant Growth Regul. 2002, 21, 335–351. [Google Scholar] [CrossRef]
  14. Ouyang, W.; Yin, X.; Yang, J.; Struik, P.C. Comparisons with wheat reveal root anatomical and histochemical constraints of rice under water-deficit stress. Plant Soil 2020, 452, 547–568. [Google Scholar] [CrossRef]
  15. Aslam, M.M.; Karanja, J.K.; Dodd, I.C.; Waseem, M.; Weifeng, X. Rhizosheath: An adaptive root trait to improve plant tolerance to phosphorus and water deficits? Plant Cell Environ. 2022, 45, 2861–2874. [Google Scholar] [CrossRef] [PubMed]
  16. McCully, M.E. Roots in soil: Unearthing the complexities of roots and their rhizospheres. Annu. Rev. Plant Biol. 1999, 50, 695–718. [Google Scholar] [CrossRef] [PubMed]
  17. George, T.S.; Brown, L.K.; Ramsay, L.; White, P.J.; Newton, A.C.; Bengough, A.G.; Russell, J.; Thomas, W.T.B. Understanding the genetic control and physiological traits associated with rhizosheath production by barley (Hordeum vulgare). New Phytol. 2014, 203, 195–205. [Google Scholar] [CrossRef] [PubMed]
  18. Ndour, P.M.S.; Heulin, T.; Achouak, W.; Laplaze, L.; Cournac, L. The rhizosheath: From desert plants adaptation to crop breeding. Plant Soil 2020, 456, 1–13. [Google Scholar] [CrossRef]
  19. Volkens, G. Die Flora Der Aegyptisch-Arabischen Wtiste Auf Grundlage Anatomisch-Physiologischer Forschungen: Dargestelit Von Dr. Georg Volkens… Gerbr" Uder Boratraeger; Eggers, Ed.; Kessinger Publishing: Whitefish, MT, USA, 1887. [Google Scholar]
  20. Brown, L.K.; George, T.S.; Neugebauer, K.; White, P.J. The rhizosheath–A potential trait for future agricultural sustainability occurs in orders throughout the angiosperms. Plant Soil 2017, 418, 115–128. [Google Scholar] [CrossRef]
  21. Young, I.M. Variation in moisture contents between bulk soil and the rhizosheath of wheat (Triticum aestivum L. cv. Wembley). New Phytol. 1995, 130, 135–139. [Google Scholar] [CrossRef]
  22. Cheraghi, M.; Mousavi, S.M.; Zarebanadkouki, M. Functions of rhizosheath on facilitating the uptake of water and nutrients under drought stress: A review. Plant Soil 2023, 1–25. [Google Scholar]
  23. Basirat, M.; Mousavi, S.M.; Abbaszadeh, S.; Ebrahimi, M.; Zarebanadkouki, M. The rhizosheath: A potential root trait helping plants to tolerate drought stress. Plant Soil 2019, 445, 565–575. [Google Scholar] [CrossRef]
  24. Pang, J.; Ryan, M.H.; Siddique, K.H.; Simpson, R.J. Unwrapping the rhizosheath. Plant Soil 2017, 418, 129–139. [Google Scholar] [CrossRef]
  25. James, R.A.; Weligama, C.; Verbyla, K.; Ryan, P.R.; Rebetzke, G.J.; Rattey, A.; Richardson, A.E.; Delhaize, E. Rhizosheaths on wheat grown in acid soils: Phosphorus acquisition efficiency and genetic control. J. Exp. Bot. 2016, 67, 3709–3718. [Google Scholar] [CrossRef] [PubMed]
  26. Marasco, R.; Fusi, M.; Ramond, J.B.; Van Goethem, M.W.; Seferji, K.; Maggs-Kölling, G.; Cowan, D.A.; Daffonchio, D. The plant rhizosheath–root niche is an edaphic “mini-oasis” in hyperarid deserts with enhanced microbial competition. ISME Commun. 2022, 2, 47. [Google Scholar] [CrossRef] [PubMed]
  27. Gioia, T.; Galinski, A.; Lenz, H.; Müller, C.; Lentz, J.; Heinz, K.; Briese, C.; Putz, A.; Fiorani, F.; Watt, M.; et al. GrowScreen-PaGe, a non-invasive, high-throughput phenotyping system based on germination paper to quantify crop phenotypic diversity and plasticity of root traits under varying nutrient supply. Funct. Plant Biol. 2016, 44, 76–93. [Google Scholar] [CrossRef] [PubMed]
  28. Vitale, P.; Fania, F.; Esposito, S.; Pecorella, I.; Pecchioni, N.; Palombieri, S.; Sestili, F.; Lafiandra, D.; Taranto, F.; De Vita, P. QTL Analysis of five morpho-physiological traits in bread wheat using two mapping populations derived from common parents. Genes 2021, 12, 604. [Google Scholar] [CrossRef] [PubMed]
  29. Esposito, S.; D’Agostino, N.; Taranto, F.; Sonnante, G.; Sestili, F.; Lafiandra, D.; De Vita, P. Whole-exome sequencing of selected bread wheat recombinant inbred lines as a useful resource for allele mining and bulked segregant analysis. Front. Genet. 2022, 13, 1058471. [Google Scholar] [CrossRef] [PubMed]
  30. Watt, M.; Moosavi, S.; Cunningham, S.C.; Kirkegaard, J.A.; Rebetzke, G.J.; Richards, R.A. A rapid, controlled-environment seedling root screen for wheat correlates well with rooting depths at vegetative, but not reproductive, stages at two field sites. Ann. Bot. 2013, 112, 447–455. [Google Scholar] [CrossRef] [PubMed]
  31. Zadoks, J.C.; Chang, T.T.; Konzak, C.F. Decimal code for growth stages of cereals. Weed Res. 1974, 14, 415–421. [Google Scholar] [CrossRef]
  32. van Rossum, B.J. Genotype by Environment Analysis Using statgenGxE. Available online: https://biometris.github.io/statgenGxE/index.html (accessed on 1 December 2023).
  33. Schmidt, P.; Hartung, J.; Bennewitz, J.; Piepho, H.P. Heritability in plant breeding on a genotype-difference basis. Genetics 2019, 212, 991–1008. [Google Scholar] [CrossRef]
  34. Finlay, K.W.; Wilkinson, G.N. The analysis of adaptation in a plant-breeding programme. Aust. J. Agric. Res. 1963, 14, 742–754. [Google Scholar] [CrossRef]
  35. Lian, L.; de Los Campos, G. FW: An R package for Finlay–Wilkinson regression that incorporates genomic/pedigree information and covariance structures between environments. G3 Genes Genomes Genet. 2016, 6, 589–597. [Google Scholar] [CrossRef] [PubMed]
  36. Richards, R.A.; Lukacs, Z. Seedling vigour in wheat-sources of variation for genetic and agronomic improvement. Aust. J. Agric. Res. 2002, 53, 41–50. [Google Scholar] [CrossRef]
  37. Zhao, Z.; Rebetzke, G.J.; Zheng, B.; Chapman, S.C.; Wang, E. Modelling impact of early vigour on wheat yield in dryland regions. J. Exp. Bot. 2019, 70, 2535–2548. [Google Scholar] [CrossRef] [PubMed]
  38. Zhang, L.; Richards, R.A.; Condon, A.G.; Liu, D.C.; Rebetzke, G.J. Recurrent selection for wider seedling leaves increases early biomass and leaf area in wheat (Triticum aestivum L.). J. Exp. Bot. 2015, 66, 1215–1226. [Google Scholar] [CrossRef] [PubMed]
  39. Mullan, D.J.; Reynolds, M.P. Quantifying genetic effects of ground cover on soil water evaporation using digital imaging. Funct. Plant Biol. 2010, 37, 703–712. [Google Scholar] [CrossRef]
  40. Liao, M.; Palta, J.A.; Fillery, I.R. Root characteristics of vigorous wheat improve early nitrogen uptake. Aust. J. Agric. Res. 2006, 57, 1097–1107. [Google Scholar] [CrossRef]
  41. Watt, M.; Kirkegaard, J.A.; Rebetzke, G.J. A wheat genotype developed for rapid leaf growth copes well with the physical and biological constraints of unploughed soil. Funct. Plant Biol. 2005, 32, 695–706. [Google Scholar] [CrossRef] [PubMed]
  42. Rebetzke, G.J.; Zhang, H.; Ingvordsen, C.H.; Condon, A.G.; Rich, S.M.; Ellis, M.H. Genotypic variation and covariation in wheat seedling seminal root architecture and grain yield under field conditions. Theor. Appl. Genet. 2022, 135, 3247–3264. [Google Scholar] [CrossRef]
  43. Rebetzke, G.J.; Richards, R.A. Genetic improvement of early vigour in wheat. Aust. J. Agric. Res. 1999, 50, 291–302. [Google Scholar] [CrossRef]
  44. Su, Z.; Hao, C.; Wang, L.; Dong, Y.; Zhang, X. Identification and development of a functional marker of TaGW2 associated with grain weight in bread wheat (Triticum aestivum L.). Theor. Appl. Genet. 2011, 122, 211–223. [Google Scholar] [CrossRef] [PubMed]
  45. Yang, Z.; Bai, Z.; Li, X.; Wang, P.; Wu, Q.; Yang, L.; Li, L.; Li, X. SNP identification and allelic-specific PCR markers development for TaGW2, a gene linked to wheat kernel weight. Theor. Appl. Genet. 2012, 125, 1057–1068. [Google Scholar] [CrossRef] [PubMed]
  46. López-Castañeda, C.; Richards, R.A.; Farquhar, G.D.; Williamson, R.E. Seed and seedling characteristics contributing to variation in early vigor among temperate cereals. Crop Sci. 1996, 36, 1257–1266. [Google Scholar] [CrossRef]
  47. Abdel-Ghani, A.H.; Aref Al-Dalain, S.; Tarawneh, G.H.; Al-Taae, H.H.; Al-Tarawneh, B.H.; Owais, S.J.; Al-Ebissat, A.S.; Al-Mayta, R.; AL-Dala’een, J.A.; Duwayri, M.A. Kernel quality, germination rate and seedling performance of eight wheat varieties produced under three different irrigation regimes. Aust. J. Crop Sci. 2022, 16, 1135–1143. [Google Scholar] [CrossRef]
  48. Sanguineti, M.C.; Li, S.; Maccaferri, M.; Corneti, S.; Rotondo, F.; Chiari, T.; Tuberosa, R. Genetic dissection of seminal root architecture in elite durum wheat germplasm. Ann. Appl. Biol. 2007, 151, 291–305. [Google Scholar] [CrossRef]
  49. Kimurto, P.K.; Kinyua, M.G.; Birechl, R.; Korir, P.C.; Njoka, E.M.; Njau, P.N. Root and shoot characteristics as selection criteria for drought tolerance in bread wheat (Triticum aestivum L.) at seedling stage under tropical environment. Discov. Innov. 2005, 17, 74–84. [Google Scholar] [CrossRef]
  50. Hyles, J.; Bloomfield, M.T.; Hunt, J.R.; Trethowan, R.M.; Trevaskis, B. Phenology and related traits for wheat adaptation. Heredity 2020, 125, 417–430. [Google Scholar] [CrossRef] [PubMed]
  51. Pang, J.; Palta, J.A.; Rebetzke, G.J.; Milroy, S.P. Wheat genotypes with high early vigour accumulate more nitrogen and have higher photosynthetic nitrogen use efficiency during early growth. Funct. Plant Biol. 2013, 41, 215–222. [Google Scholar]
  52. Su, J.Y.; Zheng, Q.; Li, H.W.; Li, B.; Jing, R.L.; Tong, Y.P.; Li, Z.S. Detection of QTLs for phosphorus use efficiency in relation to agronomic performance of wheat grown under phosphorus sufficient and limited conditions. Plant Sci. 2009, 176, 824–836. [Google Scholar] [CrossRef]
  53. Kang, J.G.; van Iersel, M.W. Nutrient solution concentration affects shoot: Root ratio, leaf area ratio, and growth of subirrigated salvia (Salvia splendens). HortScience 2004, 39, 49–54. [Google Scholar] [CrossRef]
  54. Termaat, A.; Munns, R. Use of concentrated macronutrient solutions to separate osmotic from NaCl-specific effects on plant growth. Funct. Plant Biol. 1986, 13, 509–522. [Google Scholar] [CrossRef]
  55. Tucker, S.S.; Craine, J.M.; Nippert, J.B. Physiological drought tolerance and the structuring of tallgrass prairie assemblages. Ecosphere 2011, 2, art48. [Google Scholar] [CrossRef]
  56. Delhaize, E.; Rathjen, T.M.; Cavanagh, C.R. The genetics of rhizosheath size in a multiparent mapping population of wheat. J. Exp. Bot. 2015, 66, 4527–4536. [Google Scholar] [CrossRef] [PubMed]
  57. Rabbi, S.M.; Warren, C.R.; Macdonald, C.; Trethowan, R.M.; Young, I.M. Soil-root interaction in the rhizosheath regulates the water uptake of wheat. Rhizosphere 2022, 21, 100462. [Google Scholar] [CrossRef]
  58. Bochicchio, R.; Labella, R.; Vitti, A.; Nuzzaci, M.; Logozzo, G.; Amato, M. Root morphology, allometric relations and rhizosheath of ancient and modern tetraploid wheats (Triticum durum Desf.) in response to inoculation with Trichoderma harzianum T-22. Plants 2022, 11, 159. [Google Scholar] [CrossRef] [PubMed]
  59. Bochicchio, R.; Labella, R.; Rossi, R.; Perniola, M.; Amato, M. Effects of Soil Water Shortage on Seedling Shoot and Root Growth of Saragolle Lucana Tetraploid Wheat (Triticum durum Desf.) Landrace. Plants 2022, 11, 3492. [Google Scholar] [CrossRef] [PubMed]
  60. Adu, M.O.; Asare, P.A.; Yawson, D.O.; Ackah, F.K.; Amoah, K.K.; Nyarko, M.A.; Andoh, D.A. Quantifying variations in rhizosheath and root system phenotypes of landraces and improved varieties of juvenile maize. Rhizosphere 2017, 3, 29–39. [Google Scholar] [CrossRef]
  61. Gao, Y.; Wang, H.; Yang, F.; Dai, X.; Meng, S.; Hu, M.; Kou, L.; Fu, X. Relationships between root exudation and root morphological and architectural traits vary with growing season. Tree Physiol. 2023, 44, tpad118. [Google Scholar] [CrossRef] [PubMed]
  62. Guyonnet, J.P.; Guillemet, M.; Dubost, A.; Simon, L.; Ortet, P.; Barakat, M.; Heulin, T.; Achouak, W.; Haichar, F.E.Z. Plant nutrient resource use strategies shape active rhizosphere microbiota through root exudation. Front. Plant Sci. 2018, 9, 1662. [Google Scholar] [CrossRef]
  63. Guyonnet, J.P.; Cantarel, A.A.; Simon, L.; Haichar, F.E.Z. Root exudation rate as functional trait involved in plant nutrient-use strategy classification. Ecol. Evol. 2018, 8, 8573–8581. [Google Scholar] [CrossRef]
  64. Chen, F.; Zhang, J.; Zhang, M.; Wang, J. Effect of Cynodon dactylon community on the conservation and reinforcement of riparian shallow soil in the Three Gorges Reservoir area. Ecol. Process. 2015, 4, 3. [Google Scholar] [CrossRef]
  65. Wang, G.Y.; Huang, Y.G.; Li, R.F.; Chang, J.M.; Fu, J.L. Influence of vetiver root on strength of expansive soil-experimental study. PLoS ONE 2020, 15, e0244818. [Google Scholar] [CrossRef] [PubMed]
  66. Camargo, C.E.D.O.; Ferreira Filho, A.W.P. Genetic control of wheat seedling root growth. Sci. Agric. 2005, 62, 325–330. [Google Scholar] [CrossRef]
  67. Mathew, I.; Shimelis, H.; Mwadzingeni, L.; Zengeni, R.; Mutema, M.; Chaplot, V. Variance components and heritability of traits related to root: Shoot biomass allocation and drought tolerance in wheat. Euphytica 2018, 214, 225. [Google Scholar] [CrossRef]
  68. Cane, M.A.; Maccaferri, M.; Nazemi, G.; Salvi, S.; Francia, R.; Colalongo, C.; Tuberosa, R. Association mapping for root architectural traits in durum wheat seedlings as related to agronomic performance. Mol. Breed. 2014, 34, 1629–1645. [Google Scholar] [CrossRef] [PubMed]
  69. Xie, Q.; Fernando, K.M.; Mayes, S.; Sparkes, D.L. Identifying seedling root architectural traits associated with yield and yield components in wheat. Ann. Bot. 2017, 119, 1115–1129. [Google Scholar] [CrossRef]
  70. Bai, C.; Ge, Y.; Ashton, R.W.; Evans, J.; Milne, A.; Hawkesford, M.J.; Whalley, W.R.; Parry, M.A.J.; Melichar, J.; Feuerhelm, D.; et al. The relationships between seedling root screens, root growth in the field and grain yield for wheat. Plant Soil 2019, 440, 311–326. [Google Scholar] [CrossRef]
Figure 1. Root and shoot traits in response to (a). the main effect of nutrient availability (values averaged across cultivars), (b). the main effect of genotype (values averaged across nutrient availability levels), and (c). the interaction between genotype and irrigation (i.e., GxE interaction). Mean values are overlaid by the bars of the standard deviation. Different letters above the bars indicate significant (p < 0.05) or non-significant (n.s.) (p > 0.05) differences among the means of the post hoc Tukey test.
Agronomy 14 00775 g001
Figure 2. Scatterplot of the bivariate relationship between leaf mass and root length (left) and mass (right). Blue solid circles = Lankaodali HS; red solid circles = Lankaodali NS; purple solid triangles = Rebelde HS; green solid triangles = Rebelde NS.
Agronomy 14 00775 g002
Figure 3. Scatterplots of leaf area vs. root length for each treatement combinations. Solid circles = Lankaodali; solid triangles = Rebelde; red solid circles = Lankaodali half-strength (HS); blue solid circles = Lankaodali full-strength (FS); green solid triangles = Rebelde HS; purple solid triangles = Rebelde FS.
Agronomy 14 00775 g003
Figure 4. Mean values of shoot (top) and root (bottom) traits as affected by water availability (DS = drought stress, WW = well irrigated) as the main effect values averaged across cultivars. Mean bars are overlaid by bars of standard deviation. Different letters above the bars indicate significant differences between the means of post hoc Tukey test (p < 0.05).
Agronomy 14 00775 g004
Figure 5. Root biometry (top) and rhizosheath traits (bottom) as affected by the main effect of the cultivar (values averaged across levels of water availability). Means are overlaid by bars of standard deviation. Different letters above the bars indicate significant differences between the means of the post hoc Tukey test (p < 0.05) or non-significant (n.s.) differences (p > 0.05).
Agronomy 14 00775 g005
Figure 6. Cultivar x water supply interaction effects on shoot traits (top) and root traits (bottom). DS= drought stress, WW = well irrigated). The mean bars are overlaid by bars of standard deviation. Different letters upon the bars indicate significant significant (p < 0.05) differences among the means at the post hoc Tukey test.
Agronomy 14 00775 g006
Table 1. ANOVA, variance components, Finlay–Wilkinson analysis, and heritability values for shoot and root parameters (RL = root length, RM = root mass, RSL = specific root length).
0 vs. 50% (v/v) Hoagland
Solution
Fully Fixed ModelFully Random ModelFinlay–Wilkinson AnalysisHeritability
Leaf Mass (g)p-Value% Variance
Explained
RankGenMeanSensitivity
(p-Value)
Broad-Sense Heritability
trial8.391 × 10−921.18Lankaodali0.0340.00020.81
genotype3.699 × 10−1246.4Rebelde0.016
genotype:trial0.000210522.01
residuals 10.4
RL (cm)p-value% Variance explainedRankGenMeanSensitivity (p-value)Broad-sense heritability
trial0.0051880Lankaodali301.7750.01880.90
genotype2.16 × 10−966.23Rebelde150.385
genotype:trial0.01881312.77
residuals 21.01
RM (g)p-value% Variance explainedRankMeanSensitivity (p-value)Broad-sense heritability
trial0.052050Lankaodali0.0200.01420.80
genotype1.25 × 10−757.88Rebelde0.011
genotype:trial0.0141613.14
residuals 28.98
SRL (cm g−1)p-value% Variance explainedRankMeanSensitivity (p-value)Broad-sense heritability
trial0.0489476.5Rebelde13,596.1200.55630.93
genotype0.00160137.88Lankaodali15,536.780
genotype:trial0.5563140
residuals 55.62
Average diameter (mm)p-value% Variance explainedRankMeanSensitivity (p-value)Broad-sense heritability
trial0.617540Lankaodali0.4330.51470.87
genotype0.0152823.74Rebelde0.458
genotype:trial0.514720
residuals 76.26
Root-to-shoot mass ratio (g g−1)p-value% Variance explainedRankMeanSensitivity (p-value)Broad-sense heritability
trial1.078 × 10−866.28Rebelde0.7040.16490.83
genotype0.00486810.48Lankaodali0.599
genotype:trial0.1648842.17
residuals 21.07
Table 2. Correlation matrix of shoot and root traits for Lankaodali (top) and Rebelde (bottom); significant correlations (p < 0.05) are reported in bold.
LankaodaliLeaf MassRoot MassRoot LengthRoot Surface AreaRoot VolumeRoot Tissue DensityRoot Average DiameterRoot–Shoot Mass RatioSpecific Root Length
Leaf mass10.830.820.840.85−0.230.44−0.54−0.11
Root mass 10.910.950.96−0.030.50.01−0.34
Root length 10.990.96−0.330.25−0.130.06
Root surface area 10.99−0.330.38−0.13−0.04
Root volume 1−0.310.49−0.12−0.13
Root tissue density 1−0.060.47−0.71
Root average diameter 1−0.07−0.64
Root shoot mass ratio 1−0.38
Specific root length 1
RebeldeLeaf massRoot massRoot lengthRoot surface areaRoot volumeRoot tissue densityRoot average diameterRoot–shoot mass ratioSpecific root length
Leaf mass10.210.450.420.310−0.41−0.740.56
Root mass 10.860.90.850.73−0.620.490.19
Root length 10.970.790.57−0.850.190.65
Root surface area 10.910.48−0.710.250.54
Root volume 10.26−0.370.310.26
Root tissue density 1−0.680.490.05
Root average diameter 1−0.07−0.77
Root shoot mass ratio 1−0.34
Specific root length 1
Table 3. ANOVA Table for experiment 2.
p-Values
CultivarNutrient SolutionCultivarx Nutrient SolutionSample Size
ShootLeaf length (cm)n.s.n.s.n.s.27
Coleptile length (cm)<0.0010.015n.s.27
Leaf mass (g)<0.001n.s.n.s.27
Leaf area (cm2)<0.001n.s.n.s.27
RootRoot mass (g)<0.001n.s.n.s.27
Root lenght (cm)<0.001n.s.n.s.27
Primary root length (cm)<0.0010.002n.s.27
Lateral root length (cm)<0.001n.s.n.s.27
Root volume (cm3)<0.0010.032n.s.27
Average diameter (mm)0.049n.s.n.s.27
Root tissue density (g cm−3)0.038n.s.n.s.27
Specific root length (cm g−1)n.s.n.s.n.s.27
Root-to-shoot ratioRoot-to-shoot mass ratio (g g−1)<0.001<0.0010.01127
Root surface area to leaf area (cm2 cm−2)0.004<0.001n.s.27
Table 4. Mean values and standard deviation for shoot and root traits (values averaged across nutritional levels).
LankaodaliRebelde
MeanSt. Dev.MeanSt. Dev.
Coleoptile length (cm)5.4690.3254.3360.237
Plant height (cm)21.3852.34720.4861.542
Leaf mass (g)0.0270.0050.0180.002
Leaf area (cm2)14.0122.7259.0551.095
Root length (cm)174.96648.234101.08611.141
Root dry mass (g)0.0170.0030.0100.001
Root average diameter (mm)0.5750.0280.5560.018
Specific root length (cm g−1)10,287.9561252.64110,219.8141289.727
Pimary root length (cm)27.6151.31925.2431.476
Number of seminal roots5.70.84.40.9
Lateral root length (cm)147.35147.84275.84410.204
Root-to-shoot area ratio (cm2 cm−2)2.2400.3291.9760.344
Root tissue density (g cm−3)0.0380.0030.0410.004
Table 5. Correlation matrix between shoot and root morphological traits for Lankaodali (top) and Rebelde (bottom), pooled data across nutritional levels. Significant correlation coeffcients (p < 0.05) are reported in bolds.
LankaodaliLeaf MassLeaf AreaRoot LengthRoot MassLateral LengthPrimary
Root Length
Root VolumeRoot Tissue DensityRoot Average DiameterRoot–Shoot Mass RatioRoot–Shoot Area Ratio
Leaf mass10.950.90.870.90.310.84−0.25−0.77−0.420.11
Leaf area 10.760.770.760.20.73−0.21−0.65−0.47−0.12
Root length 10.9410.310.96−0.42−0.78−0.080.53
Root mass 10.940.240.96−0.25−0.610.080.46
Lateral length 10.280.96−0.42−0.77−0.080.53
Primary root length 10.29−0.21−0.31−0.220.15
Root volume 1−0.51−0.580.070.58
Root tissue density 10.130.01−0.5
Root average diameter 10.46−0.19
Root–shoot mass ratio 10.61
Root–shoot area ratio 1
RebeldeLeaf massLeaf areaRoot lengthRoot masslateral LengthPrimary root lengthRoot volumeRoot tissue densityRoot average diameterRoot–shoot mass ratioRoot–shoot area ratio
Leaf mass10.54−0.19−0.04−0.14−0.49−0.240.26−0.12−0.66−0.54
Leaf area 10−0.20.03−0.190.05−0.340.1−0.52−0.71
Root length 10.570.990.670.87−0.29−0.040.530.68
Root mass 10.550.490.70.480.370.770.55
Lateral length 10.590.83−0.27−0.110.480.65
Primary root length 10.83−0.370.440.660.65
Root volume 1−0.290.460.650.63
Root tissue density 1−0.10.22−0.03
Root average diameter 10.330.06
Root–shoot mass ratio 10.76
Root–shoot area ratio 1
Table 6. ANOVA table for experiment 3. Significance of the experimental factors and their interaction is reported in the second column, variance component is reported in the third column, and broad-sense heritability values are reported in the fourth column. RL = root length (cm), RM = root mass (g), RSR = root-to-shoot mass ratio (g g−1), SRL = specific root length (cm g−1), RTD = root tissue density (g cm−3).
Fully Fixed ModelFully Random Model
RL (cm)p-value% Variance explainedBroad-Sense Heritability
trial0.000588547.680.43
genotype0.01847166.92
genotype:trial0.135046212.11
residuals 33.29
RM (g)p-value% Variance explainedBroad-sense heritability
trial0.181745.120.74
genotype0.0432621.33
genotype:trial0.343492.99
residuals 70.56
RSR (g g−1)p-value% Variance explainedBroad-sense heritability
trial0.0439230.990.84
genotype0.0317231.67
genotype:trial0.407540
residuals 37.34
SRL (cm g−1)p-value% Variance explainedBroad-sense heritability
trial0.00397851.670
genotype0.8772240
genotype:trial0.5870840
residuals 48.33
RTD (g cm−3)p-value% Variance explainedBroad-sense heritability
trial0.00362840.260
genotype0.5761570
genotype:trial0.04896312.56
residuals 47.18
Fresh rhizosheath mass (g)p-value% Variance explainedBroad-sense heritability
trial0.000163876.210.85
genotype0.037115711.06
genotype:trial0.70690030
residuals 12.72
Leaf area (cm2)p-value% Variance explainedBroad-sense heritability
trial0.00000676862.430.95
genotype0.0000595430.53
genotype:trial0.11642.73
residuals 4.31
Shoot biomass (g)p-value% Variance explainedBroad-sense heritability
trial0.02618312.840.74
genotype0.00125143.76
genotype:trial0.04898124.46
residuals 18.94
Disclaimer/Publisher’s Note: The statements, opinions and data contained in all publications are solely those of the individual author(s) and contributor(s) and not of MDPI and/or the editor(s). MDPI and/or the editor(s) disclaim responsibility for any injury to people or property resulting from any ideas, methods, instructions or products referred to in the content.

