Abstract
Strawberries are by far the most produced soft fruit (blueberries, raspberries, blackberries, and strawberries) worldwide, with China and the US being the two countries with the most production. In the US, strawberries reached a farm gate value of more than USD 3 billion in 2023 and are predominantly grown in the open field on an annual cycle in hilled-up soil beds using plastic mulch (plasticulture). This process relies on adequate pre-plant fertilizer application for plant establishment and fruit development. In North Carolina (US), it is current practice to apply pre-plant fertilizer containing 67 nitrogen (N) kg/ha; however, with increasing fertilizer costs and environmental concerns, questions remain as to whether or not pre-plant full-spectrum fertilizer rates can be reduced and substituted with organic low-N fertilizer sources, such as Polysulphate, without impacting yield or fruit quality. For this reason, field trials were established to evaluate the impact of pre-plant fertilizer rates on strawberry production (‘Camarosa’). Trials were conducted in the 2019–2020 and 2020–2021 seasons at two locations in North Carolina. The following N-rate pre-plant fertilizer treatments were applied: 80.1, 67.3, 54.1, 41.1, 33.6, 28.0, and 0 kg/ha. NO3 and NH4 content were frequently assessed in each replicate in the raised bed profile between planting and spring fertilizer application. Marketable and total strawberry yields were assessed over 6 weeks in the spring of 2020 and 2021. Our trial results showed that, especially in sandy soil, N rapidly declined under plastic within the first 8 weeks after pre-plant fertilizer application. However, no impact between pre-plant fertilizer rates and plant yield was observed. Treatments that contained Polysulphate and lower amounts of full-spectrum fertilizer showed significantly lower N concentrations in the soil while maintaining similar yields and fruit quality compared to grower-standard pre-plant fertilizer treatments. In summary, our results show that it is possible to reduce N content in pre-plant fertilizer by up to 50% compared to current recommendations without causing yield loss in short-day strawberry cultivars.
1. Introduction
Strawberries are planted as an annual crop using transplants (plug plants, bare roots, cut-offs) into raised beds covered with plastic mulch and irrigated through one or two buried drip lines (an annual hill plasticulture system). In the US, the majority of strawberries are grown in annual hill plasticulture systems. In most of California as well as in the southeastern US, strawberries are planted between September and October [1,2]. Strawberry growers in the North Carolina (NC, US) mountain and piedmont regions usually plant in mid- to late-September, while growers in eastern NC plant from mid- to late-October. Plug plants require less overhead irrigation during plant establishment compared to other transplants. In general, plug plants are faster to establish than other transplant options [1]. Strawberries grown in annual hill plasticulture systems are harvested in April and May, about 8 months after planting. Plants are expected to yield 454–544 g per plant [1].
In conventional strawberry production systems in the southeastern US, strawberries are fertilized twice a season. The first application is pre-plant, which occurs in the fall before planting to promote plant establishment. Pre-plant applications are often full-spectrum granular fertilizers broadcasted in the field shortly before fumigation, bed shaping, and plastic laying. The second application is fertigation, which occurs in the spring through the irrigation system to support flowering and fruiting. Fertigation usually starts before the harvest season and continues for several weeks throughout the harvest season. Applying fertilizer both as a pre-plant and an in-season application has been shown to increase fruit yield in several metrics [3,4]. A balanced fertilizer regime is essential throughout the entirety of the season to support plant establishment and fruit development.
Strawberry growers rely on various fertilizer sources to supply an adequate amount of nutrients for plant growth and fruit production. Some growers choose to apply granular full-spectrum fertilizers (6-6-18 NPK or 10-10-10), while others may choose to create custom blends. The custom blends are often sourced from phosphate-diammonium (18-46-0), triple superphosphate (0-46-0), potash-potassium nitrate (13-0-44), potassium sulfate (0-0-50), potassium chloride (0-0-60), or ammonium sulfate (21-0-0), and are mixed with a range of micronutrients. The current recommendation for nitrogen (N) for growers in NC (US) is 67 kg/ha for pre-plant fertilizer [5].
Fertilizer programs in excessive amounts can have negative impacts on the environment and crops. Environmentally, an oversupply of N often leads to the leaching of nitrate into groundwater. Nitrate, along with other fertilizer residues such as phosphates, often passes into larger water bodies, leading to over-fertilization of lakes and seashores [6]. Nitrogen severely contributes to eutrophication in American waterways [7]. Along with the environmental dangers of unbalanced fertilizer regimes [8], the overuse of fertilizers can also have unwanted side effects on the strawberry crop. For nitrogen, specifically, overapplication can lead to lower yields and decreased fruit firmness [5,9,10]. Additionally, granular fertilizer is a costly input for growers. Adding unnecessary amounts of N will increase crop costs while potentially decreasing yield, fruit quality, and overall profits. These considerations highlight that it is important to apply the appropriate amount of fertilizer to maximize the nutritional benefit while minimizing the negative environmental and crop effects.
Polysulphate may be an alternative source of macronutrients to minimize growers’ application of N in their fields. Polysulphate is a certified organic granular fertilizer that contains 48% sulfur, 14% potassium, 17% calcium, and 6% magnesium (ICL Group Ltd., Tel Aviv, Israel). Polysulphate would help provide the essential macronutrients that are physiologically necessary for plant and fruit development while eliminating excess N application [5]. The chemical structure of Polysulphate, polyhalite [11], releases nutrients slowly, which reduces the leaching of calcium, magnesium, potassium, and sulfur compared to other granular fertilizers [12]. Polyhalite has previously been shown to be an effective source of nutrients in other agricultural crops, such as winter wheat and tomatoes [13,14]. Strawberry growers could potentially benefit from substituting a portion of their full-spectrum granular fertilizer with Polysulphate. This substitution could reduce the cost of granular fertilizer and decrease nitrogen leaching while maintaining the macronutrients necessary for crop establishment and fruit development.
Currently, there is a gap in the literature on the quantity and duration of plant-available nitrogen after pre-plant fertilization. Furthermore, the use of alternative pre-plant fertilizer sources with lower N rates for strawberry development and fruit yield has not been addressed in previous studies. In this study, we hypothesized that fall-applied pre-plant Polysulphate, in combination with lower rates of full-spectrum granular fertilizers, will reduce the soil N concentration during plant establishment but will not affect plant development or strawberry yield. To investigate this hypothesis, we (1) evaluated the N soil concentration in raised beds using six fall-applied pre-plant fertilizer rates co-applied with Polysulphate and (2) evaluated the impact of those fertilizer rates on yield and fruit quality (‘Camarosa’).
2. Materials and Methods
2.1. Field Site Preparation and Treatments
To investigate the impact of pre-plant fertilizer treatments on N soil concentration and strawberry yield, field experiments were conducted at two agricultural research stations in NC (US) over two years (September 2019 to May 2020, September 2020 to June 2021). The experiments took place at the Piedmont Research Station (PRS) in Salisbury, NC (lat. 35.6967° N, long. 80.6227° W; Lloyd clay loam) and the Central Crops Research Station (CCRS) in Clayton, NC (lat. 35.6680° N, long. 78.5048° W; Wagram sandy loam). All experiments were set up as a split-plot design. Each field site had one plot per treatment (100 feet of bed), and each plot had four replicates. Each replicate was planted with 20 plug plants (Fragaria × ananassa, ‘Camarosa’).
Field trial plots were measured and fertilized on 6 September 2019 and 16 September 2020 at PRS and 12 September 2019 and 8 September 2020 at CCRS. Both field locations had trial plots that were three rows, and each row contained two treatments. The PRS rows measured 45.7 m, and the CCRS rows measured 61.0 m. PRS had 15 cm high beds in both years, and CCRS had 20 cm high beds in both years. All rows were 1.5 m wide. PRS was not fumigated either year. CCRS was fumigated with Pic-Clor 60 (shank application, 1400 L/ha, TriEst, Rocky Mount, NC, USA) on 14 September 2019 and 10 September 2020. One line of drip tape (30 cm perforation, TriEst, Rocky Mount, NC, USA) and plastic mulch (VIF Film, TriEst, Rocky Mount, NC, USA) was laid at both locations in both years.
At both sites and years, the pre-plant treatments were Grower Standard (67.25 kg/ha N applied as 1120.85 kg/ha NPK), Low Polysulphate (54.13 kg/ha N applied as 902.29 kg/ha N-P-K and 280.02 kg/ha Polysulphate), Medium Polysulphate (41.09 kg/ha N applied as 684.84 kg/ha N-P-K and 560.43 kg/ha Polysulphate), High Polysulphate (27.98 kg/ha N applied as 466.27 kg/ha N-P-K and 840.64 kg/ha Polysulphate), and Non-treated Control (NTC) (no pre-plant treatment) (Table 1). At PRS for both years, there was a sixth pre-plant treatment of Half-Grower Standard (33.63 kg/ha N applied as 560.43 kg/ha N-P-K). At CCRS for both years, there was a sixth pre-plant treatment of High N (80.1 kg/ha N applied as 1334.93 kg/ha N-P-K). All pre-plant treatments besides the NTC will be referred to as N-containing pre-plant treatments. The pre-plant fertilizers used at PRS and CCRS were 6-6-18 N-P-K (Dixie Farm Tested Fertilizers, New Bern, NC, USA) and Polysulphate (ICL Group Ltd., Tel Aviv-Yafo, Israel). Fall pre-plant fertilizer was applied by hand broadcasting before bed shaping. Spring fertilization began on 19 March 2020 and 23 March 2021 at PRS and on 30 March 2020 and 22 March 2021 at CCRS. Spring fertigation was applied at a rate of 17 kg/ha/week of 13.6-0-46 N-P-K at PRS and 12.53 kg N/ha/week of 13.6-0-46 N-P-K at CCRS.

Table 1.
Summary of pre-plant treatments applied to strawberry (Fragaria × ananassa, ‘Camarosa’) field trials. Fertilizer rates of 6-6-18 NPK granular full-spectrum fertilizer and Polysulphate are listed along with the corresponding nutrient content applied. Treatments are listed in descending order of nitrogen content.
2.2. Soil and Plant Tissue Sampling
Soil N concentrations were assessed with 25.4 cm cores, which were taken every 4–6 weeks from planting until the first bloom. At PRS in the 2019–2020 season, samples were collected on 25 September, 15 November, 2 January, and 18 February. In the 2020–2021 season, samples were collected on 14 October, 10 November, 10 December, 15 January, and 24 February. At CCRS in the 2019–2020 season, samples were collected on 7 October, 26 November, 10 January, and 25 February. In the 2020–2021 season, samples were collected on 26 October, 17 November, 17 December, 22 January, and 5 March. Three cores per replicate were split into 0–12.7 cm depth and 12.7–25.4 cm depth and combined at their respective depths. Soil samples were stored in a −20 °C freezer (Frigidaire, Charlotte, NC, USA). Frozen soil samples were sieved (mesh size of 25 for PRS, 10 for CCRS) (Fisher Scientific, Hampton, NH, USA). N was extracted by combining 5 g of soil with 50 mL of 1 M KCl. The resulting solutions were shaken on a shaker table (New Brunswick Scientific Co., G10 Gyrotory Shaker, Edison, NJ, USA, customized) and then filtered [15]. Samples were then sent to North Carolina State University’s (NC State) Environmental and Agricultural Testing Services (EATS). At EATS, samples were analyzed for NO3 and NH4 content using a Lachat Quikchem flow injection analysis system (Hach Co. Quickchem 8500 series 2, Loveland, CO, USA). Lachat QuikChem systems utilize a flow injection colorimetric analyzer to analyze water and soil extracts for inorganic N and phosphate. Soil dry weight was assessed (Fisher Scientific Isotemp Incubator Model 630D, Hampton, NH, USA) at 40 °C for 24 h, and soil moisture factor was determined using methods described by Maynard et al. [15].
Thirty leaf trifoliate and petioles were collected as one combined sample per treatment, composed of the most recently matured leaf (MRML). Plant tissue samples were collected twice at both sites in 2019–2020 and four times in 2020–2021. Cold weather in 2019 impacted plant growth in early 2020, and later, university system-wide COVID-19 restrictions Samples led to fewer tissue samples during the 2019–2020 season. All tissue samples were sent to the North Carolina Department of Agriculture and Consumer Services (NCDA&CS) for mineral nutrient analysis using inductively coupled plasma optical emission spectroscopy (ICP-OES). Nitrate was analyzed by continuous flow analysis using an auto-flow spectrophotometric analyzer (Skalar Analytical B.V., Breda, The Netherlands).
2.3. Marketable Yield and Fruit Weight
Strawberries were harvested twice a week during the harvest season. At PRS, harvests were from 17 April to 22 May in 2020 and from 26 April to 1 June in 2021. At CCRS, harvests were from 19 April to 27 May 2021. Due to university-wide COVID-19 pandemic restrictions, 2020 yields could not be assessed at CCRS. Fruit was categorized as marketable or unmarketable based on visual imperfections based on USDA grading standards [16]. Unmarketable fruit exhibited heavy deformation, disease symptoms, small size, pest predation, and water damage. Marketable and unmarketable yields were weighed for each harvest (Mettler-Toledo, SB32000 Hi-Cap Scale, Columbus, OH, USA).
Average fruit weight was measured by collecting a subsample of 25 fruit three times at PRS in 2021 (3 May, 17 May, and 24 May) and three times at CCRS in 2021 (29 April, 13 May, and 20 May). Fruit weight samples were only collected from marketable fruits. Fruit weights were not collected for the 2019–2020 season at either site due to university-wide COVID-19 pandemic restrictions.
2.4. Fruit Chemistry
In 2021, strawberry fruit samples were taken on 3 May, 17 May, and 24 May at PRS and on 29 April, 13 May, and 20 May at CCRS. Each sample contained 10 strawberry fruits. Fruit samples were stored in a −20 °C freezer (Frigidaire, Charlotte, NC, USA). Fruit chemistry analysis measured the pH, total soluble solids, and acidity of the samples. Thawed samples were homogenized and filtered (Whatman, Maidstone, UK). Filtered juice was tested for pH using a pH/conductivity meter (Apera, PC800, Columbus, OH, USA). Total soluble solids were analyzed using a Brix-acidity meter (Atago, Pocket Brix-Acidity Meter, Tokyo, Japan). To assess acidity, samples were diluted at a 1:50 solution (w/w) with deionized water and measured with a Brix-acidity meter (Atago, Pocket Brix-Acidity Meter, Tokyo, Japan). The Brix-acidity meter was set on standard curve 4 (strawberry). Due to the university-wide COVID-19 pandemic restrictions, fruit chemistry and fruit weight data were not assessed in the 2019–2020 season.
2.5. Statistical Analysis
R Studio version 1.4.1103 was used to analyze all data. Yield, fruit weight, and fruit chemistry data were analyzed with a two-way ANOVA (alpha = 0.05, SS type I model) by treatment and date. A Fisher LSD test (alpha = 0.05; agricolae package, de Mendiburu, 2021) was performed to analyze the ANOVA test results. Soil N content (NH4+, NO3−, and total N) was analyzed in SAS (SAS Institute, Cary, NC, USA) utilizing GLIMMIX (alpha = 0.05, SS type III model) by treatment and sampling date interaction. The Grubbs and the Dixon outlier tests were performed on the data for PRS 2020–2021 soil N concentrations, and 27 samples were identified as outliers. All samples identified as outliers were tested and analyzed again using the methods listed above [15]. All samples came back with similar results and were kept in the data set. All graphs were made in Excel (Excel 2016, Microsoft Corporation, Redmond, WA, USA).
3. Results
3.1. Soil and Plant Tissue Nitrogen Concentration
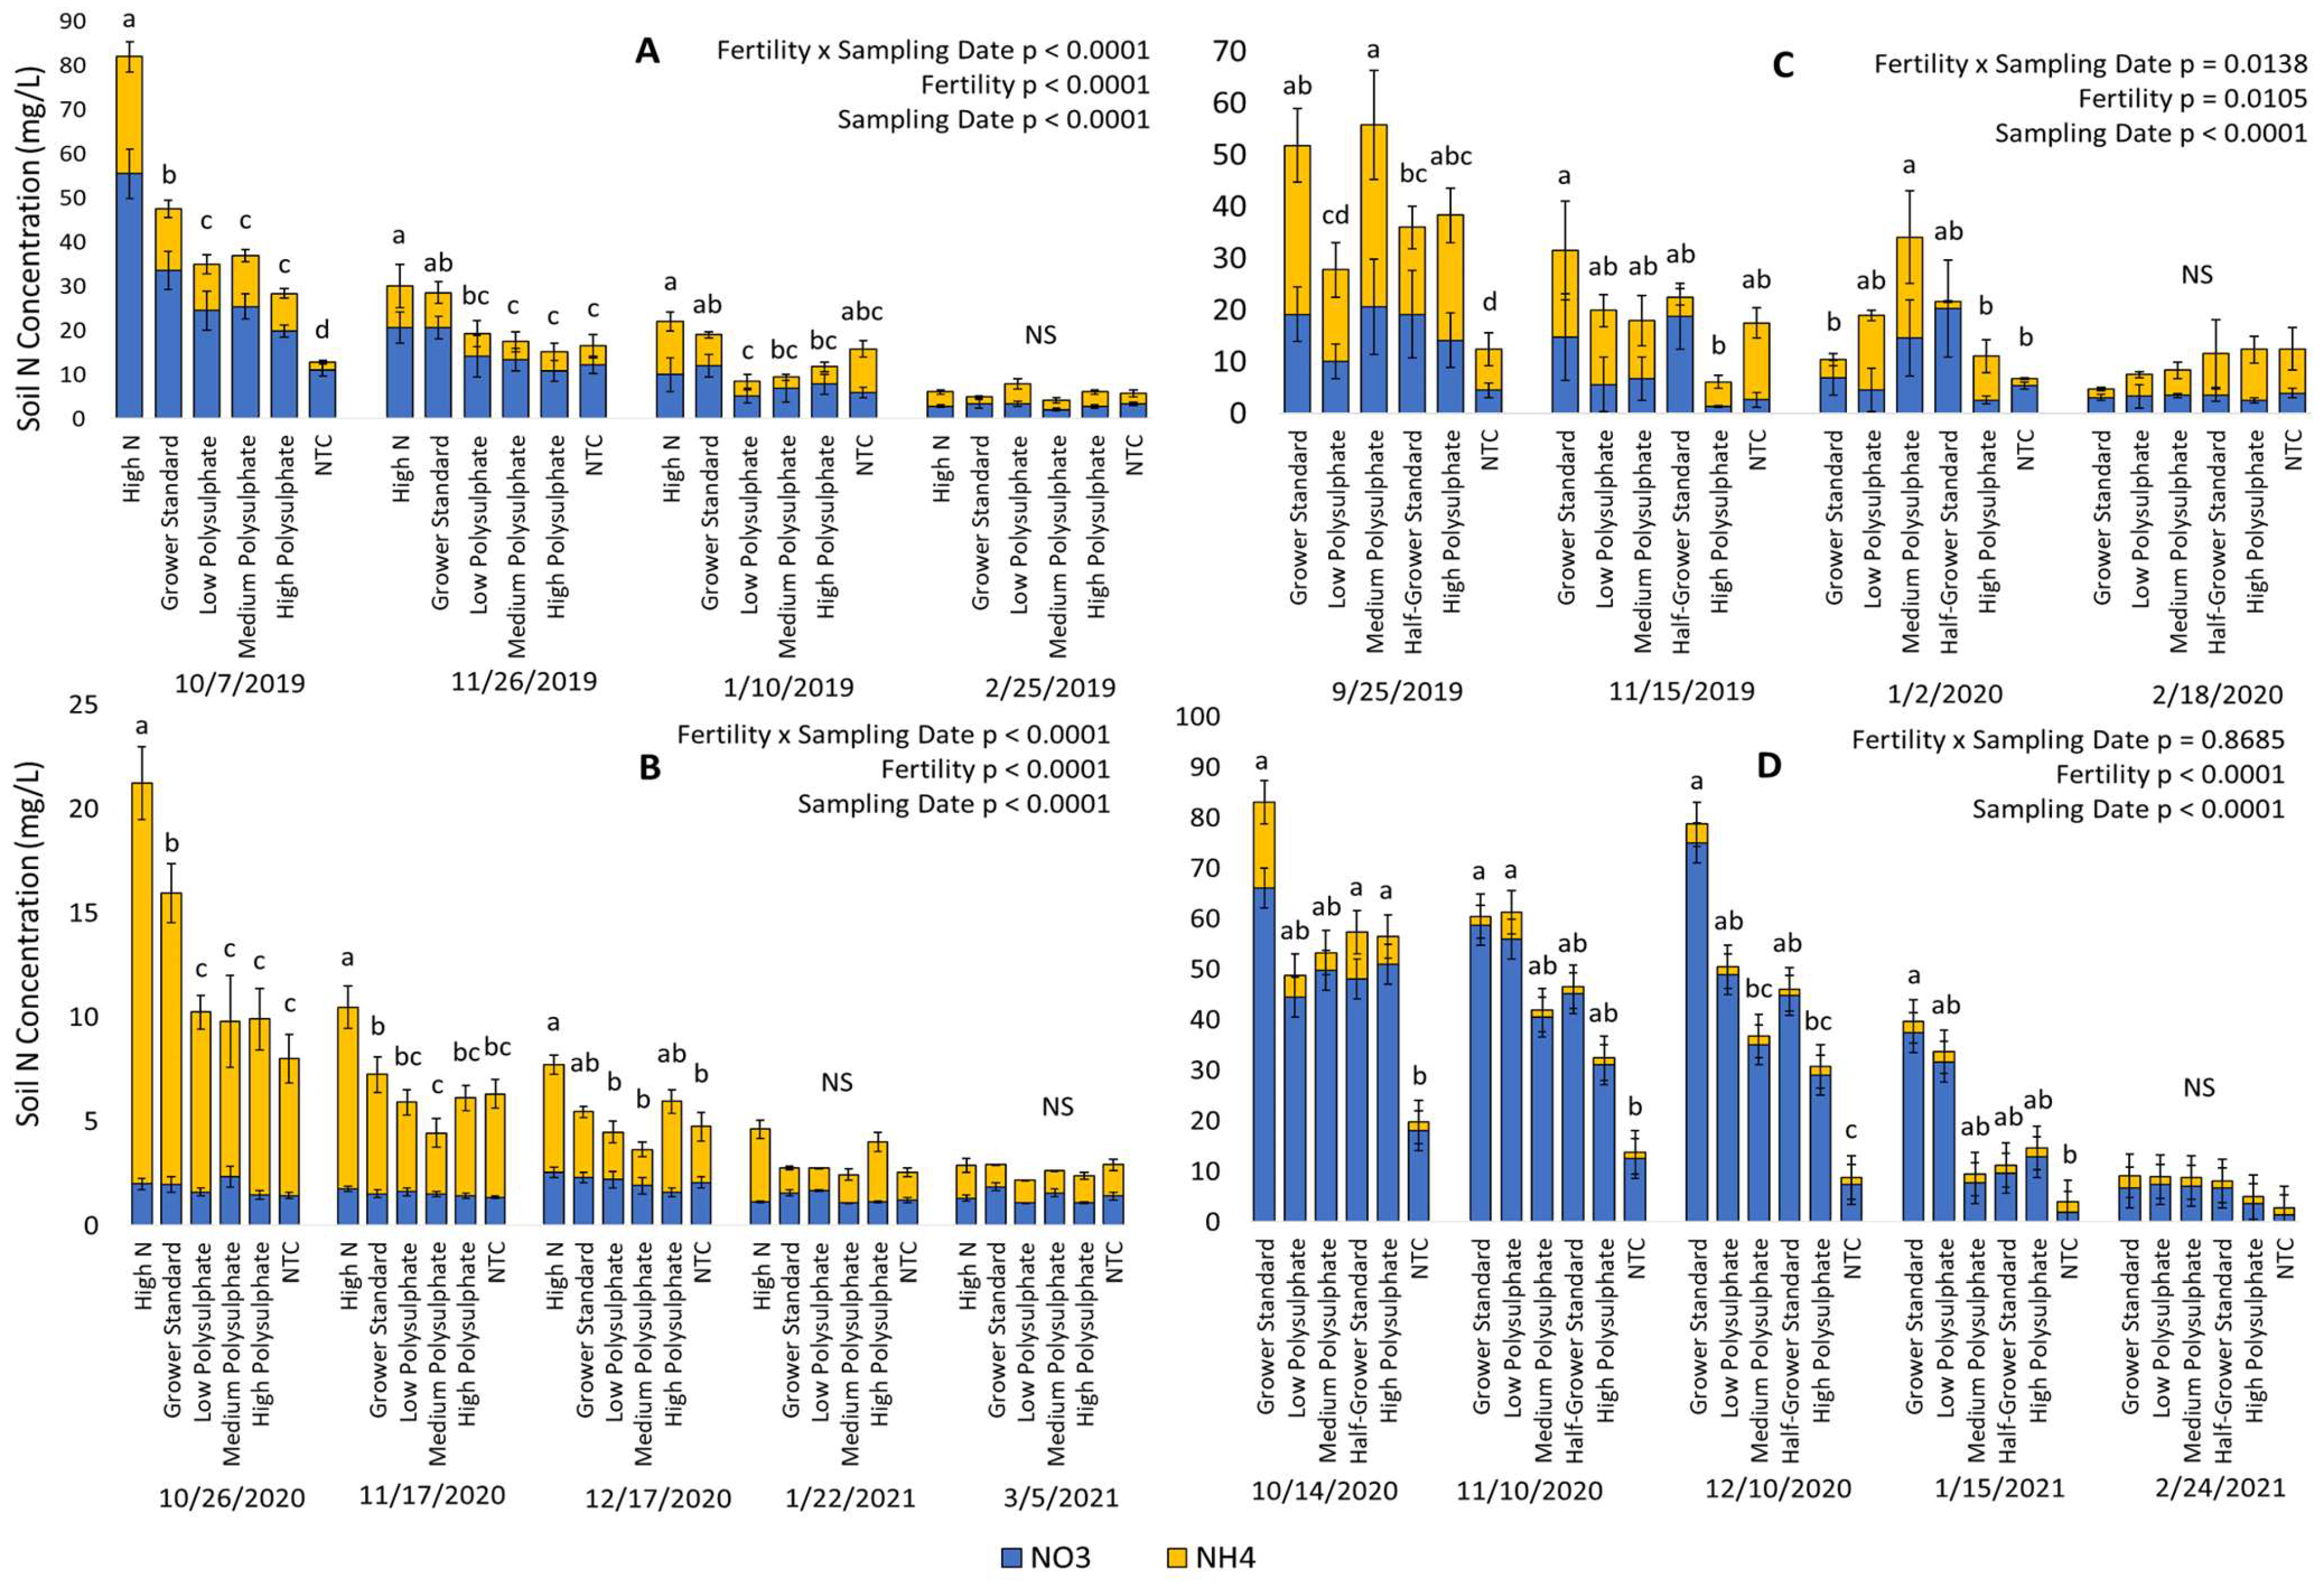
In general, a rapid decline in overall N soil concentration could be observed in the first 8 weeks after pre-plant application at both sites and years (Figure 1). Pre-plant fertilizer rates with higher N content showed higher overall soil N concentrations after planting and declined through winter. Results from the PRS trial (clay-loamy soil) differed from the CCRS trial (sandy loam) in overall soil N concentration and N forms.
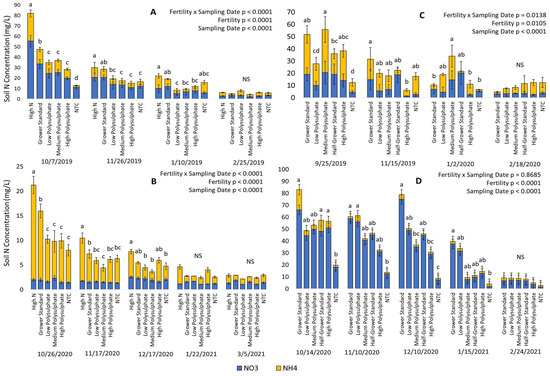
Figure 1.
Soil nitrogen (N) concentrations by soil sample date for pre-plant treatments applied to strawberry (Fragaria × ananassa, ‘Camarosa’) field trials. N is listed as NO3, NH4, and overall soil N concentration. (A) Soil N concentration at the CCRS in 2019–2020. (B) Soil N concentration at the CCRS in 2020–2021. (C) Soil N concentration at the PRS 2019–2020. (D) Soil N concentration at the PRS in 2020–2021. Differing letters above the bars within a date represent significant differences in the total N concentration in the soil across treatments. Dates with ‘NS’ above them did not have significant differences observed.
At CCRS in 2019–2020, the overall soil N concentration decreased from fall planting (12 September) until one month before spring fertilization began (30 March) (Figure 1A). High N and Grower Standard treatments showed significantly higher overall N soil concentrations after planting, with a rapid decline within the first 30 days. There were higher detected levels of NO3 compared to NH4 across most treatments and sampling dates.
In the following year, a similar decrease in overall N soil concentration was observed at CCRS (Figure 1B). The overall soil N concentration decreased from fall planting (8 September) until two weeks before spring fertilization (22 March). The High N treatment was significantly higher in overall N soil concentration compared to all other treatments at 30- and 60-days following pre-plant application. Similarly, the Grower Standard treatment had a significantly higher overall N soil concentration compared to the remaining treatments at 30 days following pre-plant application. At 90 days following pre-plant application, there was no difference in overall N soil concentration between pre-plant N treatments. The 2020–2021 growing season had higher amounts of NH4 compared to NO3, which was contrary to the previous growing season at CCRS.
At PRS in 2019–2020, the overall soil N concentration decreased over time from the pre-plant application (6 September) until one month before spring fertilization (19 March) (Figure 1C). There were a few exceptions to this, such as the Medium-Polysulphate treatment, which increased the overall N soil concentration from 60 to 90 days following pre-plant application. This increase can also be seen in the NTC treatment, which increased the overall N soil concentration from 30 to 60 days following the pre-plant application. There were higher amounts of NH4+ compared to NO3− across all treatments except for the Half Growers Standard treatment.
At PRS in 2020–2021, the overall soil N concentration decreased over time from the pre-plant application (16 September) until two weeks before spring fertilization began (23 March) (Figure 1D). These data had the highest observed levels of overall soil N concentrations from both locations and years. The interaction of fertility rate and sampling date was not observed to be significant. While no significant differences were observed within N-containing pre-plant fertilizer treatments, Grower Standard, Medium Polysulphate, and High Polysulphate treatments had significantly higher overall N concentrations compared to the NTC at 30 days following pre-plant application. These samples had higher levels of NO3− compared to NH4+ and showed the largest disparity between nitrogen ions among the data collected.
At CRS in 2019–2020 and 2020–2021, there were no differences in N concentration across treatments. At PRS in 2019–2020, the tissue samples from treatments with Medium Polysulphate and High Polysulphate had the highest N concentration; however, N-containing pre-plant treatments were not significantly different. At PRS in 2020–2021, there were no differences in N concentration between the samples.
3.2. Marketable Yield and Fruit Weight
The effect of pre-plant treatments on cumulative marketable yield varied between locations and years (Figure 2). At CCRS in 2020–2021, there were no significant differences in marketable yield observed between pre-plant treatments (Figure 2A). At PRS in 2019–2020, the marketable yield of NTC was significantly lower than all N-containing pre-plant treatments (Figure 2B). Lastly, at PRS in 2020–2021, the Grower Standard, Medium Polysulphate, and High Polysulphate treatments had significantly lower yields than Low Polysulphate, Half-Grower Standard, and NTC (Figure 2C).
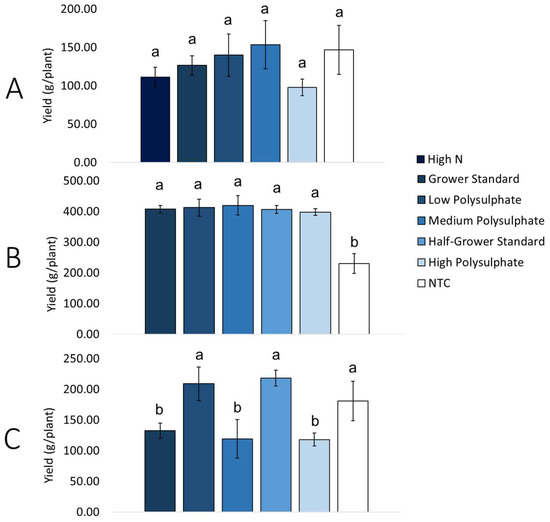
Figure 2.
Cumulative marketable yield of strawberry (Fragaria × ananassa, ‘Camarosa’) pre-plant fertilizer field trials. (A) Cumulative marketable yield of CCRS trial in 2020–2021. (B) Cumulative marketable yield of PRS trial in 2019–2020. (C) Cumulative marketable yield of PRS trial in 2020–2021. Differing letters above the bars represent significant differences in cumulative marketable yield across treatments.
Average fruit weight varied across treatments for both trial locations in the 2020–2021 season (Table 2). At CCRS, there was not much separation between treatments. For N containing pre-plant treatments, Medium Polysulphate had a lower fruit weight than Grower Standard and High Polysulphate. NTC was not significantly different from High N, Low Polysulphate, Medium Polysulphate, and High Polysulphate. At PRS, the Half-Grower Standard had significantly higher fruit weight compared to the other N-containing pre-plant treatments. The remaining N-containing pre-plant treatments were not significantly different from one another.
Table 2.
Average overall fruit weight for strawberry (Fragaria × ananassa, ‘Camarosa’) pre-plant fertilizer field trials. Trial occurred in 2020–2021 at PRS and CCRS. Differing letters after numbers indicate significantly different values.
3.3. Fruit Chemistry
Overall, pre-plant fertilizer treatments did not have an impact on fruit chemistry at the PRS location but did impact average acidity and pH at the CCRS location (Table 3 and Table 4). For both CCRS and PRS, soluble solids were significantly lower in NTC than in the N-containing pre-plant treatments. At CCRS, fruit acidity was significantly higher for High N and High Polysulphate treatments compared to Low Polysulphate, Medium Polysulphate, and NTC treatments (Table 3). Additionally, pH was significantly higher for High N, Grower Standard, and High Polysulphate treatments compared to Medium Polysulphate and NTC treatments. At PRS, there was no difference across treatments for both average acidity and pH (Table 4).
Table 3.
CCRS 2020–2021 strawberry (Fragaria × ananassa, Camarosa) average fruit chemistry from pre-plant fertilizer field trials. Fruit was measured for total soluble solids, acidity, and pH. Standard error of the means shown. Differing letters following means represent statistical differences.
Table 4.
PRS 2020–2021 strawberry (Fragaria × ananassa, ‘Camarso’) average fruit chemistry from pre-plant fertilizer field trials. Fruit was measured for total soluble solids, acidity, and pH. Standard error of the means shown. Differing letters following means represent statistical differences. There was no statistical difference between treatments for average acidity and average pH.
4. Discussion
4.1. Soil and Plant Tissue Nitrogen Concentration
Overall, N soil concentration decreased rapidly after pre-plant fertilizer application, especially in sandy soils at the CCRS trial location. Higher N pre-plant treatments had a higher overall N soil concentration immediately after pre-plant application across both years and locations compared to treatments with lower N pre-plant treatments. This is highlighted by the High N treatment (80.1 kg/ha N) at CCRS, which had higher overall N soil concentrations compared to all other treatments over both years. Conversely, the High Polysulphate treatment (28.0 kg/ha N) had a lower overall N soil concentration. These results align with the hypothesis that fertilizer treatments partially substituted with Polysulphate will lower N in soil beds compared to standard full-spectrum fertilizers.
Our tissue sample results indicated that increased N soil concentration did not correspond to increased plant N content. The petiole-leaf tissue sample is indicative of plant N content [5]. For both locations and years, the plant N content did not differ across all treatments, even when there was a significant difference detected in soil N concentration. Since the plant N content intake did not reflect the different soil N concentrations, the increased N from the higher N pre-plant treatments was left as surplus N in the soil beds. This difference between soil and tissue N was observed in previous pre-plant fertilizer studies. Albregts and Howard [17] found no difference in plant N content between pre-plant treatments (112 and 240 kg/ha N), while Bottoms et al. [18] found that varying rates (0, 43, 86 kg/ha N) of control release fertilizer had minimal effect on plant N content.
Soil N concentration performed differently over time between the two trial locations. The CCRS trial location detected more differences between treatments and had slower N soil decline compared to PRS. Potential explanations for the differences between trial locations include fumigation practices and soil type. The CCRS trial location was fumigated at the start of the season, while the PRS trial location was not fumigated. Conventional fumigation significantly reduces soil microbial populations [19]. Many soil microbes, such as Azobacter, impact N and other nutrient concentrations in the soil [20]. The CCRS trial location may have had a decreased N soil concentration due to the fumigation, which lowered the microbial population and, therefore, lowered the nutrient concentration. The PRS location was not fumigated and would have more biological activity throughout the whole season. The soil type and soil properties could also explain the difference between soil N concentrations. Soil types differ in cation exchange capacity (CEC), which is the degree to which soils adsorb and exchange cations. Soil with a higher CEC generally has a larger reserve of positively charged mineral nutrients and can buffer rapid changes [21].
Generally, our results indicated that N availability differs between seasons and that pre-plant fertilizer rates do not have a direct impact on yield. While this might be common knowledge in academia, it is not for growers who rely on similar pre-plant fertilizer rates every year, regardless of soil and climate conditions. Higher pre-plant fertilizer applications have led in most years and locations to higher N availability in later winter. This might push plants too early out of dormancy, especially with highly variable weather patterns like those observed in the southeastern US. On the other hand, in seasons of long-lasting early warming periods, higher N availability at that stage might improve the grower’s capacity to improve plant growth.
4.2. Fruit Chemistry
We observed no consistent impact of pre-plant treatments on strawberry fruit chemistry. At CCRS in 2020–2021, the only treatments that were consistently different across fruit chemistry were the High N treatment and NTC (Table 3). These treatments had the largest disparity of N-P-K between any pairwise comparison. For average acidity and average pH, the High Polysulphate treatments had significantly higher average acidity and a lower pH compared to the Low Polysulphate treatment. At PRS 2020–2021, there was no difference in soluble solids between N-containing pre-plant fertilizer treatments (Table 4). Additionally, there was no difference between average acidity and average pH across all treatments. Based on these results, we did not observe an effect of pre-plant N treatments on fruit chemistry. Similarly, Miner et al. [10] found that total acidity, pH, and soluble solids were not impacted by pre-plant N fertilizer rates (0, 34, and 67 kg/ha N). Wold and Opstad [22] also found that total acidity, pH, and soluble solids varied throughout the season but did not differ between pre-plant treatments (30, 50, and 80 kg/ha N).
The uniform fruit chemistry in our results may have been maintained by sufficient levels of macronutrients. For example, insufficient potassium can decrease fruit firmness [10], but throughout our trials, we were able to maintain pre-plant potassium by combining different rates of 6-6-18 (18% potassium) and Polysulphate (14% potassium). The secondary macronutrients in Polysulphate, such as sulfur (48%), magnesium (6%), and calcium (17%), were present across the treatments, providing the essential nutrients for fruit development and quality. By providing sufficient levels of macronutrients, fruit chemistry was not impacted by lowering the amount of N in pre-plant fertilizer.
4.3. Marketable Yield
As mentioned above, we did not observe a significant impact of N, or Polysulphate, on marketable strawberry yield. Summarizing the three sets of yield data, CCRS showed no differences between treatments, PRS 2019–2020 only showed a difference for NTC, and PRS 2020–2021 showed differences, but these differences did not correspond with Polysulphate or nitrogen quantities (Figure 2). The overall trend of our yield results is similar to the findings of Bottoms et al. [23], which found that pre-plant and fertigation N fertilizer application rates (118 to 424 kg/ha N) did not correlate with fruit yield for ‘Albion’. Bottoms differed in production methodology since the California strawberry harvest lasts 7–8 months, whereas the NC strawberry harvest lasts 6–8 weeks. Plus, Bottoms studied an ever-bearing cultivar that requires higher N compared to the June-bearing cultivar Camarosa used in our field experiments [24]. Despite these differences, we can still relate to similar findings, such as that the essential nutrients were within a sufficient range to support fruit development. Albregts et al. [25] studied N and K rates and observed that total marketable fruit was not affected by fertilizer rates (0N-0K, 17N-15K, 34N-30K, 51N-45K, 68N-60K kg/ha). Albregts and Chandler [4] studied slow-release fertilizers and observed that treatments without pre-plant N had the lowest yields compared to treatments with pre-plant N (0, 50, 100, 150 kg/ha N).
Contrary to our results, Miner et al. [10] investigated the effects of pre-plant N application rates on strawberry (Fragaria × ananassa, ‘Chandler’) fruit yield and quality at CCRS in NC (US). Miner et al. [10] evaluated marketable yield weight based on pre-plant (0, 34, 67 N kg/ha) and fertigation (0 to 1.1 kg/ha/day) treatments. In this study, the authors found that marketable yield increased as N increased and was maximized with pre-plant 60 kg/ha N. When considering pre-plant N individually, the optimal rate was found to be 34 kg/ha during their first year of study.
Santos [26] investigated the impact of higher N levels as well as a range of Sulfur treatments on the fruit yield of ‘Festival’ in Florida. In this system, plants are planted in early winter and cropped from November/December until April/May. In particular, S treatments showed a significant increase in early-marketable yield [26]. However, overall yield did not correlate with pre-plant N rates [27], putting into question the application of pre-plant N at higher rates given that adequate spring fertilization takes place. This, of course, might be true for winter planting, as it is common in FL (US). However, in the one year with less weather impact and a good fruit set, our non-treated control (NTC) had significantly lower yields than any treatment with pre-plan fertilizer. This might be due to a better onset of the plants and better crown development early on [28,29].
In general, our study agrees with the majority of studies conducted in similar strawberry planting systems (fall planting): pre-plant fertilizer is necessary for onset plants, but higher N rates in pre-plant fertilizer are not translating into more yield on their own [4,9,10,17,18,29]. However, it is important to emphasize that this study had two limitations. For once, this study was conducted under the COVID-19 lockdown in the US, which prohibited us from taking yield data at one location for the first season. Secondly, this study was impacted by a shortage of plant material due to the COVID-19 impact on supply chains, which led to late planting for the 2020–2021 season and, subsequently, lower yields.
Further research is required to evaluate the impact of pre-plant fertilizer on strawberry production in the US, using a range of cultivars and different types of soil. However, this study provides a first glimpse into the complexity of pre-plant fertilizer application to strawberries.
5. Conclusions
First and foremost, it is important to point out that this study was severely limited by the impact of COVID-19 on the direct ability to conduct research as well as on the overall supply chain. However, our results fall in line with the vast majority of the body of knowledge on the impact of pre-plant fertilizer on strawberry yield [4,9,10,17,18,29]. In particular, marketable yield, average fruit weight, and fruit chemistry were not impacted by the amount of N and Polysulphate in pre-plant fertilizers. We, therefore, conclude that full-spectrum fertilizers can be partially substituted with Polysulphate without loss of yield or fruit quality, especially in southeastern US strawberry production systems using the cultivar Camarosa.
Author Contributions
Conceptualization: M.H.; methodology: M.H., A.W. and A.L.-W.; software: M.H. and A.L.-W.; validation: M.H.; formal analysis: A.L.-W.; investigation: A.L.-W.; resources: M.H. and A.W.; data curation: A.L.-W.; writing: A.L.-W., M.H. and K.H.; visualization: A.L.-W. and K.H.; supervision: M.H. and A.W.; project administration: M.H.; funding acquisition: M.H. All authors have read and agreed to the published version of the manuscript.
Funding
This research was sponsored by the NC Strawberry Association and by ICL Fertilizers.
Data Availability Statement
The data presented in this study are available on request from the corresponding author. The data are not publicly available due to agreements with one of the research sponsors.
Acknowledgments
We would like to acknowledge the North Carolina Research Service, the North Carolina Cooperative Extension Service, and the Central Crops Research Station and Piedmont Research Station staff for their support in growing the strawberry crop and assisting with data collection. Additionally, the authors acknowledge Emma Volk, Rania Hassan, and Sarah Barbee for their support in harvesting strawberries and preparing soil samples. We also want to thank Michelle Schroeder-Moreno (NCSU, Raleigh) for reviewing the first draft of the thesis and being part of the MS committee.
Conflicts of Interest
The authors declare no conflicts of interest. The funders had no role in the design of the study, in the collection, analysis, or interpretation of data, in the writing of the manuscript, or in the decision to publish the results.
References
- Poling, B. Strawberry Plasticulture—A Grower’s Guide to Production, Economics and Marketing; North Carolina Strawberry Grower Association: Siler City, NC, USA, 2015. [Google Scholar]
- McWhirt, A.; Fernandez, G.; Shroeder-Moreno, M.; Hoffmann, M. Sustainable Practices for Plasticulture Strawberry Production in the Southeast; NC State Extension Publication: Raleigh, NC, USA, 2020. [Google Scholar]
- Locascio, S.; Martin, F. Nitrogen source and application timing for trickle irrigation strawberries. J. Am. Soc. Hortic. Sci. 1985, 110, 820–823. [Google Scholar] [CrossRef]
- Albregts, E.; Chandler, C. Slow release fertilizer rates for strawberry fruit production. Proc. Fla. State Hortic. Soc. 1993, 106, 187–189. [Google Scholar]
- Hicks, K.; Pettit, A.; McGinnis, M. Strawberry Fertility Management; North Carolina Department of Agriculture & Consumer Services: Raleigh, NC, USA, 2015.
- El Mountassir, O.; Bahir, M.; Ouazar, D.; Chehbouni, A.; Carreira, P. Temporal and spatial assessment of groundwater contamination with nitrate using nitrate pollution index, groundwater pollution index, and GIS. Environ. Sci. Pollut. Res. 2021, 29, 17132–17149. [Google Scholar] [CrossRef]
- Christian, R.; Thomas, C. Network analysis of nitrogen inputs and cycling in the Neuse River Estuary. ESCO 2003, 26, 815–828. [Google Scholar]
- Cameira, M.; Mota, M. Nitrogen related diffuse pollution from horticulture production—Mitigation practices and assessment strategies. Horticulturae 2017, 3, 25. [Google Scholar] [CrossRef]
- Voth, V.; Uriu, K.; Bringhurst, R. Effect of high nitrogen applications on yield, earliness, fruit quality, and leaf composition of California strawberries. J. Am. Soc. Hortic. Sci. 1967, 61, 249–256. [Google Scholar]
- Miner, G.; Poling, B.; Carroll, D.; Nelson, L.; Campbell, C. Influence of fall nitrogen and spring nitrogen-potassium applications on yield and fruit quality of ‘Chandler’ strawberry. HortScience 1997, 122, 290–295. [Google Scholar] [CrossRef]
- Yermiyahu, U.; Ziporia, I.; Faingolda, I.; Yusopova, L.; Fausta, N.; Bar-Tal, A. Polyhalite as a multi-nutrient fertilizer—potassium, magnesium, calcium, and sulfate. Isr. J. Plant Sci. 2017, 64, 145–157. [Google Scholar] [CrossRef]
- Barbarick, K. Polyhalite application to sorghum-Sudan grass and leaching in soil columns. Soil Sci. 1991, 151, 159–166. [Google Scholar] [CrossRef]
- Lillywhite, R.; Wiltshire, J.; Webb, J.; Menadue, H. The response of winter barley (Hordeum vulgare) and forage maize (Zea mays) crops to polyhalite, a multi-nutrient fertilizer. J. Agric. Sci. 2020, 158, 269–278. [Google Scholar] [CrossRef]
- Mello, S.; Tonhati, R.; Dourado-Neto, D.; Darapuneni, M.; Pavuluri, K. Response of tomato to polyhalite as a multi-nutrient fertilizer in southeast Brazil. J. Plant Nutr. 2018, 41, 2126–2140. [Google Scholar] [CrossRef]
- Maynard, D.; Kalra, Y.; Crumbaugh, J. Nitrate and exchangeable ammonium nitrogen, soil sampling methods of analysis. In Soil Sampling and Methods of Analysis, 2nd ed.; Carter, M., Gregorich, E., Eds.; CRC Press: Boca Raton, FL, USA, 2008; pp. 71–80. [Google Scholar]
- USDA-AMS. United States Standards for Grades of Strawberry. 2006. Available online: https://www.ams.usda.gov/sites/default/files/media/Strawberry_Standard%5B1%5D.pdf (accessed on 4 March 2024).
- Albregts, E.; Howard, C. Response of strawberries to soil and foliar fertilizer rates. HortScience 1986, 21, 1140–1142. [Google Scholar] [CrossRef]
- Bottoms, T.; Hartz, T.; Cahn, M.; Farrara, B. Crop and soil nitrogen dynamics in annual strawberry production in California. HortScience 2013, 48, 1034–1039. [Google Scholar] [CrossRef]
- McWhirt, A.; Shroeder-Moreno, M.; Fernandez, G.; Cardoza, Y.; Burrack, H. On Farm Evaluation of Sustainable Soil Management Practices for North Carolina Strawberry Production; University of Arkansas Extension: Little Rock, AR, USA, 2015. [Google Scholar]
- Ricklefs, R.; Reylea, R. Ecology the Economy of Nature, 7th ed.; W.H. Freeman: New York, NY, USA, 2014. [Google Scholar]
- Taiz, L.; Zeiger, E. Plant Physiology, 3rd ed.; Sinauer Associates: Sunderland, MA, USA, 2006. [Google Scholar]
- Wold, A.; Opstad, N. Fruit quality in strawberry (Fragaria × annanassa Duch. Cv. Korona) at three times during the season and with two fertilizer strategies. J. Appl. Bot. Food Qual. 2007, 81, 36–40. [Google Scholar]
- Bottoms, T.; Bolda, M.; Gaskell, M.; Hartz, T. Determination of strawberry nutrient optimum ranges through diagnosis and recommendation integrated system analysis. HortTechnology 2013, 23, 312–318. [Google Scholar] [CrossRef]
- Galletta, G.; Bringhurst, R. Small Fruit Crop Management: Strawberry Management; Prentice Hall: Englewood Cliffs, NJ, USA, 1990. [Google Scholar]
- Albregts, E.; Clark, G.; Stanley, C.; Zazueta, F.; Smajstrla, A. Preplant fertilization of fruiting microirrigated strawberry. HortScience 1991, 26, 1176–1177. [Google Scholar] [CrossRef]
- Santos, B.M. Effects of Preplant Nitrogen and Sulfur Fertilizer Sources on Strawberry. HortTechnology 2010, 20, 193–196. [Google Scholar] [CrossRef]
- Agehara, S.; Santos, B.M.; Whidden, A.J. Nitrogen Fertilization of Strawberry Cultivars: Is Preplant Started Fertilizer Needed? UF IFAS Extension, 2017, HS1116. Available online: https://growables.com/information/TropicalFruit/documents/StrawberryNitrogenFertEDIS.pdf (accessed on 4 March 2024).
- Webb, R.A.; White, B.A. The effect of rooting date on flower production in the strawberry. J. Hortic. Sci. 1971, 46, 413–423. [Google Scholar] [CrossRef]
- Opstad, N.; Nes, A.; Mage, F. Preplant Fertilization and Fertigation in Strawberry (Fragaria × ananassa Duch. cv. ‘Korona’) in an Open Field Experiment. Eur. J. Hortic. Sci. 2007, 72, 206–213. [Google Scholar]

Disclaimer/Publisher’s Note: The statements, opinions and data contained in all publications are solely those of the individual author(s) and contributor(s) and not of MDPI and/or the editor(s). MDPI and/or the editor(s) disclaim responsibility for any injury to people or property resulting from any ideas, methods, instructions or products referred to in the content. |
© 2024 by the authors. Licensee MDPI, Basel, Switzerland. This article is an open access article distributed under the terms and conditions of the Creative Commons Attribution (CC BY) license (https://creativecommons.org/licenses/by/4.0/).