1. Introduction
Xinjiang is recognized as one of the most important cotton-producing areas in China and serves as a significant global cotton production base. Among the various cash crops cultivated in Xinjiang, cotton holds a particularly prominent position due to its economic significance. The development of the cotton industry in Xinjiang has played a vital role in fostering local economic growth, boosting farmers’ income, and generating employment opportunities [
1].
Cotton (scientific name: Gossypium hirsutum) is an important cash crop belonging to the genus Cotton in the family Mallowaceae [
2]. The fruit of cotton is known as a boll and contains cotton seeds, which can be processed to extract cotton fiber, one of the main raw materials for manufacturing textiles. Cotton growth is adaptable to a wide range of climatic and soil requirements, but tropical and subtropical climates are preferred. The typical growing period is 4 to 6 months, requiring sufficient sunlight and water during growth [
3]. It is a perennial herbaceous plant but is generally cultivated as an annual plant. Cotton, as one of the major fiber crops in the world, is versatile and important [
4].
In agricultural production, soil moisture is a critical factor that directly influences crop growth and yield [
5]. Throughout the growing season, cotton is a water-consuming crop and necessitates large amounts of water to support normal growth and development [
6]. Maintaining adequate soil moisture is crucial, as it facilitates seed germination, seedling growth, vegetative development, and the establishment of a healthy root system, ultimately enhancing both the yield and quality of the cotton. Optimal soil moisture levels play a vital role in regulating the physiological processes of plants. An imbalance in soil moisture—whether due to deficiency or excess—can disrupt these physiological processes, leading to adverse effects on the growth and yield of cotton [
7]. Therefore, the precise monitoring and management of soil moisture content during the growth stages of cotton are paramount for achieving high-yield, quality, and consistent cotton production. The strategic utilization of soil moisture resources can effectively regulate the growth environment of cotton, leading to improved yield and quality and subsequently maximizing economic returns [
8].
Various remote sensing techniques, including satellite remote sensing, have been extensively employed for soil moisture monitoring and estimation in recent decades. Satellite remote sensing has garnered significant interest for its ability to provide wide coverage, frequent periodic observations, and non-contact acquisition of information. Despite these advantages, accurately obtaining soil moisture information remains a challenge [
9,
10]. The importance of using satellite images to map soil moisture lies in providing comprehensive and timely soil moisture monitoring data for cotton growers, enhancing their decision-making processes, and optimizing cultivation management [
11]. Soil moisture also has a direct impact on the occurrence of some diseases and pests. Monitoring soil moisture allows for the timely detection of overly wet or dry soil conditions, enabling appropriate measures to adjust soil moisture levels promptly, thus reducing the incidence of diseases and pests, as well as ensuring the healthy growth of cotton [
12]. Soil moisture mapping can also help growers better understand the distribution of nutrients in the soil. Based on soil moisture information, growers can adjust their fertilization plan to ensure that cotton receives a sufficient nutrient supply during growth, thereby enhancing yield and quality [
13]. In conclusion, soil moisture mapping plays a crucial role in cotton cultivation. It not only assists growers in optimizing water management, irrigation, fertilization, and other agricultural activities to increase cotton yield and quality but also mitigates the occurrence of diseases and pests, reduces disaster risks, and promotes the sustainable development of the cotton industry.
In recent years, research on the inversion of soil moisture and other related indicators based on machine learning algorithms has drawn significant attention [
14,
15]. Remote sensing methods provide high-resolution spectral data, offering a wealth of information for the inversion of soil moisture content [
16,
17]. Kingsley John et al. successfully estimated the variability in soil organic carbon in alluvial soils using machine learning algorithms in conjunction with environmental variables and soil nutrient indicators, achieving an optimal
R2 value of 0.68 [
18]. Felipe B. de Santana et al. conducted a study comparing the effectiveness of partial least squares (PLSs) and support vector machine (SVM) models in predicting soil organic matter and particle size using a visible–near-infrared spectral library, resulting in a remarkable 22% reduction in the RMSEP value [
19]. Xiaoping Wang et al. employed a fractional-order filtering algorithm and grid-searching support vector machine modeling to extract soil salinity information, achieving an accuracy rate of 91.9% [
20]. Coleen Carranza et al. utilized random forest to estimate soil moisture in the root zone and found that random forest outperformed process-based models [
21]. Yue Zhang et al. employed a random forest model with different predictors to compare the mapping of total soil nitrogen storage from remote sensing data, concluding that the random forest method accurately captures alterations in soil total nitrogen content [
22]. Moreover, Mohammad Hosseinpour-Zarnaq et al. employed vis–NIR spectral data along with a convolutional neural network (CNN) model to predict soil properties, demonstrating the feasibility of using near-infrared spectral data as a swift and non-invasive tool for assessing soil properties [
23]. Lei Zhang et al. developed a CNN–long short-term memory (CNN-LSTM) model to predict soil organic carbon content based on a long-term series of climatic variables from MODIS, and their research indicated that remote sensing methods utilizing random forest accurately capture changes in soil total nitrogen content, showcasing the promising potential of hybrid deep learning models [
24]. Despite the recent increase in related research, a comprehensive method regarding the relevant algorithms has yet to be summarized, and issues such as spectral correlation features continue to be subject to ongoing investigation.
This study aims to establish an accurate and reliable model for the real-time monitoring and estimation of soil moisture content during the cotton growth period by utilizing the GBR-RF algorithm in combination with Sentinel-2 satellite spectral data. The feasibility and advantages of this approach are explored through an analysis of spectral data from different bands and their integration with ground-based measurements of soil moisture content. The results of this study are expected to offer valuable reference information for agricultural production management. This information will aid in optimizing agricultural production decisions, enhancing crop yield and quality, and promoting the sustainable use and protection of land resources.
This paper begins by providing an overview of the importance of soil moisture content inversion. Following this, the characteristics and acquisition of the GBR-RF algorithm and Sentinel-2 satellite spectral data are briefly discussed. Subsequently, the research methodology and experimental design employed in this study are described. Finally, the anticipated outcomes of this study and its potential applications in agricultural production are considered.
2. Materials and Methods
2.1. Overview and Data Collection in the Experimental Zone
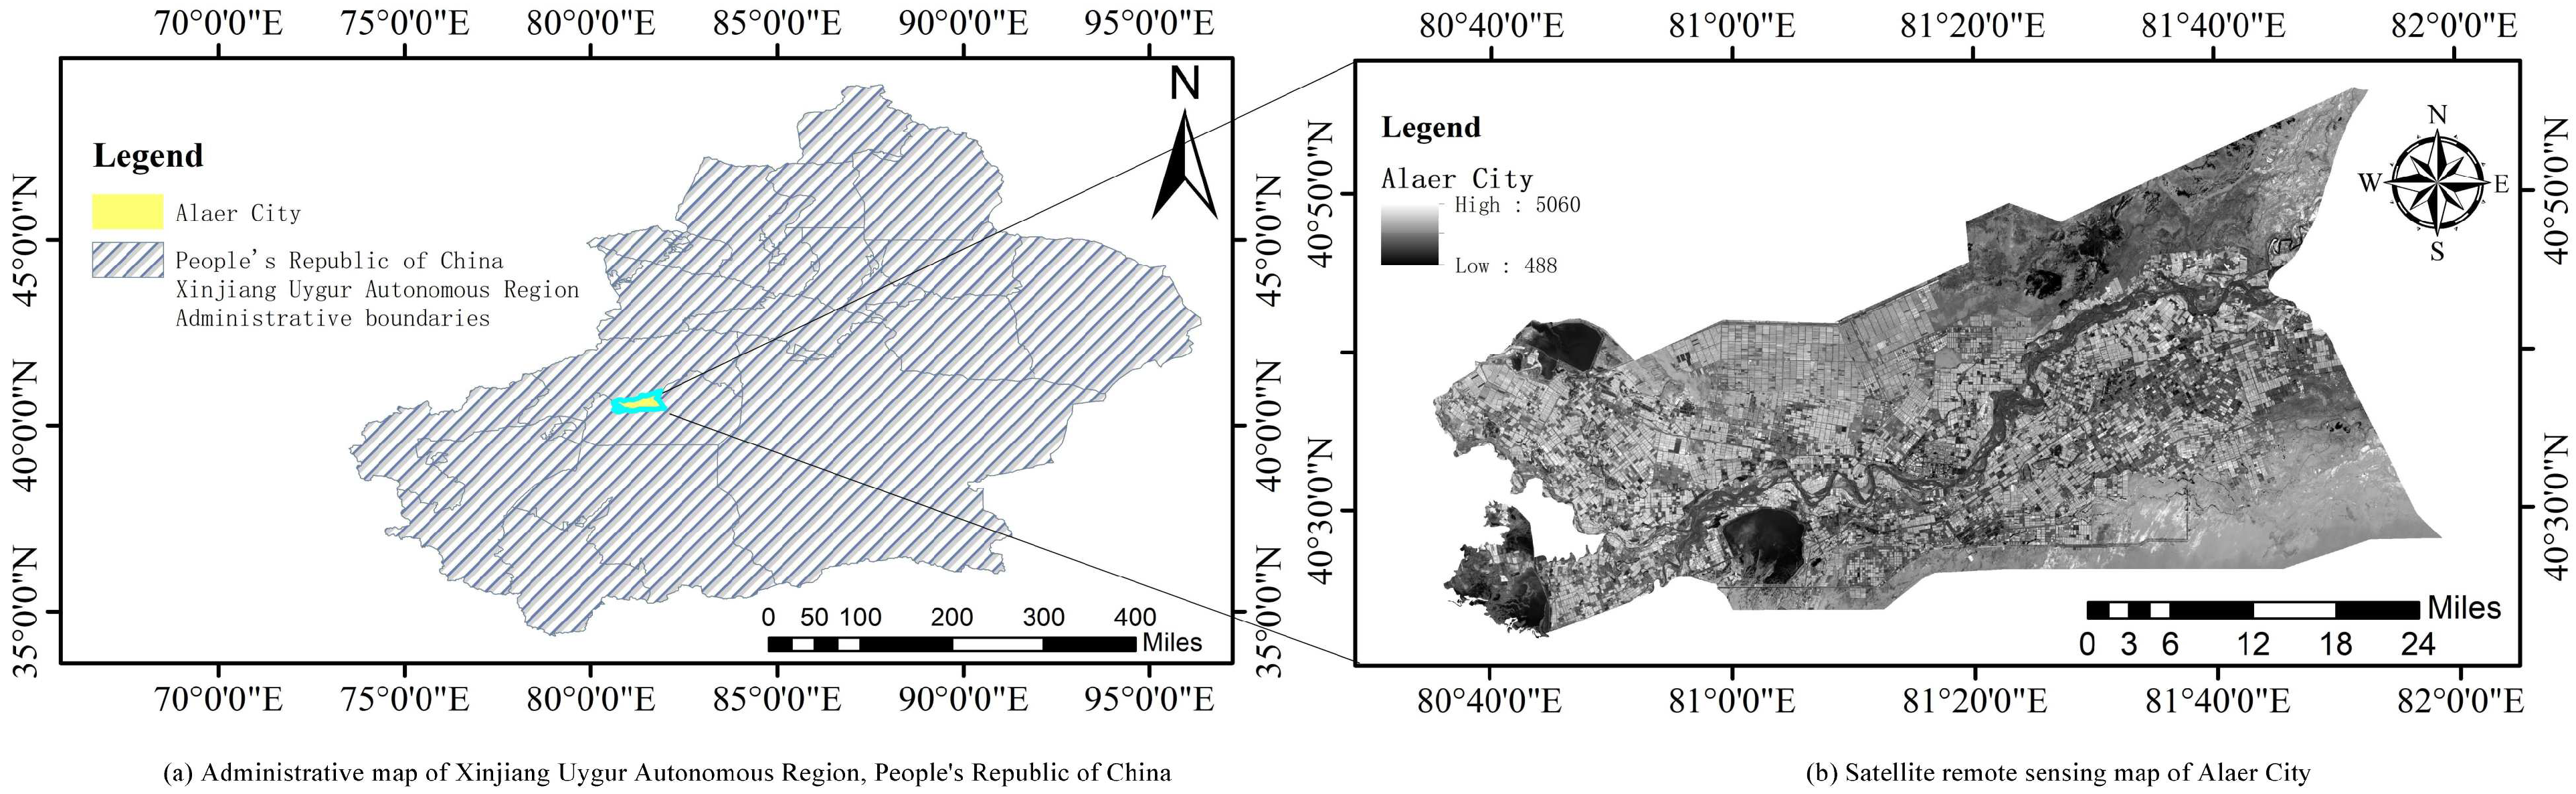
Located in Alar City, Xinjiang Uygur Autonomous Region (XUAR), the research pilot area is subject to the joint administration of the XUAR and the Xinjiang Production and Construction Corps (XPC), and it follows a division–municipality management system. Encompassing an expanse of 6923.4 square kilometers, it experiences a temperate, extreme continental, and arid desert climate. Geographically positioned in the southern foothills of the Tianshan Mountains, at the northern boundary of the Taklamakan Desert and the upper reaches of the Tarim River, where it converges with the Aksu River, Hotan River, and Yarkant River, the region is located between longitudes 80°30′ and 81°58′ and latitudes 40°22′ and 40°57′. The terrain is characterized by the alluvial fine-soil plains of the Tarim River, featuring a gentle uplift along the riverbanks and the sides of the alluvial gullies, with a topography sloping from northwest to southeast. Notably, the area experiences an extreme minimum temperature of −33.2 °C, with an average annual solar radiation range of 133.7–146.3 kcal/cm2. Furthermore, the average annual sunshine duration varies from 2556.3 to 2991.8 h, while precipitation is scarce, with minimal winter snowfall. The region faces intense surface evaporation, with an average annual precipitation rate ranging from 40.1 to 82.5 mm and an average annual evaporation rate between 1876.6 and 2558.9 mm.
The conducted experiment involved collecting soil samples from cotton fields and determining their water content in addition to analyzing the relevant spectral data from the Sentinel-2 satellite for inversion. Satellite remote sensing image data were acquired from the Google Earth Engine (GEE) platform, with the satellite of choice being Sentinel-2 at Level-2A, captured between 1 April and 10 April, and, due to the correlation between soil data and bands, B1–B8 band data were also acquired. European Space Agency satellite data were used in combination with ENVI for data processing; a comparative analysis on the GEE platform indicated its relative effectiveness, leading to its selection for the study. To enhance the data quality, cloud removal, atmospheric correction, and radiometric calibration were performed within the platform before proceeding with the subsequent research using remote sensing images. Soil samples were collected from cotton fields in the vicinity of Aral City cultivated by local farmers. The data used in this experiment were collected on 7 April 2023, using soil augers to collect soil samples at depths ranging from 0 cm to 30 cm. The study focused on the 20-cm to 30-cm soil data for experimentation, with a total of 180 soil samples collected. The soil samples were sealed in plastic bags for storage, and their wet weights were measured using a digital balance accurate to the nearest one hundredth of a gram. Subsequently, the samples were dried in an oven to obtain their dry weights, and the moisture content was calculated using the appropriate formula. The equation for soil water content is shown in Equation (1).
θ denotes soil moisture content (%),
mw denotes the mass of wet soil (g), and
md denotes the mass of dry soil (g). The study area map is depicted in
Figure 1.
Google Earth Engine (GEE) is a cloud platform developed by Google for geoscience data analysis and processing. It provides a large number of geoscience datasets, powerful computational resources, and easy-to-use programming interfaces that enable users to perform large-scale geoscience data analysis and processing in the cloud [
25].
2.2. Data Processing
In this experiment, the band data of the satellite remote sensing images were acquired and output using ENVI. It is important to highlight that the remote sensing images were acquired at a 10-m resolution. In this experiment, ground samples were collected at 10-m intervals, aligning each sample point with a pixel of the same resolution. Although the data acquisition interval selected for this study matches the resolution, it is essential to recognize that there may exist a certain level of error, as the data may not precisely correspond to each individual pixel point within the image. Nonetheless, the data collection points in this study are situated in the experimental field in close proximity to its center, with distances exceeding 20 m between the data collection points and the field’s edges. Consequently, the experimental data obtained were deemed valid within the scope of this study. Furthermore, the crops grown in the sampled locations in this study were all one-year-old cotton plants in the seedling stage. Since they were cultivated in open fields within the same county-level city, the growth conditions across the research areas were essentially the same.
Due to the data utilized in this experiment being directly extracted band data, the output is a single value rather than a continuous whole group of data. Consequently, the attempted preprocessing of the data using techniques such as first-order derivatives and inverses yielded manifestly unreasonable results. Consequently, the outcomes of the attempted inversions were notably poor. Therefore, the operations intended to manipulate the data were not pursued further in this study.
The data were cleaned both manually and using machine learning algorithms, following data cleaning instructions. No detectable anomalies were found, so further explanation of these operations is omitted.
2.3. Pearson Correlation Analysis
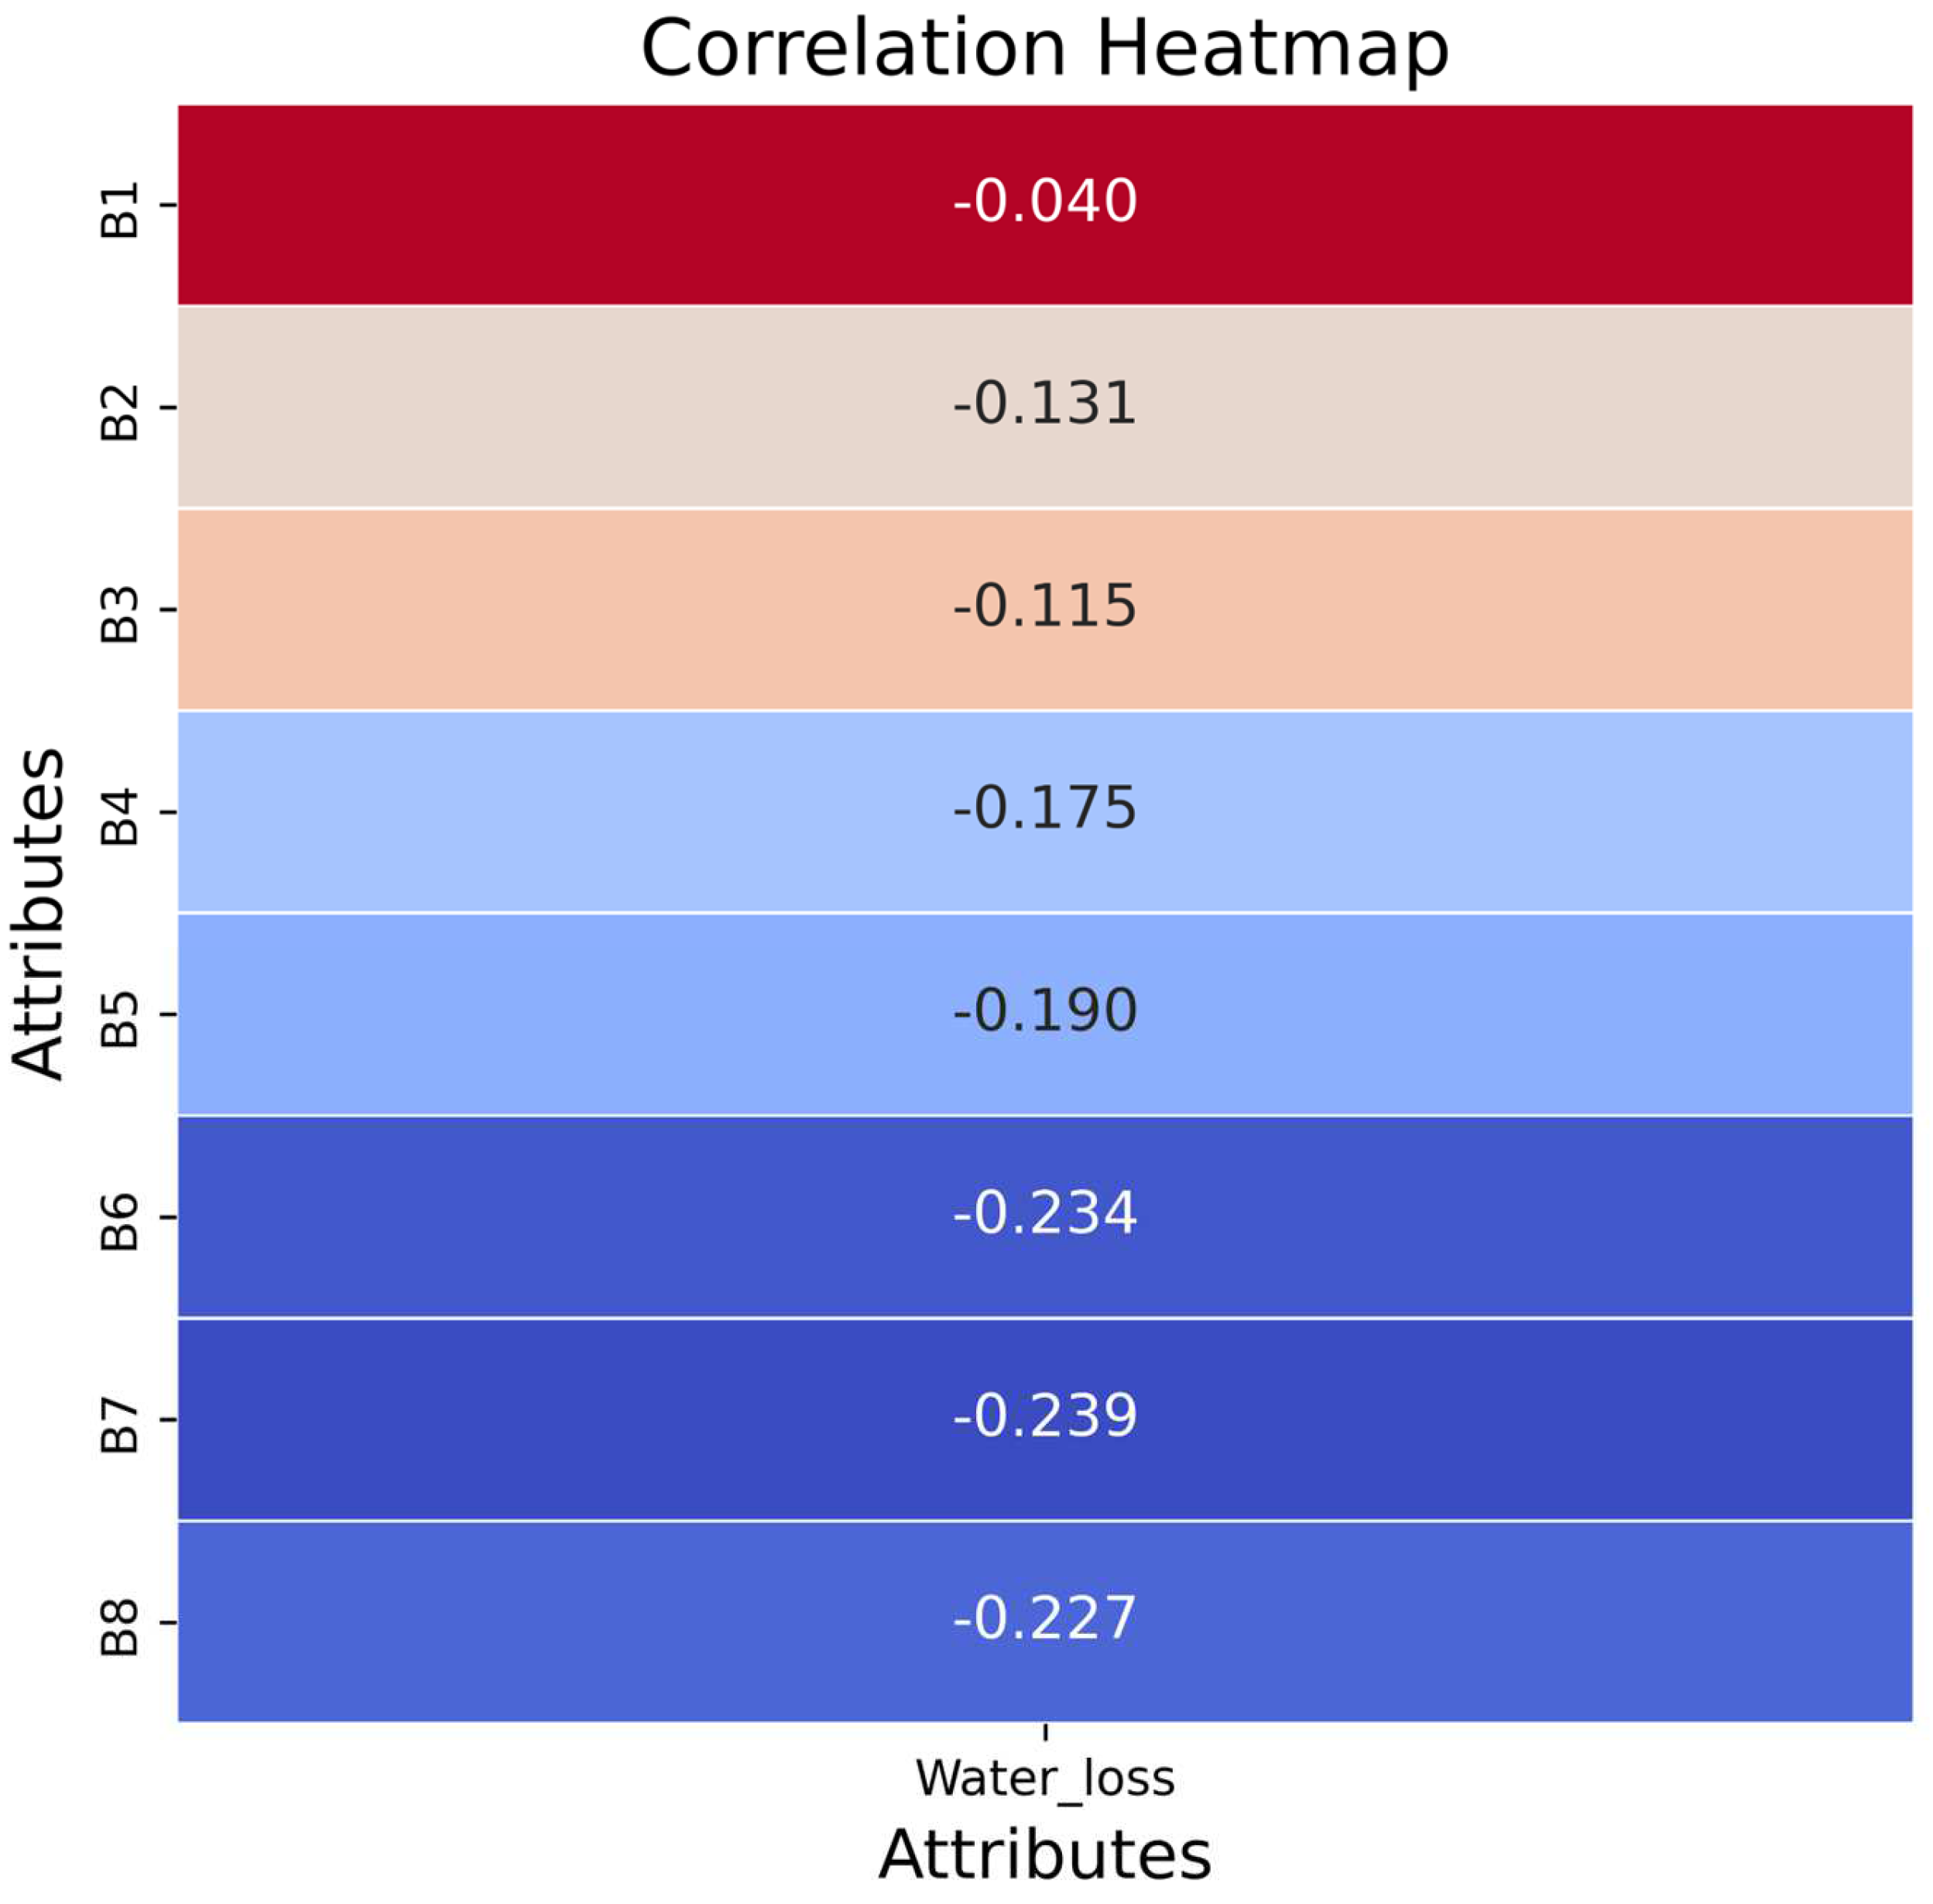
A Pearson correlation analysis is a statistical method utilized to evaluate the linear correlation between two continuous variables. It calculates the Pearson correlation coefficient to determine the strength and direction of the correlation between the two variables. The coefficient ranges from −1 to 1, with values closer to these extremes indicating a stronger correlation, while those closer to 0 indicate a weaker correlation. In this experiment, manipulation was carried out to understand the correlations between the variables in order to aid in modeling and determine which variables were important for explaining the changes in the target variable. The main objective was to identify the key factors affecting the results, given the large number of overall independent variables. During the correlation analysis in this study, the multispectral data were used as the independent variable data and the soil moisture content as the dependent variable data.
2.4. Gradient-Boosting Regression (GBR)
The gradient boosting machine method, initially proposed by Jerome Friedman, led to the development of gradient-boosting regression [
26]. Building upon this method, Trevor Hastie, Robert Tibshirani, and Jerome Friedman introduced the gradient boosting tree method, which integrates gradient boosting with a decision tree model to enhance prediction accuracy. Gradient-boosting regression involves iteratively training a series of weak prediction models, each of which aims to correct the residuals of the preceding model. With each iteration, the model fits the residuals, compares predicted values against observed data, and determines the next optimization direction. Through this progressive process, the model gradually refines the prediction accuracy of the target variable.
For this experiment, we chose the gradient-boosting regression algorithm due to its several advantages. This algorithm is known for its high prediction accuracy, insensitivity to outliers, and flexibility. Importantly, the issues related to long training times and cumbersome parameter tuning are successfully addressed by constraining specific parameters, resulting in improved efficiency without compromising prediction accuracy.
2.5. Random Forest (RF)
The history of the random forest algorithm can be traced back to the original idea proposed by Leo Breiman. Random forest (RF) is an integrated learning method based on decision tree construction, and it was further developed and shaped by Breiman et al. in their influential 2004 paper “Random Forests” [
27]. Random forests enhance prediction accuracy and stability by training multiple decision trees and then integrating their outputs.
In this study, the random forest algorithm is utilized due to its high accuracy and robustness resulting from its good predictive performance, efficient data processing capabilities, and unique ability to evaluate the importance of features. Random forest is particularly advantageous because it can effectively handle missing values without requiring data normalization. This underscores the algorithm’s versatility and reliability in analyzing complex datasets.
2.6. GBR-RF
In this experiment, an integrated learning approach combining the GBR and RF algorithms is used to address their individual limitations and leverage their strengths effectively.
Both RF and GBR are high-performance algorithms that excel in handling various data types and complex feature relationships. These models can effectively tackle both numerical and categorical data while remaining insensitive to feature scaling, making them ideal for heterogeneous datasets. By combining these two models, their individual strengths can be leveraged to enhance the model’s generalization ability, thereby improving its robustness in predicting new data. The randomness inherent in RF, coupled with the integrated learning concept, helps mitigate the risk of overfitting, while gradient-boosted regression’s stepwise fitting of residuals aids in controlling the model’s complexity to prevent overfitting on training data. Furthermore, the combined use of these algorithms offers a more comprehensive assessment of feature importance, allowing for a deeper understanding of the impact of individual features on prediction results. In essence, the synergy between RF and GBR not only enhances predictive performance but also provides valuable insights into the prediction process, making it a powerful tool for data analysis and modeling.
In this study, data were first read and processed using the pandas library. Next, the random forest algorithm was employed to evaluate and select important features to identify the most representative ones. Subsequently, a ridge regression algorithm was utilized to build a regression model, which was then trained and predicted based on the selected features. The algorithms were implemented using the scikit-learn library. Finally, model performance was assessed by computing metrics such as mean squared error, and visualizations were generated using the matplotlib library to intuitively depict the relationship between model predictions and actual labels, aiding in the analysis of the accuracy and applicability of the model.
In summary, the integrated approach of combining the GBR and RF algorithms offers several advantages that are crucial in addressing the research problem at hand. These advantages include a stronger generalization ability, better handling of heterogeneous data, a reduced risk of overfitting, high performance, and flexibility, along with the ability to conduct a feature importance analysis. This integrated approach has been demonstrated to yield significant success in practical applications, making it a suitable and effective solution for the research problem under examination.
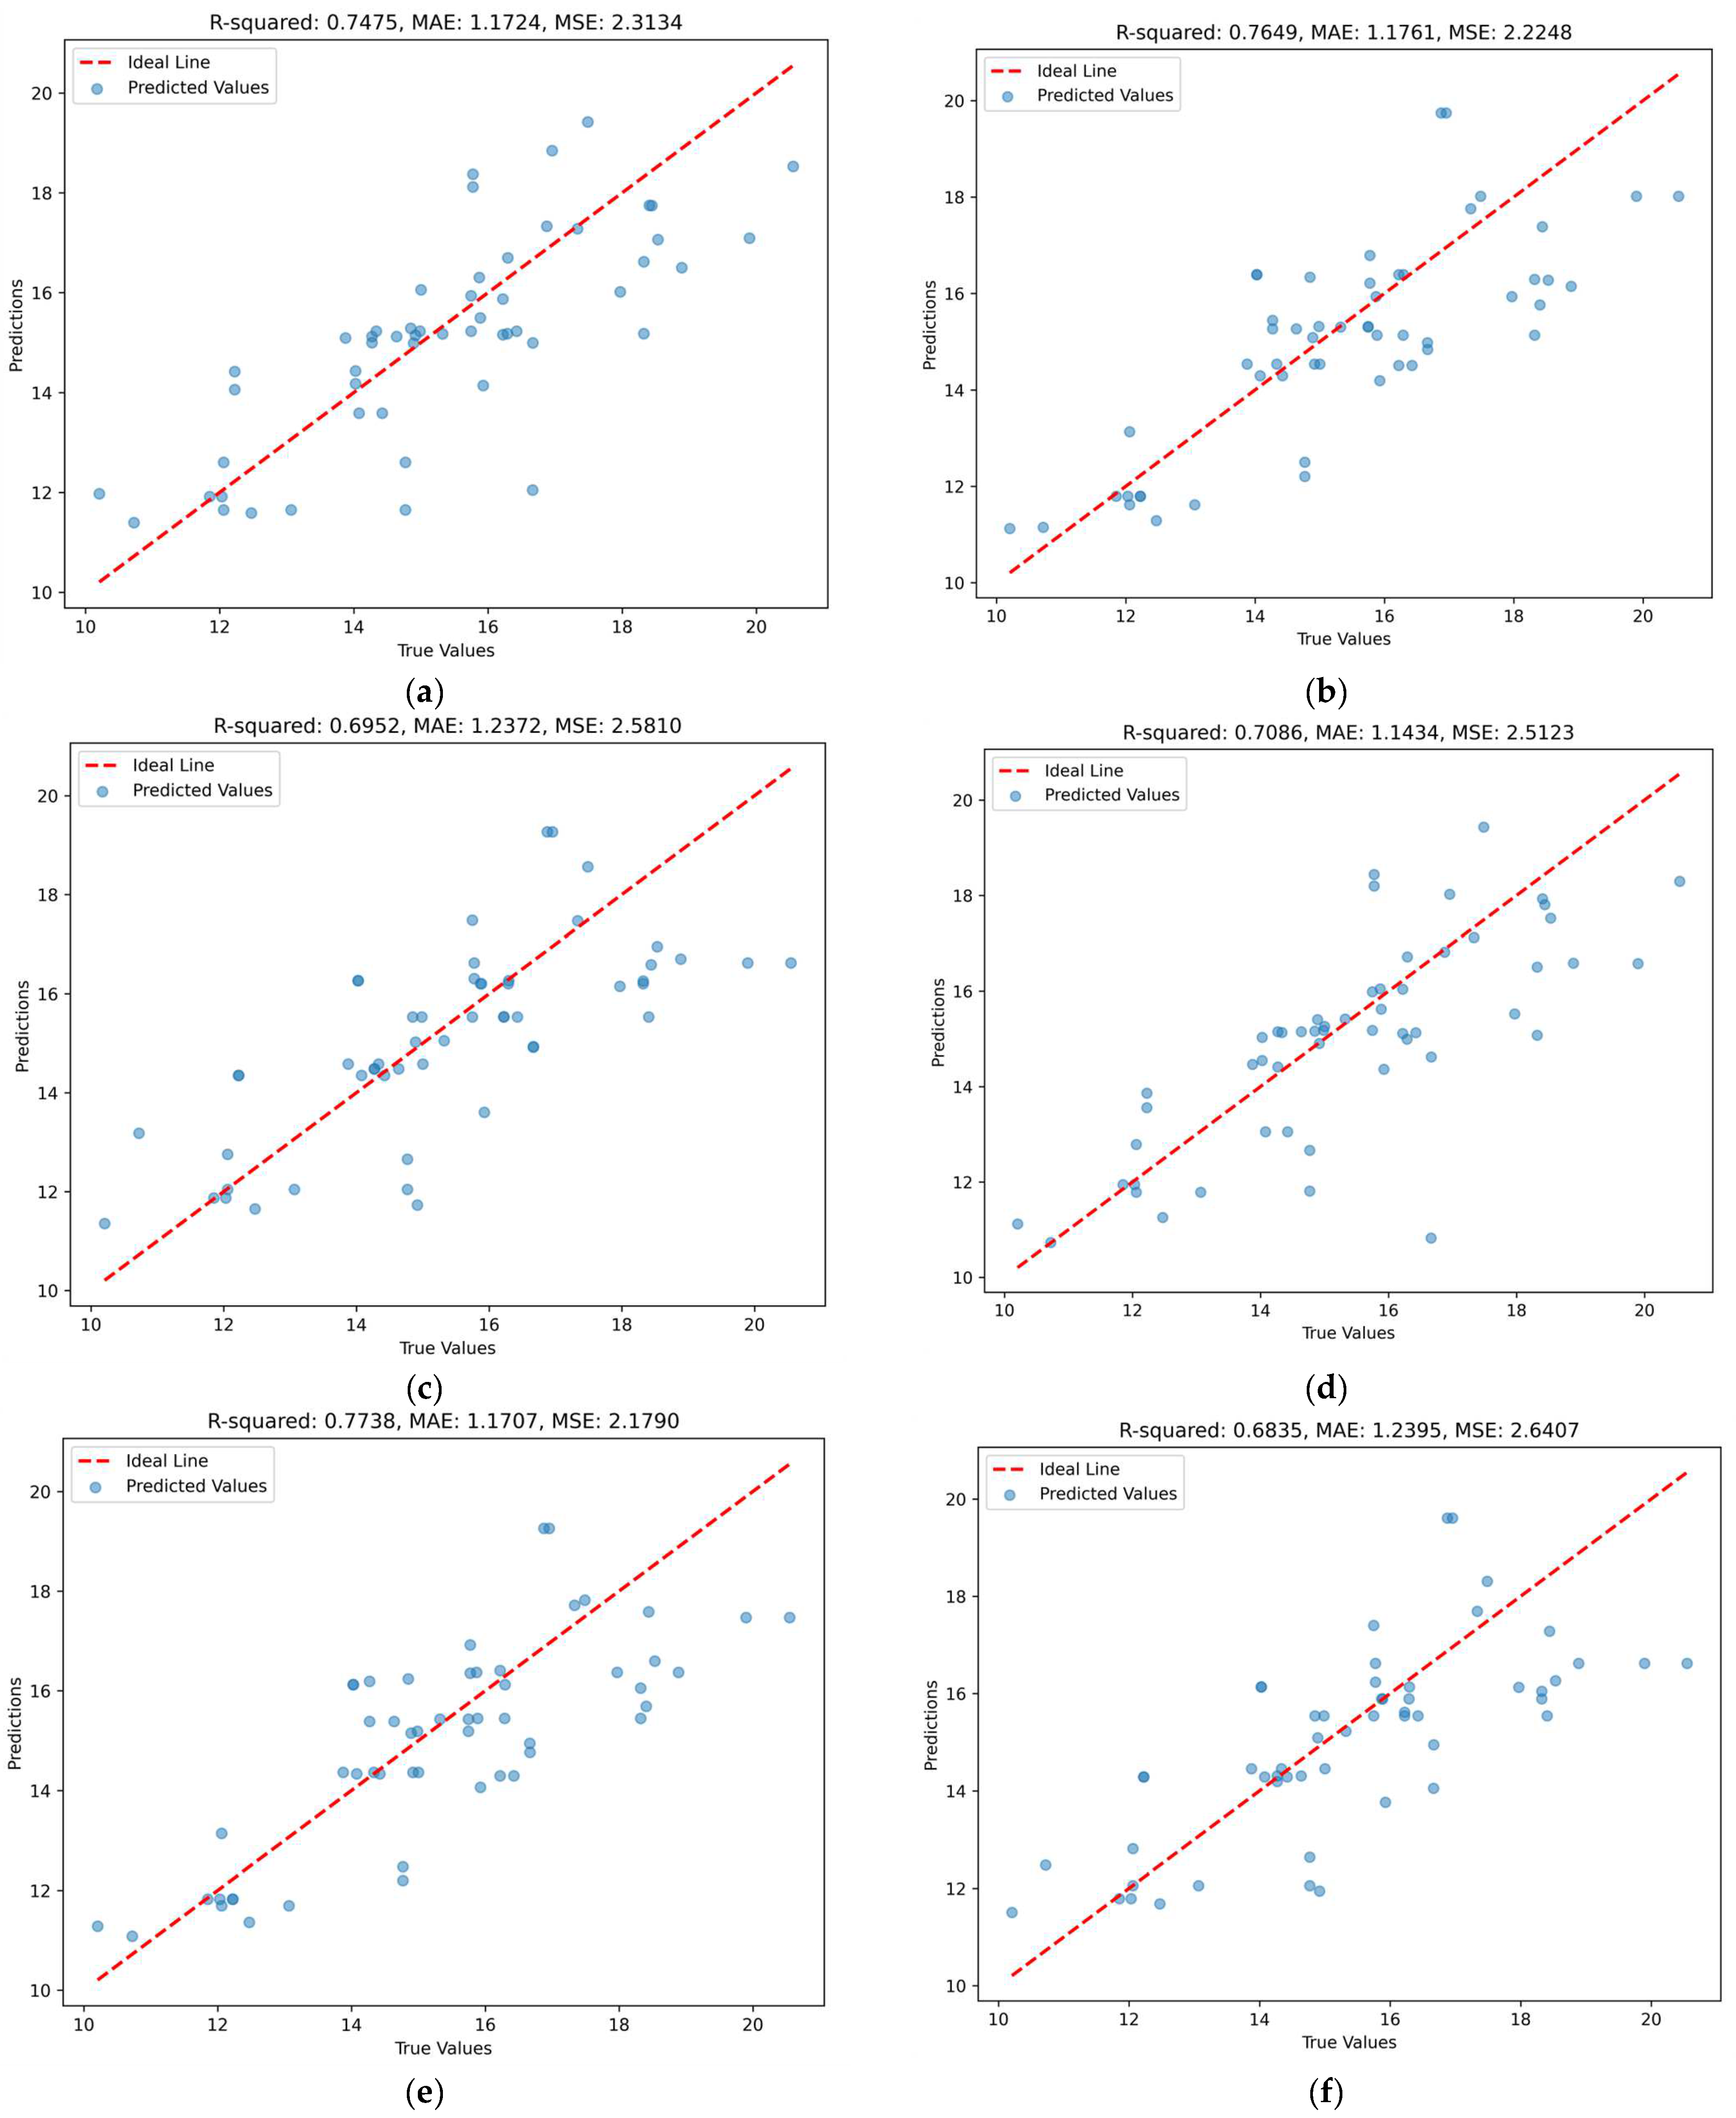
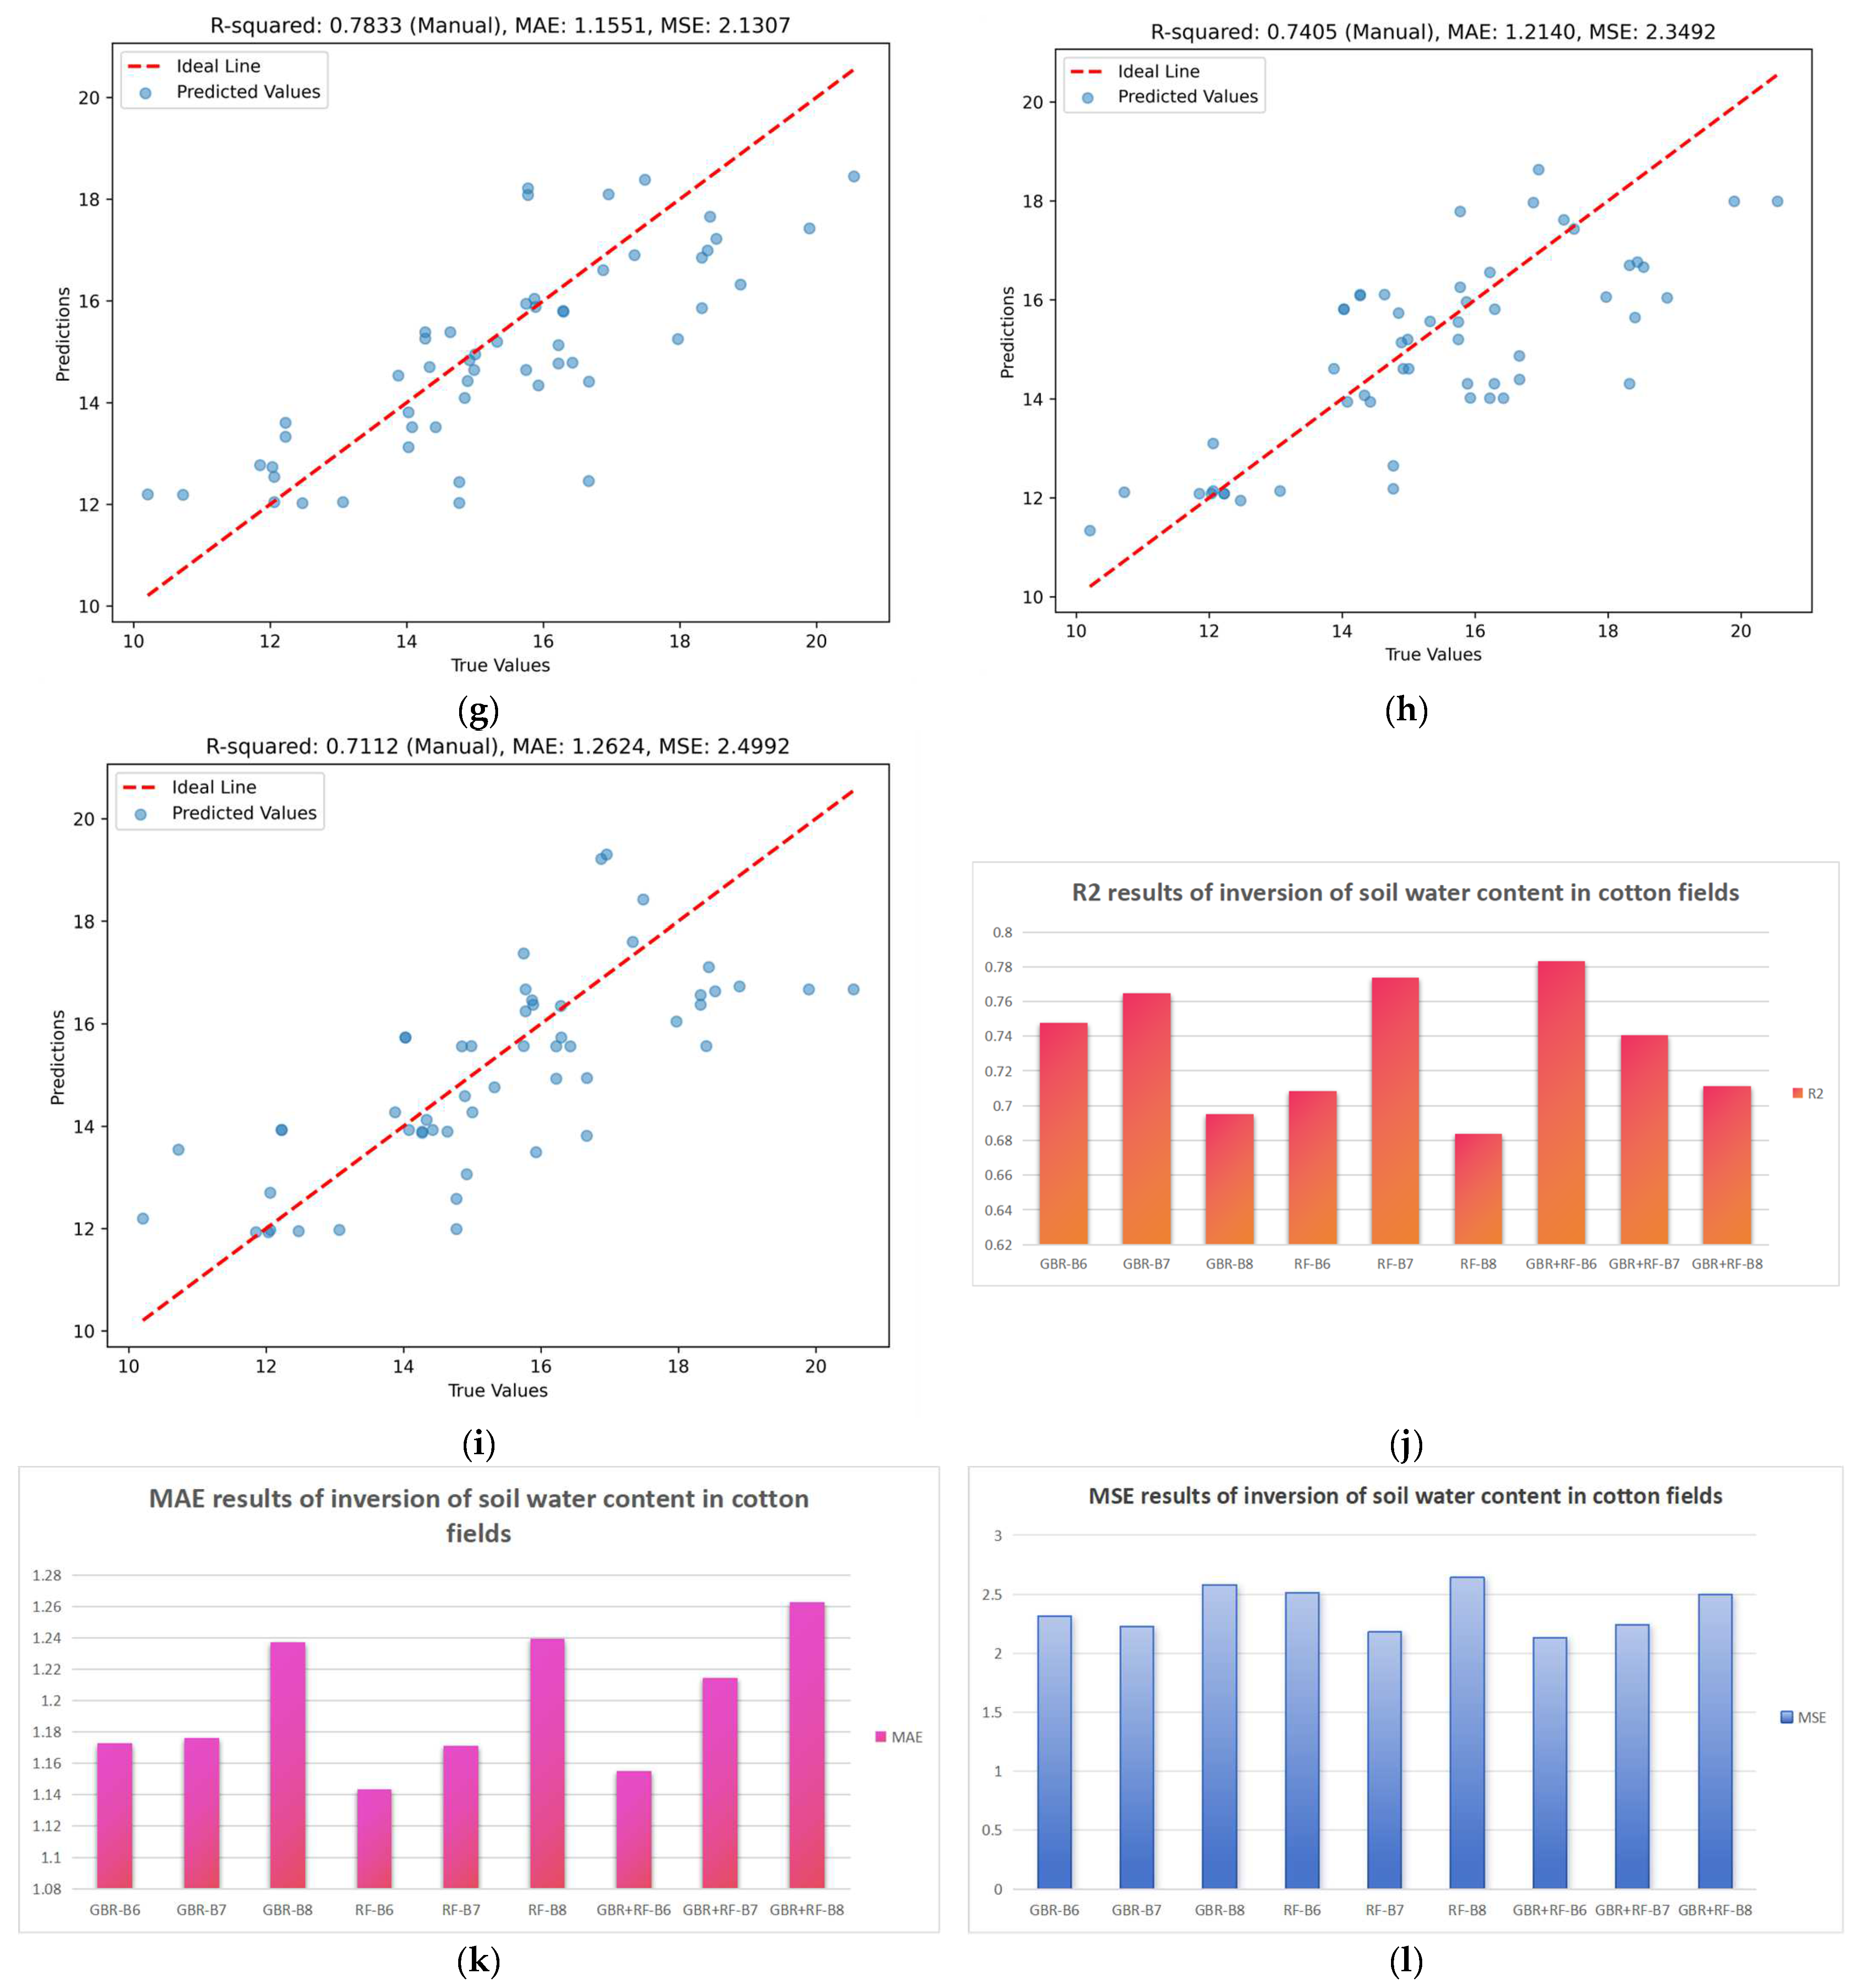
2.7. Assessment of Indicators
In this experiment, we use R squared (
R2) [
28], mean absolute error (MAE), and mean squared error (MSE) [
29] as evaluation metrics to compare the data inversion results across different algorithms and wavelength bands.
R2 is a common metric used to assess the goodness of fit of a regression model. It indicates the proportion of the variance in the dependent variable (target variable) that can be explained by the independent variable (characteristic variable). The specific formula for R2 is shown in Equation (2). The value of R2 ranges from 0 to 1, with values closer to 1 indicating that the model fits the data better and values closer to 0 indicating that the model fits the data worse. Here, SSresidual denotes the sum of squares of the model residuals, and SStotal denotes the total sum of squares of the dependent variable.
MAE serves as a crucial metric for evaluating the prediction error of a regression model by calculating the average absolute deviation between the model’s predicted value and the actual value. A smaller MAE value suggests a lower prediction error, making it a reliable measure of the model’s predictive accuracy. Unlike MSE, MAE is less sensitive to outliers due to its utilization of absolute values, rendering it more appropriate for assessing models with outlier-ridden datasets. The specific formula for MAE, as represented in Equation (3), involves the true value, yi, for the ith sample and the model’s predicted value, , for that same sample, with “n” denoting the total number of samples.
MSE serves as a prevalent metric for evaluating the prediction error of a regression model by calculating the average squared deviation between the predicted values generated by the model and the actual true values. This metric plays a crucial role in quantifying the accuracy of the model’s predictions, with a lower MSE value corresponding to a lower error in the predictive outcomes. Unlike mean absolute error (MAE), MSE exhibits greater sensitivity towards large errors as it computes the average of squared errors. The specific mathematical expression representing MSE is denoted by Equation (4), with its interpretation aligning with that of Equation (3).
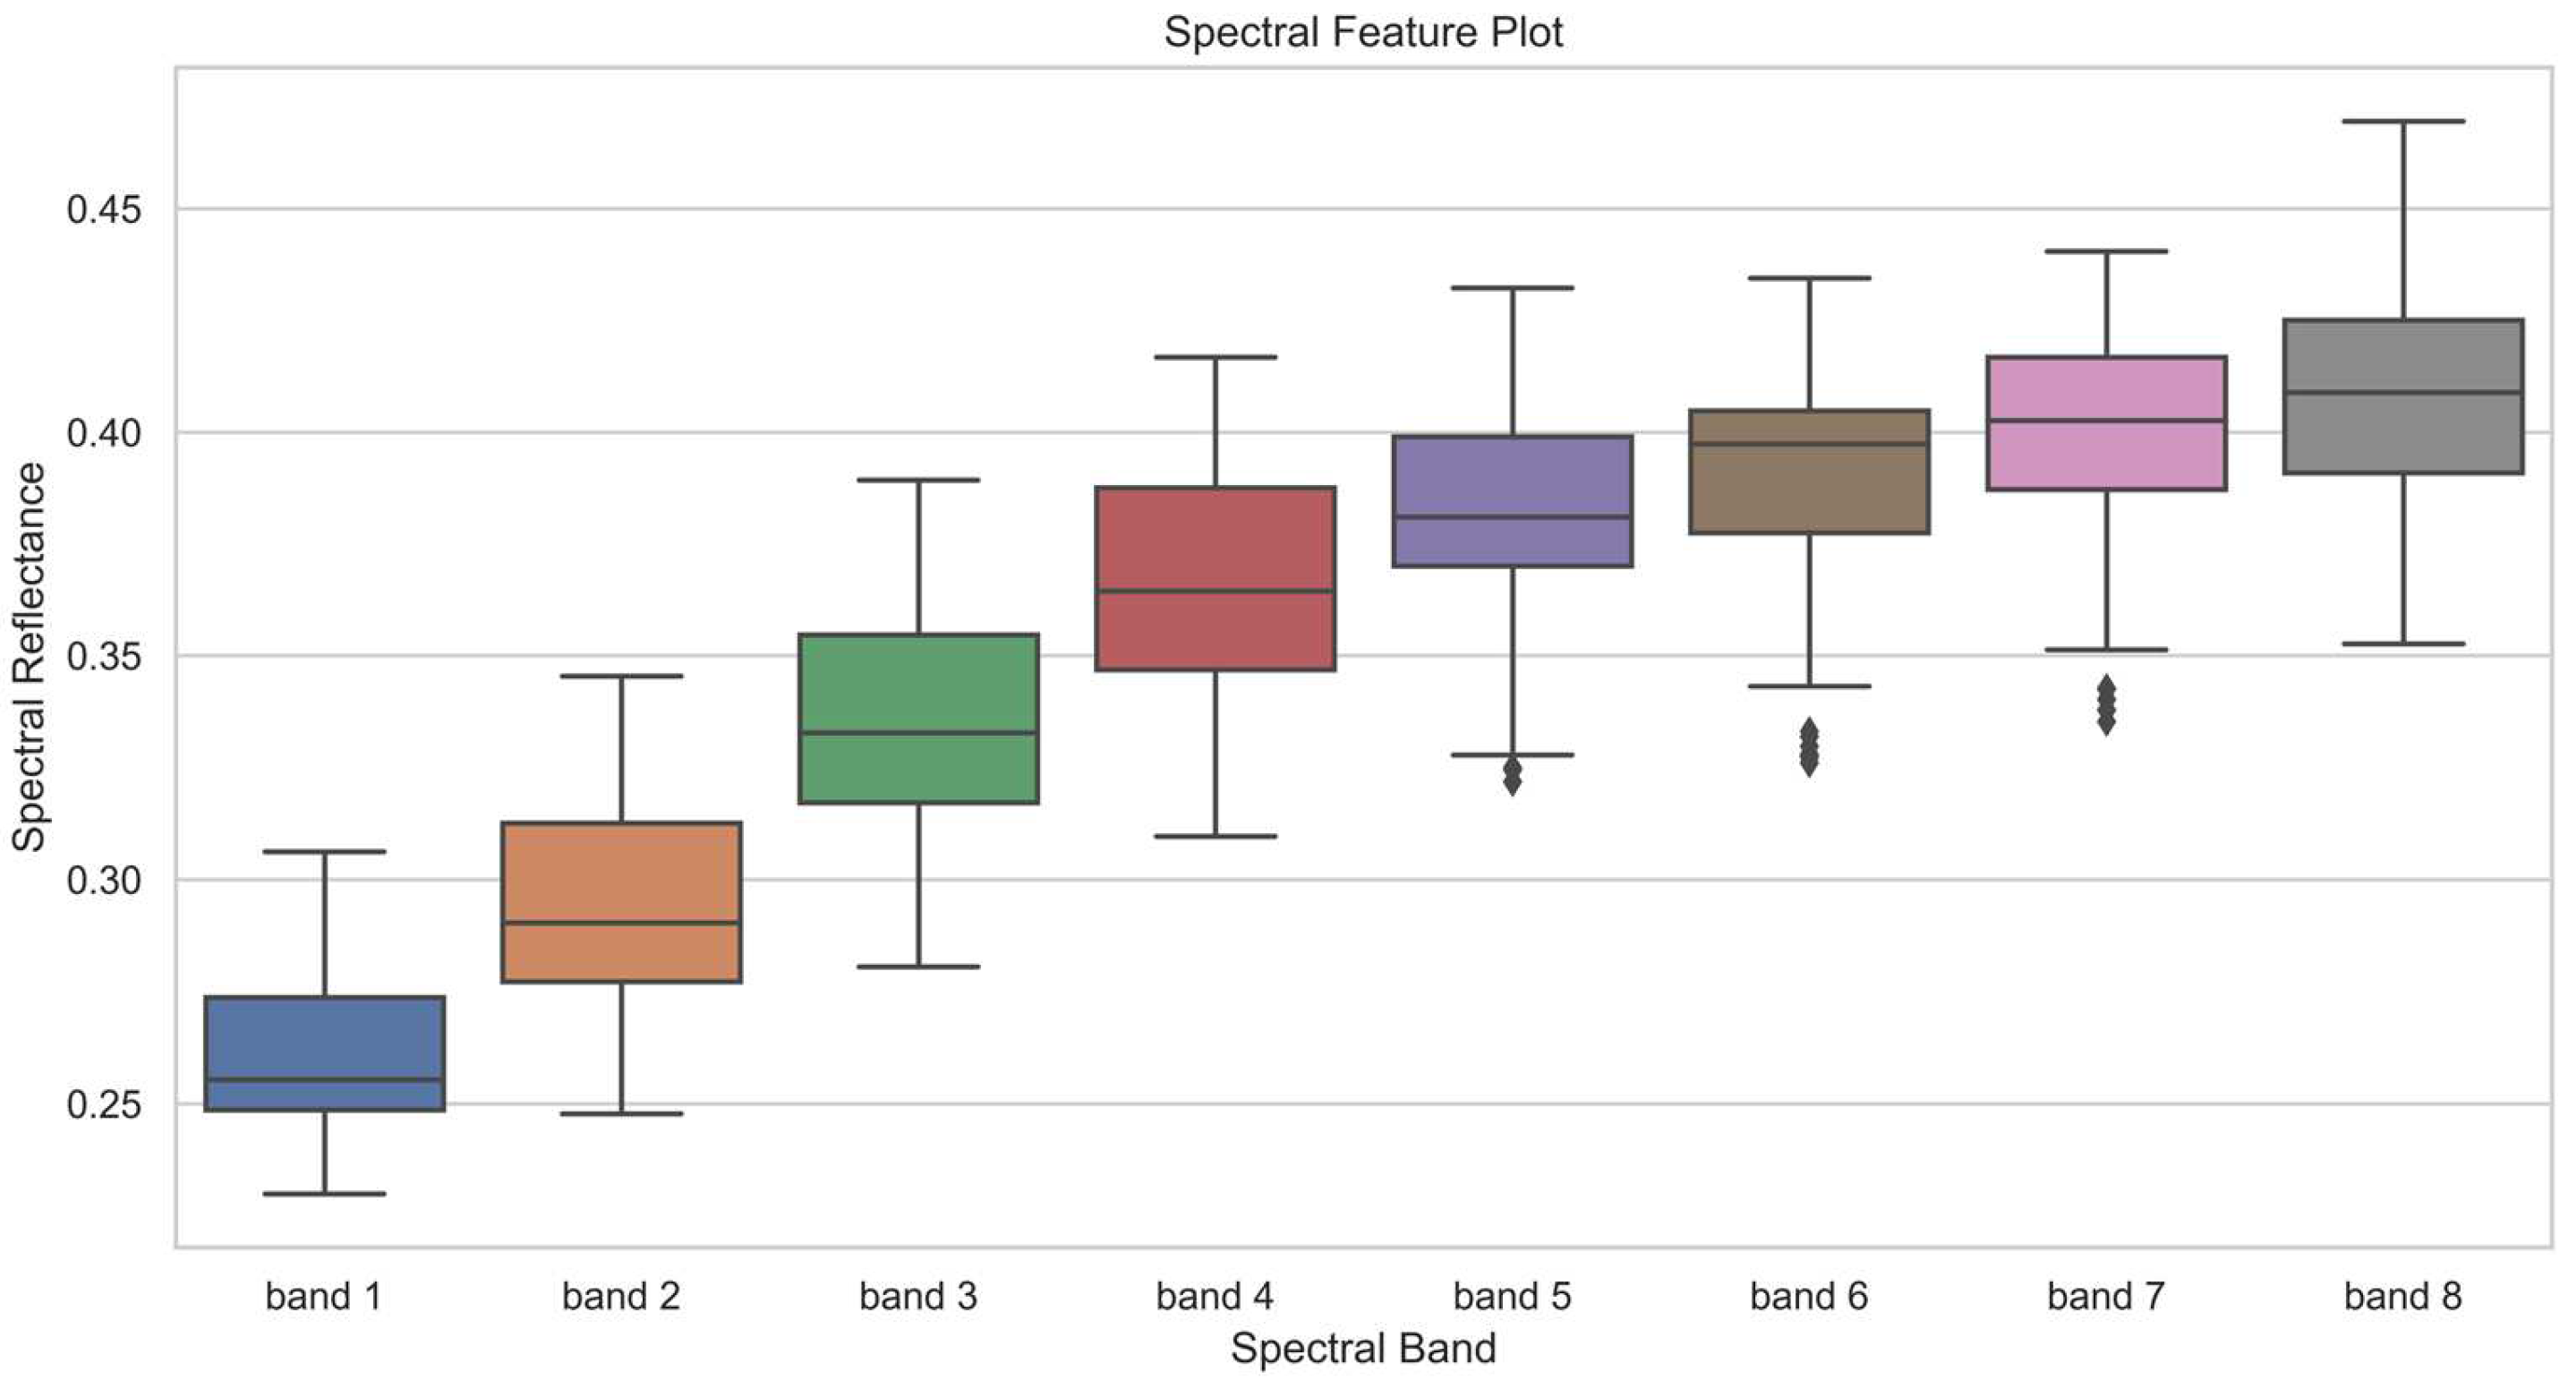
The reason for the simultaneous consideration of MAE and MSE is as follows: In this context, MAE primarily functions to assess the impact of outliers in the dataset. Despite the steps taken to address outliers in the data, as detailed in the preceding section, outliers were still observable in the box plots representing the experimental process. Consequently, MAE was integrated into the analysis workflow when the data re-entered the preprocessing stage, leading to consistent outcomes. Since MAE demonstrates a lower sensitivity to accuracy fluctuations than MSE, it was included for joint evaluation with the
R2 metric.
4. Discussion
This study aimed to use the GBR-RF algorithm in combination with Sentinel-2 satellite spectral data to accurately estimate soil moisture content in cotton-growing areas. The goal was to provide guidance for agricultural irrigation management in order to improve water resource utilization efficiency and crop yields on farmland. In this study, the soil moisture content of a cotton field was initially measured using dedicated instruments. Subsequently, spectral images of the study area were acquired from the Google Earth Engine (GEE) platform. The collected spectral data underwent further processing in the ENVI software. Following manual data refinement, a correlation analysis was conducted to identify bands that exhibited a strong relationship with soil water content. Subsequently, a series of inversions were performed utilizing various algorithms, including gradient-boosting regression (GBR), random forest (RF), and a combination of GBR and RF, with inputs from full bands as well as the identified sensitive bands. The ensuing results were analyzed comprehensively to identify the algorithms and sensitive bands that exhibited enhanced fitting accuracy and minimized error margins. The primary aim of this process was to define the optimal algorithms and bands for improved modeling accuracy and error reduction while also strategically outlining forthcoming research trajectories. This endeavor was driven by the overarching objective of refining the association between algorithms, sensitive bands, model accuracy, and future research directions.
Recent years have seen numerous researchers combine remote sensing methods with machine learning and artificial intelligence techniques to accurately determine soil moisture content in crop fields. For instance, N. R. Prasad et al. successfully inverted cotton yields by integrating remote sensing with a crop simulation model, achieving a root mean squared error of 154 kg/ha and a correlation soil moisture content in crops coefficient
R2 of 0.46 [
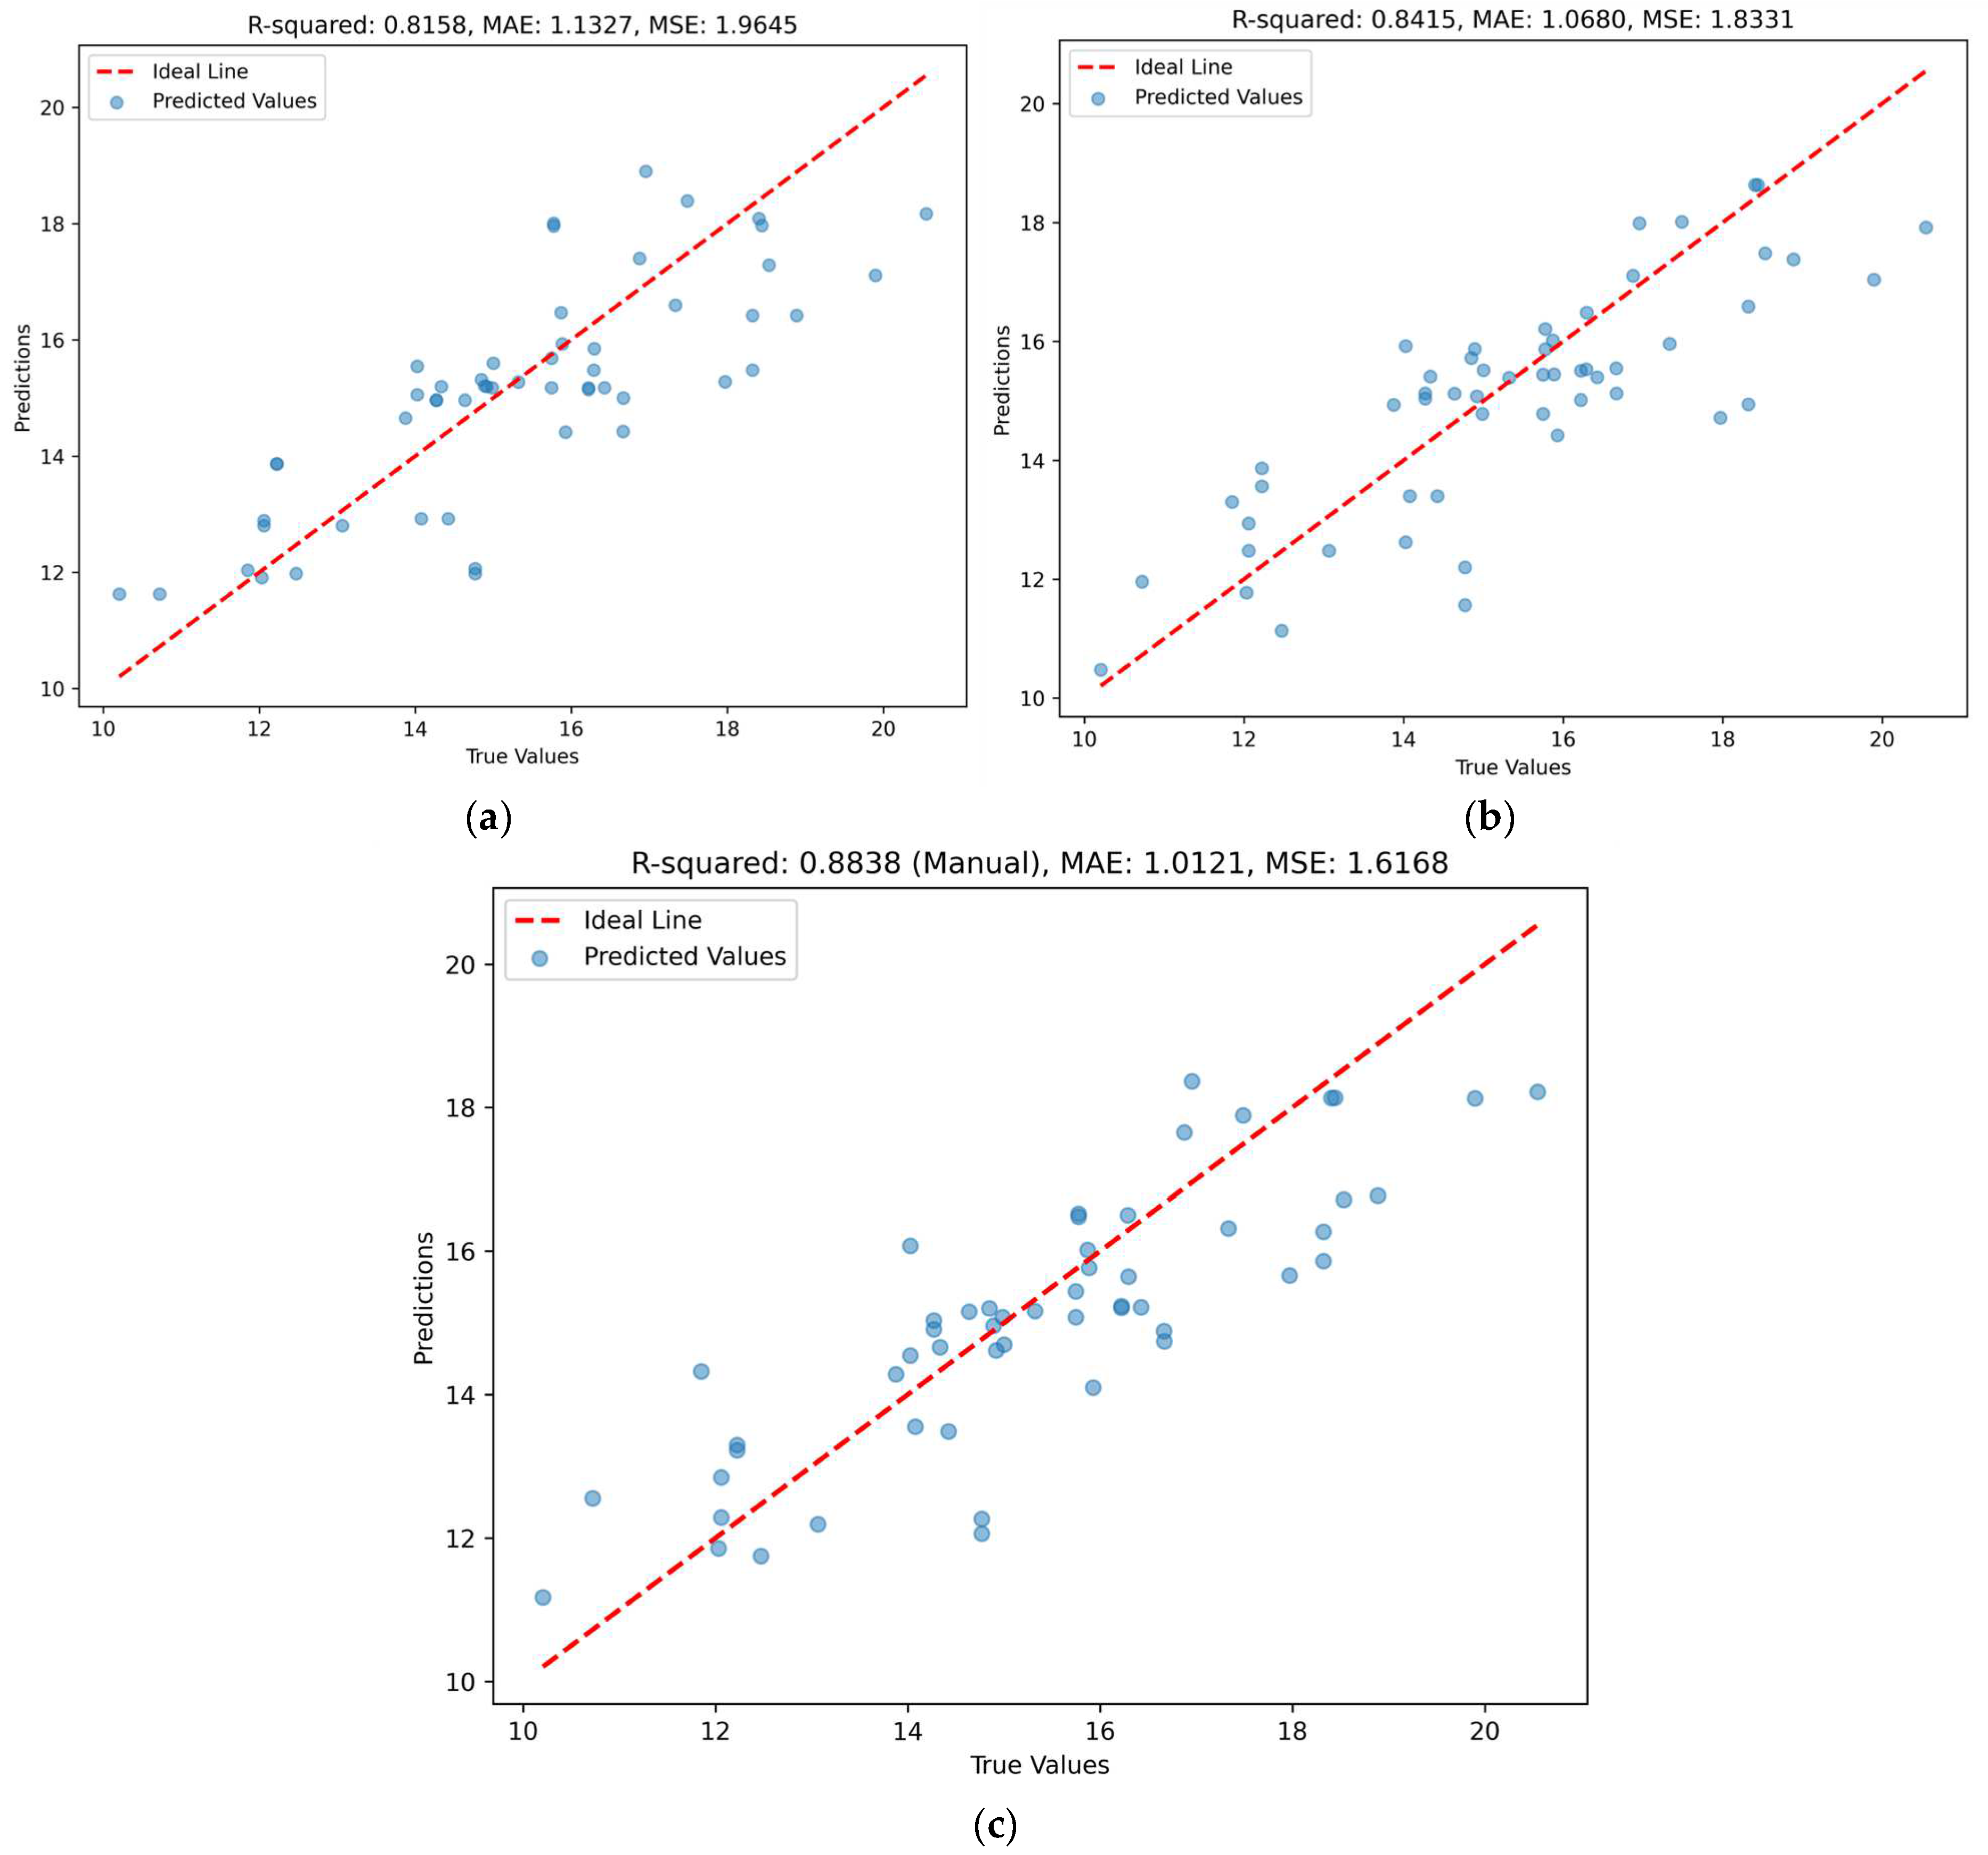
30], while in this study, the relevant optimal
R2 value was 0.8838, which is significantly higher than the results of the corresponding study on soil moisture in cotton. Agathos Filintas et al. conducted a study on cotton yield under various growth and irrigation conditions. The results of a two-way analysis of variance showed that the highest yield increase was 28.664%, and the highest water saving achieved was 24.941% [
31]. Mireguli Ainiwaer et al. made a regional-scale estimation of soil moisture content using multi-source remote sensing parameters, achieving good results with
R2 = 0.69, RMSE = 3.48%, and RPD = 1.91 [
32]. While comparing the best
R2 of 0.8838 in this study, it proved to be significantly higher than the related studies. Although these past studies are robust and detailed, the current study integrates an advanced learning algorithm for moisture inversion using Sentinel-2 satellite remote sensing data and ground soil moisture content. This approach not only enhances accuracy and robustness but also ensures greater efficiency for large-scale inversion, offering a non-destructive, swift, and highly precise method for soil moisture inversion in cotton, thereby contributing valuable insights for addressing data inversion challenges in this context.
In the experimental process, the identification of the corresponding cotton land began with field visits, followed by the collection of soil samples from the identified areas in the field. To address the significant errors in the surface data of the soil samples, inconsistent surface data were excluded. Additionally, in order to ensure consistency in depth levels, certain samples were eliminated. Subsequently, the obtained soil water content data were gathered for use in subsequent experiments. Sentinel-2 data acquisition and preprocessing were conducted on the GEE platform for the study area. During data processing, attempts were made to perform data derivative operations on the spectral band data; however, the results of these operations were unsatisfactorily compared to the original data. Consequently, the data were manually cleaned before being utilized in experiments. The data were analyzed using Pearson’s coefficient, and relevant sensitive data were extracted for comparative experiments. By conducting experiments with the GBR, RF, and GBR-RF algorithms, this study achieved positive outcomes. A comparison of the results revealed that the integrated algorithm outperformed individual band inversions. Specifically, the integrated algorithm showed improvements of 12.83%, 19.35%, and 24.27% over bands B6, B7, and B8, respectively. Furthermore, the integrated algorithm demonstrated enhancements of 8.34% and 5.03% compared to GBR and RF, respectively, highlighting the superiority of the integrated approach. Regarding the band-specific analysis, the data indicated improvements in the inversions of B6, B8, and the full band, while the results for the B7 band decreased. The combination of band data was expected to yield more accurate results due to the sensitivity of composite indices such as NDVI for vegetation being higher than that of individual bands. Although several vegetation indices were tested in the experiment, poor results were obtained, and, as a result, they were not included in the final results.
In this experiment, GBR and RF were demonstrated to be two powerful regression models capable of modeling complex nonlinear relationships. The GBR and RF algorithms are robust to the noise and outliers in input data, and they can effectively deal with the interfering factors in Sentinel-2 satellite spectral data, which improves the stability of the estimation of soil moisture content. By combining Sentinel-2 satellite spectral data, these algorithms can more accurately capture the complex relationship between soil moisture content and spectral features, thereby enhancing the prediction accuracy of soil moisture content. Additionally, Sentinel-2 satellite spectral data have a high spatial resolution and frequent observation cycles, enabling the provision of information on the spatial distribution of soil moisture content over a large area. Sentinel-2 satellite spectral data usually contain a large amount of spectral band information, leading to a high-dimensional feature space in the input data. By processing high-dimensional data and conducting feature selection and combination, effective features associated with soil moisture content were identified, thereby enhancing the generalization ability and prediction performance of the model. Moreover, the corresponding algorithms exhibit good model interpretability, allowing for the intuitive demonstration of the importance of different spectral bands in the estimation of soil moisture content. This capability is crucial for understanding the relationship between soil moisture content and spectral features, as well as for guiding subsequent agricultural management and decision-making endeavors.
In this study, there are limitations regarding the usage of the GBR and RF algorithms combined with Sentinel-2 satellite spectral data to enhance the precision and stability of soil moisture content prediction in cotton fields. One primary limitation is the relatively small size of the overall dataset, inhibiting the full exploitation of these algorithms, especially when handling the high-dimensional Sentinel-2 satellite spectral data. To ensure model generalization ability, a larger sample size is necessary. Considering non-destructive, intelligent, and efficient methodologies is essential to preventing the overcollection of data in agricultural applications. Non-destructive methods can minimize impact on crops and ecosystems, while intelligent and efficient techniques enhance agricultural production, reduce resource waste, and promote sustainable practices for long-term agricultural ecosystem health and land maintenance. By implementing various measures to minimize environmental and resource impacts, agricultural production can become more sustainable and efficient. Balancing the data collection process is crucial. Furthermore, both GBR and RF algorithms entail parameter adjustments. Such adjustments demand expertise and time, as different parameter configurations can influence model performance significantly. The mastery of the foundational concepts or the establishment of a streamlined experimental process with a specific threshold is vital to achieving optimal results. The Sentinel-2 satellite spectral data encompass details across multiple bands. The selection of input features from these bands profoundly impacts model performance, with various band combinations resulting in different predictions. While some preliminary research on this has been conducted, a deeper exploration is warranted for reasonable feature selection and optimization. Thus, while the GBR-RF algorithm alongside Sentinel-2 satellite spectral data shows advantages in predicting soil moisture content in cotton, attention should be paid to its shortcomings and limitations for improved model selection and optimization in practical scenarios. Furthermore, we should consider the generalizability and robustness of the algorithms for different crops, regions, and varieties.
The method used in this study effectively identifies the significance of various spectral bands in estimating soil moisture content, mining key features related to it, and enhancing the generalization ability and predictive performance of the model. This approach not only yields prediction results with high accuracy, stability, and broad adaptability but also offers a degree of interpretability. Consequently, the obtained results offer valuable information for enhancing agricultural production.


