Article

Classification and Identification of Pinecone Mulching in Blueberry Cultivation Based on Crop Leaf Characteristics and Hyperspectral Data

College of Forest and Environmental Science, Kangwon National University, Chuncheon 24341, Gangwon-do, Republic of Korea
*
Author to whom correspondence should be addressed.
Agronomy 2024, 14(4), 785; https://doi.org/10.3390/agronomy14040785
Submission received: 13 March 2024 / Revised: 7 April 2024 / Accepted: 8 April 2024 / Published: 10 April 2024
(This article belongs to the Section Horticultural and Floricultural Crops)

Abstract

:
While crushed pinecone mulch holds promise as a beneficial material for blueberry cultivation, research on its effectiveness remains limited. Crop leaf characteristics can serve as parameters for assessing mulching effects, although there are several limitations, including the need to analyze various distinct characteristics separately. The combination of hyperspectral data and machine learning techniques is expected to enable the selection of only the most important features among these characteristics. In this study, we investigated the impact of various mulching treatments utilizing pine tree byproducts, including crushed pinecones. Mulching variations included non-mulching (NM), crushed pinecones (PCs), a mixture of crushed pinecones and sulfur (PCS), pine needles (PNs), and sulfur treatment (S). Conventional methods were employed to measure leaf growth (length and width) and physiological characteristics (chlorophyll content, chlorophyll fluorescence, and stomatal conductance). Hyperspectral reflectance was also measured, and classification models using Partial Least Squares Discriminant Analysis (PLS-DA) and eXtreme Gradient Boosting (XGBoost) were developed for crop characteristics, vegetation indices (VIs), visible and near-infrared (VNIR), and short-wave infrared (SWIR). The results showed that using crushed pinecones as the sole mulching material for blueberries, without sulfur treatment, had a positive impact on blueberry growth. The PC treatment exhibited a dual effect on plant growth by lowering the soil pH to 5.89 and maintaining soil moisture within the range of 26.33–35.20%. We observed distinct differences in soil inorganic nutrient content, with higher concentrations of organic matter, total nitrogen, and available P2O5 and K+, which positively influenced blueberry growth. Mulching treatments demonstrated superior physiological characteristics, with two classification models identifying stomatal conductance (gs) as a key parameter influencing treatment classification (VIP scores > 1 rank: 3, variable score rank: 1). The photochemical reflectance index (PRI) emerged as a major parameter among VIs, showing potential for measuring water stress (VIP scores > 1 rank: 2, variable score rank: 1). In the SWIR PLS-DA model, wavelength peaks were mainly observed in the O-H overtone (1410 nm, 1450 nm, 1930 nm, 1940 nm, and 2100 nm). Overall, crushed pinecones were found to positively impact the initial growth of blueberries by enhancing water status (plant respiration).

1. Introduction

The significance of highbush blueberries (Vaccinium corymbosum) in agriculture lies in their nutritional value, such as antioxidants like anthocyanins and polyphenols, as well as their growing consumer demand [1,2,3]. Not only the fruits but also the leaves are reported to be valuable in research due to their potential as bioactive sources for medical and pharmaceutical applications [4,5,6]. Leaf photosynthesis and respiration can influence the growth and yield of fruit trees, so it is crucial to identify effective treatments [7,8,9]. Cultivating blueberries under specific conditions ensures optimal productivity [10]. In blueberry cultivation, the commonplace approach involves the application of peat moss and sulfur to modulate the soil pH, thereby enhancing productivity. However, it is important to consider their disadvantages. The use of peat moss raises concerns owing to its limited cost-effectiveness, while an excess of sulfur holds the potential to induce soil acidification, consequently impeding the availability of vital nutrients. For this reason, organic mulching materials such as pine needles, wood chips, and composted bark are favored for their moisture retention, temperature regulation, weed control, and nutrient enrichment [11,12,13,14].
Using pine tree byproducts as mulch presents sustainable farming opportunities [11,13]. Crushed pinecones exhibit beneficial properties, including antifungal attributes, and have been explored by researchers for potential use in livestock [15,16] and cosmetics [17,18,19,20]. Abundant post-pine-nut harvesting, pinecones emerge as an economical mulching option in Gangwon-do, a prominent pine-nut-producing region in Korea. Pinecones have acidity imparted by pine resin, while blueberry cultivation requires high soil acidity. Despite anecdotal use in blueberry cultivation in Korea, scientific evidence on crushed pinecone mulching for blueberries is lacking.
There are various characteristics commonly used to measure plant physiology, including biomass (leaf size), photosynthesis (chlorophyll content and fluorescence), and respiration (stomatal conductance), among others. Diverse research is underway to measure the leaf growth and physiological parameters of blueberries and to analyze the effect of mulching [21,22,23,24]. However, analyzing each of these characteristics requires significant investment in acquiring specific equipment, along with a considerable amount of labor and time for measurement. When measuring leaf size non-destructively, if the leaf size is small, manual measurement solely by personnel may be necessary. The SPAD meter is portable, non-destructive, and rapid. However, it is limited to specific wavelengths, potentially resulting in unreliable chlorophyll content data depending on the plant species [25]. Chlorophyll fluorescence is constrained by the necessity for dark adaptation, requiring preprocessing or limited by location [26]. Since stomatal conductance (gs) measures a plant’s respiration, an appropriate environment conducive to measurement must be established, which can be time-consuming [27].
In recent years, precision agriculture, applying hyperspectral technology, has been widely practiced in modern agriculture [28,29]. Hyperspectral sensors capture a wide range of wavelengths across the electromagnetic spectrum, enabling a more detailed analysis of plant characteristics. Hyperspectral reflectance analysis offers insights into plant–light interactions across wavelengths, enabling the detection of subtle physiological changes [30]. As the hyperspectral reflectance characteristics are refined, it is possible to acquire information about various physiological features of plants [31]. The visible and near-infrared (VNIR) region is associated with chlorophyll content, where green foliage exhibits the lowest variation in reflectance in the visible spectrum and the highest in the near-infrared range (NIR). In the short-wave infrared (SWIR) region, features are associated with water absorption, lignin, and other organic compounds [32]. Combining these two wavelength ranges allows for a comprehensive and high-resolution analysis of various plant characteristics.
Hyperspectral data offer the advantage of rapidly and non-destructively collecting large volumes of data. This allows for precise analysis using various vegetation indices (VIs) and machine learning techniques. VIs find widespread use in assessing crop growth and plant physiology [33,34]. The Partial Least Squares (PLS) algorithm is commonly used as one of the most prevalent machine learning techniques, particularly in the analysis that combines plant physiological characteristics and hyperspectral features [35,36]. Moreover, recent advances in machine learning have been applied to classify and predict plant physiological responses from hyperspectral data, enhancing the accuracy of plant performance predictions [37]. The eXtreme Gradient Boosting (XGBoost) algorithm, one of the tree-based ensemble learning models, provides fast computation speed on large datasets and robust handling of nonlinear patterns, overcoming the limitations of PLS [38]. Recent studies have reported the utilization of XGBoost models for plant physiology diagnostics based on crop leaf data [39,40].
However, it is still challenging to completely replace hyperspectral measurement. To achieve this, it is necessary to develop prediction models, which require a large amount of data on plant physiological characteristics [37]. Therefore, it is necessary to collect plant physiological data from existing measurement methods and data on hyperspectral characteristics while utilizing complementary analysis methods. Therefore, one approach could be to create separate classification models for crop characteristic data and hyperspectral data, and then conduct a comparative analysis.
In this study, we examined the impact of various mulching materials, including pinecones, which are under-researched for their mulching effects, on the growth of blueberry seedlings. The objective was to determine the most effective mulch for promoting optimal leaf growth and physiology in the early stages of plant development. We integrated conventional parameters of leaf growth and physiological characteristics with hyperspectral data for more precise analysis. Discriminant analysis-based PLS (PLS-DA) and XGBoost models were employed to identify influential factors affecting blueberry growth. This approach not only underscores the utility of hyperspectral technology but also provides valuable insights into plant vitality, aiding informed decision making in blueberry cultivation, particularly with regard to pinecone-based mulch.

2. Materials and Methods

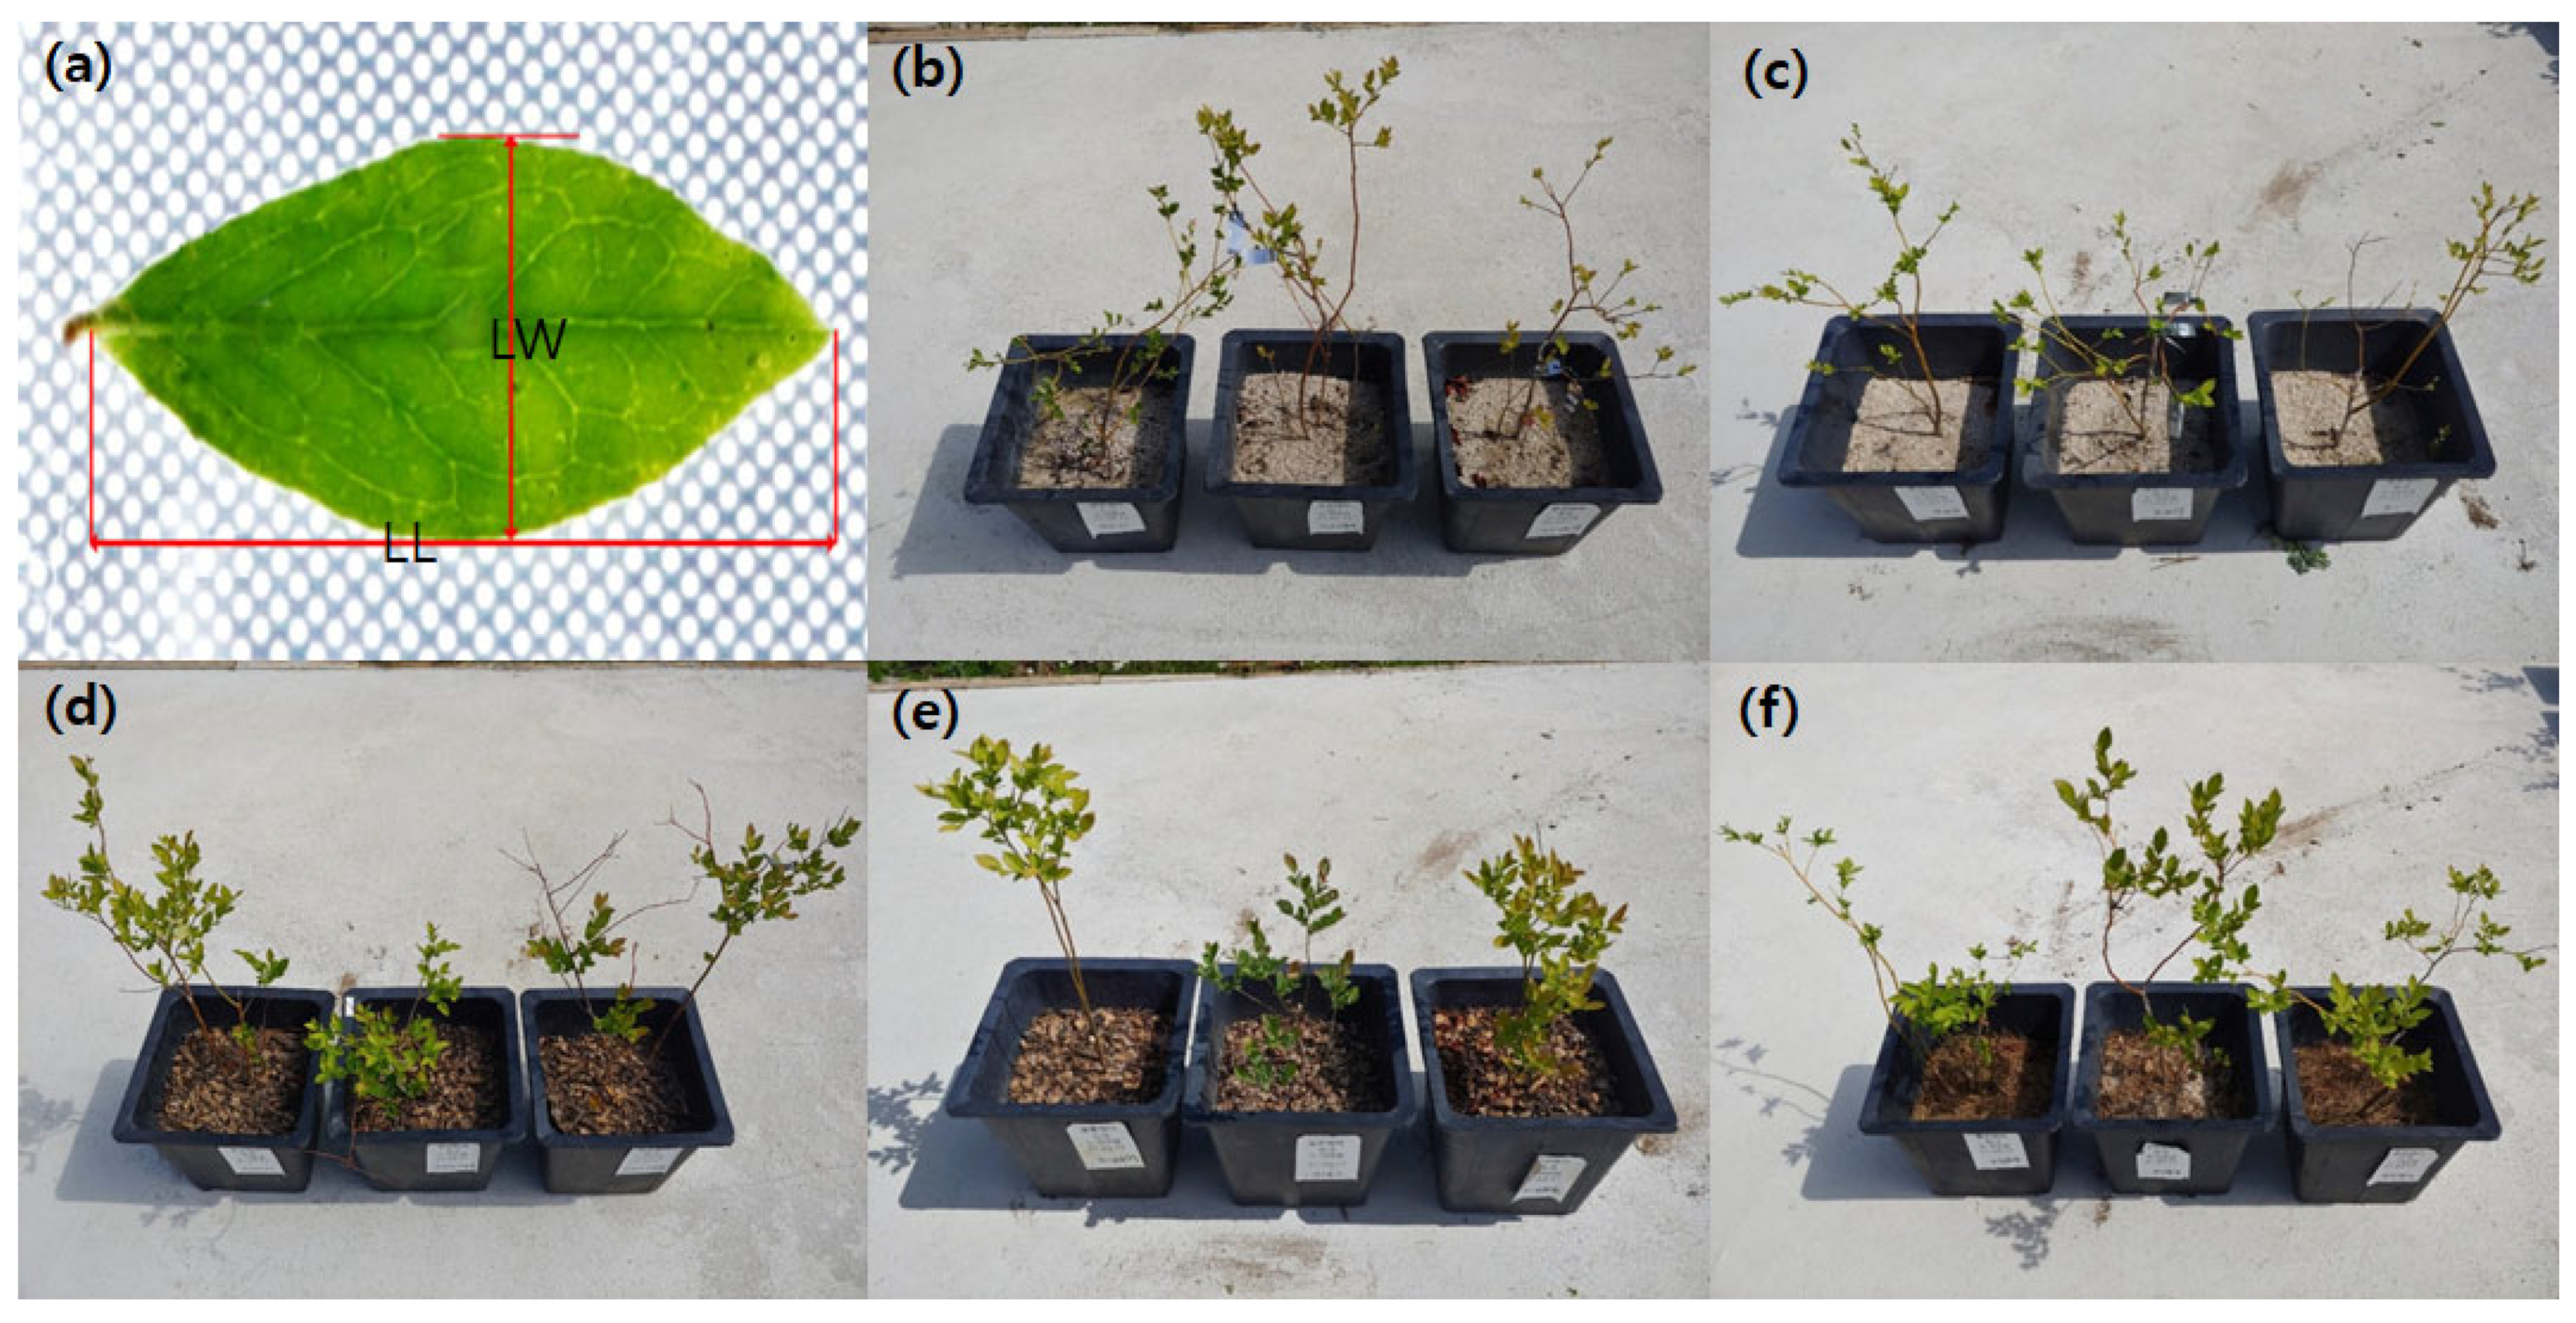
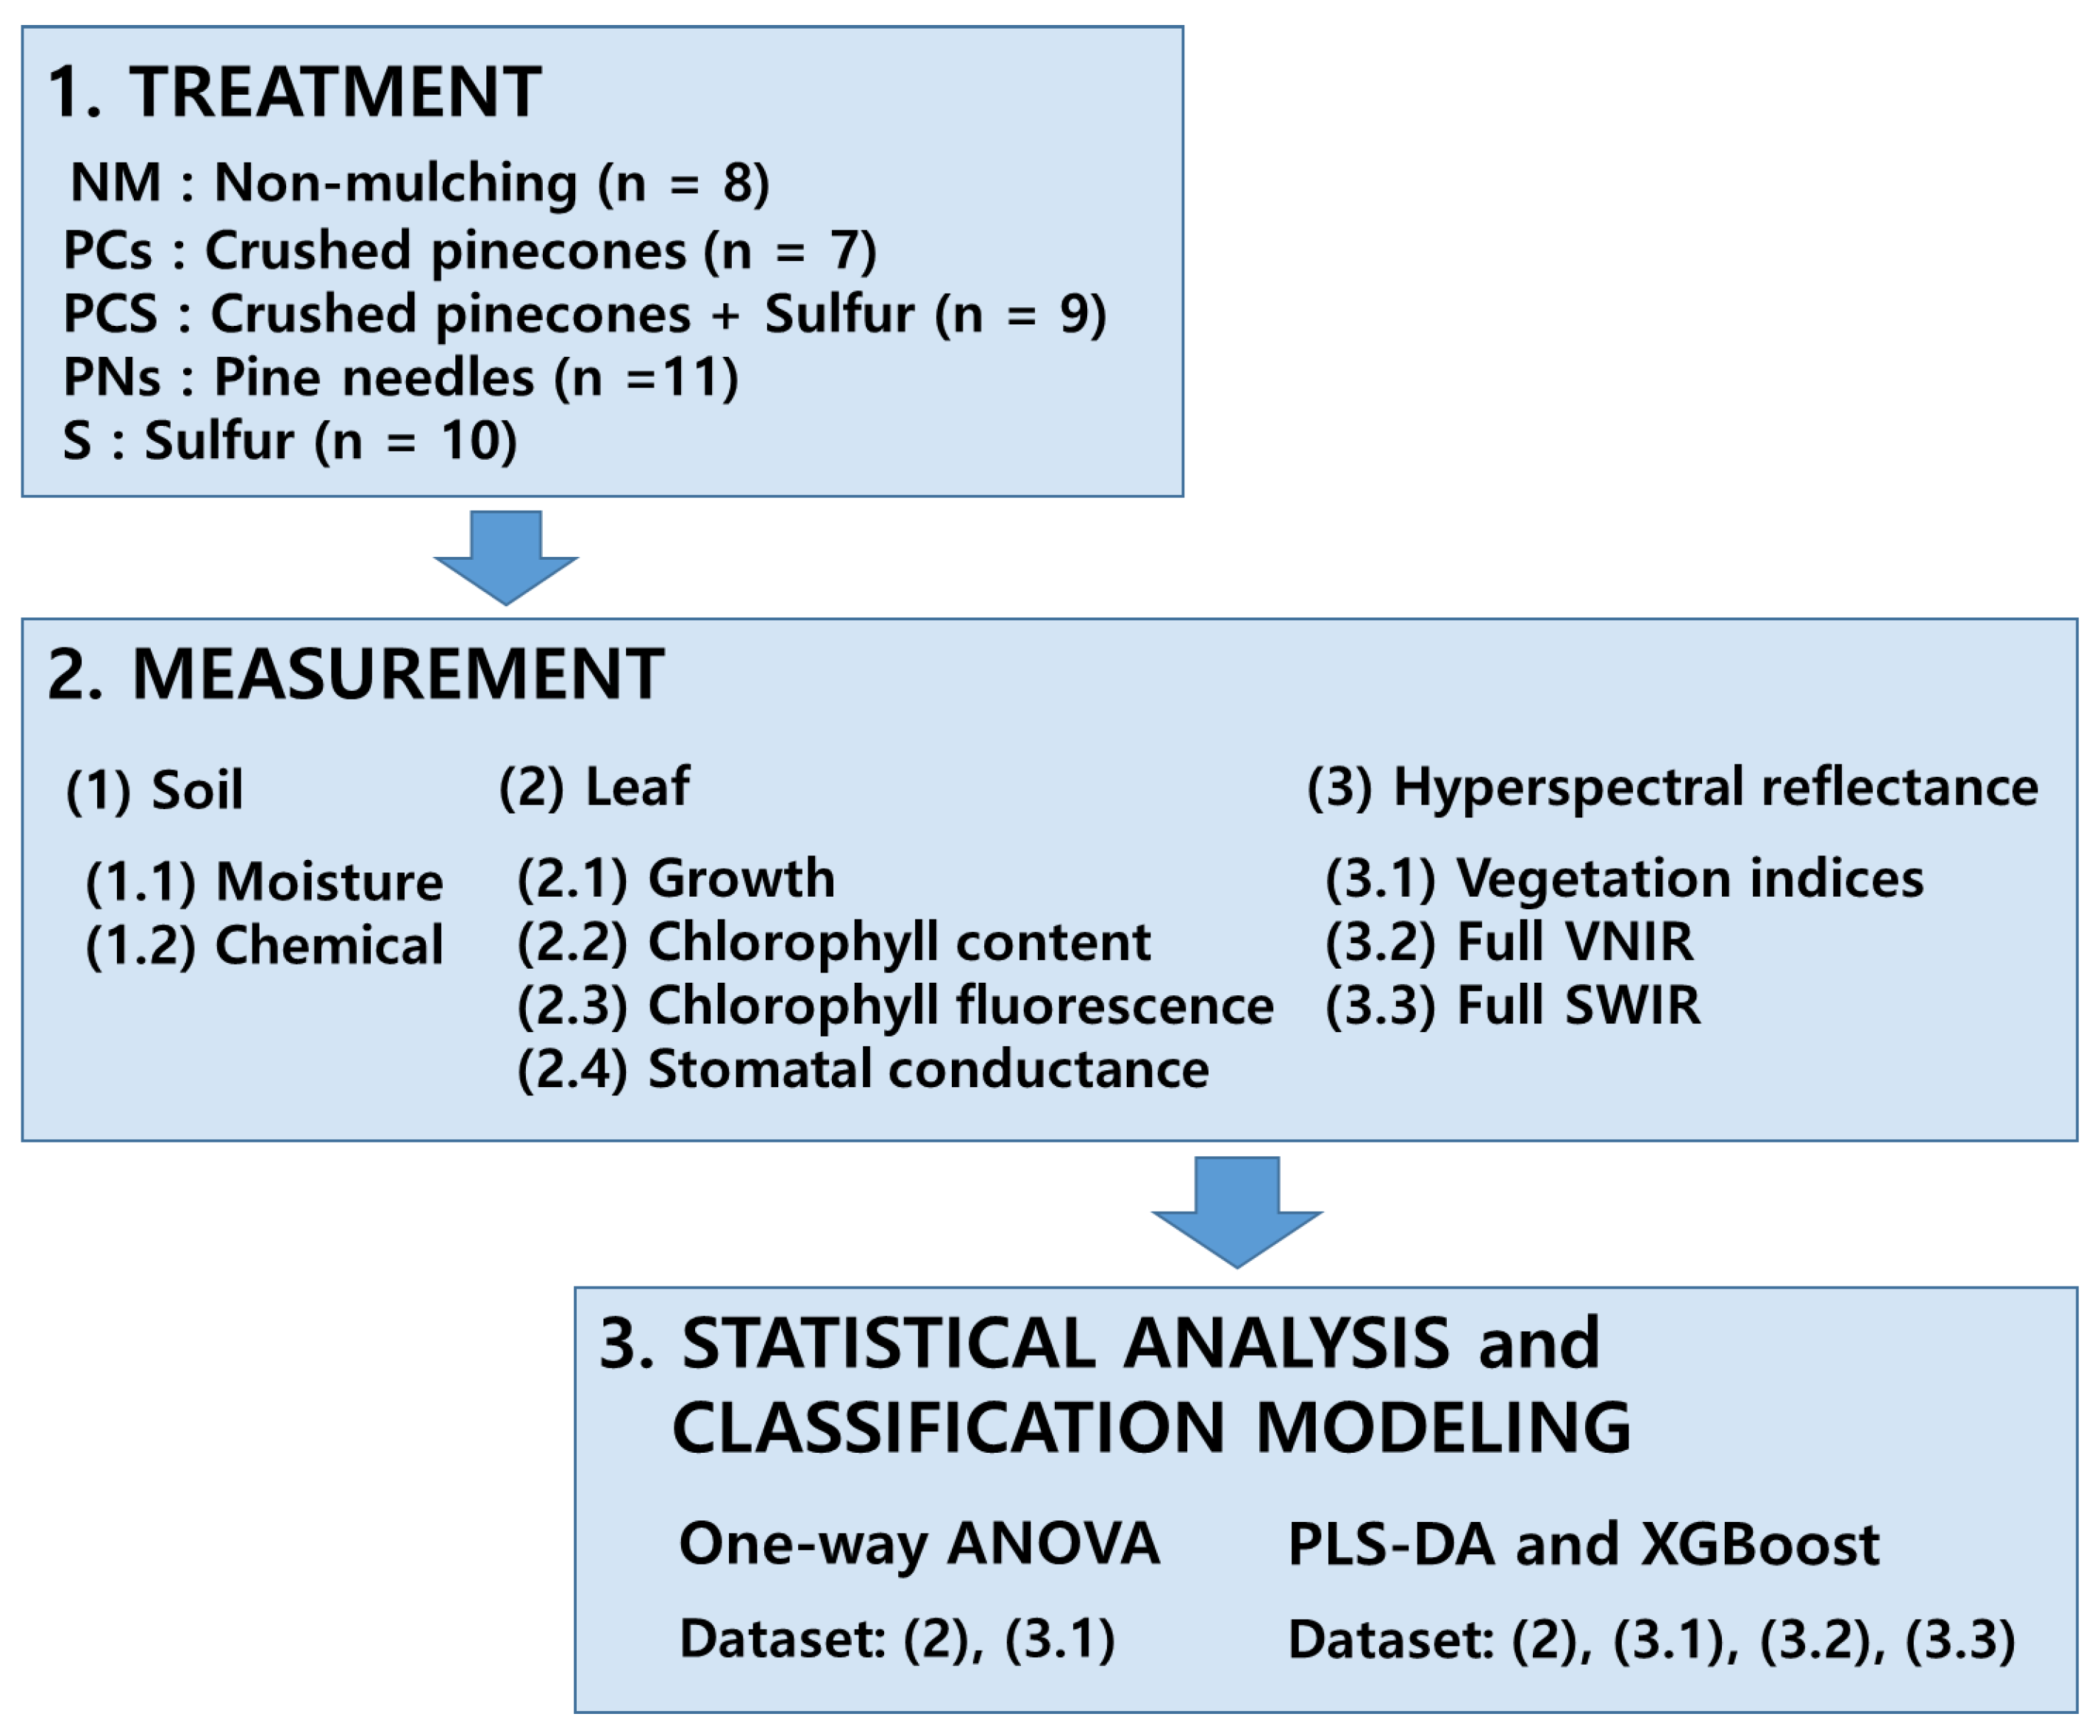
2.1. Plant Materials and Treatments

The cultivar ‘Duke’ was chosen for the experiments because it grows well and is cultivated in the Gangwon-do area. The plants were five years of age and were planted in pots 30 cm in height and 35 cm in inner diameter (with a soil height of 25 cm) in March 2021. The soil composition solely consisted of sandy soil, eliminating any influence of horticultural media. The sandy soil consisted of crushed granite particles with a size of 1–4 mm. The treatments consisted of five distinct groups: non-mulching (NM), crushed pinecones (PCs), pine needles (PNs), sulfur treatment (S), and a mixture of crushed pinecones and sulfur (PCS). Crushed pinecones, harvested and processed at the Hongcheon-gun Forestry Association, and fallen pine needles from Kangwon National University’s academic forest were used for mulching treatment, respectively. A 5 cm layer of crushed pinecones and pine needles was applied to the soil surface. The sulfur applied to the soil was treated by mixing it with the soil at a ratio of 140 g/m3 [41]. Granules of sulfur with a purity of 100%, with a diameter of 1–3 mm and a thickness of approximately 1 mm, were utilized. Acclimatization occurred within the greenhouse until August 2021, supplemented by weekly 2 L irrigations. From September 2021, individuals with superior growth (the number of pots as replications: NM: 8, PCs: 7, PCS: 9, PNs: 11, S: 10) were chosen for an outdoor acclimatization phase adjacent to the greenhouse. Data collection for acclimatized seedlings was conducted in May 2022 outdoors, when leaf flushing was nearly complete. The average temperature throughout the acclimatization phase (September–April) and experimental period (May) stood at 8.03 ± 9.35 °C (maximum: 14.65 ± 9.2 °C, minimum: 2.16 ± 9.64 °C) (Figure 1).

2.2. Soil Characteristic Analysis

The soil moisture content (SMC) (%) was measured using a standard probe from a universal moisture tester (HB-300, Kett, Japan) inserted into the soil surface. Prior to the initial measurement, SMC (%) data obtained through the equation [SMC (%) = (wet soil weight (FW) − dry soil weight (DW))/dry soil weight (DW)) × 100] were calibrated into the device. Wet soil samples were collected immediately after irrigation, while dry soil samples were obtained by drying the soil samples until a constant weight was achieved at 105 °C. After six months of planting, soil samples were collected from each pot at a depth of 0–10 cm following the removal of mulching material. These samples were collected using a 100 cc soil sample can, and after mixing by treatment group, they were quantified to 500 g for soil analysis. This study involved assessing 10 chemical parameters of the soil, such as pH, organic matter [42], available phosphorus [43], total nitrogen, ammonium nitrogen, nitrate nitrogen, and exchangeable cations (K+, Ca2+, Na+, and Mg2+) [44].

2.3. Leaf Growth and Physiological Characteristics

Two hundred leaves were measured non-destructively in the order of the longest branch for each treatment. Thirty leaves were measured from one plant. If there were fewer than 30 leaves on one plant, more than 30 leaves were collected from another plant. For growth data, leaf width (LW) (cm), leaf length (LL) (cm), and the ratio of LW to LL (LW/LL) were measured on 3 May 2022. The LW was the longest vertical length of a leaf vein, and the LL was based on the length of a leaf vein (Figure 2). The physiological data, including chlorophyll content, chlorophyll fluorescence, and stomatal conductance, were simultaneously measured during the second week (10th to 13th, 10:00 am–04:00 pm KST) of May 2022. During the measurement period, 1–3 pots from the same treatment were measured each day. In the same manner as leaf growth data, physiological data were collected for each parameter, with 200 samples per treatment. Chlorophyll content was measured by SPAD value using a chlorophyll content meter (SPAD-502 plus, Konica-Minolta, Tokyo, Japan). One SPAD value was collected as the average value measured at three mesophyll areas per leaf. After the SPAD measurements, the seedlings were moved to a darkroom kept at 25 °C and they were acclimated in the dark for 20 min. After 20 min of dark adaptation, five chlorophyll fluorescence parameters (Fo: minimum fluorescence; Fm: maximum fluorescence; Fv/Fm [Fv = Fm − Fo]: maximum quantum yield of photosystem II; ABS/RC: absorption flux per reaction center; DIo/RC: energy dissipation per reaction center) were collected in the darkroom using a chlorophyll fluorescence meter (FluorPen FP-100, Photon Systems Instruments, Drásov, Czech). Chlorophyll fluorescence was measured directly on the mesophyll area, similar to the SPAD measurements. One chlorophyll fluorescence measurement was made per leaf, and five parameters were measured simultaneously with one measurement. Stomatal conductance (gs) (mmol/m2/s) was measured using a leaf porometer (Model SC-1, Decagon, Pullman, WA, USA). Before the gs measurement, calibration was conducted daily by replacing the desiccant in the measurement chamber for thermal equilibrium. The measurement chamber attached to the porometer was applied to the leaf for measurement. One gs measurement was taken per leaf, the same as for the chlorophyll fluorescence.

2.4. Hyperspectral Data Collection

Hyperspectral reflectance spectra were measured 30 times at different mesophyll spots per leaf until more than 2000 data (average reflectance of three measurements) were collected for each treatment. The VNIR (range: 485–950 nm, resolution: 1 nm) and SWIR (range: 1101–2300 nm, resolution: 3 nm) were measured during the third week (17th to 19th, 10:00 a.m.–04:00 p.m. KST) of May 2022. Measurements were conducted by utilizing a probe to directly contact the leaf surface. The VNIR and SWIR probes (QR400-7-VIS-BX, Ocean Optics, Orlando, FL, USA) were connected to spectrometers (USB4000; NIRQest, Ocean Optics, Orlando, FL, USA), and the measurement setup values were set as an integration time of “100 milliseconds”, a scan to average of “3”, and a boxcar width of “3” for graph smoothing in the software Spectra Suite ver. 6.2 (Ocean Optics, Orlando, FL, USA). For calibration, the tungsten halogen light source (HL-2000, Ocean Optics, Orlando, FL, USA) was turned off, and the spectrum was saved in the dark state (0% reflectance). After that, the reference value was set by measuring the 100% reflectance with the light source turned on and the probe in contact with the diffuse reflectance standard (WS-1-SL, Ocean Optics, Orlando, FL, USA).

2.5. Datasets for Classification

Before developing the classification model, datasets based on leaf growth, physiology, vegetation indices (VIs), and full spectra data were created. The composition and quantity of data for each dataset are specified in Table 1. All datasets were randomly classified into training/testing = 70:30. VIs data were based on the reflectance (%) of the corresponding wavelength in the collected raw spectra. Full spectra data were based on Savitzky–Golay smoothing (SG smoothing; window size: 15) + Standard Normal Variate (SNV) preprocessing spectra (Supplementary Figure S1).

2.6. Statistical Analysis and Machine Learning Methods

The measured data of leaf growth and physiology (n = 200) and VIs (n = 2000) for each treatment were analyzed for statistical significance using one-way ANOVA and a Tukey HSD test (p < 0.05) in SPSS ver. 24 (IBM, Armonk, NY, USA). PLS-DA and XGBoost models were used to classify the effects of mulching treatment. Due to differing units of parameters, leaf growth, physiology, and VI data were standardized before analysis. Both machine learning methods used 10-fold Venetian blind cross-validation to create a generalized model and avoid overfitting. Each PLS-DA and XGBoost dataset was used to develop two models: the predicted most probable model (P.M.P model) and the predicted strictly using threshold = 0.50 model (Thres: 0.5 model). The PLS-DA model used for model evaluation selected the optimal number of latent variables (Num. LVs) model based on RSME. The XGBoost model selected the optimal values for the learning rate (eta), the max depth of each tree, and the number of boosting rounds to determine the appropriate model. The evaluation method for these models is outlined in Table 2. The results from each model were based on variable importance in projection scores (VIP scores) > 1 and the variable score rank. The PLS-Toolbox ver. 8.9.1 package (Eigenvector Research Incorporated, Manson, WA, USA) from Matlab ver. R2020 (MathWorks, Natick, MA, USA) was used for analysis (Figure 3).

3. Results

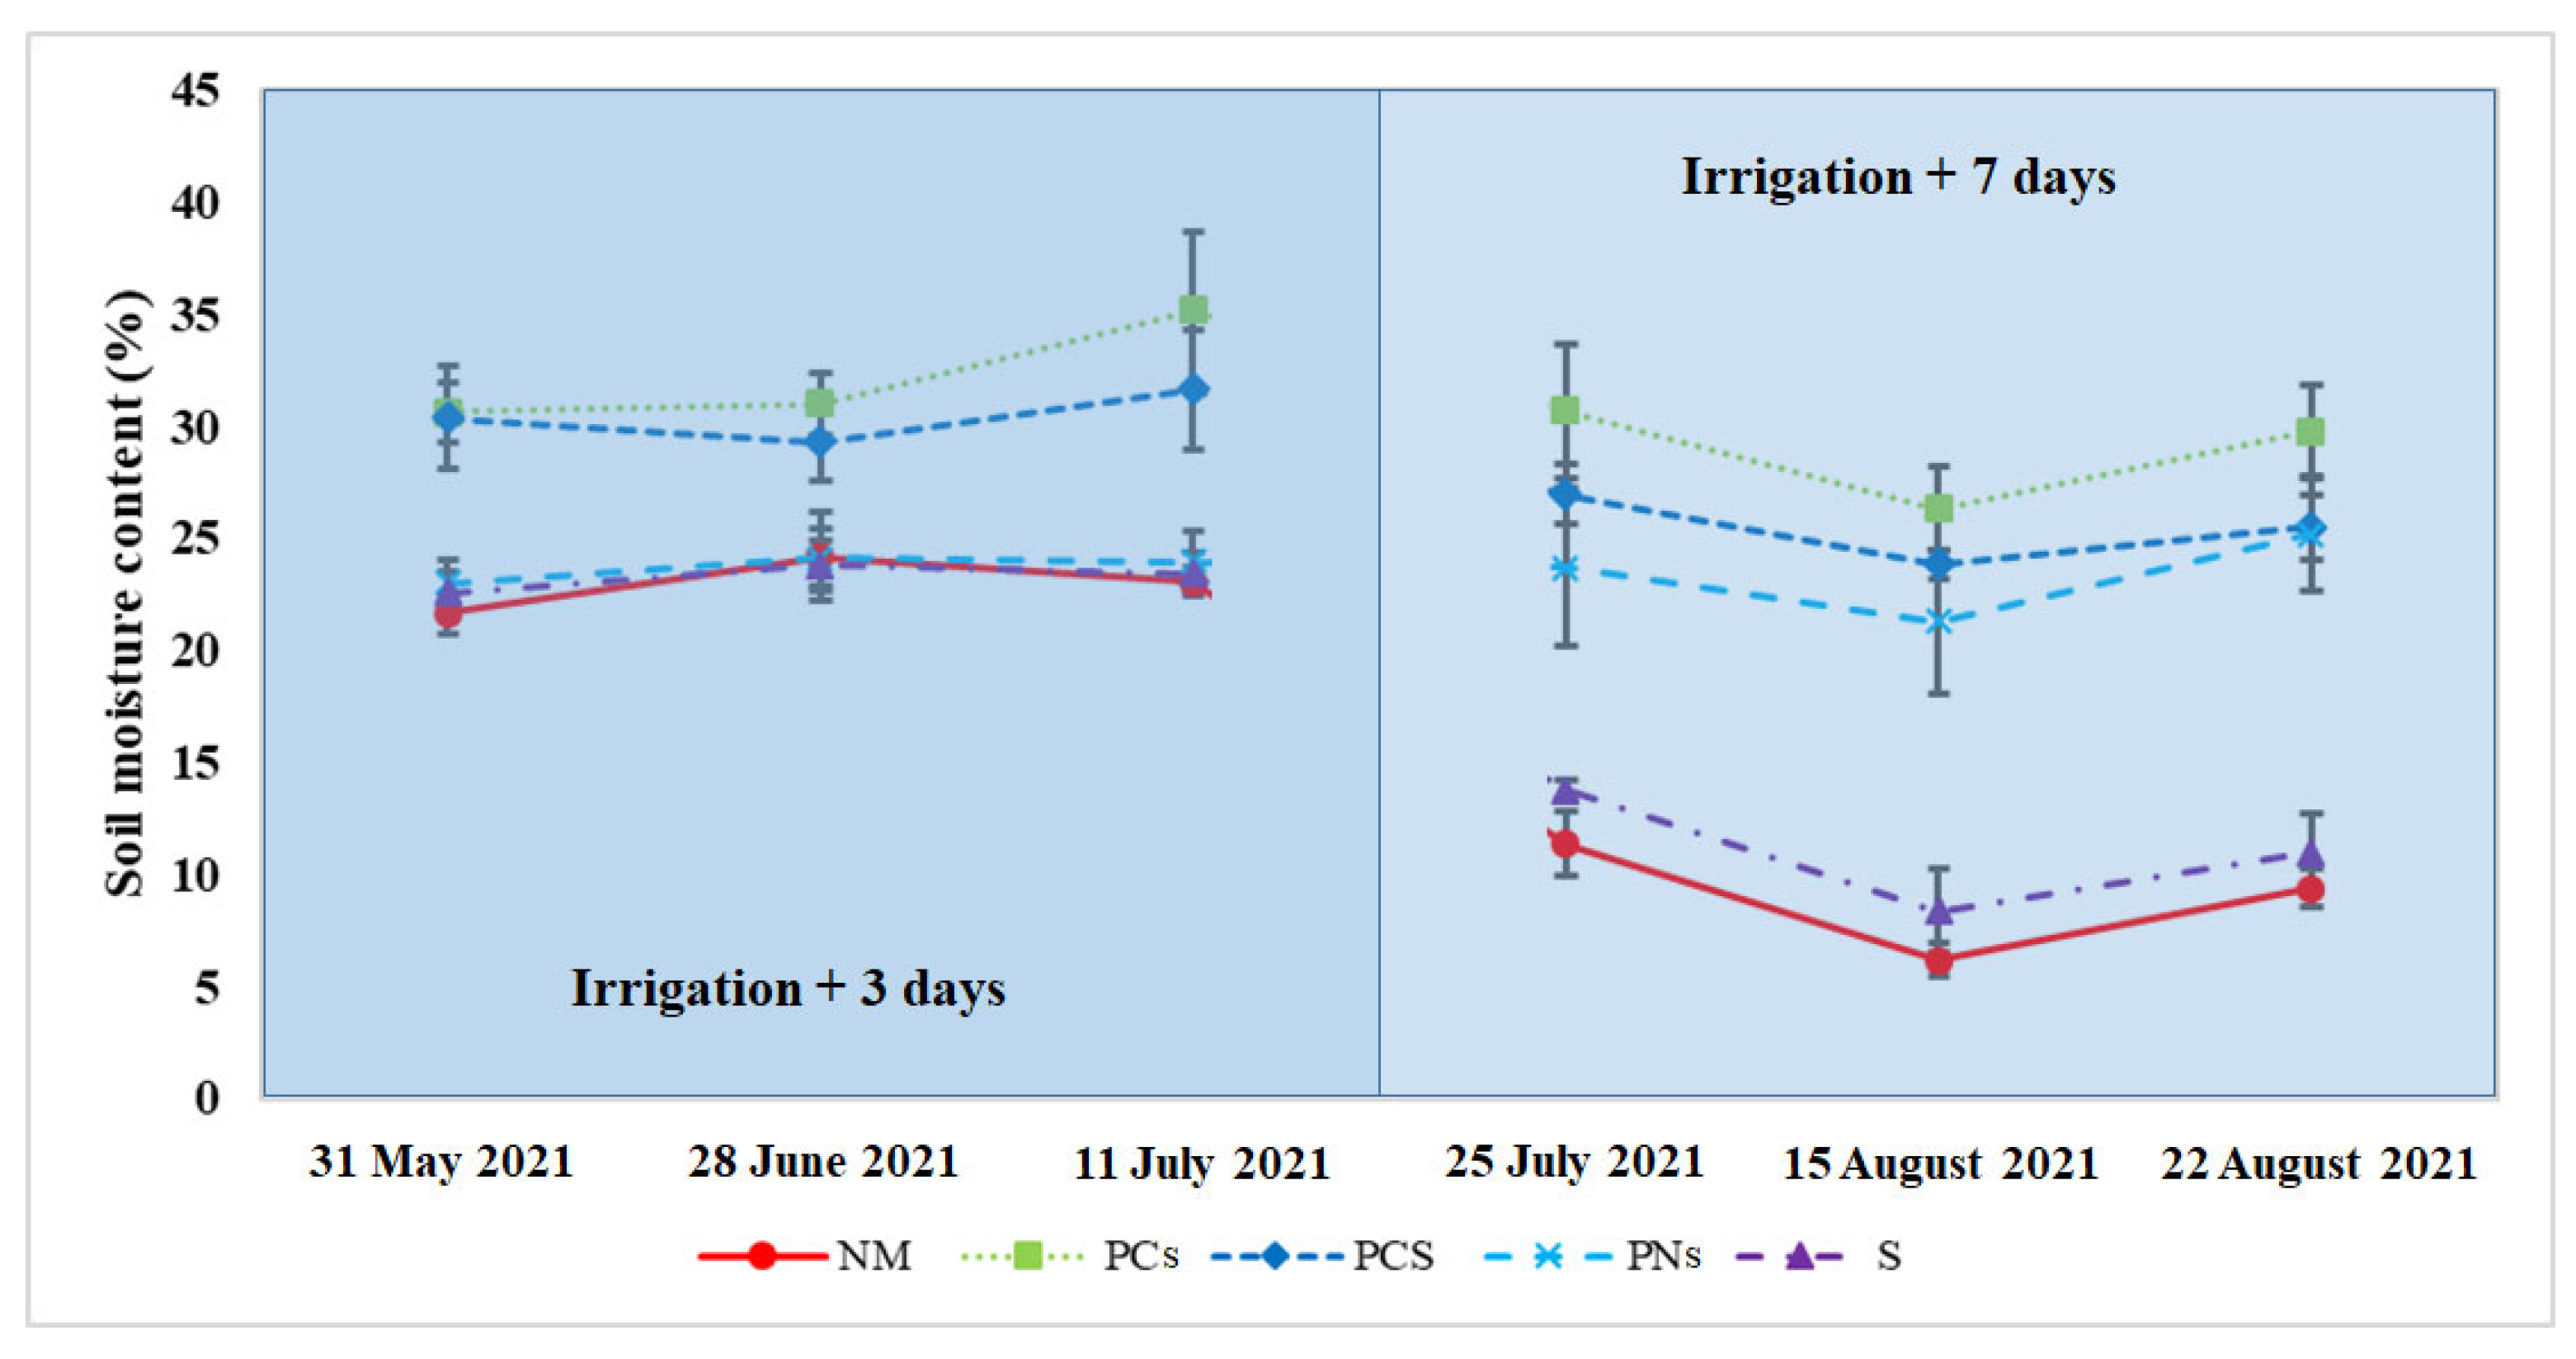
3.1. Soil Characteristics

The analysis of soil characteristics among different mulching treatments is presented in Figure 4 and Table 3. Three days after irrigation, the SMC ranged from 29.33% to 35.20% in the PC and PCS treatments, and from 21.64% to 24.19% in the PN, S, and NM treatments. However, seven days after irrigation, the SMC showed variations across treatments, ranging from 21.27% to 30.69% in the PC, PCS, and PN treatments, and from 6.18% to 13.75% in the S and NM treatments. The PN treatment showed differences compared to the crushed pinecone treatments (PCs and PCS) three days after irrigation, whereas seven days after irrigation, it exhibited differences compared to the non-pinecone-treated treatments (S and NM).
After 6 months of mulching, the soil pH decreased in all treatments except for the NM treatment, as shown in Table 3. The soil acidity level ranked in the order of S, PCS, PNs, PCs, and NM, with the most substantial pH reduction seen in the S treatment. OM (%), available P2O5 (mg/kg), TN (mg/g), and NO3-N (mg/g) showed the highest values in the PC treatment. On the other hand, the NM treatment showed the highest value for NH4+-N (mg/g). The PCS treatment showed elevated values for available P2O5 (mg/kg) and TN (mg/g) following the PC treatment, yet showed the lowest value for NO3-N (mg/g). Compared to the PC and PCS treatments, the PN treatment had relatively lower values. Among the exchangeable cations, K+ (cmol/kg) notably showed higher values in the PC and PCS treatments compared to the other treatments. In contrast, Ca2+ (cmol/kg) showed an opposing trend. Na+ (cmol/kg) had the highest value in the NM treatment, while Mg2+ (cmol/kg) showed the highest value in the PC treatment.

3.2. Leaf Growth and Physiological Characteristics

Parameters indicating leaf growth, such as LW and LL, showed notable increments in the PCS, PN, and PC treatments (Table 4). In contrast, the NM and S treatments exhibited lower growth compared to other organic mulching treatments (PCs, PCS, and PNs). The SPAD value showed the highest value in the PC treatment. The values of Fo and Fm were highest in the S treatment. The PC, PCS, and S treatments showed the highest Fv/Fm, followed by the PN treatment, while the NM treatment showed the lowest values. The PCS treatment showed the lowest ABS/RC and DIo/RC, indicating high photosynthetic capabilities in the PCS treatment. The gs showed high values in the organic mulching treatments (PCs, PCS, and PNs) while showing low values in the non-mulching treatments (NM and S). The organic mulching treatments were provided with a favorable environment for growth. However, based on these results, it was challenging to identify the most effective treatment among the organic mulching treatments.

3.3. Vegetation Indices with the Hyperspectral Measurement

Generally, when the MCARI, PRI, and MSI values are reduced, it indicates that the plant conditions have improved (Table 5). The PC treatment showed good conditions in Vis related to water status (MSI, NDWI, and DWSI) and soil moisture (NSMI). Furthermore, the PC treatment showed the best results in NDVI and SAVI related to chlorophyll content. The PCS treatment was superior in VIs associated with chlorophyll and carotenoid content (MCARI and PRI). Remarkably, in the case of the PC treatment, the highest soil SMC was consistently maintained (Figure 4), which corresponded with VIs indicating soil moisture. The PN treatment showed lower VIs compared to the PC and PCS treatments, but showed higher VIs compared to the NM and S treatments. Compared to leaf growth and physiological characteristics, it was possible to observe through VIs that certain attributes improved depending on the presence or absence of sulfur treatment in the crushed pinecone treatment.

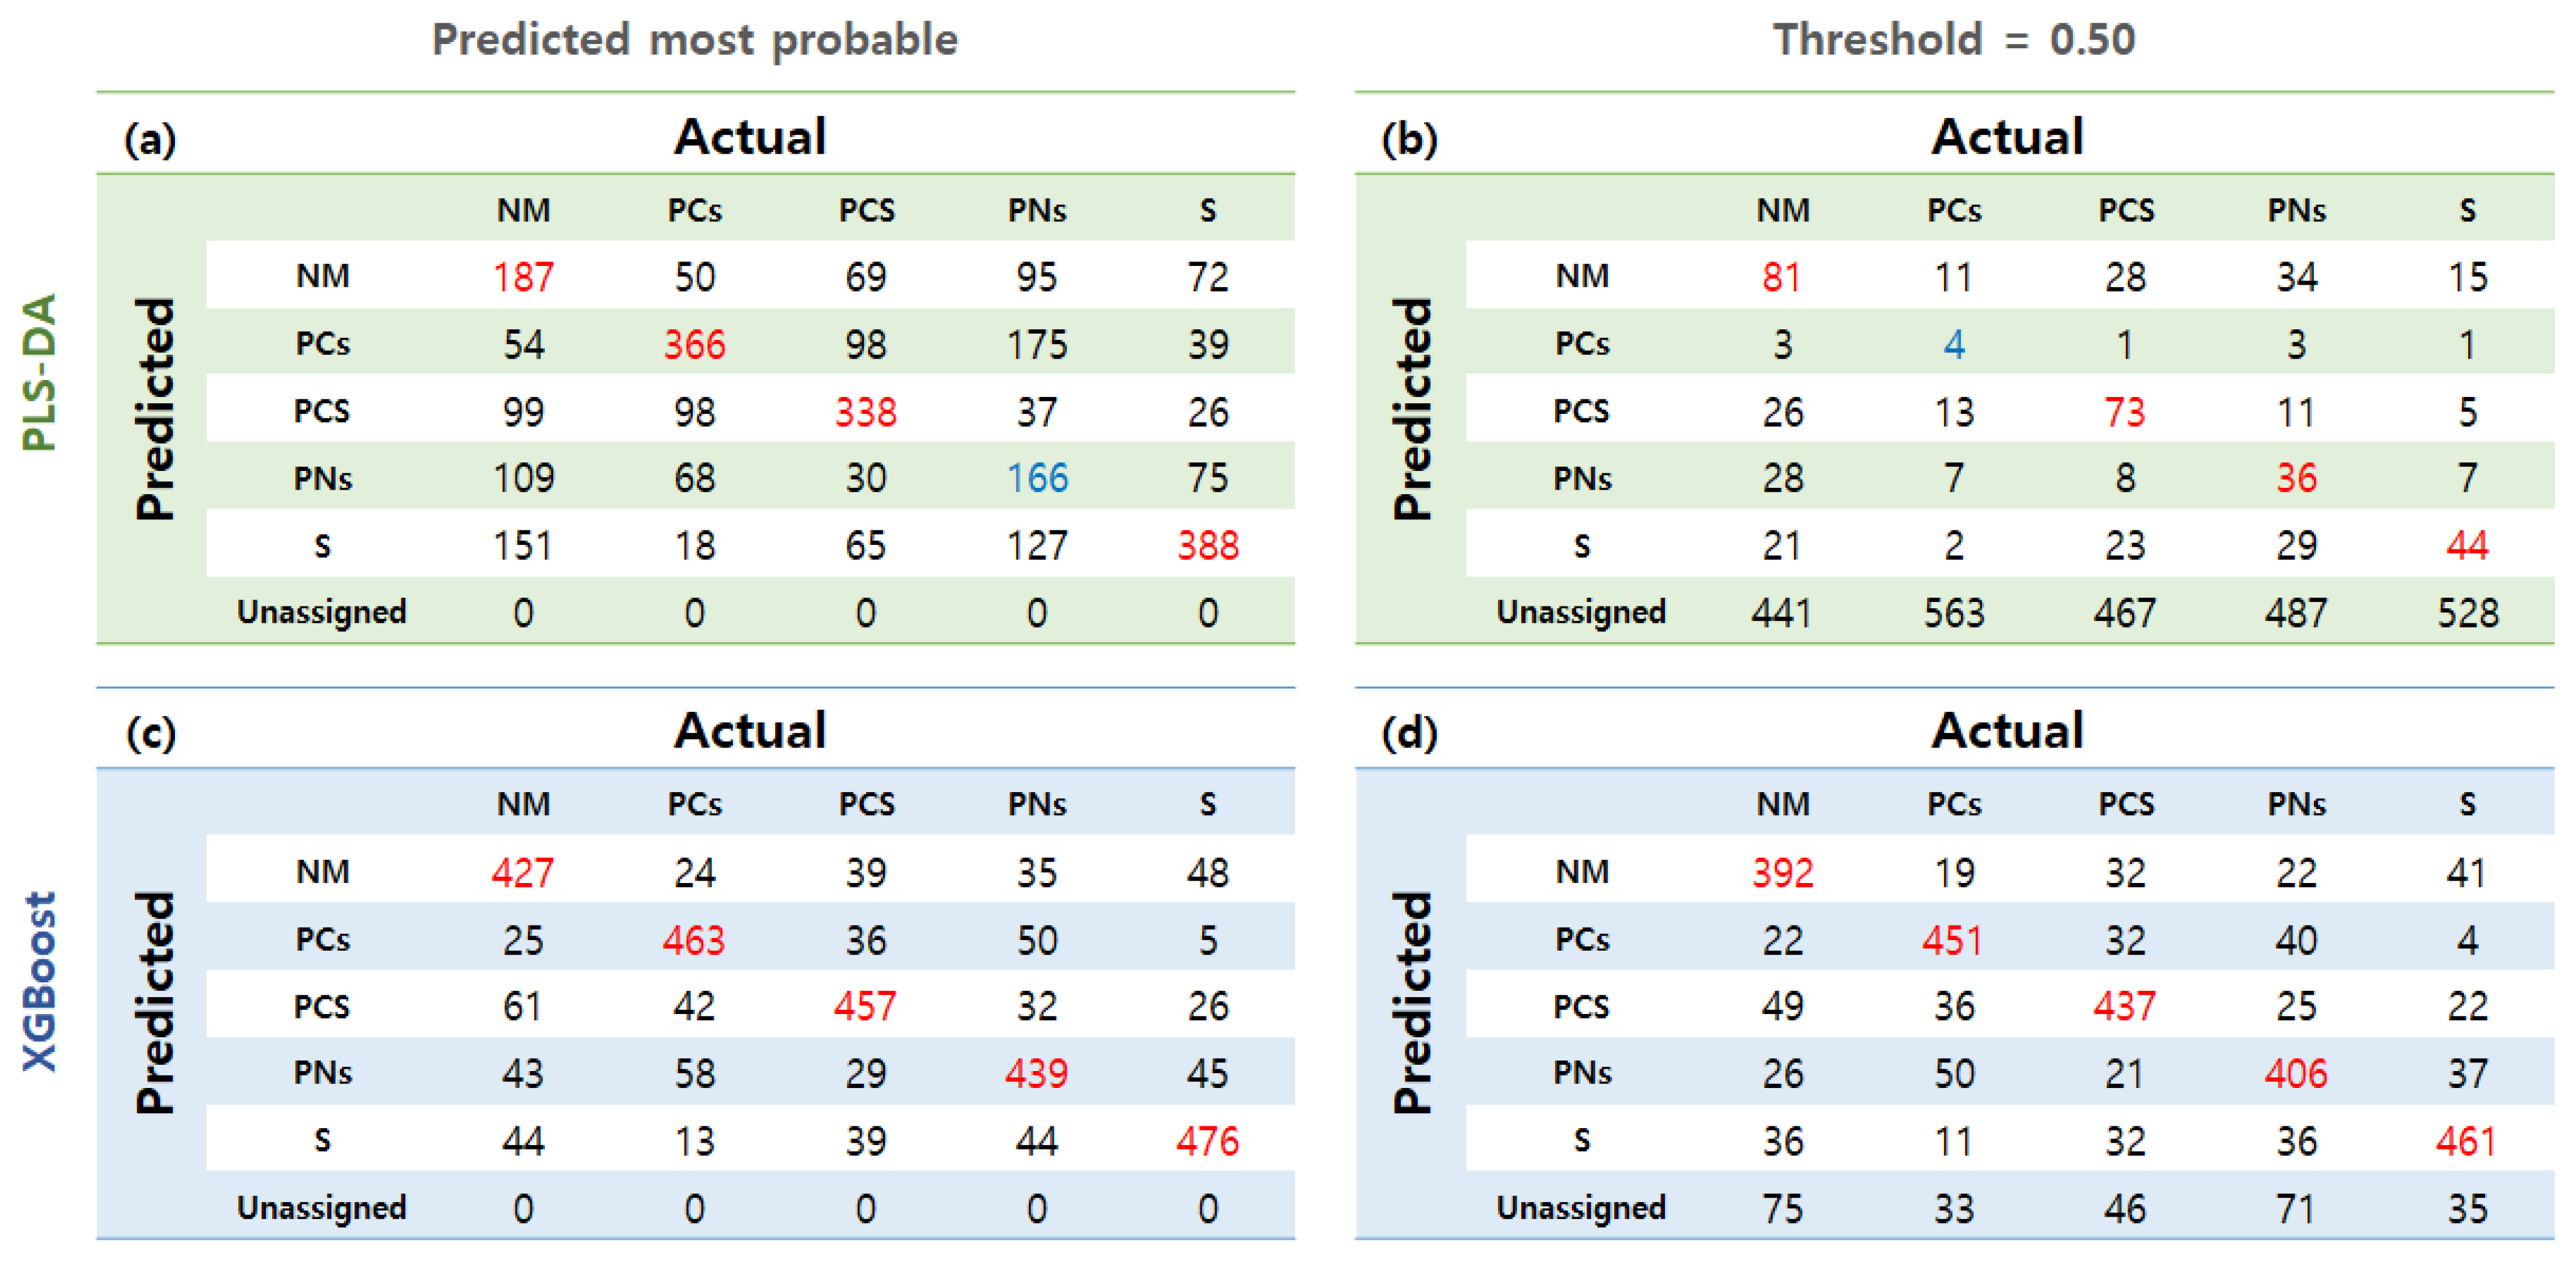
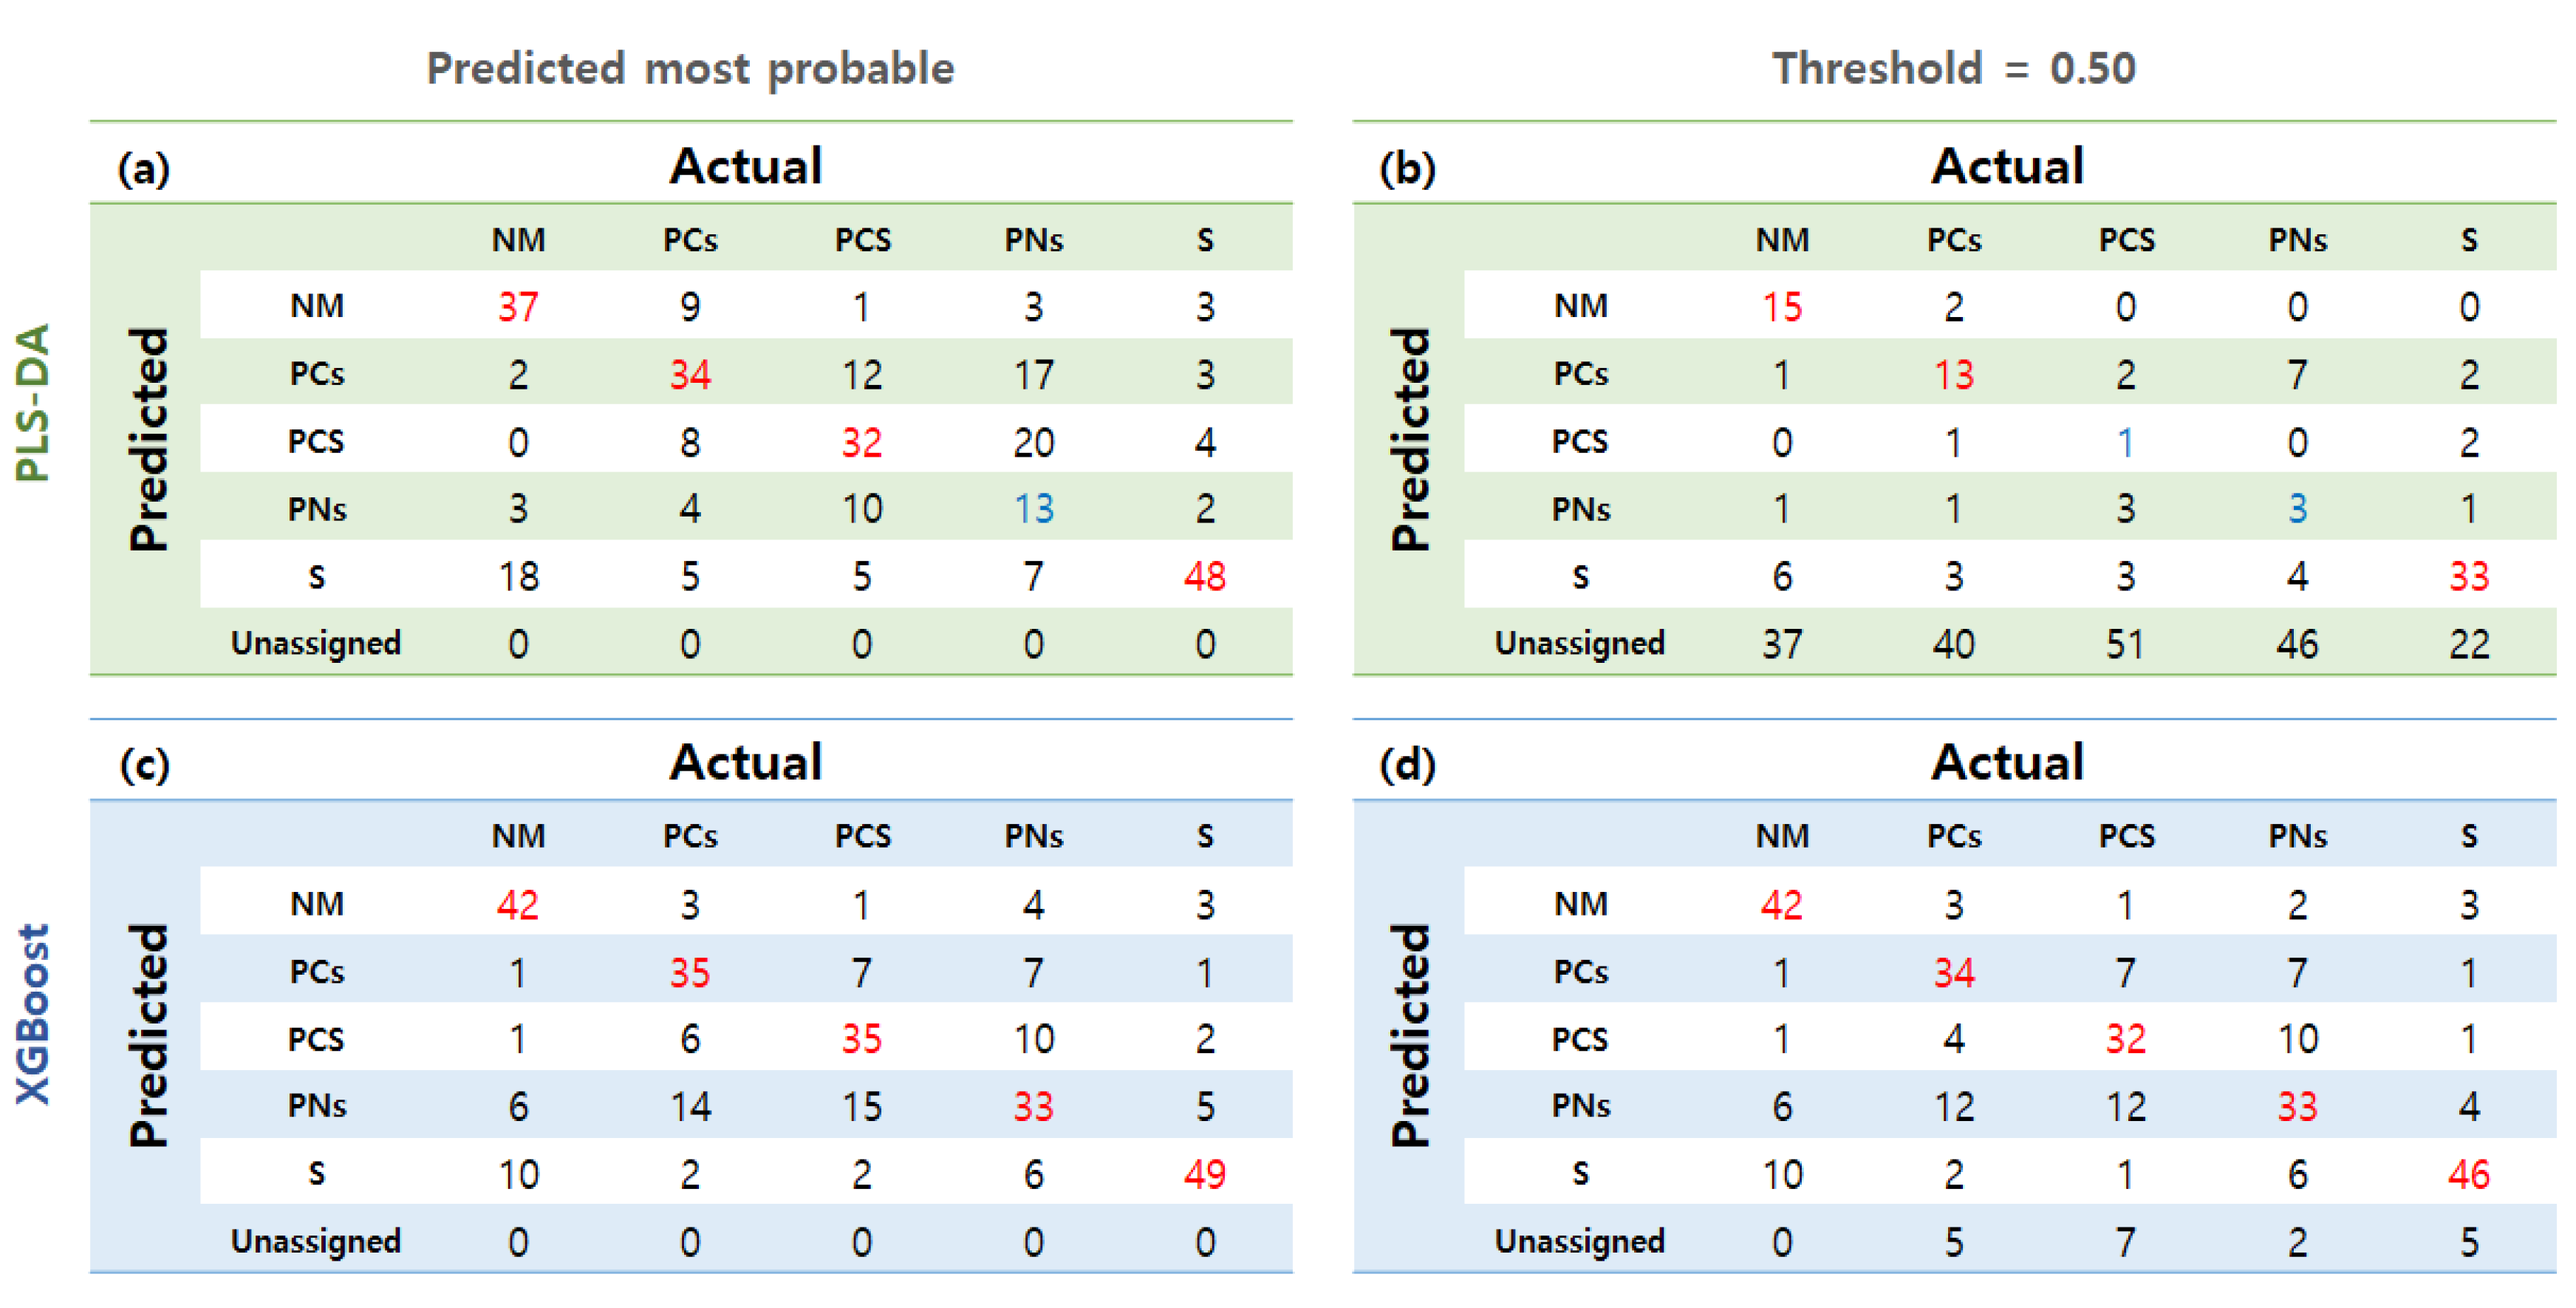
3.4. Classification Modeling with Leaf Growth and Physiological Data

In the PLS-DA model, parameters with VIP scores > 1 were LL, LW, and gs (Table 6). In contrast, the XGBoost model showed higher variable scores in the order of gs, SPAD, and ABS/RC, with LL and LW showing relatively lower rankings. This was evidenced by the superiority of the PCS treatment in leaf growth but not being a major parameter in selecting the superior treatment in XGBoost (Table 4).
In both the PLS-DA and XGBoost models, it was observed that the accuracy of the model was higher in the treatments (S and NM) without organic mulching compared to those with organic mulching (PCs, PCS, and PNs). Among them, the S treatment exhibited the highest accuracy, while the PN treatment showed the lowest. The lower performance in leaf growth and physiology in treatments without organic mulching had a greater impact on the classification performance of the treatments (Table 4).
In the PLS-DA P.M.P model, similar to the accuracy trends, treatments without organic mulching (S and NM) were well classified (Figure 5). The PN treatment was classified poorly as third in order. In the PLS-DA Thres: 0.5 model, overall unassigned outcomes were observed. Along with the PN treatment, the PCS treatment was also poorly classified. This indicates that the PN treatment did not exhibit a distinct mulching effect compared to the other mulch treatments. Meanwhile, the XGBoost model successfully classified all treatments. Both the XGBoost P.M.P model and Thres: 0.5 model exhibited a tendency for well-classified treatment without organic mulching.

3.5. Classification Modeling with VI Data

The PRI and NSMI had VIP scores > 1 in the PLS-DA model (Table 6). The XGBoost model exhibited highly variable scores in the order of PRI, MCARI, and NSMI, similar to the PLS-DA model. In the PLS-DA P.M.P model, the NM treatment showed an accuracy of around 0.5, along with the PN treatment (Table 7). In the PLS-DA Thres: 0.5 model, all treatments exhibited an accuracy of around 0.5. In contrast, the XGBoost model showed an accuracy of over 0.8 for all treatments. The PLS-DA P.M.P model yielded similar results to the leaf growth and physiology data-based model, with the PN treatment poorly classified (Figure 6). Additionally, the NM treatment was classified lower compared to the PC and PCS treatments. This suggests that a distinct mulching effect is observed when treated with crushed pinecones or sulfur, comparatively. However, in the PLS-DA Thres: 0.5 model, the PC treatment was poorly classified. It was challenging to find a consistent classification trend between the PLS-DA P.M.P model and the Thres: 0.5 model. In contrast, the XGBoost model exhibited similar performance to the leaf growth and physiology data-based model, with all treatments being well classified.

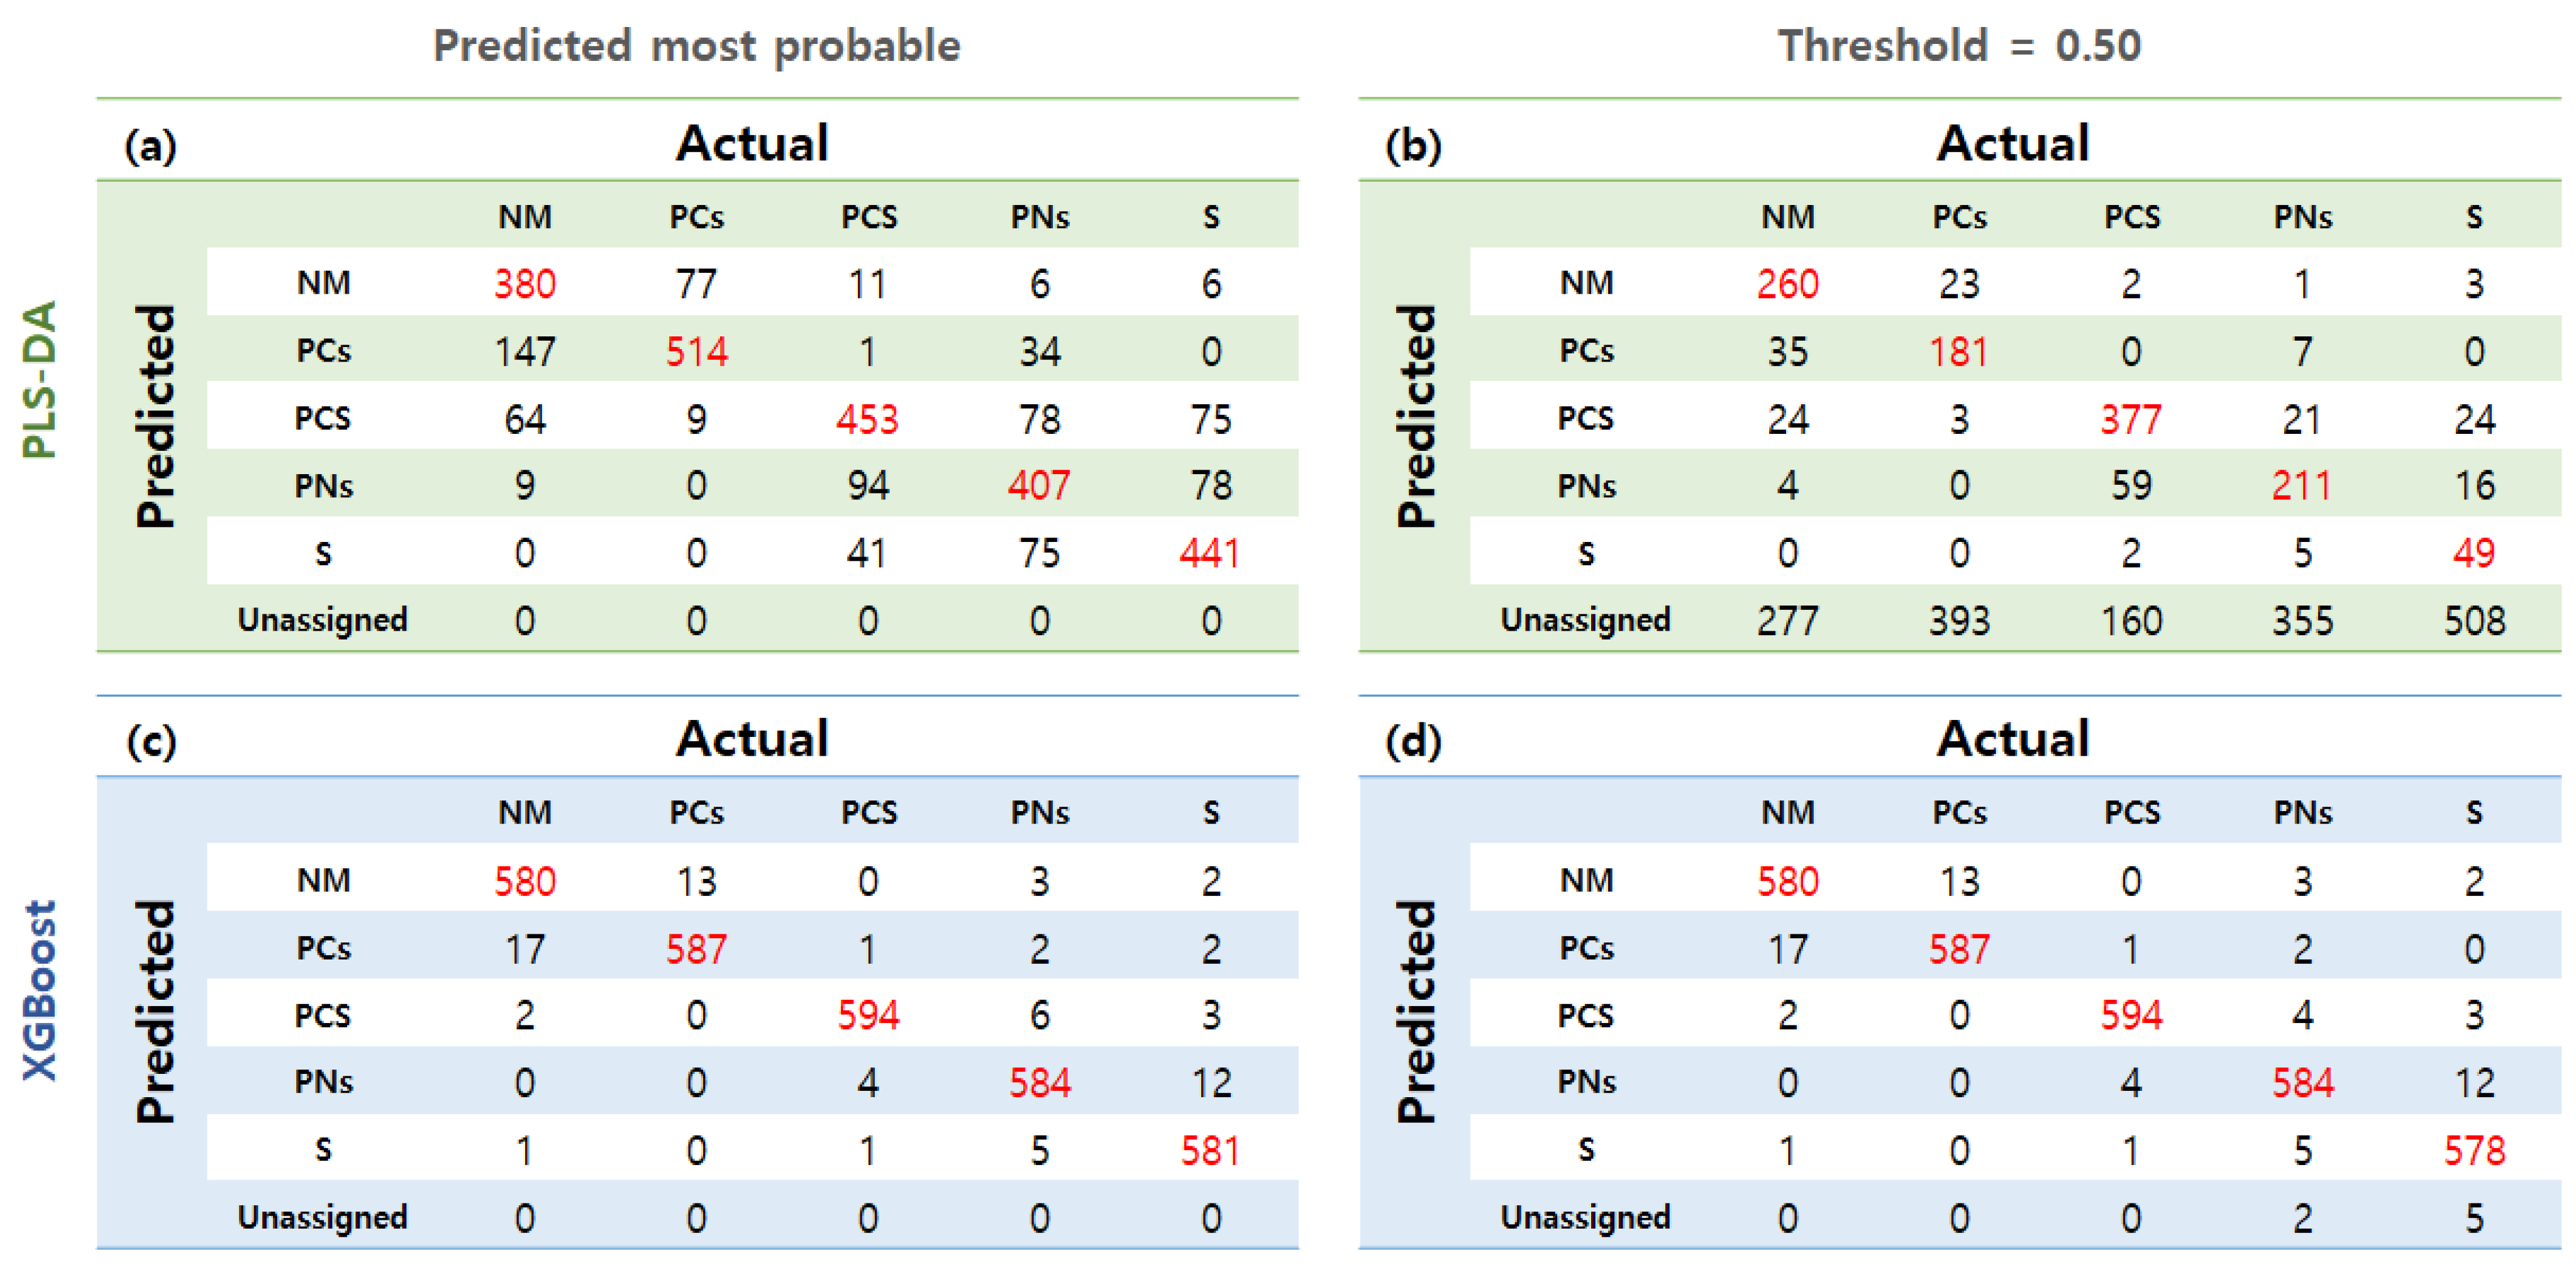
3.6. Classification Modeling with Full VNIR and SWIR Spectrum Data

In the PLS-DA model, VNIR wavelengths showing VIP scores > 1 were 675 nm, 553 nm, 527 nm, 737 nm, and 783 nm (Table 6). The XGBoost model showed highly variable scores in the order of 827 nm, 690 nm, 784 nm, 514 nm, and 749 nm. In contrast to both leaf growth and physiology-based (Figure 5) and VI data-based (Figure 6) models, the PLS-DA model showed the highest number of correctly classified samples for each treatment (Figure 7). This suggests that the influence of characteristics among individuals is more reflected than that of treatments.
In the PLS-DA model, SWIR wavelengths showing VIP scores > 1 were 1401 nm, 1935 nm, and 1660 nm (Table 6). The XGBoost model showed highly variable scores in the order of 1875 nm, 2106 nm, and 1455 nm. Overall, the PC treatment demonstrated the highest classification performance in the PLS-DA model (Figure 8). Despite being well-classified in other models, the PCS treatment could not be classified well. The PN treatment showed a lower classification than the PC treatment. The treatments without organic mulching were unable to be classified in the PLS-DA Thres: 0.5 model. The SWIR was capable of effectively classifying the positive effects resulting from PC treatment (Table 4). Additionally, despite exhibiting favorable growth and physiological characteristics, the PCS treatment demonstrated that PC treatment without sulfur could be superior due to the SWIR feature. On the other hand, XGBoost, as a classification model technique, faced challenges in selecting or ranking the most effective treatments.

4. Discussion

The results indicated that crushed pinecone mulching played a dual role in aiding plant growth by lowering soil pH and maintaining soil moisture. Albert et al. [53] reported that peat and plastic mulch maintained a soil pH of 5.9 after seven years of application. In our study, mulching with crushed pinecones accelerated the decrease in pH levels, suggesting its potential for soil acidification. Notably, higher concentrations of available P2O5 and K+ were observed, which can be attributed to their positive influence on blueberry growth [10]. Ahn et al. [41] observed that pine needle mulching led to an increase in OM content, a trend that aligns with our study, where the PC treatment resulted in the highest OM content. Meanwhile, Burkhard et al. [13] reported that pine needle mulching was more beneficial for weed suppression than nutrient availability. In the case of NH4+, blueberries prefer and absorb mainly inorganic nitrogen [54]. Although the TN content was found to be high in soil mulched with pinecones, a soil environment rich in inorganic nitrogen was not created during the experimental period. Inorganic nitrogen was expected to gradually emerge over the long term as the crushed pinecones decomposed further.
Mulching treatment is reported to contribute to maintaining soil moisture and enhancing soil nutrients, thereby resulting in an increased leaf area [23,55,56]. This was similar to the NM and S treatments without mulching, which showed the lowest values. Organic mulching has been shown to contribute effectively to the increase in SPAD values compared to non-mulching with the increase in soil nitrogen (TN content) [55,57,58,59]. The increase in SPAD values can have an impact on the enhancement of photosynthetic capacity, leading to an improvement in chlorophyll fluorescence (increase in Fv/Fm) [60,61]. Jiang et al. [62] observed that in the ‘Chaoyue No. 1’ variety at pH 5.3, the S treatment exhibited the same Fv/Fm, while, significantly, the highest values were recorded at pH 4.5. Furthermore, a high-pH (pH 6) soil environment has been shown to induce long-term stress in blueberries, emphasizing the importance of soil pH management for lowering stress [63].
Organic mulching can enhance soil water absorption and nutrient utilization efficiency by promoting the micro-aggregation of soil particles [64]. These effects contribute to increased gas exchange capacity (gs) in the leaves, resulting in a higher rate of CO2 assimilation for photosynthesis [65]. Based on the modeling of leaf growth and physiological data, the integrated results of the PLS-DA and XGBoost models identified gs as the key parameter that influenced the classification performance of the model. The S and NM treatments, which did not involve organic mulching, were easily classified compared to treatments with organic mulching (PCs, PCS, and PNs). This suggests that the negative effects associated with the absence of mulching were evident (Table 4 and Figure 5). Furthermore, the PCS treatment was not well classified in the PLS-DA Thres: 0.5 model. This can be attributed to the more prominent positive effects of the PC treatment rather than the negative effects of the additional sulfur.
VIs have proven to be more effective than leaf growth and physiological characteristics in selecting superior treatments (Table 5 and Figure 6). Oliveira et al. [66] reported decreased water consumption in Italian zucchini (Cucurbita pepo L.) when mulched with recycled paper. They demonstrated the utility of VIs by showing a positive/strong R2 = 0.73 relationship between the crop coefficient and the NDVI. In this study, the VI data-based model showed that the PRI and NSMI were significant parameters for distinguishing between mulching treatments. In particular, the PRI achieved the most influential parameters through the integrated results of both the PLS-DA and XGBoost models. Kovar et al. [67] reported the PRI as a useful index for non-destructively measuring soybean leaf water content. However, in the PLS-DA model, there was no consistent trend among organic mulching treatments (PCs, PCS, and PNs) based on the threshold, suggesting the need for further investigation.
From the VNIR data collection, significant wavelengths were identified for mulching treatment classification within the red spectral range (675 nm, 690 nm, 737 nm, and 749 nm) and the green spectral range (514 nm, 527 nm, and 553 nm). Wavelengths at 675 nm and 550 nm are known to be sensitive to chlorophyll content and related to nitrogen availability [68]. Wavelengths in the range of 500–550 nm are indicative of xanthophylls (related to photosynthetic efficiency), while wavelengths at 610–620 nm and 700–710 nm (associated only with chlorophyll absorption) are related to nutrient status and phenology. Meanwhile, it is observed that NIR reflectance tends to increase as plants undergo less water stress [69]. This trend was also evident in our study, confirmed through the 827 nm wavelength within the NIR range. However, due to its outstanding classification performance across all treatments, it was challenging to identify the most superior treatment (Figure 7). The VNIR characteristics were more sensitive to leaf color than to compositional elements, thus reflecting individual tendencies among seedlings rather than treatments.
The selected wavelengths of SWIR data were associated with features such as the C-H combination (CH2) (1395 nm), the O-H first overtone (ROH) (1410 nm), the O-H stretch first overtone (starch, H2O) and the C=O stretch third overtone (C=O) (1450 nm), the C-C1 stretch sixth overtone (C-C1) (1860 nm), the O-H stretch/HOH deformation combination (starch, cellulose) (1930 nm), the O-H bend second overtone (H2O) (1940 nm), and the O-H bend/C-O stretch combination (starch) (2100 nm) [70]. In the PLS-DA model, the mulching effects between the PC and PCS treatments were clearly classified. In particular, in the Thres: 0.5 model, while the PC treatment was well predicted, the PCS treatment was not predicted at all, likely due to the positive effects of mulching (Figure 8). It is reported that sulfur treatment reduces soil moisture in the topsoil layer [71]. Therefore, under planned management, it may be unnecessary to mix sulfur.
The XGBoost model encountered difficulties identifying superior treatments between the PC and PCS treatments. Unexpectedly, the classification performance of the models in this study proved challenging for treatment discrimination. Therefore, to classify the mulching effect, it is considered necessary to compare at least two models and apply a simpler classification model. Considering this, using previous algorithm models such as k-nearest neighbor (KNN) or support vector machines (SVMs) is considered one way to properly classify treatments [72]. Additionally, there is a need to explore the discriminative capabilities of machine learning, with a focus on distinguishing mulching effects among treatments based on threshold strength.
In this study, the spectral data obtained through contact-based methods allowed for rapid and bulk data collection compared to conventional physiological measurement methods. In the future, there is a need to utilize non-contact methods such as hyperspectral imaging to improve and support blueberry cultivation [73,74,75,76]. Currently, the high cost and difficulty in portability of equipment present limitations, and individual measurements in the field are challenging. Nevertheless, various studies are underway to address these limitations, and it is anticipated that contact-based hyperspectral data will be valuable for validating such advancements in the future [77].
Overall, this study suggests that water status (plant respiration) is a key factor influencing blueberry growth, and mulching with crushed pinecones offers promising effects [78]. Alongside physiological data, SWIR-based PLS-DA models demonstrated significant potential in advancing plant growth assessment techniques. We provided foundational data on the initial growth effects through pot experiments, minimizing external factors in the soil environment. Anticipating that this will offer directional insights into early management practices, we underscore the necessity of long-term field studies to assess the durability and adaptability of the observed effects in real-world cultivation scenarios.

5. Conclusions

Crushed pinecone mulching showed positive effects, suggesting its potential as a sustainable strategy for blueberry cultivation, even without supplemental sulfur. The soil pH could be decreased. The soil nutrient content also exhibited the most favorable conditions in the PC treatment. Leaf growth was optimal in the PCS treatment; the SPAD value was highest in the PC treatment; chlorophyll fluorescence (Fv/Fm) was best in the PC, PCS, and S treatments; and the gs was superior in the PC, PN, and PCS treatments. The ANOVA results of leaf growth and physiology presented challenges in selecting the most superior treatment, but this was identified through the application of classification models and hyperspectral data. The combined results of the PLS-DA and XGBoost models indicated that gs is the key parameter that exerts the most significant influence on treatment classification in physiological parameters. The PRI has emerged as one of the key parameters among VIs. While ordinarily associated with photosynthetic activity and efficiency, the PRI has been found to be a contender for measuring water stress as well. In particular, the model that effectively classified the positive mulching effect of the PC treatment was PLS-DA, with a notable contribution from the SWIR within the hyperspectral reflectance. Even within the SWIR region, it was observed that wavelengths predominantly associated with O-H overtone have an impact. As a result, crushed pinecone mulching was observed to positively affect the initial growth of blueberries by enhancing water status (plant respiration). This will alleviate growth inhibition caused by water stress, enabling the production of higher-quality blueberry produce. While contributing fundamental data and valuable insights, we also emphasize the importance of long-term field studies.

Supplementary Materials

The following supporting information can be downloaded at https://www.mdpi.com/article/10.3390/agronomy14040785/s1: Figure S1: Spectra preprocessing before and after; Table S1: The evaluation results of the classification model of leaf growth and physiology; Table S2: The evaluation results of the classification model of Vis; Table S3: The evaluation results of the classification model of VNIR; Table S4: The evaluation results of the classification model of SWIR.

Author Contributions

Conceptualization, U.J. and E.J.C.; methodology, U.J.; validation, U.J., T.J. and E.J.C.; formal analysis, U.J.; investigation, U.J. and T.J.; resources, D.K.; data curation, U.J. and T.J.; writing—original draft preparation, U.J.; writing—review and editing, U.J. and E.J.C.; visualization, D.K.; supervision, U.J. and E.J.C.; project administration, U.J. and E.J.C. All authors have read and agreed to the published version of the manuscript.

Funding

This research received no external funding.

Data Availability Statement

The data presented in this study are available upon request from the corresponding authors.

Acknowledgments

Sincere thanks to the editors and reviewers for their valuable advice, which has enhanced the quality of this manuscript.

Conflicts of Interest

The authors declare no conflicts of interest.

References

  1. Connor, A.M.; Luby, J.J.; Tong, C.B. Variation and heritability estimates for antioxidant activity, total phenolic content, and anthocyanin content in blueberry progenies. J. Am. Soc. Hortic. Sci. 2002, 127, 82–88. [Google Scholar] [CrossRef]
  2. Burdulis, D.; Sarkinas, A.; Jasutiene, I.; Stackevicené, E.; Nikolajevas, L.; Janulis, V. Comparative study of anthocyanin composition, antimicrobial and antioxidant activity in bilberry (Vaccinium myrtillus L.) and blueberry (Vaccinium corymbosum L.) fruits. Acta Pol. Pharm. 2009, 66, 399–408. [Google Scholar] [PubMed]
  3. Kalt, W.; Cassidy, A.; Howard, L.R.; Krikorian, R.; Stull, A.J.; Tremblay, F.; Zamora-Ros, R. Recent research on the health benefits of blueberries and their anthocyanins. Adv. Nutr. 2020, 11, 224–236. [Google Scholar] [CrossRef] [PubMed]
  4. Routray, W.; Orsat, V. MAE of phenolic compounds from blueberry leaves and comparison with other extraction methods. Ind. Crops Prod. 2014, 58, 36–45. [Google Scholar] [CrossRef]
  5. Debnath-Canning, M.; Unruh, S.; Vyas, P.; Daneshtalab, N.; Igamberdiev, A.U.; Weber, J.T. Fruits and leaves from wild blueberry plants contain diverse polyphenols and decrease neuroinflammatory responses in microglia. J. Funct. Foods 2020, 68, 103906. [Google Scholar] [CrossRef]
  6. Ștefănescu, B.E.; Călinoiu, L.F.; Ranga, F.; Fetea, F.; Mocan, A.; Vodnar, D.C.; Crișan, G. The chemical and biological profiles of leaves from commercial blueberry varieties. Plants 2020, 9, 1193. [Google Scholar] [CrossRef]
  7. Hernandez-Santana, V.; Perez-Arcoiza, A.; Gomez-Jimenez, M.C.; Diaz-Espejo, A. Disentangling the link between leaf photosynthesis and turgor in fruit growth. Plant J. 2021, 107, 1788–1801. [Google Scholar] [CrossRef]
  8. Medyouni, I.; Zouaoui, R.; Rubio, E.; Serino, S.; Ahmed, H.B.; Bertin, N. Effects of water deficit on leaves and fruit quality during the development period in tomato plant. Food Sci. Nutr. 2021, 9, 1949–1960. [Google Scholar] [CrossRef]
  9. Parkash, V.; Singh, S.; Deb, S.K.; Ritchie, G.L.; Wallace, R.W. Effect of deficit irrigation on physiology, plant growth, and fruit yield of cucumber cultivars. Plant Stress 2021, 1, 100004. [Google Scholar] [CrossRef]
  10. Retamales, J.B.; Hancock, J.F. Blueberries, 2nd ed.; CABI: Boston, MA, USA, 2018. [Google Scholar]
  11. Acharya, C.L.; Kapur, O.C. Using organic wastes as compost and mulch for potato (Solanum tuberosum) in low water-retaining hill soils of north-west India. Indian J. Agric. Sci. 2001, 71, 306–509. [Google Scholar]
  12. Pande, K.K.; Dimri, D.C.; Kamboj, P. Effect of various mulches on growth, yield and quality attributes of apple. Indian J. Hortic. 2005, 62, 145–147. [Google Scholar]
  13. Burkhard, N.; Lynch, D.; Percival, D.; Sharifi, M. Organic mulch impact on vegetation dynamics and productivity of highbush blueberry under organic production. HortScience 2009, 44, 688–696. [Google Scholar] [CrossRef]
  14. Goel, L.; Shankar, V.; Sharma, R. Effect of organic mulches on agronomic parameters–A case study of tomato crop (Lycopersicon esculentum Mill.). Int. J. Recycl. Org. Waste Agric. 2020, 9, 297–307. [Google Scholar]
  15. Lee, J.H.; Kim, K.S.; Shin, S.O.; Cho, J.H.; Chen, Y.J.; Kim, I.H. Effects of Dietary Pine Cone Meal on Egg Production, Egg Quality, Serum Cholesterol and Cholesterol Content and Fatty Acid Composition of Egg Yolk in Laying Hens. Korean J. Poult. 2007, 34, 223–229. (In Korean) [Google Scholar] [CrossRef]
  16. Lee, J.H.; Park, K.W.; Shin, S.O.; Cho, J.H.; Chen, Y.J.; Kim, I.H. Effects of Dietary Pine Cone Meal on Growth Performance, Blood Characteristics, Carcass Quality and Fecal Noxious Gases Compounds in Finishing Pigs. J. Anim. Sci. Technol. 2007, 49, 761–772. (In Korean) [Google Scholar]
  17. Lee, J.H.; Yang, H.Y.; Lee, H.S.; Hong, S.K. Chemical composition and antimicrobial activity of essential oil from cones of Pinus koraiensis. J. Microbiol. Biotechnol. 2008, 18, 497–502. [Google Scholar]
  18. Ofomaja, A.E.; Naidoo, E.B. Biosorption of copper from aqueous solution by chemically activated pine cone: A kinetic study. J. Chem. Eng. 2011, 175, 260–270. [Google Scholar] [CrossRef]
  19. Bello, A.; Manyala, N.; Barzegar, F.; Khaleed, A.A.; Momodu, D.Y.; Dangbegnon, J.K. Renewable pine cone biomass derived carbon materials for supercapacitor application. RSC Adv. 2016, 6, 1800–1809. [Google Scholar] [CrossRef]
  20. Zhang, H.; Zou, P.; Zhao, H.; Qiu, J.; Mac Regenstein, J.; Yang, X. Isolation, purification, structure and antioxidant activity of polysaccharide from pinecones of Pinus koraiensis. Carbohydr. Polym. 2021, 251, 117078. [Google Scholar] [CrossRef] [PubMed]
  21. Larco, H.; Strik, B.C.; Bryla, D.R.; Sullivan, D.M. Mulch and fertilizer management practices for organic production of highbush blueberry. I: Plant growth and allocation of biomass during establishment. HortScience 2013, 48, 1250–1261. [Google Scholar] [CrossRef]
  22. Han, G.D.; Jung, D.H.; Heo, S.; Chung, Y.S. SPAD value difference between blueberry cultivar ‘STAR’ by planted ground and pot. Phyton 2022, 91, 2583. [Google Scholar]
  23. Retamal-Salgado, J.; Loor, B.; Hirzel, J.; López, M.D.; Undurraga, P.; Zapata, N.; Vergara-Retamales, R.; Olivares-Soto, H. Chlorophyll fluorescence and fruit quality response of blueberry to different mulches. Agronomy 2022, 12, 1702. [Google Scholar] [CrossRef]
  24. Calderón-Orellana, A.; Hermosilla, N.; Bastías, R.M. Impact of the Covering Material on Drought Tolerance Responses and Soil Water Content in Two Cultivars of Young Blueberry Plants under Protected Cultivation. Water 2023, 15, 2326. [Google Scholar] [CrossRef]
  25. Markwell, J.; Osterman, J.C.; Mitchell, J.L. Calibration of the Minolta SPAD-502 leaf chlorophyll meter. Photosynth. Res. 1995, 46, 467–472. [Google Scholar] [CrossRef]
  26. Henriques, F.S. Leaf chlorophyll fluorescence: Background and fundamentals for plant biologists. Bot. Rev. 2009, 75, 249–270. [Google Scholar] [CrossRef]
  27. Mayanja, I.K.; Diepenbrock, C.H.; Vadez, V.; Lei, T.; Bailey, B.N. Practical considerations and limitations of using leaf and canopy temperature measurements as a stomatal conductance proxy: Sensitivity across environmental conditions, scale, and sample size. Plant Phenomics 2024, in press. [CrossRef]
  28. Amodio, M.L.; Chaudhry, M.M.A.; Colelli, G. Spectral and hyperspectral technologies as an additional tool to increase information on quality and origin of horticultural crops. Agronomy 2019, 10, 7. [Google Scholar] [CrossRef]
  29. Singh, P.; Pandey, P.C.; Petropoulos, G.P.; Pavlides, A.; Srivastava, P.K.; Koutsias, N.; Deng, K.A.K.; Bao, Y. Hyperspectral remote sensing in precision agriculture: Present status, challenges, and future trends. In Hyperspectral Remote Sensing, 1st ed.; Pandey, P.C., Srivastava, P.K., Balzter, H., Bhattacharya, B., Petropoulos, G.P., Eds.; Elsevier: Cambridge, MA, USA, 2020; Volume Earth Observation, pp. 121–146. [Google Scholar]
  30. Fiorani, F.; Schurr, U. Future scenarios for plant phenotyping. Annu. Rev. Plant Biol. 2013, 64, 267–291. [Google Scholar] [CrossRef]
  31. Govender, M.; Govender, P.J.; Weiersbye, I.M.; Witkowski, E.T.F.; Ahmed, F. Review of commonly used remote sensing and ground-based technologies to measure plant water stress. Water SA 2009, 35, 741–752. [Google Scholar] [CrossRef]
  32. Asner, G.P. Biophysical and biochemical sources of variability in canopy reflectance. Remote Sens. Environ. 1998, 64, 234–253. [Google Scholar] [CrossRef]
  33. Pettorelli, N. The Normalized Difference Vegetation Index, 1st ed.; Oxford University Press: New York, NY, USA, 2013. [Google Scholar]
  34. Tan, C.W.; Wang, D.L.; Zhou, J.; Du, Y.; Luo, M.; Zhang, Y.J.; Guo, W.S. Assessment of Fv/Fm absorbed by wheat canopies employing in-situ hyperspectral vegetation indexes. Sci. Rep. 2018, 8, 9525. [Google Scholar] [CrossRef] [PubMed]
  35. Pérez-Marín, D.; Paz, P.; Guerrero, J.E.; Garrido-Varo, A.; Sánchez, M.T. Miniature handheld NIR sensor for the on-site non-destructive assessment of post-harvest quality and refrigerated storage behavior in plums. J. Food Eng. 2010, 99, 294–302. [Google Scholar] [CrossRef]
  36. Sánchez, M.T.; de la Haba, M.J.; Benítez-López, M.; Fernández-Novales, J.; Garrido-Varo, A.; Pérez-Marín, D. Non-destructive characterization and quality control of intact strawberries based on NIR spectral data. J. Food Eng. 2012, 110, 102–108. [Google Scholar] [CrossRef]
  37. Furbank, R.T.; Silva-Perez, V.; Evans, J.R.; Condon, A.G.; Estavillo, G.M.; He, W.; Newman, S.; Poiré, R.; Hall, A.; He, Z. Wheat physiology predictor: Predicting physiological traits in wheat from hyperspectral reflectance measurements using deep learning. Plant Methods 2021, 17, 108. [Google Scholar] [CrossRef] [PubMed]
  38. Ramraj, S.; Uzir, N.; Sunil, R.; Banerjee, S. Experimenting XGBoost algorithm for prediction and classification of different datasets. IET Control Theory Appl. 2016, 9, 651–662. [Google Scholar]
  39. Azim, M.A.; Islam, M.K.; Rahman, M.M.; Jahan, F. An effective feature extraction method for rice leaf disease classification. Telkomnika 2021, 19, 463–470. [Google Scholar] [CrossRef]
  40. Yuan, Z.; Ye, Y.; Wei, L.; Yang, X.; Huang, C. Study on the Optimization of Hyperspectral Characteristic Bands Combined with Monitoring and Visualization of Pepper Leaf SPAD Value. Sensors 2021, 22, 183. [Google Scholar] [CrossRef] [PubMed]
  41. Ahn, I.; Kim, S.H.; Maeng, W.Y.; Lee, I.E.; Chang, K.W.; Lee, J.J. Effects of soil acidity and organic matter by application of organic materials and soil mulching with pine needles for soil surface management in blueberry eco-friendly farming. Korean J. Soil Sci. 2013, 46, 556–562. (In Korean) [Google Scholar] [CrossRef]
  42. Tyurin, I.V. A new modification of the volumetric method of determining soil organic matter by means of chromic acid. Pochvovedenie 1931, 26, 36–47. [Google Scholar]
  43. Cox, M. The Lancaster soil test method as an alternative to the Mehlich 3 soil test method. Soil Sci. 2001, 166, 484–489. [Google Scholar] [CrossRef]
  44. National Institute of Agricultural Science and Technology. Methods of Soil and Plant Analysis; Rural Development Administration (NIAST): Suwon, Republic of Korea, 2000; pp. 103–146. (In Korean) [Google Scholar]
  45. Mänd, P.; Hallik, L.; Peñuelas, J.; Nilson, T.; Duce, P.; Emmett, B.A.; Beier, C.; Estiarte, M.; Garadnai, J.; Kalapos, T.; et al. Responses of the reflectance indices PRI and NDVI to experimental warming and drought in European shrublands along a north–south climatic gradient. Remote Sens. Environ. 2010, 114, 626–636. [Google Scholar] [CrossRef]
  46. Daughtry, C.S.; Walthall, C.L.; Kim, M.S.; De Colstoun, E.B.; McMurtrey Iii, J.E. Estimating corn leaf chlorophyll concentration from leaf and canopy reflectance. Remote Sens. Environ. 2000, 74, 229–239. [Google Scholar] [CrossRef]
  47. Rondeaux, G.; Steven, M.; Baret, F. Optimization of soil-adjusted vegetation indices. Remote Sens. Environ. 1996, 55, 95–107. [Google Scholar] [CrossRef]
  48. Gamon, J.A.; Penuelas, J.; Field, C.B. A narrow-waveband spectral index that tracks diurnal changes in photosynthetic efficiency. Remote Sens. Environ. 1992, 41, 35–44. [Google Scholar] [CrossRef]
  49. Hunt, E.R., Jr.; Rock, B.N. Detection of changes in leaf water content using near-and middle-infrared reflectances. Remote Sens. Environ. 1989, 30, 43–54. [Google Scholar]
  50. Gao, B.C. NDWI—A normalized difference water index for remote sensing of vegetation liquid water from space. Remote Sens. Environ. 1996, 58, 257–266. [Google Scholar] [CrossRef]
  51. Cho, M.; Sobhan, I.; Skidmore, A.; de Leeuw, J. Discriminating species using hyperspectral indices at leaf and canopy scales. In Proceedings of the XXI Congress: Silk Road for Information from Imagery, Beijing, China, 3–11 July 2008; pp. 369–376. [Google Scholar]
  52. Haubrock, S.N.; Chabrillat, S.; Lemmnitz, C.; Kaufmann, H. Surface soil moisture quantification models from reflectance data under field conditions. Int. J. Remote Sens. 2008, 29, 3–29. [Google Scholar] [CrossRef]
  53. Albert, T.; Karp, K.; Starast, M.; Paal, T. The effect of mulching and pruning on the vegetative growth and yield of the half-high blueberry. Agron. Res. 2010, 8, 759–769. [Google Scholar]
  54. Peterson, L.A.; Stang, E.J.; Dana, M.N. Blueberry Response to NH4-N and NO3-N. J. Am. Soc. Hortic. Sci. 1988, 113, 9–12. [Google Scholar] [CrossRef]
  55. Muñoz-Vega, P.; Paillán, H.; Serri, H.; Donnay, D.; Sanhueza, C.; Merino, E.; Hirzel, J. Effects of organic fertilizers on the vegetative, nutritional, and productive parameters of blueberries ‘Corona’, ‘Legacy’, and ‘Liberty’. Chil. J. Agric. Res. 2016, 76, 201–212. [Google Scholar] [CrossRef]
  56. Iqbal, M.; Bakesh, P.; Kumar, R.; Wali, V.K.; Bhushan, B. Influence of Mulching on Fruit Quality of Aonla (Emblica officinalis Gaertn.) Cv. Na-7. Ecol. Environ. Conserv. 2015, 21, 263–268. [Google Scholar]
  57. Karp, K.; Noormets, M.; Starast, M.; Paal, T. The influence of mulching on nutrition and yield of Northblue blueberry. In Proceedings of the VIII International Symposium on Vaccinium Culture, Sevilla, Spain; Oeiras, Portugal, 3–8 May 2004; pp. 301–306. [Google Scholar]
  58. Akhtar, K.; Wang, W.; Khan, A.; Ren, G.; Afridi, M.Z.; Feng, Y.; Yang, G. Wheat straw mulching offset soil moisture deficient for improving physiological and growth performance of summer sown soybean. Agric. Water Manag. 2019, 211, 16–25. [Google Scholar] [CrossRef]
  59. Dvořák, P.; Martin, K.R.Á.L. Effects of organic mulching on soil water potential and SPAD values as factors on yield of potatoes (Solanum tuberosum L.). J. Agric. Sci. 2019, 25, 147–154. [Google Scholar] [CrossRef]
  60. Percival, G.C.; Keary, I.P.; Noviss, K. The potential of a chlorophyll content SPAD meter to quantify nutrient stress in foliar tissue of sycamore (Acer pseudoplatanus), English oak (Quercus robur), and European beech (Fagus sylvatica). Arboric. Urban For. 2008, 34, 89–100. [Google Scholar] [CrossRef]
  61. Kumagai, E.; Araki, A.; Kubota, F. Correlation of chlorophyll meter readings with gas exchange and chlorophyll fluorescence in flag leaves of rice (Oryza sativa L.) plants. Plant Prod. Sci. 2009, 12, 50–53. [Google Scholar] [CrossRef]
  62. Jiang, Y.; Zeng, Q.; Wei, J.; Jiang, J.; Li, Y.; Chen, J.; Yu, H. Growth, fruit yield, photosynthetic characteristics, and leaf microelement concentration of two blueberry cultivars under different long-term soil pH treatments. Agronomy 2019, 9, 357. [Google Scholar] [CrossRef]
  63. Jiang, Y.; Li, Y.; Zeng, Q.; Wei, J.; Yu, H. The effect of soil pH on plant growth, leaf chlorophyll fluorescence and mineral element content of two blueberries. In Proceedings of the XI International Vaccinium Symposium, Orlando, FL, USA, 10–14 April 2016; pp. 269–276. [Google Scholar]
  64. Farzi, R.; Gholami, M.; Baninasab, B.; Gheysari, M. Evaluation of different mulch materials for reducing soil surface evaporation in semi-arid region. Soil Use Manag. 2017, 33, 120–128. [Google Scholar] [CrossRef]
  65. Rho, H.; Yu, D.J.; Kim, S.J.; Lee, H.J. Limitation factors for photosynthesis in ‘Bluecrop’ highbush blueberry (Vaccinium corymbosum) leaves in response to moderate water stress. J. Plant Biol. 2012, 55, 450–457. [Google Scholar] [CrossRef]
  66. Oliveira, R.M.D.; Cunha, F.F.D.; Silva, G.H.D.; Andrade, L.M.; Morais, C.V.D.; Ferreira, P.M.O.; Raimundi, F.P.G.; Freitas, A.R.J.; Souza, C.M.D.; Oliveira, R.A.D. Evapotranspiration and crop coefficients of Italian zucchini cultivated with recycled paper as mulch. PLoS ONE 2020, 15, e0232554. [Google Scholar] [CrossRef] [PubMed]
  67. Kovar, M.; Brestic, M.; Sytar, O.; Barek, V.; Hauptvogel, P.; Zivcak, M. Evaluation of hyperspectral reflectance parameters to assess the leaf water content in soybean. Water 2019, 11, 443. [Google Scholar] [CrossRef]
  68. Peñuelas, J.; Filella, I. Visible and near-infrared reflectance techniques for diagnosing plant physiological status. Trends Plant Sci. 1998, 3, 151–156. [Google Scholar] [CrossRef]
  69. Zhang, W.; Zhang, W.; Yang, Y.; Hu, G.; Ge, D.; Liu, H.; Cao, H. A cloud computing-based approach using the visible near-infrared spectrum to classify greenhouse tomato plants under water stress. Comput. Electron. Agric. 2021, 181, 105966. [Google Scholar]
  70. Bruno, T.J.; Svoronos, P.D. CRC Handbook of Fundamental Spectroscopic Correlation Charts, 1st ed.; CRC Press: Florida, FL, USA, 2005. [Google Scholar]
  71. Liu, C.; Zhang, G.; Zhu, H.; Zhu, Y. Effects of irrigation and nitrogen-sulfur combined application on grain yield and water use efficiency in winter wheat. J. Henan Agric. Sci. 2015, 44, 13–18. [Google Scholar]
  72. Virnodkar, S.S.; Pachghare, V.K.; Patil, V.C.; Jha, S.K. Remote sensing and machine learning for crop water stress determination in various crops: A critical review. Precis. Agric. 2020, 21, 1121–1155. [Google Scholar] [CrossRef]
  73. Ma, H.; Zhang, K.; Jin, X.; Ji, J.; Zhu, X. Identification of Blueberry Fruit Maturity Using Hyperspectral Images Technology. J. Agric. Sci. Technol. 2020, 22, 1008-0864. [Google Scholar]
  74. Huang, Y.; Wang, D.; Liu, Y.; Zhou, H.; Sun, Y. Measurement of early disease blueberries based on vis/nir hyperspectral imaging system. Sensors 2020, 20, 5783. [Google Scholar] [CrossRef] [PubMed]
  75. Choi, J.Y.; Kim, J.; Kim, J.; Jeong, S.; Kim, M.; Park, S.; Moon, K.D. Hyperspectral imaging technigue for monitoring moisture content of blueberry during the drying process. Food Sci. Preserv. 2021, 28, 445–455. [Google Scholar] [CrossRef]
  76. Zheng, Z.; An, Z.; Liu, X.; Chen, J.; Wang, Y. Finite element analysis and near-infrared hyperspectral reflectance imaging for the determination of blueberry bruise grading. Foods 2022, 11, 1899. [Google Scholar] [CrossRef] [PubMed]
  77. Stuart, M.B.; McGonigle, A.J.; Willmott, J.R. Hyperspectral imaging in environmental monitoring: A review of recent developments and technological advances in compact field deployable systems. Sensors 2019, 19, 3071. [Google Scholar] [CrossRef] [PubMed]
  78. Damour, G.; Simonneau, T.; Cochard, H.; Urban, L. An overview of models of stomatal conductance at the leaf level. Plant Cell Environ. 2010, 33, 1419–1438. [Google Scholar] [CrossRef] [PubMed]
Figure 1. Meteorological data of growth environment.
Agronomy 14 00785 g001
Figure 2. Blueberry seedling growth of five treatments in the measurement period. (a) Leaf growth measurement criteria (LW: leaf width and LL: leaf length); (b) NM; (c) S; (d) PCs; (e) PCS; (f) PNs.
Agronomy 14 00785 g002
Figure 3. Overview of study flowchart.
Agronomy 14 00785 g003
Figure 4. Effect of mulching on the SMC (%).
Agronomy 14 00785 g004
Figure 5. Result of the classification models based on the leaf growth and physiology data. (a) PLS-DA P.M.P model (Num. LVs: 4); (b) PLS-DA Thres: 0.5 model (Num. LVs: 4); (c) XGBoost P.M.P model (eta: 0.3, max depth: 6, num round: 200); (d) XGBoost Thres: 0.5 model (eta: 0.3, max depth: 6, num round: 200). NM: non-mulching, PCs: crushed pinecones, PCS: a mixture of crushed pinecones and sulfur, PNs: pine needles, and S: sulfur treatment. Red numbers mean well-classified treatment. Blue numbers mean poorly classified treatment.
Agronomy 14 00785 g005
Figure 6. Result of the classification models based on the VI data. (a) PLS-DA P.M.P model (Num. LVs: 3); (b) PLS-DA Thres: 0.5 model (Num. LVs: 3); (c) XGBoost P.M.P model (eta: 0.3, max depth: 6, num round: 200); (d) XGBoost Thres: 0.5 model (eta: 0.3, max depth: 6, num round: 200). NM: non-mulching, PCs: crushed pinecones, PCS: a mixture of crushed pinecones and sulfur, PNs: pine needles, and S: sulfur treatment. Red numbers mean well-classified treatment. Blue numbers mean poorly classified treatment.
Agronomy 14 00785 g006
Figure 7. Result of the classification models based on the VNIR data. (a) PLS-DA P.M.P model (Num. LVs: 5); (b) PLS-DA Thres: 0.5 model (Num. LVs: 5); (c) XGBoost P.M.P model (eta: 0.3, max depth: 6, num round: 200); (d) XGBoost Thres: 0.5 model (eta: 0.3, max depth: 6, num round: 200). NM: Non-mulching, PCs: crushed pinecones, PCS: a mixture of crushed pinecones and sulfur, PNs: pine needles, and S: sulfur treatment. Red numbers mean well-classified treatment. Blue numbers mean poorly classified treatment.
Agronomy 14 00785 g007
Figure 8. Result of the classification models based on the SWIR data. (a) PLS-DA P.M.P model (Num. LVs: 2); (b) PLS-DA Thres: 0.5 model (Num. LVs: 2); (c) XGBoost P.M.P model (eta: 0.3, max depth: 6, num round: 200); (d) XGBoost Thres: 0.5 model (eta: 0.3, max depth: 6, num round: 200). NM: non-mulching, PCs: crushed pinecones, PCS: a mixture of crushed pinecones and sulfur, PNs: pine needles, and S: sulfur treatment. Red numbers mean well-classified treatment. Blue numbers mean poorly classified treatment.
Agronomy 14 00785 g008
Table 1. Overview of datasets for classification modeling.
Data Set
(Data Format)
Parameters and WavelengthsReferences
Leaf growth and physiology data
(200 measured data × 5 treatments × 10 parameters)
1. LW; 2. LL; 3. LW/LL; 4. SPAD; 5. Fo; 6. Fm; 7. Fv/Fm; 8. ABS/RC; 9. DIo/RC; 10. gs
VI data
(2000 measured data × 5 treatments × 8 VIs)
1. Normalized difference vegetation index (NDVI):
(R800 − R670)/(R800 + R670)
[45]
2. Modified chlorophyll absorption ratio index (MCARI):
[(R700 − R670) − 0.2 × (R700 − R550)] × (R700/R670)
[46]
3. Soil-adjusted vegetation index (SAVI):
(1 + 0.16) × (R800 − R670)/(R800 + R670 + 0.16)
[47]
4. Photochemical reflectance index (PRI):
(R570 − R531)/(R531 + R570)
[48]
5. Moisture stress index (MSI):
R1600/R820
[49]
6. Normalized difference water index (NDWI):
(R860 − R1240)/(R860 + R1240)
[50]
7. Disease water stress index (DWSI):
(R802 + R547)/(R1657 + R682)
[51]
8. Normalized soil moisture index (NSMI):
(R1800 − R2119)/(R1800 + R2119)
[52]
Full VNIR spectra
(2000 measured reflectance (%) data × 5 treatments × 466 wavelengths)
R485–950 nm (units of 1 nm)
Full SWIR spectra
(2000 measured reflectance (%) data × 5 treatments × 378 wavelengths)
R1101–2300 nm (Units of 3 nm)
Table 2. Evaluation indices for classification models.
Actual OutcomeTypes of Performance Evaluation
TrueFalse
Predicted outcomeTrueTrue positive (Tp)False positive (Fp)Precision = Tp/(Tp + Fp)
Recall = Tp/(Tp + Fn)
Accuracy = (Tp + Tn)/(Tp + Fp + Tn + Fn)
False Positive Rate (FPR) = Fp/(Tn + Fp)
F1 score = (2 × Precision × Recall)/(Precision + Recall)
FalseFalse negative (Fn)True negative (Tn)
The best model is determined when the result shows as close as “1”: Precision, Recall, Accuracy and F1 score. The best model is determined when the result shows as close as “0”: FPR.
Table 3. Soil characteristics in different mulching treatments after 6 months of blueberry cultivation.
pHOM
(%)
Available
P2O5
(mg/kg)
TN
(mg/g)
NH4+-N
(mg/g)
NO3-N
(mg/g)
Exchangeable Cation (cmol/kg)
K+Ca2+Na+Mg2+
NM6.464.1610.800.610.100.030.063.250.650.51
PCs5.897.0229.101.200.040.070.282.570.180.56
PCS5.812.8026.700.960.040.010.212.220.200.48
PNs5.871.7911.400.680.050.030.063.100.220.48
S5.592.0514.600.700.060.050.063.060.220.44
Bold numbers indicate a superior change due to crushed pinecone mulching. NM: non-mulching, PCs: crushed pinecones, PCS: a mixture of crushed pinecones and sulfur, PNs: pine needles, S: sulfur treatment, pH: potential of hydrogen, OM: organic matter, available P2O5: available phosphorus pentoxide, TN: total nitrogen, NH4+-N: ammonium nitrogen, NO3-N: nitrate nitrogen, K+: potassium, Ca2+: calcium, Na+: sodium, and Mg2+: magnesium.
Table 4. Leaf growth and physiological characteristics in five different mulching treatments (n = 200).
LW
(cm)
LL
(cm)
LW/LLSPADFo/100Fm/100Fv/FmABS/RCDIo/RCgs
(mmol/m2/s)
NM0.81 ± 0.22 d1.57 ± 0.42 c0.52 ± 0.09 a21.95 ± 6.16 bc48.13 ± 13.48 c195.18 ± 56.05 c0.75 ± 0.05 c1.81 ± 0.40 a0.47 ± 0.19 a148.89 ± 33.21 b
PCs1.23 ± 0.37 c2.67 ± 0.53 b0.46 ± 0.11 b24.94 ± 5.41 a49.25 ± 7.23 bc235.07 ± 36.54 b0.79 ± 0.03 a1.63 ± 0.21 c0.35 ± 0.09 bc195.09 ± 60.90 a
PCS1.52 ± 0.41 a2.97 ± 0.80 a0.52 ± 0.07 a23.09 ± 6.58 b49.07 ± 6.02 bc237.26 ± 30.62 b0.79 ± 0.02 a1.55 ± 0.15 d0.32 ± 0.06 c187.23 ± 54.93 a
PNs1.38 ± 0.39 b2.72 ± 0.76 b0.52 ± 0.11 a21.90 ± 4.38 bc50.98 ± 7.92 b230.17 ± 39.56 b0.78 ± 0.02 b1.69 ± 0.16 bc0.38 ± 0.06 b190.80 ± 56.11 a
S0.85 ± 0.32 d1.64 ± 0.59 c0.53 ± 0.12 a21.22 ± 4.79 c54.52 ± 6.84 a258.44 ± 31.26 a0.79 ± 0.02 a1.72 ± 0.20 b0.37 ± 0.07 b117.45 ± 26.72 c
Bold numbers indicate a superior change due to crushed pinecone mulching. Means ± standard deviations with different letters are significantly different at p < 0.05, which were testified with one-way ANOVA test and Tukey HSD test. NM: non-mulching, PCs: crushed pinecones, PCS: a mixture of crushed pinecones and sulfur, PNs: pine needles, S: sulfur treatment, LW: leaf width, LL: leaf length, Fo: minimum fluorescence, Fm: maximum fluorescence, Fv/Fm: maximum quantum yield of photosystem II, ABS/RC: absorption flux per reaction center, Dio/RC: energy dissipation per reaction center, and gs: stomatal conductance.
Table 5. Leaf VIs in five different mulching treatments (n = 2000).
NDVIMCARISAVIPRI × 10MSINDWI × 10DWSINSMI
NM0.86 ± 0.05 c157.63 ± 36.24 a1.00 ± 0.06 c0.25 ± 0.31 c0.60 ± 0.09 b0.04 ± 0.66 b1.92 ± 0.27 b0.31 ± 0.03 d
PCs0.88 ± 0.05 a136.18 ± 53.38 c1.02 ± 0.05 a0.06 ± 0.28 d0.56 ± 0.09 c0.23 ± 0.59 a2.00 ± 0.29 a0.34 ± 0.03 a
PCS0.87 ± 0.06 b129.90 ± 46.08 d1.01 ± 0.07 b−0.10 ± 0.30 e0.60 ± 0.11 b0.03 ± 0.76 b1.92 ± 0.31 b0.32 ± 0.02 c
PNs0.86 ± 0.05 c141.17 ± 47.38 b0.99 ± 0.06 c0.32 ± 0.28 b0.60 ± 0.10 b−0.03 ± 0.68 c1.91 ± 0.27 b0.33 ± 0.03 b
S0.81 ± 0.07 d142.26 ± 43.80 b0.94 ± 0.08 d0.44 ± 0.34 a0.68 ± 0.11 a−0.39 ± 0.66 d1.73 ± 0.26 c0.30 ± 0.03 e
Bold numbers indicate a superior change due to crushed pinecone mulching. Means ± standard deviations with different letters are significantly different at p < 0.05, which were testified with one-way ANOVA test and Tukey HSD test. NM: Non-mulching, PCs: crushed pinecones, PCS: a mixture of crushed pinecones and sulfur, PNs: pine needles, S: sulfur treatment, NDVI: normalized difference vegetation index, MCARI: modified chlorophyll absorption ratio index, SAVI: soil-adjusted vegetation index, PRI: photochemical reflectance index, MSI: moisture stress index, NDWI: normalized difference water index, DWSI: disease water stress index, and NSMI: normalized soil moisture index.
Table 6. VIP scores and variable score rank of classification models.
PLS-DA
(“VIP Scores > 1” Rank)
XGBoost
(“Variable Scores” Rank)
Leaf growth and
physiological data
1. LL; 2. LW; 3. gs1. gs; 2. SPAD; 3. ABS/RC;
4. Fm; 5. LW/LL; 6. Fo; 7. Fv/Fm;
8. LL; 9. DIo/RC; 10. LW
VI data1. NSMI; 2. PRI1. PRI; 2. MCARI; 3. NSMI;
4. NDVI; 5. NDWI; 6. MSI;
7. DWSI; 8. SAVI
Full VNIR spectra1. 675 nm; 2. 553 nm; 3. 527 nm;
4. 737 nm; 5. 783 nm
1. 827 nm; 2. 690 nm; 3. 784 nm;
4. 514 nm; 5. 749 nm
Full SWIR spectra1. 1401 nm; 2. 1935 nm; 3. 1660 nm1. 1875 nm; 2. 2106 nm; 3. 1455 nm
Bold numbers and numbers indicate the most influential parameters identified through the integrated results of both PLS-DA and XGBoost models.
Table 7. The evaluation results of the classification model accuracy.
ParameterModelNMPCsPCSPNsS
Leaf growth and physiology PLS-DAP.M.P0.7750.7130.7000.5690.827
Thres: 0.50.6210.5830.5020.5130.742
XGBoostP.M.P0.8270.7580.7520.6920.867
Thres: 0.50.8310.7500.7330.7040.844
VIsPLS-DAP.M.P0.5960.7290.7280.5800.748
Thres: 0.50.5490.5020.5490.5200.521
XGBoostP.M.P0.8250.8620.8470.8290.868
Thres: 0.50.8030.8550.8370.8100.860
VNIRPLS-DAP.M.P0.7960.8900.8300.8010.843
Thres: 0.50.7110.6420.7990.6590.539
XGBoostP.M.P0.9800.9850.9930.9830.983
Thres: 0.50.9800.9850.9930.9830.980
SWIRPLS-DAP.M.P0.6150.7940.5520.5850.683
Thres: 0.50.5010.6640.5000.5320.506
XGBoostP.M.P0.9830.9850.9670.9650.968
Thres: 0.50.9840.9840.9650.9620.968
All evaluation results (Precision, Recall, Accuracy, FPR, and F1 score) are accessible in Supplementary Tables S1–S4. NM: non-mulching, PCs: crushed pinecones, PCS: a mixture of crushed pinecones and sulfur, PNs: pine needles, and S: sulfur treatment.
Disclaimer/Publisher’s Note: The statements, opinions and data contained in all publications are solely those of the individual author(s) and contributor(s) and not of MDPI and/or the editor(s). MDPI and/or the editor(s) disclaim responsibility for any injury to people or property resulting from any ideas, methods, instructions or products referred to in the content.

