Article

Comparison of Carbon Footprint Differences in Nitrogen Reduction and Density Increase in Double Cropping Rice under Two Evaluation Methods

1
College of Agronomy, Hunan Agricultural University, Changsha 410128, China
2
Key Laboratory of Southern Rice Innovation & Improvement, Ministry of Agriculture and Rural Affairs, Changsha 410001, China
3
Hunan Engineering Laboratory of Disease and Pest Resistant Rice Breeding, Yuan Longping High-Tech Agriculture Co., Ltd., Changsha 410001, China
4
Yiyang Institute of Agricultural Sciences, Yiyang 413046, China
*
Author to whom correspondence should be addressed.
These authors contributed equally to this work.
Agronomy 2024, 14(4), 803; https://doi.org/10.3390/agronomy14040803
Submission received: 14 March 2024 / Revised: 31 March 2024 / Accepted: 8 April 2024 / Published: 12 April 2024

Abstract

:
Optimized fertilizer use improves crop yield and mitigates environmental pollution associated with crop production. Fertilizer and plant density are core strategies to ensure food security and cope with climate change. However, little is known about the long-term interactive effect of reduced nitrogen (N) and increased density on yield and C (Carbon) balance. In this study, field experiments were conducted in a double-cropping rice region to evaluate long-term effects on yield and carbon footprint (CF) by crop-based and soil-based methods. Treatments were set for 10% reduction in N coupling with conventional density (N1D1), 20% higher density (N1D2), 40% higher density (N1D3), and 20% reduction in N coupling with conventional density (N2D1), 20% higher density (N2D2), and 40% higher density (N2D3), with the prevailing practices as control, conventional plant density, and fertilizer dose. Results showed that the yield continued to increase with increasing density; under the same density, reducing N by 10% is more beneficial for yield improvement and for CH4 emission reduction. Compared with CK, reducing N application by 10% generally increased the annual yields by 7.34–23.25% on average, and reduced CH4 emissions by 16.19–22.11%, resulting in a reduced crop-based carbon footprint of 22.24–26.82%, and a reduced soil-based carbon footprint of 22.08–32.85%. While reducing N application by 20% increased the annual yields by 5.00–20.19% and reduced the CH4 emission by 1.66–4.93%, it reduced crop-based carbon footprints by 1.81–10.05% and reduced soil-based carbon footprints by 7.22–19.86%. As density increased, the crop-based CF decreased, whereas the soil-based CF increased. Overall, the highest yield and the lowest soil-based CF and unit yield CF (CFy) were observed in N1D3. Regarding sustainability, a 10% reduction in N, along with an increase in density to 40%, can be recommended for double-cropping rice production.

1. Introduction

Rice (Oryza sativa L.) is a staple food in China and worldwide, supporting nearly 50% of the world’s population [1,2]. Over the past 70 years, rice grain yields in China have greatly improved from 1.89–7.04 t.hm−2 in 1949 and 2020, respectively [3]. This improvement can largely be attributed to an increased use of nitrogen (N) fertilizer [1,4]. For example, the use of N across the globe (i.e., over the past 50 years) has increased tenfold. Moreover, China uses 30% of the world’s N fertilizer, and this use continues to grow annually by 1.4% [5]. It has been shown that the average N fertilizer input for irrigated rice in China is 180 kg ha−1, which is approximately 75% higher than the global average [4], and that the mean N use efficiency is approximately 23%, which is only half of the worldwide average of 46% [1]. High concentrations of N fertilizers have been used to maintain or increase agricultural yields. Furthermore, the high rate of N application has culminated not only in low N-use efficiency but also in a series of environmental problems, such as increased greenhouse gas (GHG) emissions [6,7], N deposition [8], water eutrophication [9], and soil acidification [10]. To mitigate environmental pollution, reducing anthropogenic N application for sustainable rice production in China is critical [5,6].
Crop fields are important composition pools of carbon and N in the terrestrial ecosystem, wherein any small changes in these pools may lead to an obvious fluctuation in GHG emissions [11]. Climate change is evident as increasing GHG emissions, such as carbon dioxide (CO2), methane (CH4), and nitrous oxide (N2O) expedite global warming [11]. Therefore, substantial and sustained reductions in GHG emissions could contribute to a significant slowdown in global warming in the near term and greatly alter atmospheric composition within a few years (IPCC, 2023). Initiatives for reducing GHG emissions and mitigating climate change have focused on evaluating carbon footprints (CF) and sequestration assessments [12]. Agricultural production is the main driver of GHG emissions, accounting for approximately 14% of China’s national GHG emissions [13]. In particular, paddy fields contribute approximately 46.38% of the total agricultural GHG emissions in China [13,14]. Therefore, improving double-cropping rice production management to ensure food security and cope with climate change is crucial. Previous studies revealed a significant positive correlation between N fertilizer application rates and GHG emissions [12,15], especially in paddy fields [16]; however, N application rate is also a key means of maximizing grain yield in paddy fields, necessitating a balance in the benefit to yield with environmental costs derived from N applications. Numerous studies have shown that grain yields increase with increasing planting density or N application rates; therefore, dense planting is usually promoted to compensate for N reduction and ensure yield [4,5,17,18].
Reducing N and increasing plant density have played a significant role in reducing GHG emissions; however, the impacts on CF and the amount of N fertilizer recommended by different researchers vary greatly. There are two methods for CF evaluation: crop- and soil-based [19]. In the crop-based approach, the carbon footprint is typically estimated in terms of soil respiration, CH4 and N2O emissions, net crop biome productivity, and indirect emissions from agricultural inputs within the boundary of the farm-field system [16,19]. Correspondingly, the soil-based approach involves soil carbon pool changes, CH4 and N2O emissions, and indirect emissions, with the soil system as the boundary [20,21]. Published studies typically use one or more approaches for CF evaluation and cannot provide guidance from multiple perspectives. For example, Zhou [16] indicated that an N application rate of 86.4 kg N hm−2 for early rice and 108 kg N hm−2 for late rice, combined with an 80,000 hills hm−2 increase in plant density, and significantly reduced GHG emissions in south-central China. However, Zhong [14] and Jiang [12] reported even better results with an N application rate of 225 kg N ha−1 for single rice in East China, while Deng [22] reported an optimum N application rate of 225–270 kg N ha−1 for single rice in the Taihu Lake region. Moreover, these studies focused only on the effects of N reduction during the first few years of paddy field production, but the long-term effects were not clear. To explore the sustained impact of N reduction combined with plant densification in double-season rice, this study evaluated the CFs in the third and fourth years of production to (1) determine the effects of N fertilizer rates and plant density on yield, soil carbon, GHG emissions, and carbon footprint, (2) compare the differences in the systematic carbon footprints between crop-based and soil-based approaches, and (3) identify the optimal combinations of N fertilizer and plant density from the perspectives of soil and crop system CFs, respectively.

2. Methods and Materials

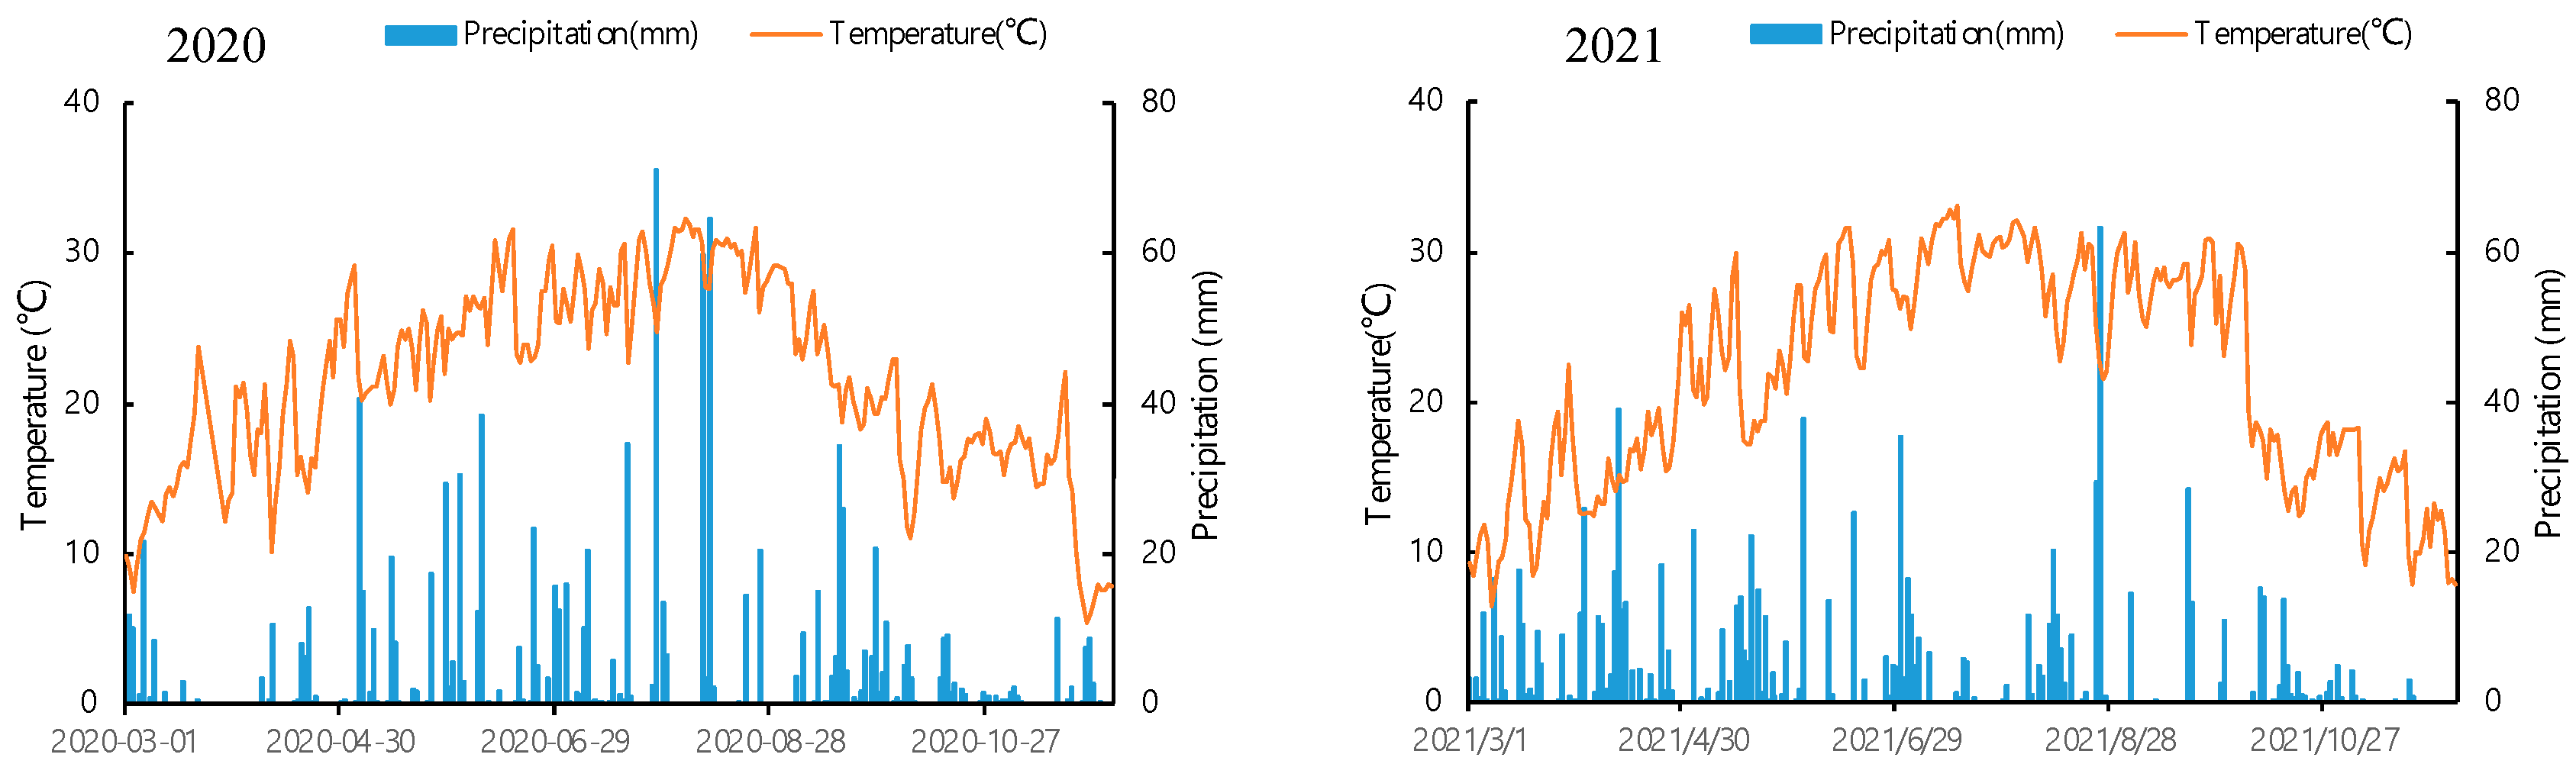
2.1. Site Description

The experiment was carried out at the Yiyang Academy of Agricultural Sciences in Hunan Province (28°32′ N, 112°24′ E). The test site was located in Dongting Lake district, and has a humid subtropical monsoon climate with an annual mean temperature of 16.9 °C and an annual mean precipitation of 1432.8 mm. The soil type was Hydragric, and the initial properties in the 0–20 cm depth were as follows: soil organic carbon 19.85 g kg−1, total nitrogen 1.23 g kg−1, total phosphorus 0.52 g kg−1, available phosphorous 11.15 mg kg−1, total potassium 9.34 g kg−1, available potassium 91.19 mg kg−1, bulk density 0.97 g cm−3, and pH 5.84. The planting pattern was a “double rice-winter follow” cropping system each year. The field experiment was conducted from March 2018 to November 2021, and greenhouse gases were measured in the 2020–2021 year of the trial; the temperature and precipitation during 2020 and 2021 are presented in Figure 1.

2.2. Field Experimental Design and Management

The field experiment was designed as a two-factor plot experiment with nitrogen rate (N) and planting density (D) (Table 1). The CK (N0D1) was according to the local conventional fertilization and density; and then we designed two reducing nitrogen application treatments: N1 (reduction of 10% compared to CK), N2 (reduction of 10% compared to CK), and two increasing planting density treatments: D2 (increased of 20% compared to D1) and D3 (increased of 40% compared to D1). There were seven combination treatments: CK, N1D1, N1D2, N1D3, N2D1, N2D2, and N2D3. Each treatment had three replicates with a randomized split-plot, and the plot area was approximately 14.00 m2; the field ridges were built and covered with plastic film between the communities for isolation, and separate drainage and irrigation were carried out to prevent the irrigation of fertilizer and water between the communities. The cultivars of early rice and late rice used in the study were “Zhuliangyou819” and “Taiyou390”, respectively. All treatments were supplied with phosphate fertilizer of 90 kg ha−1 and potassium fertilizer of 120 kg ha−1, respectively; the P fertilizer was applied at one time, and K fertilizer was applied as based fertilizer (70%) and panicle fertilizer (30%). The applied amount of nitrogen fertilizer is shown in Table 1. The nitrogen fertilizers were applied as based fertilizer (50%), tiller fertilizer (30%), and panicle fertilizer (20%), respectively. The rice straw was removed from the field after harvest.

2.3. Sampling and Measurement

2.3.1. Rice Yield

The rice grain yields were determined from two random 2-m2 areas in each plot, and the actual yield was converted to the standard moisture content of 0.14 g H2O g−1 fresh weight.

2.3.2. Measurements of GHG Fluxes

The fluxes of CO2,CH4 and N2O were collected and measured in situ using a static chamber-gas chromatograph method. The static chamber is created by an aluminum alloy cylindrical barrel with a 50-cm diameter and a height of 120 cm. The surface of the chamber was covered with an insulating sponge layer and reflective tinfoil in order to prevent unnecessary heating caused by direct sunlight during sampling. A small fan was installed on the top of the static box for air mixing, and a built-in temperature sensor records the air temperature inside the chamber. A stainless-steel barrel base (50 cm D × 15 cm H) with a groove was inserted into the soil of each plot after the rice was transplanted to fix the static chamber. Every time, before sampling, the base groove was filled with water to seal the rim of the chamber.
The GHG gas samples were collected every 3–7 days during the rice-growing season. Four gas samples were collected and injected into 10-mL vacuum vials from 9:00 to 11:00 a.m. at intervals of 0, 7, 14, and 21 min after the chamber was placed on the base. The concentration of CH4, N2O, and CO2 in the gas samples was then analyzed by Agilent gas chromatograph (Agilent 7890A, Agilent Technologies, Santa Clara, CA, USA), of which CH4 and CO2 were measured by the FID detector, N2O was measured by the ECD detector, and the standard gas was provided by the National Center for Reference Materials. The gas emission fluxes were calculated according to the following equation:
F = M V 0 × 273 273 + T × d c d t × h
where F is the CO2, CH4, and N2O emission flux (mg·m−2 h−1); M (g mol−1) and V0 (L mol−1) are the molar mass and volume of GHG in the standard state, 273 is the constant of gas state equation, T is the average temperature in the sampling chamber during the sampling process, dc/dt is the change rate of GHG concentration in the sampling chamber, and h (m) is the net height of the cover of the sampling chamber.
The GHG cumulative emissions were calculated using equation:
C E = i = 1 n F i + 1 + F i 2 × t i + 1 t i × 24 × 10 2
where CE is the cumulative amount of greenhouse gas emissions (kg hm−2),) n is the number of gas detections; i indicates the number of times the detection was conducted; F is the emission flux of GHG (mg·m−2 h−1); ti+1 − ti is the interval days (d) between two adjacent gas intakes, and 10−2 is the conversion unit. The annual cumulative emission is the sum of the cumulative emissions in the early rice season and in the late rice season.

2.3.3. Soil Organic Carbon Concentration and Soil Bulk Density

The soil samples were collected from the topsoil (0–20 cm) in each plot with three repetitions before the planting and after the harvest of rice. The SOC concentration was measured using the potassium dichromate external heating method. The soil bulk density (BD) was determined using the cutting-ring method to further calculate the SOC storage.

2.3.4. Indirect GHG Emissions

The indirect GHG emissions referred to emissions from the input of fertilizers, pesticides, seeds, diesels, etc., and the electricity consumption in the rice production process, which were converted into CO2 equivalents; the total amount of indirect emissions was calculated following Equation (3).
G H G i n d i r e c t = i = 1 n ( A I i × E F i )
where AIi represented the amount of the inputted item and EFi represented its coefficient factors (Table 2) in the rice production process.

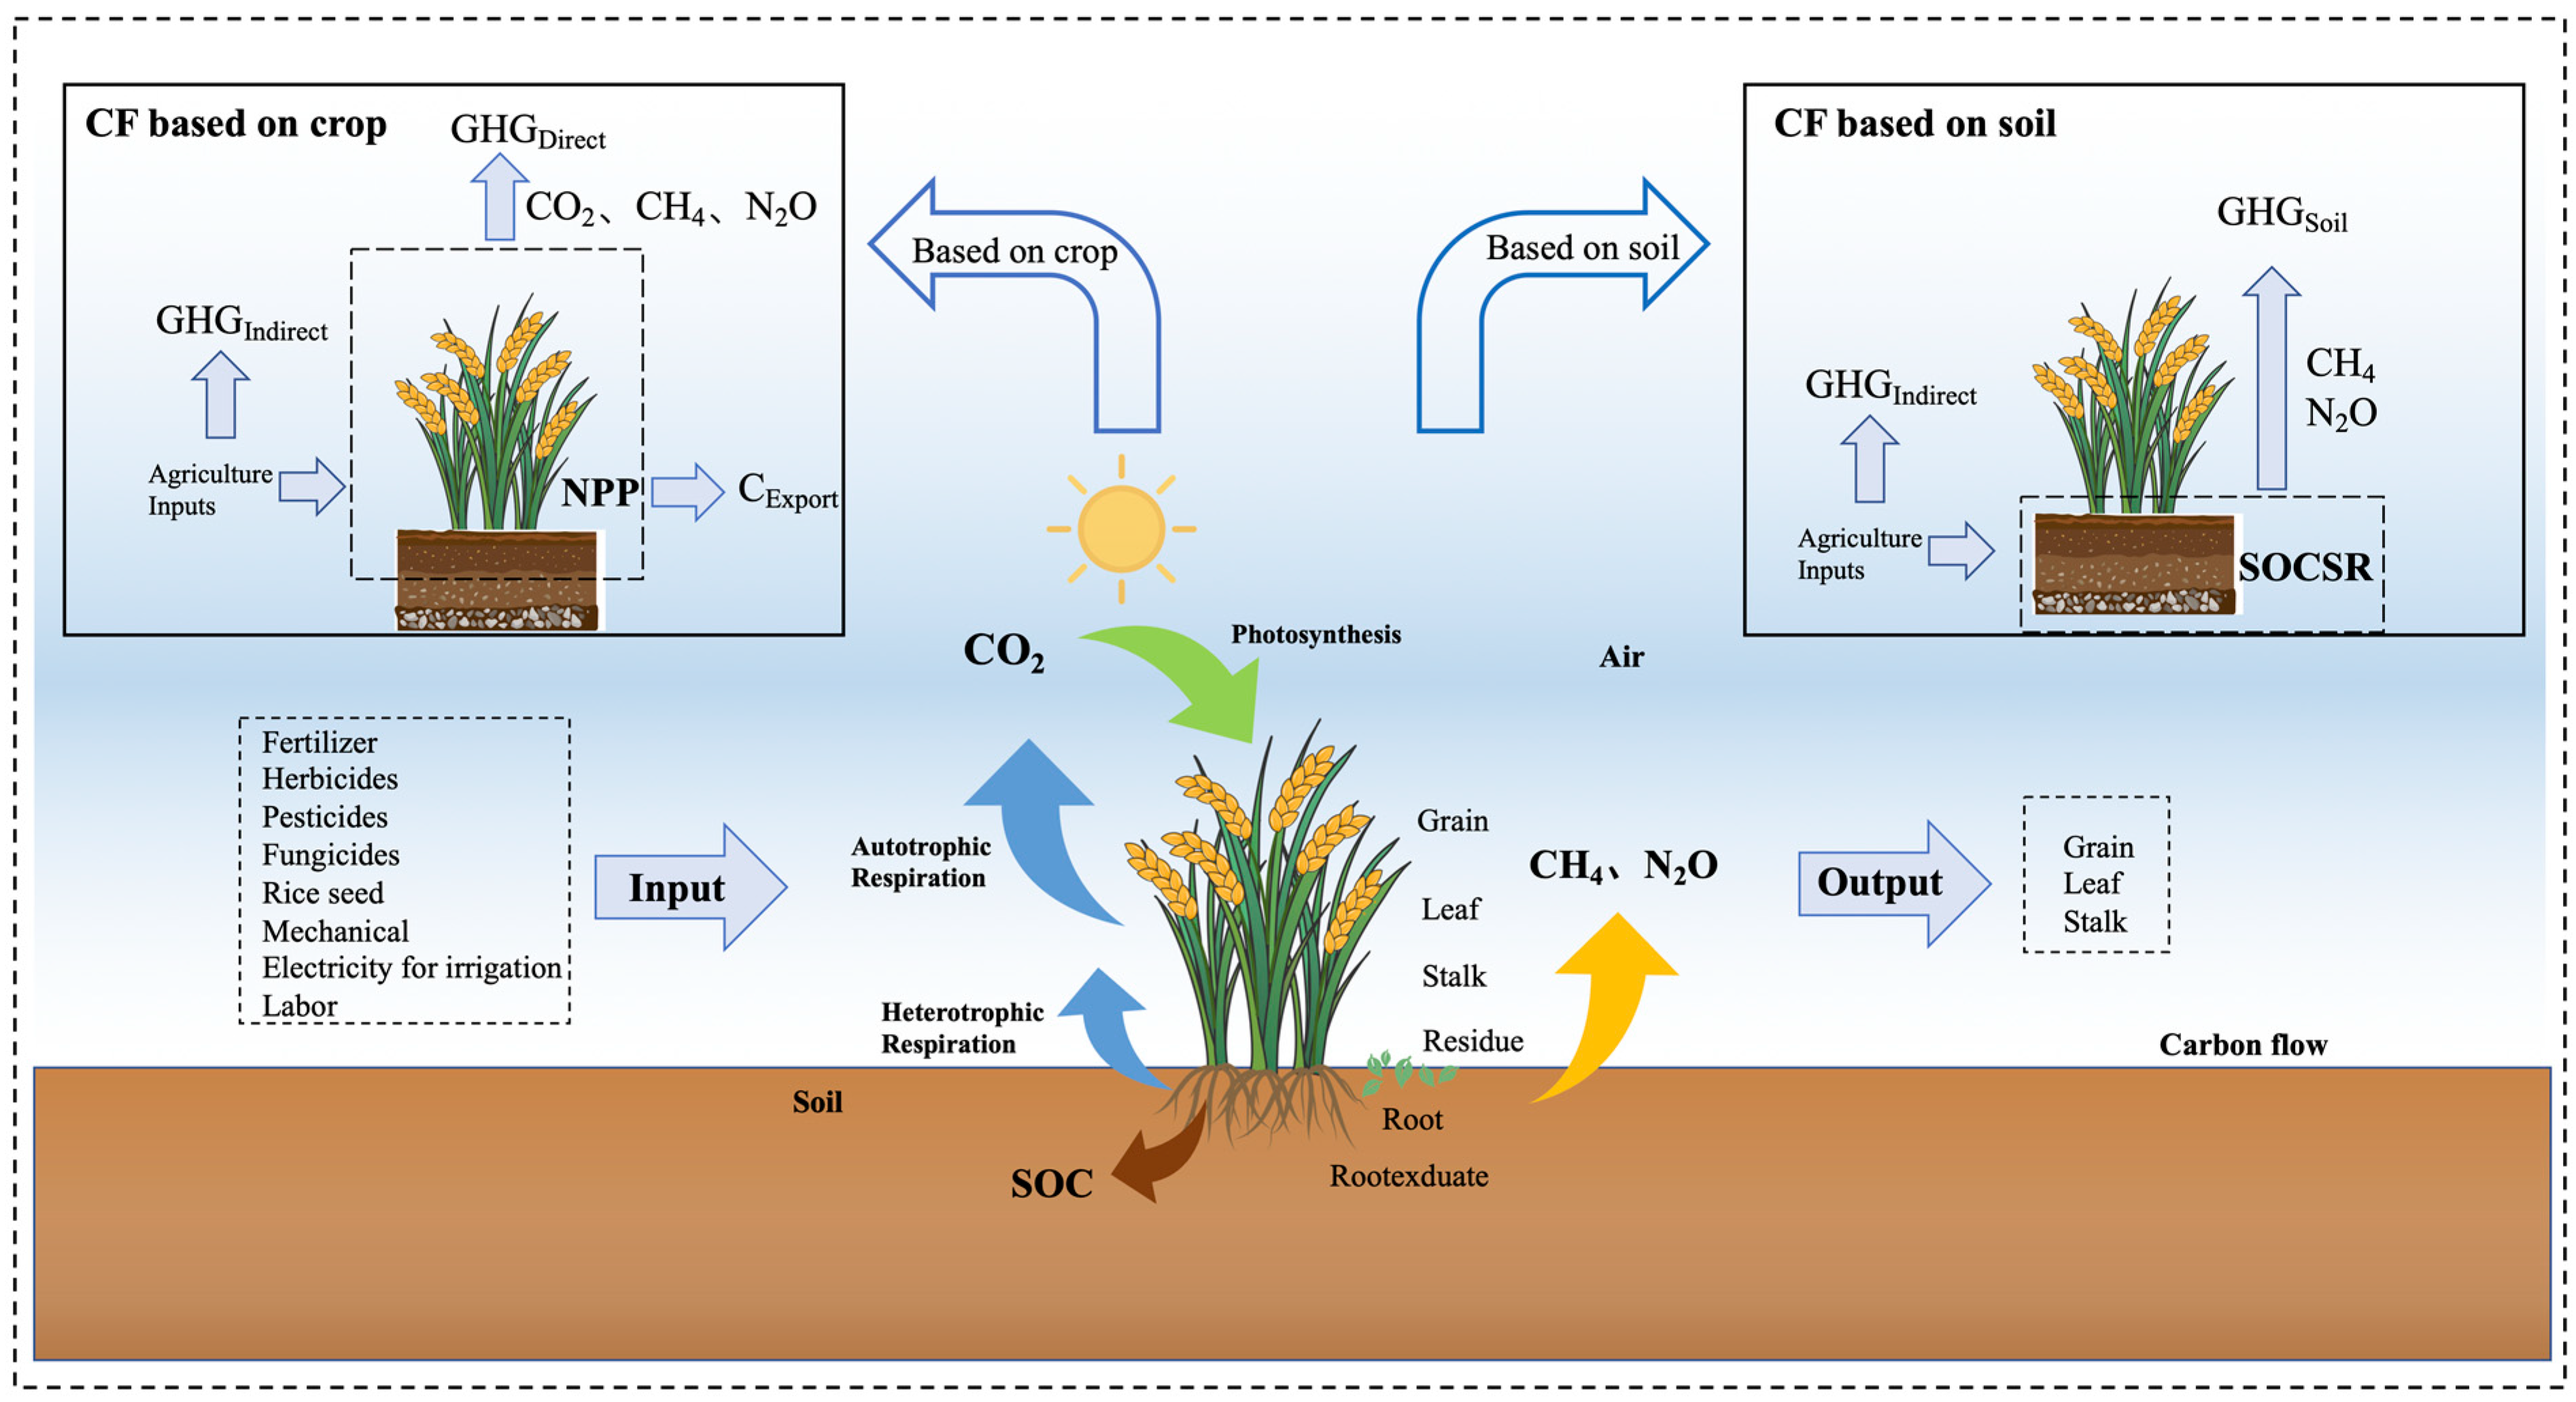
2.4. Carbon Footprint Calculation

2.4.1. The Crop-Based Carbon Footprint Evaluation Approach

The crop-based carbon footprint evaluation method takes the cropland system as the boundary, where the crop is the main body of carbon sequestration (Figure 2). The crop-based CF evaluation approach was estimated on the basis of NPP and GHG emissions; the equations are as follows [23]:
C F c r o p = C N P P + C I m p o r t + C E x p o r t + G H G D i r e c t + G H G I n d i r e c t
C N P P = ( C S + C L + C G + C R + C r + C E ) × 44 12
C E x p o r t = ( C S + C L + C G ) × 44 12
G H G D i r e c t = 1 × C E R h + 34 × C E C H 4 + 298 × C E N 2 O
where the CFcrop (kg CO2-eq ha−1) represents the carbon footprint of double rice based on the crop approach. The CNPP referred to the net primary productivity (NPP), including stalks (CS), leaves (CL), grains (CG), roots (CR), aboveground residues (Cr), and root exudate (CE); 44/12 was the ratio of CO2:C, CNPP had negative values because NPP fixes CO2 from the atmosphere. CImport referred to the carbon input directly from outside, which was 0 in this study. CExport is the aboveground biomass that is removed from the system. GHGDirect refers to the CO2 equivalent of direct GHG emissions, the numbers 1, 34, and 298 are the global warming potential coefficients of heterotrophic respiration (Rh), CH4 and N2O over a 100-year time horizon, respectively [23].

2.4.2. The Soil-Based Carbon Footprint Evaluation Approach

The soil carbon footprint assessment method is based on farmland soil as the boundary; soil is the only effective subject of carbon sequestration (Figure 2). We estimated the soil-based CF on the basis of SOC storage and the measurements of greenhouse gases; the equation is as follows [19]:
C F s o i l = G H G s o i l + G H G I n d i r e c t S O C S R
G H G s o i l = 34 × C E C H 4 + 298 × C E N 2 O
where the CFsoil (kg CO2-eq ha−1) represents the carbon footprint based on the soil approach during the production period. GHGsoil refers to the CO2 equivalent of the CECH4 and the CEN2O, and the CECH4 and the CEN2O are the cumulative emissions of CH4 and N2O in the field, respectively. The SOCSR is the annual variation in the SOC sequestration rate.

2.4.3. Variation of SOC Storage

In this study, the variation of SOC storage was calculated from the initial SOC storage in 2018 and the storage at the end of the late rice season in 2021. The SOC storage (SOCS) and SOC storage change rate (SOCSR) were calculated according to Equations (4) and (5).
S O C S = S O C × B D × H
S O C S R = S O C S 2021 S O C S 2018 4 × 44 12
where SOCS indicated SOC storage (kg ha−1), SOC was the soil organic carbon concentration (g/kg), BD is the soil bulk density (g/cm3). SOCSR was the annual change rate of SOC storage, SOCS2021 and SOCS2018 represented the SOC storage in 2021 and in 2018, respectively; 4 is the number of years from 2018 to 2021, and 44/12 is the coefficient for converting C into CO2.

2.5. Data Analysis

Statistical analyses were performed using SPSS22 (SPSS Inc., Chicago, IL, USA); significant differences between treatments were analyzed by Duncan’s test by one-way analysis of variance. All figures were plotted using EXCEL (Version 16.55).

3. Results

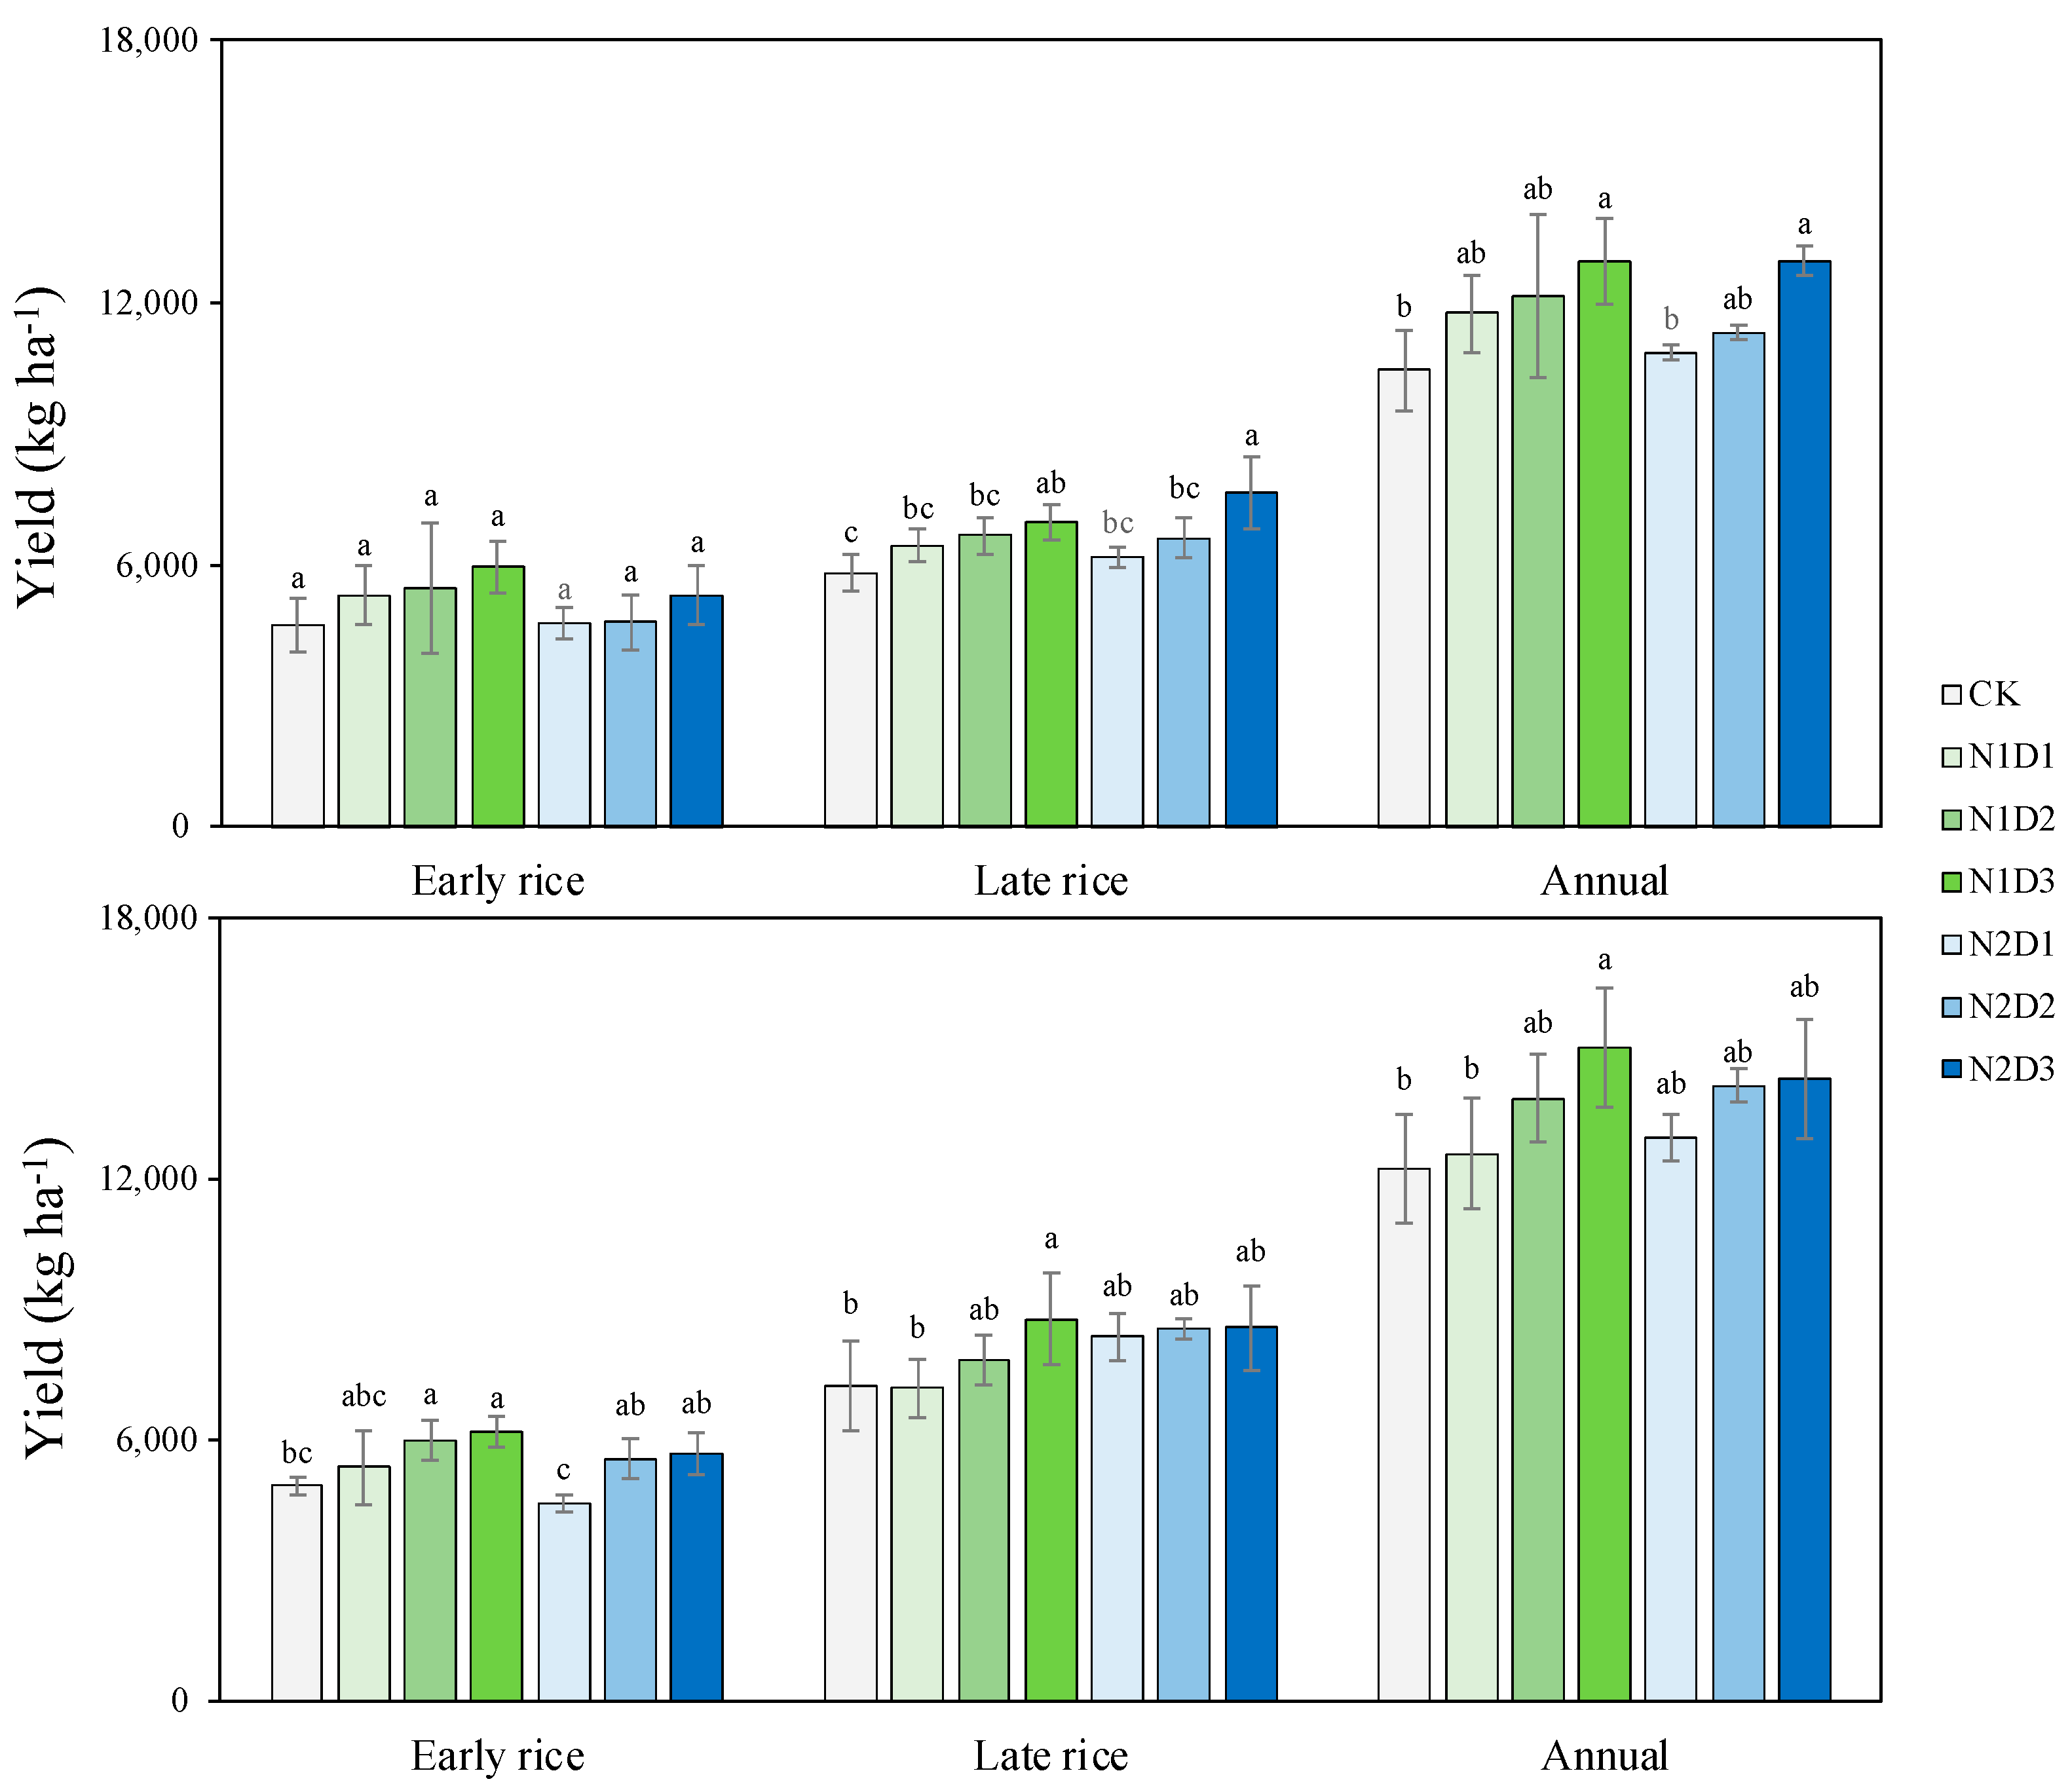
3.1. Rice Grain Yields
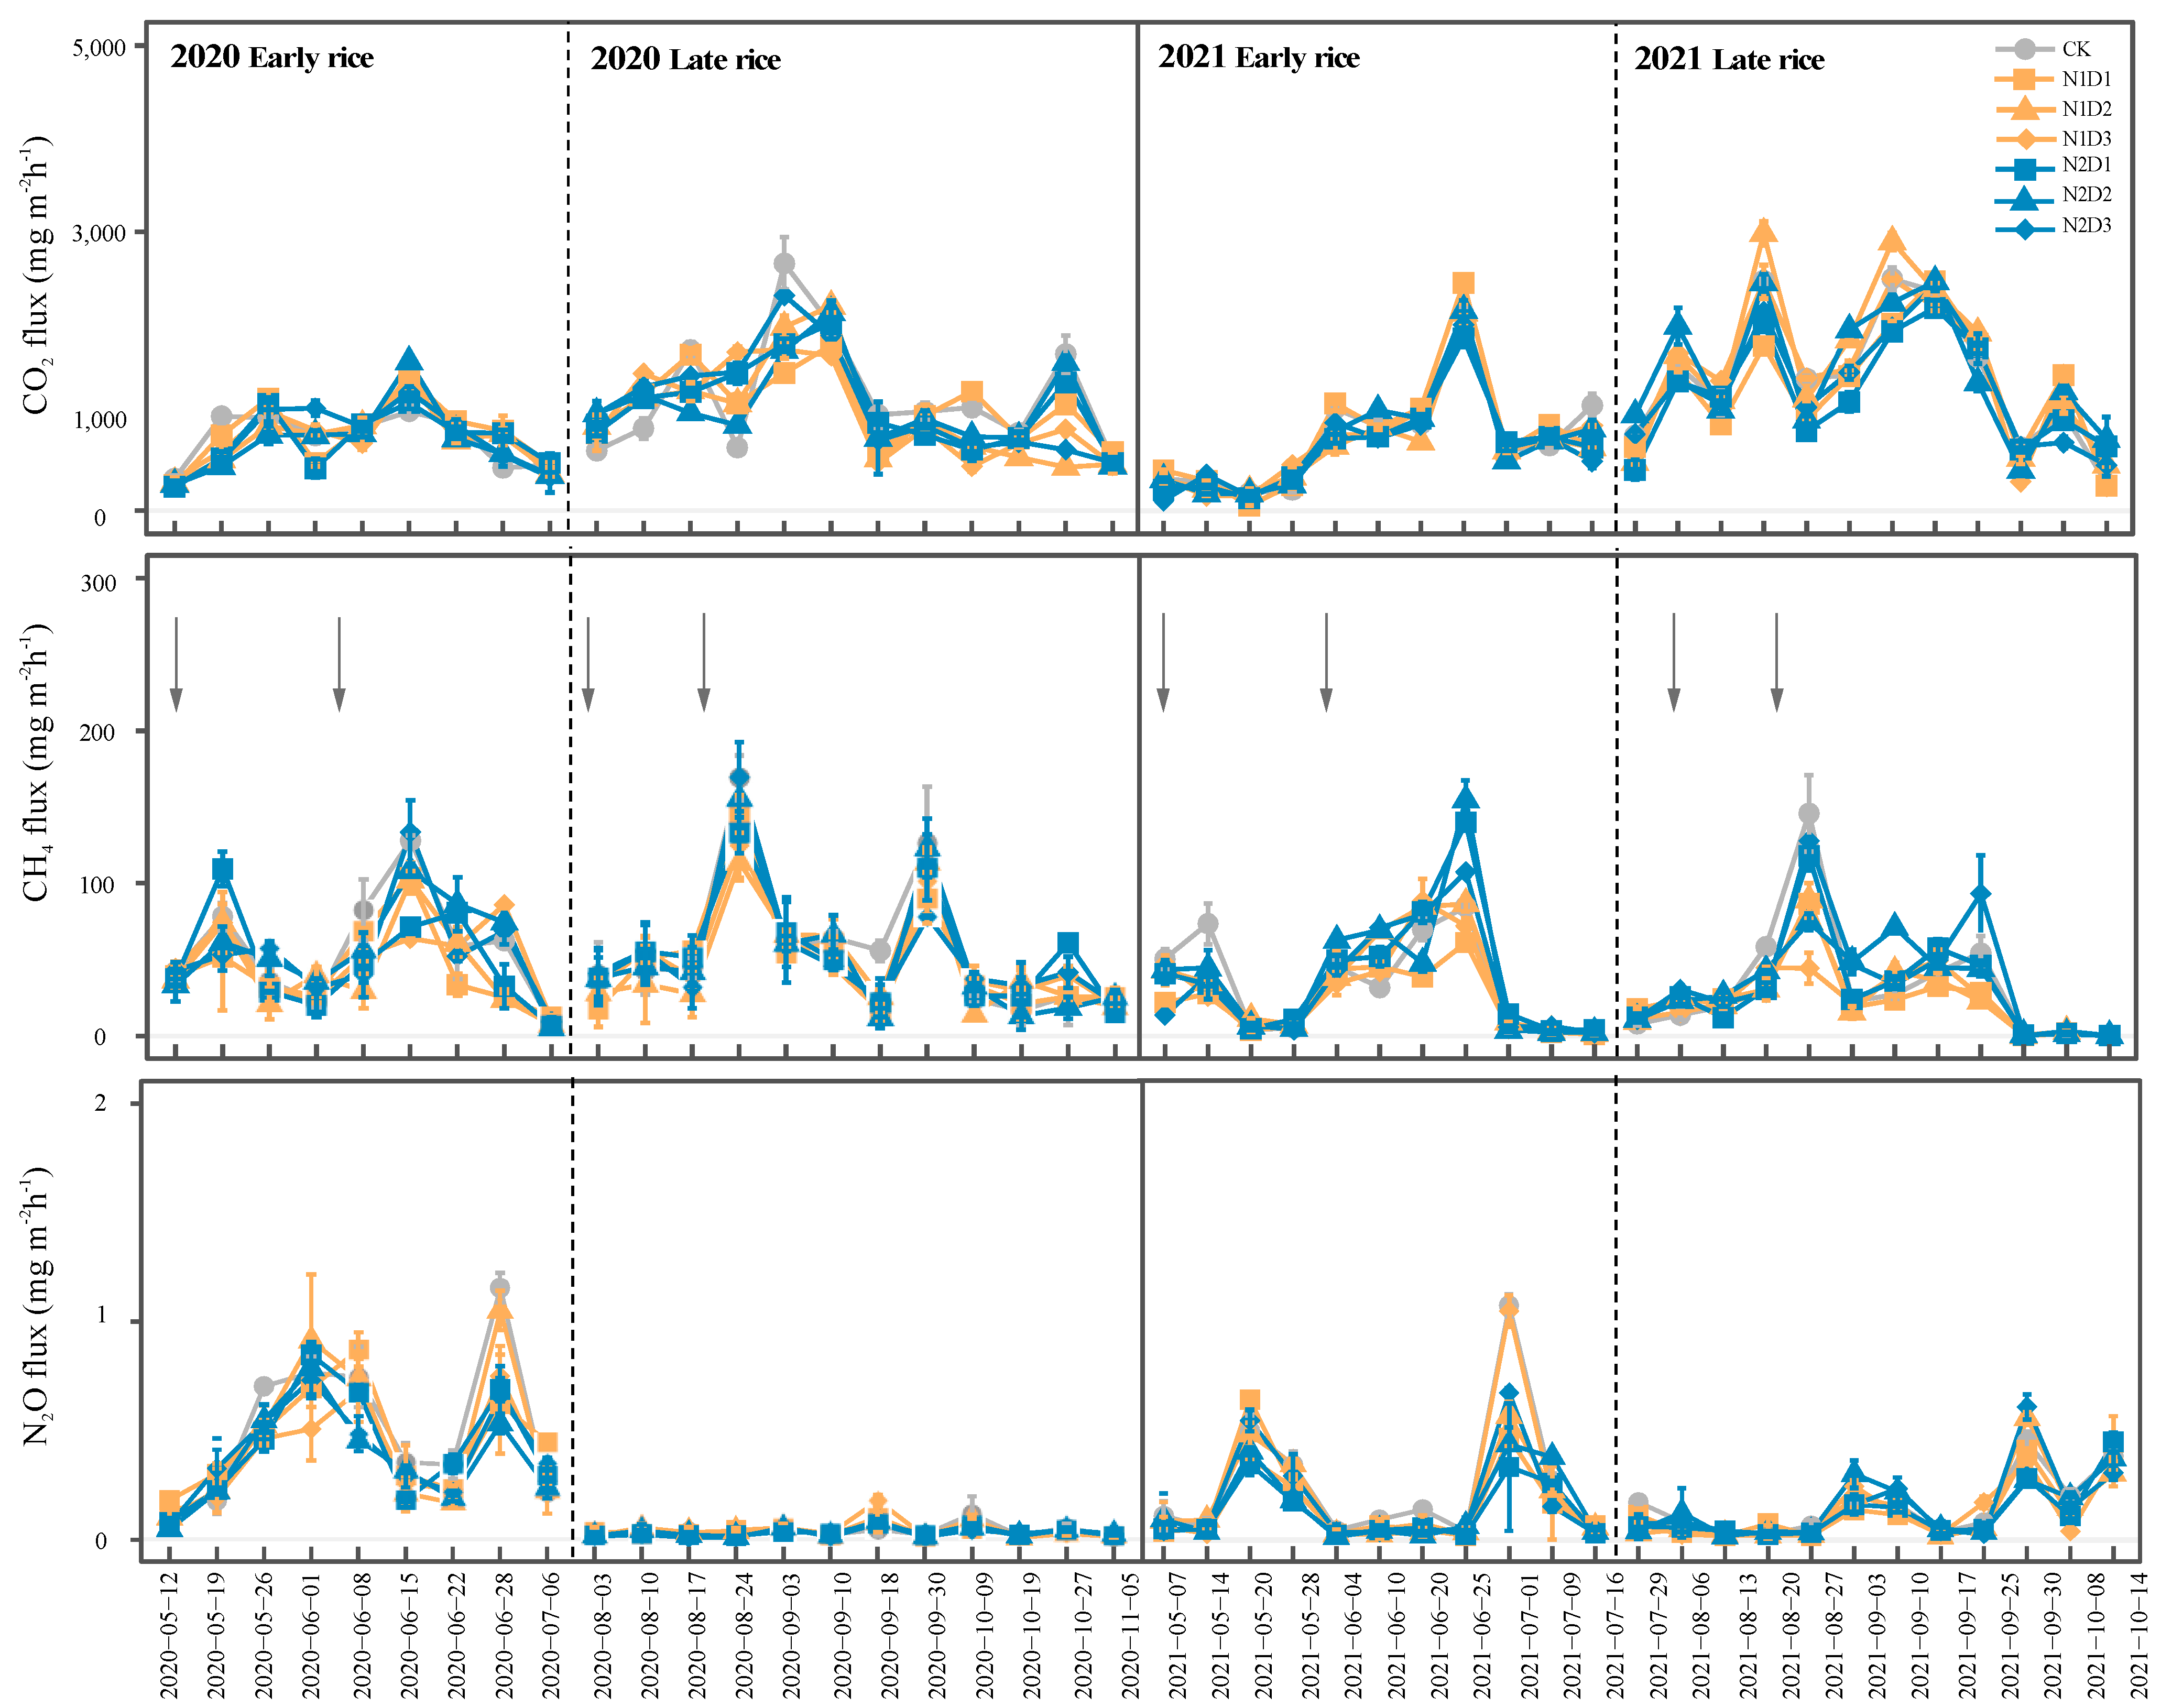
A similar variation trend in grain yield in the treatments was observed in 2020 and 2021 (Figure 3). Compared to CK, the yields of treatments under N1 were generally higher, whereas the yields of treatments under N2 were inconsistent. Nevertheless, crop yield increased with increasing plant density at the same N application rate. Under the N1 treatment, the annual rice yields of D2 and D3 increased by 3.42% and 10.11%, respectively, compared to those of D1 in 2020 and by 10.07% and 19.22% in 2021. Under the N2 treatment, the annual rice yields of D2 and D3 increased by 4.16% and 19.36%, respectively, compared with D1 in 2020 and by 9.27% and 10.36% in 2021. Among all the treatments, N1D3 showed the highest yield in both 2020 and 2021.

3.2. GHG Emissions

The trends in the CH4 emission flux showed similar variation patterns during the early and late rice seasons in 2020–2021 (Figure 4), with two obvious peaks occurring during the entire growth period. Compared to CK, the reduction in N fertilization significantly affected the cumulative CH4 emissions over the entire growing season; under the same planting density (Figure 5), the average CH4 cumulative emissions of N1D1 and N2D1 decreased by 18.57% and 9.75%, respectively, in 2020, and by 28.51% and 3.76% in 2021. Additionally, the CH4 emission flux generally increased with planting density. Specifically, in the N1 treatment group, the average CH4 cumulative emissions of N1D3 increased by 5.33% while those of N1D2 decreased by 1.34%, compared to that of N1D1 in 2020, whereas in 2021, N1D3 significantly increased by 11.19% and N1D2 increased by 25.98%. In the N2 treatment group, the average CH4 flux of N2D2 and N2D3 increased by 3.47% and 1.82%, respectively, compared to that of N2D1 in 2020, and by 3.4% and 5.7%, respectively, in 2021. In short, the input of N fertilizer could significantly affect the cumulative emission of CH4 compared to the planting density, and reducing N by 10% could significantly reduce CH4 emissions.
The CO2 flux increased with rice growth, peaked at the full heading stage, and then decreased. The annual cumulative CO2 ranged from 34,362.59 to 39,826.42 kg ha−1 in 2020 and from 36,190.55 to 40,949.18 kg ha−1 in 2021. Compared to CK, the reduced N fertilizer treatments lowered the emissions flux of CO2 under the same transplanting density but increased with increasing planting density. In the N1 treatment group, the average accumulated CO2 emissions of D2 and D3 increased by 7.02% and 4.83%, respectively, compared with that of D1, and significantly increased by 13.50% and 4.33% in the N2 treatment group in 2021.
N2O flux peaks were mainly observed after N applications, through the duration of the midseason drainage, and under dry-wet alternation conditions. N, year, and rice season had significant effects on N2O emissions; specifically, cumulative N2O emissions were lower in the late rice season than those in the early rice season. The cumulative N2O emissions significantly decreased with the reduction in N fertilizer application. Compared with CK, the annual cumulative N2O emissions of N1 and N2 decreased significantly by 7.75% and 14.87% in 2020, respectively, and by 27.04% and 39.34%, respectively, in 2021. At the same N concentration, there was no obvious pattern in N2O emissions with increasing planting density.

3.3. Content and Storage of Soil Organic Carbon

The soil organic carbon (SOC) content varied between 21.86 g/kg and 23.51 g/kg at 0–20 cm soil depth, which was higher than that of the initial content, 19.85 g/kg (Table 3). There was no significant difference in soil bulk, and an increasing trend in bulk was observed with higher planting density. Compared to the initial SOC storage in 2018, SOC storage increased from 12,634.5 to 15,188.6 kg ha−1 in 2021. The SOC storage under reduced N combined with increased plant density was higher than that of the CK, except for N2D3, which had a higher SOCSR rate. The SOCSR rate generally increased with higher plant density, but there were no significant differences based on N fertilizer amounts.

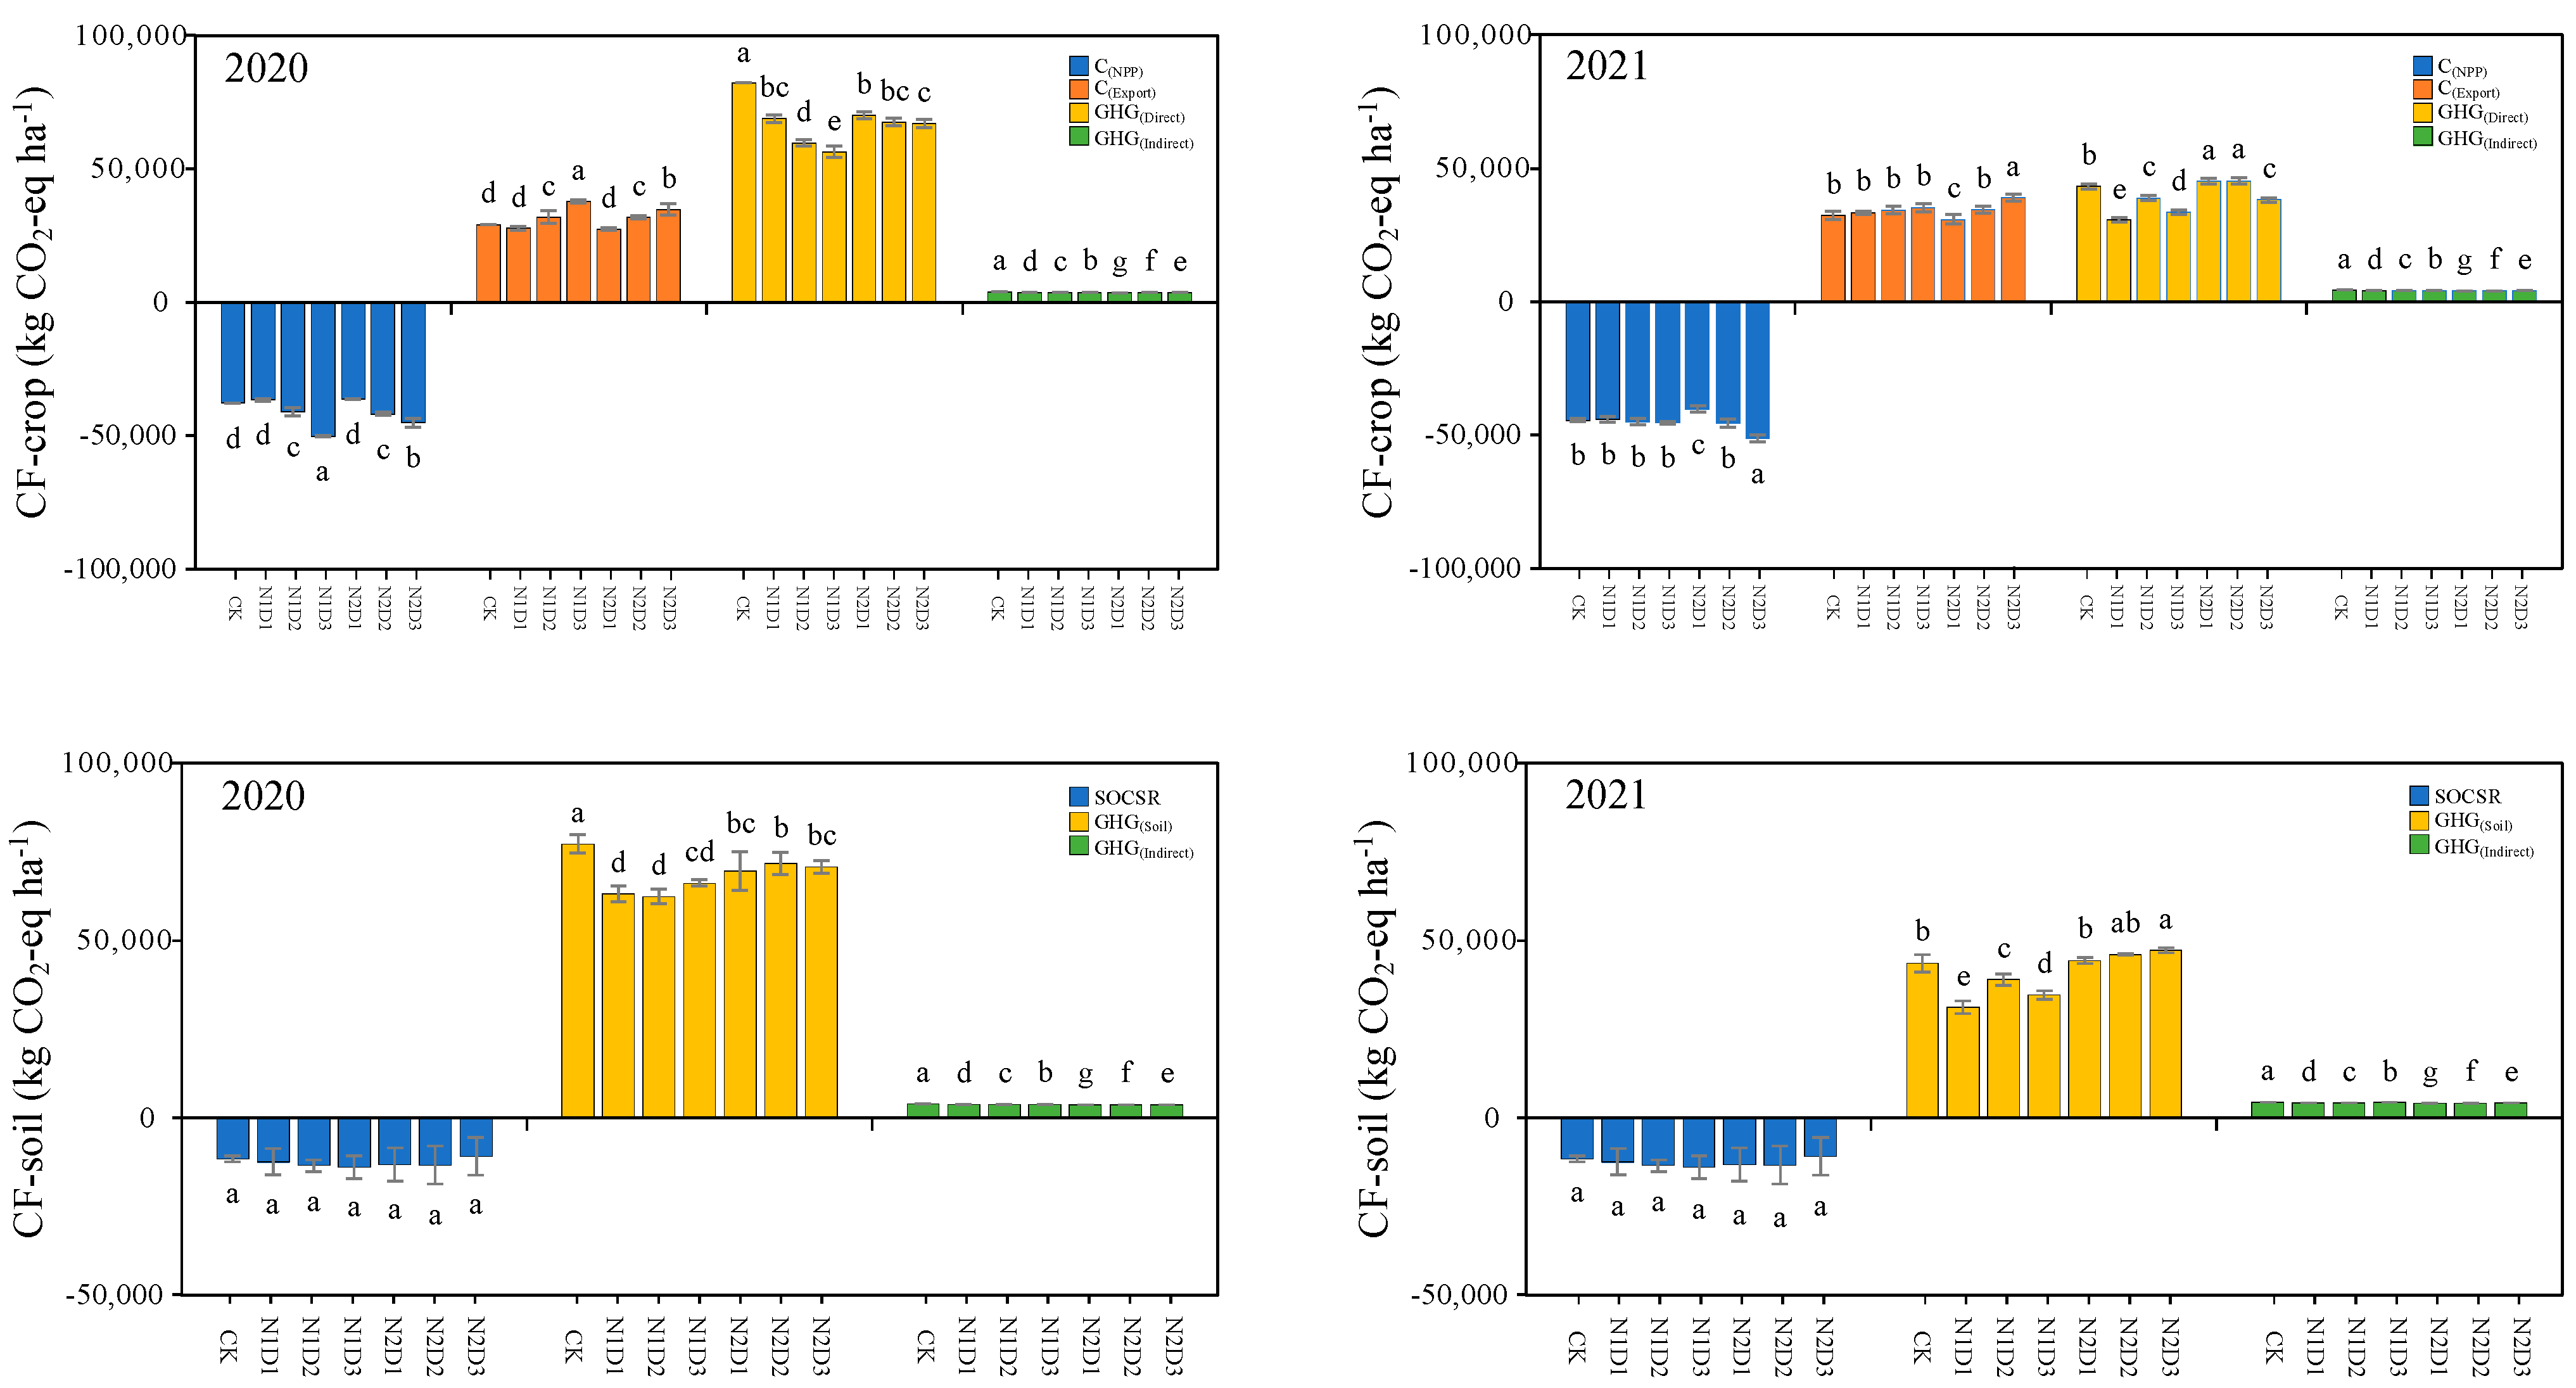
3.4. Constitutions of the Crop-Based Carbon Footprint (CBCF) and Soil-Based Carbon Footprint (SBCF)
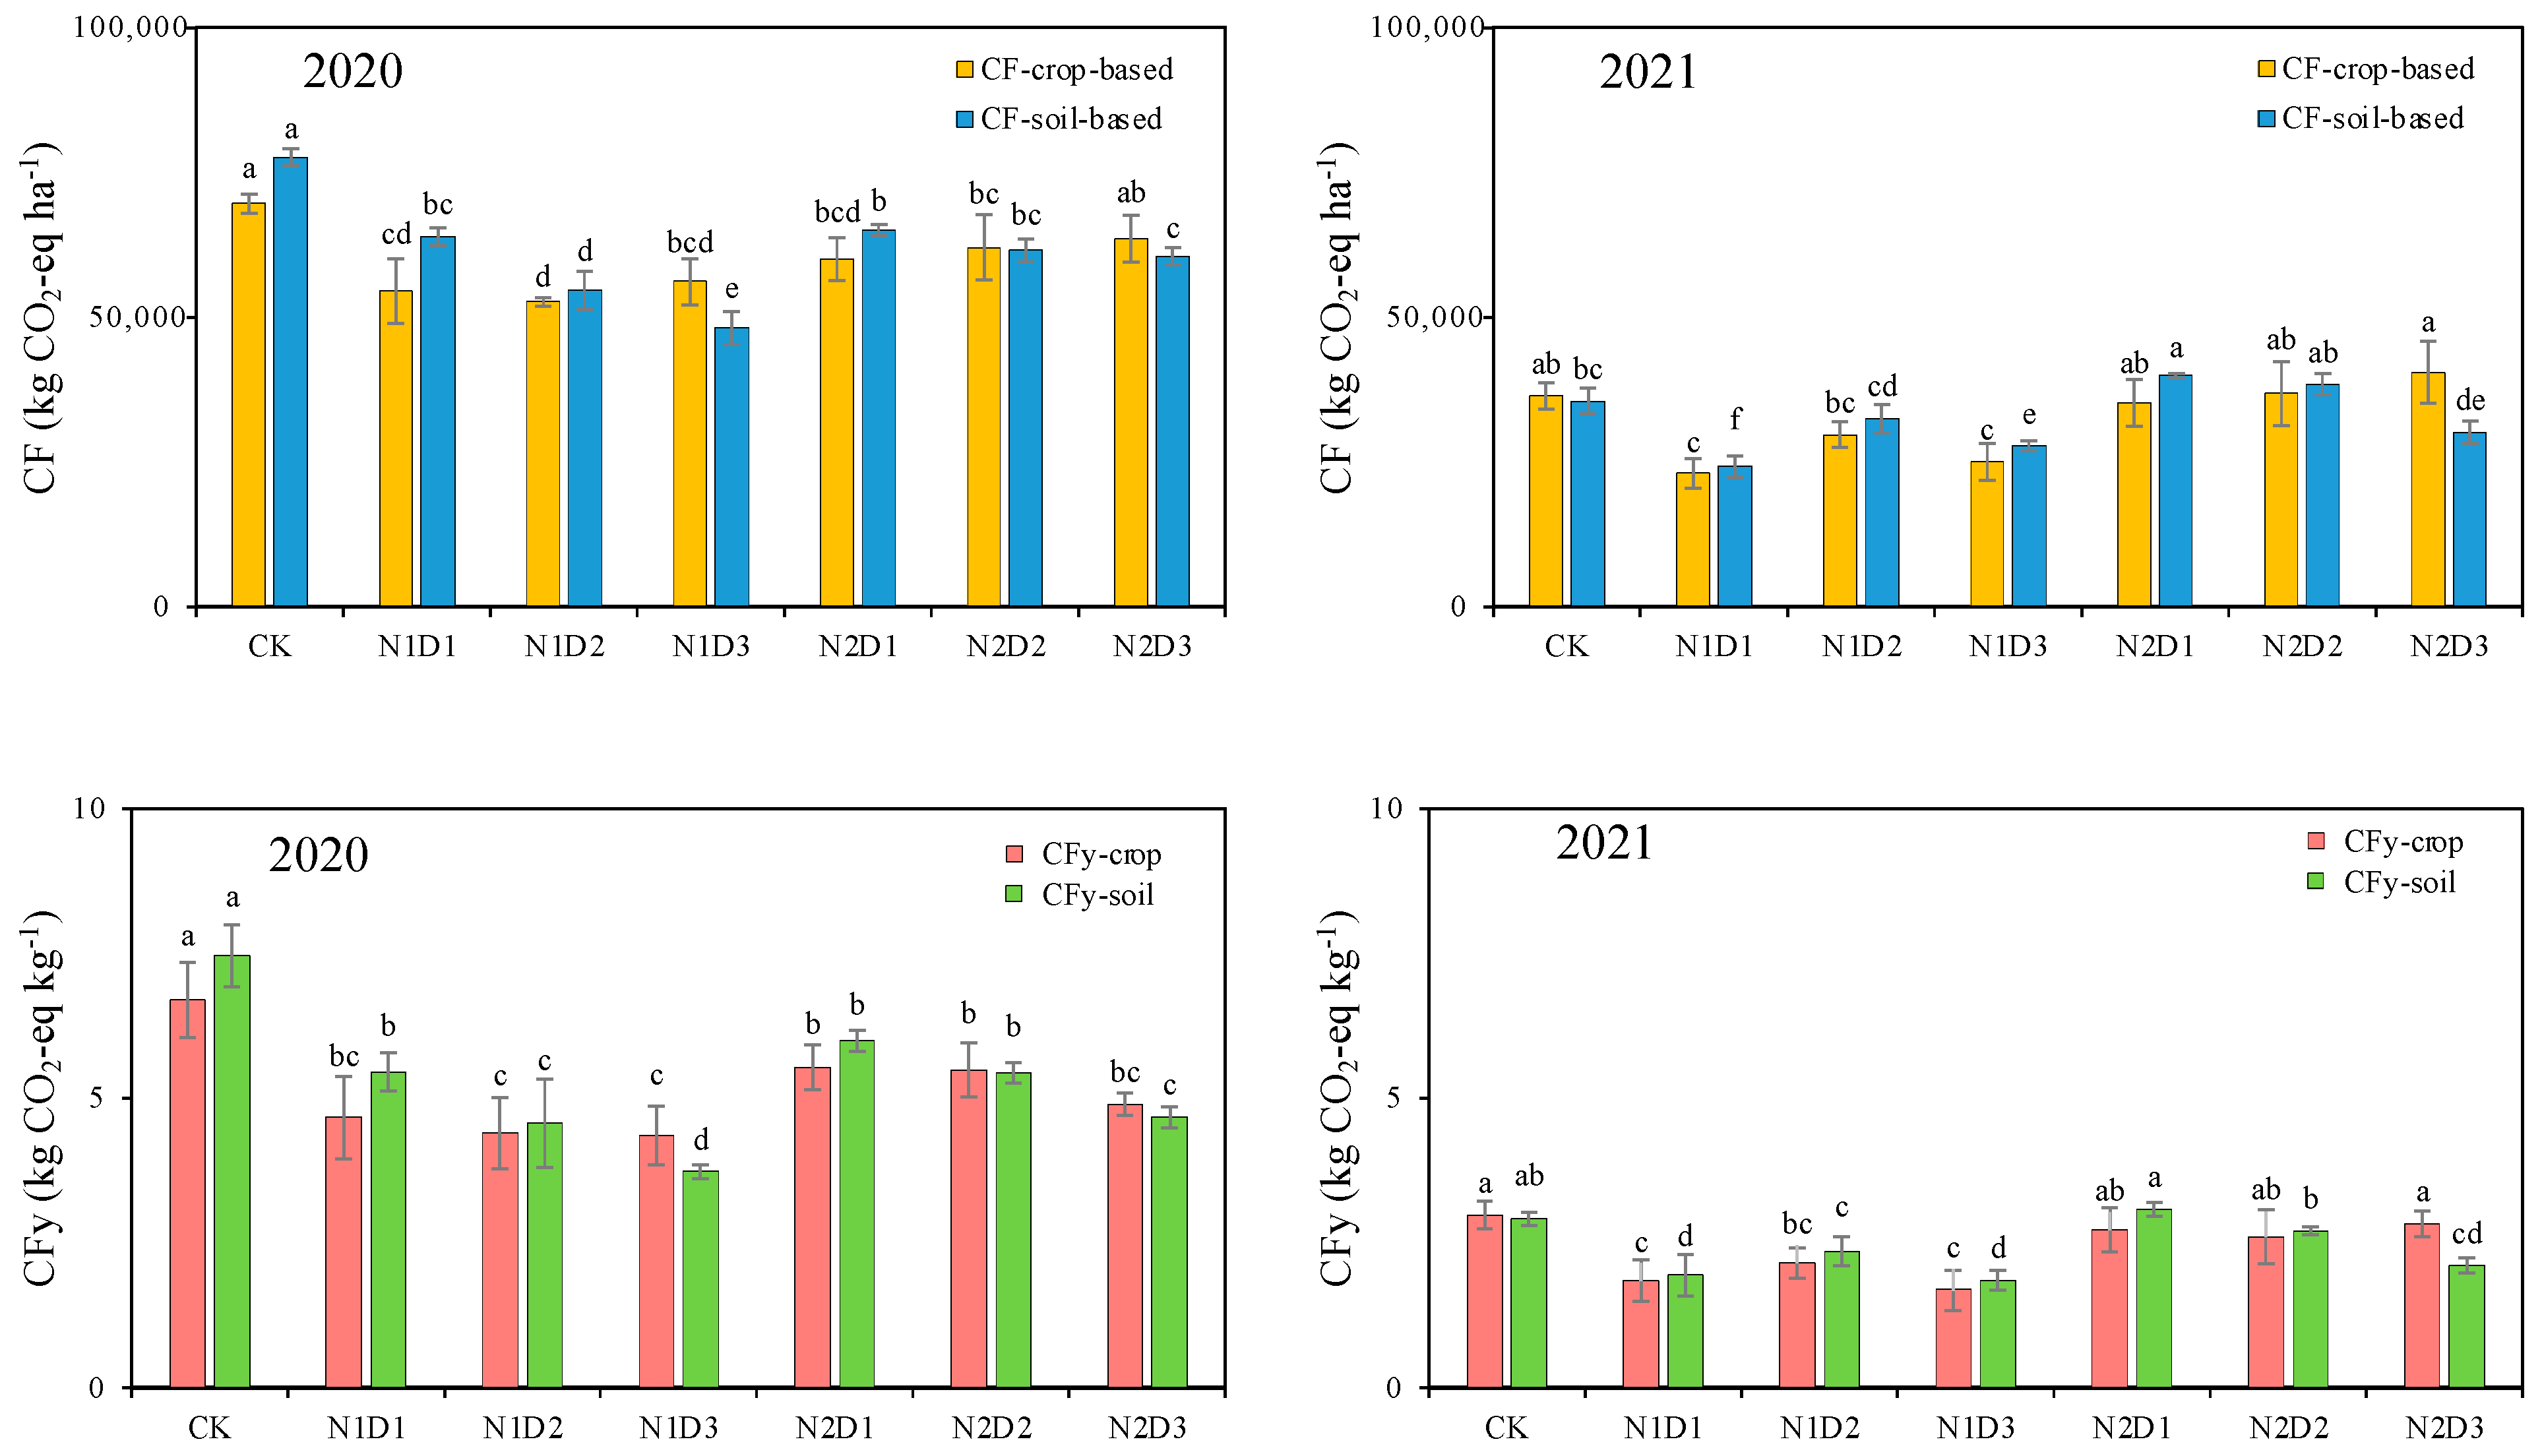
The crop-based carbon footprint (CBCF) of the farming system consisted of: C(NPP), C(Export), C(Indirect), and C(Direct), among which C(Direct) was the most influential factor on CF and the least was C(Indirect). There was a significant interactive effect of N applications and planting density on the constitution of CF. Specifically, with a 10% reduction in N fertilizer, the annual C(NPP) of D1 did not decrease compared to that of CK in either 2020 or 2021 but did significantly decrease in both years under a 20% reduction in N fertilizer (Figure 6). Under the N1 treatment, the annual C(NPP) of D2 and D3 increased by 11.66% and 36.95%, respectively, compared to that of D1 in 2020, and by 1.91% and 2.95% in 2021. Under the N2 treatment, the annual C(NPP) of D2 and D3 increased by 15.04% and 24.12%, respectively, compared to that of D1 in 2020, and by 13.31% and 27.45% in 2021. The C(Indirect) of CK was significantly higher than that of the other treatments. With increasing planting density, C(Indirect) increased. The constitution of GHG(Direct) included the cumulative emissions of CH4, N2O, and Rh, of which methane had the highest emissions. The annual GHG(Direct) under the N1 treatment in 2020 and 2021 decreased by 24.99% and 20.40% compared to that of CK, respectively, while that of N2 in 2020 and 2021 decreased by 16.92% and 0.64%, respectively. Under the N1 treatment, the annual GHG(Direct) emissions of D2 and D3 decreased by 13.37% and 17.96%, respectively, compared to that of D1 in 2020, and by 26.61% and 9.68%, respectively, in 2021. Under the N2 treatment, the annual GHG(Direct) of D2 and D3 decreased by 3.68% and 4.54%, respectively, compared to that of D1 in 2020, and 15.47% in 2021; however, D2 increased by 0.39% compared to D1 in 2021. There was no obvious pattern in GHG(Direct) emissions with an increase in plant density in this study.
The SBCF of the rice system included three parts: C(SOCSR), C(Indirect), and C(Direct). C(SOCSR) is the SOC storage fixed in the soil. There was no significant difference between N reduction and densification on C(SOCSR) in this study. The composition of GHG(Soil) was the cumulative emissions of CH4 and N2O; the annual GHG(Soil) of N1 in 2020 and 2021 decreased by 18.24% and 28.44%, respectively, compared to that of CK, while that of N2 in 2020 decreased by 9.90%, but increased by 1.71% in 2021, compared to that of CK. Under the N1 treatment, the annual GHG(Soil) of D2 decreased by 1.23% compared to that of D1 in 2020, while that of D3 increased by 4.77%. However, the annual GHG(Soil) of D2 and D3 increased by 25.08% and 11.18%, respectively, compared to that of D1 in 2021. Under the N2 treatment, the annual GHG(Soil) of D2 and D3 increased by 3.08% and 1.63%, respectively, compared to that of D1 in 2020, and by 3.95% and 6.57%, respectively, in 2021.

3.5. CF and CFy

The CF and yield-scaled CF (CFy), the latter of which is a commonly used indicator of food security and environmental quality, of the treatment groups were estimated using crop- and soil-based approaches in 2020 and 2021, wherein we established that paddy fields acted as a carbon source across treatments. Overall, the soil- and crop-based CFs were fairly similar. The soil-based CF values ranged from 48,149.13 to 77,582.10 kg CO2-eq ha−1, while crop-based CF ranged from 52,650.05 to 69,577.46 kg CO2-eq ha−1 in 2020 (Figure 7). In 2021, the crop-based CF ranged from 23,000.16 to 40,485.85 kg CO2-eq ha−1, while that of the soil-based CF ranged from 24,240.81 to 39,930.85 kg CO2-eq ha−1. The N, planting density, and their interaction had significant effects on CF; the crop-based CF of N1 and N2 decreased significantly, by 21.63% and 13.69%, respectively, compared to that of CK in 2020, and by 36.74% and 3.10% in 2021. The soil-based CF of N1 and N2 decreased significantly by 17.62% and 16.16%, respectively, compared with that of CK in 2020; however, the CF of N1 decreased by 31.82% and that of N2 increased by 12.31% in 2021. Compared to CK and the N2 treatment group, the N1 treatment group had the lowest CF under the same planting density. Conversely, at the same N level, greater plant density had no obvious effects on CF.
The N1 treatment had the lowest CFy, though all N reduction and plant density treatments resulted in CFy lower than that of the CK. The crop-based CFy values of N1 and N2 decreased by 30.21% and 17.35%, respectively, compared to those of the CK in 2020, and by 38.15% and 8.71% in 2021. A similar trend was observed in soil-based CFy. Under the concentration of N1, the annual CFy of D2 and D3 decreased by 5.91% and 6.69%, respectively, compared to that of D1 in 2020, whereas the annual CFy of D2 increased by 16.67% while D3 decreased by 8.61% in 2021 compared to D1. A similar result was obtained on soil-based CFs. Finally, the N1D3 treatment had the lowest overall CF.

4. Discussion

4.1. GHG Emissions and SOC

Generally, the production, oxidation, and transport of CH4 in paddy fields is the main determinants of the magnitude of CH4 emissions from rice production [25]. In this study, the annual cumulative emission of CH4 in 2020 ranged from 1770.41 to 2203.52 kg ha−1, and from 956.71 to 1354.33 kg ha−1 in 2021, which is a 0.50–1.99-fold decrease, likely because the cumulative emission of CH4 in the late rice season in 2020 accounted for 1179.76–1383.94 kg ha−1. During the late rice season in 2020, the average precipitation was 595.08 mm, and that in 2021 was 393.60 mm. The continuous rainfall in September and October 2020 caused long-term flooding in the paddy fields, creating a long-term environment where methane emissions increased [26]. As a result, cumulative methane emissions significantly increased in the late rice season in 2020.
N fertilizer usage [27] is another important factor affecting methane emissions from paddy fields. Here, the annual methane emission flux decreased with the decrease in N application, the CH4 emissions were lowest when N was reduced by 10%, followed by N reduction by 20%, which may be because the reduction in N fertilizer application increased the N limit of the soil and accelerated the decomposition of soil organic matter to meet the nutrient meteorological requirements of micro-organisms, thus providing more substrates for methanogens [28]. We found that the soil total N content also decreased with a decrease in the application of N fertilizer (Supplementary Figure S1). This result is consistent with those of Zhou [16], who reported that methane emissions increased as N fertilizer application rates decreased, as well as those of another study [29], where CH4 emissions increased at low inorganic fertilizer N rates (average of 79 kg N ha−1) based on a quantitative review and analysis. Taken together, these results suggest that lower N fertilizer application rates inhibit methane oxidation and emissions. In this study, increasing plant density increased methane emissions, likely due to the increased number of tillers per unit area, which increased root density, whose exudates enter the soil and act as a substrate for methane production [30]. Moreover, more tillers of rice also provide a larger pathway for CH4 transport to the atmosphere.
In this study, the cumulative annual N2O emissions across 2021 and 2020 were 4.47–7.87 kg ha−1, of which the cumulative N2O emissions in the early rice season in 2020 were higher than those in the late rice season, which may be due to continuous rainfall in the late rice season, as long-term flooding inhibited N2O emissions. In this study, the annual cumulative emission of nitrous oxide decreased with decreasing N application. Our findings are consistent with those of other studies that have shown a positive correlation between N2O emissions and N application rates [14,29,31]. Conversely, the N application rate decreased, the soil N content decreased (Supplementary Figure S1), and fewer substrates, such as NO3- and NH4+, were provided for the nitrification and denitrification processes. In addition, N fertilizer application can stimulate the growth of crop roots and increase root exudates [22], thus affecting the activity and quantity of micro-organisms [32].
The cumulative annual emissions of CO2 from 2021 to 2022 ranged from 34,362.59 to 42,035.15 kg ha−1, wherein emissions in the late rice season were higher than those in the early rice season, possibly due to higher temperatures in the late rice season. In this study, with the reduction in N application, the annual cumulative emission of CO2 decreased, whereas increasing the planting density promoted the annual growth of CO2 emissions, thereby increasing the annual cumulative emissions. CO2 emissions are mainly derived from the autotrophic respiration of plants and the anaerobic respiration of the soil. Reduced N application results in smaller rice plants; thus, less carbon is input into the soil, and CO2 emissions are consequently reduced; however, increasing the plant density increased the carbon input per unit area and promoted soil anaerobic respiration.
Paddy soil is an important carbon sink, and long-term cultivation with water can increase the organic soil matter in paddies [33]. In this study, long-term cultivation of rice increased SOC accumulation as carbon entered the soil through rhizosphere deposition as the rice grew [34,35]. The paddy soil was able to photocontract atmospheric CO2 and convert it into SOC via breakdown by micro-organisms [35,36], resulting in an increase in organic matter in the paddy fields. Reducing N fertilizer application had no significant effect on SOC, but increased plant density increased soil carbon input. The biomass per unit area increased; therefore, the amount of carbon deposited by roots increased, resulting in an increase in the organic carbon pool [30].

4.2. Soil- and Crop-Based Carbon Footprints

Crop- and soil-based carbon footprint assessment methods require different boundaries [19]; crop-based carbon footprint assessment method considers the entire farmland ecosystem, calculations rely only on the carbon fixed by crop biomass [23]. The soil-based carbon footprint assessment method focuses on changes in the SOC pool as drivers of carbon sequestration [37]. In accordance with other studies, our findings suggest that the paddy field ecosystem served as a carbon source, indicating that the GHG emissions emitted by the paddy fields were greater than those fixed by the system [23]. Although the system boundaries of the two carbon footprint assessment methods are different, we observed similar effects of reduced N and increased plant density on both soil- and crop-based CFs. In this study, analysis of the crop-based CF suggests that when crop straw was removed from the field, the carbon input from the field accumulated in fallen leaves, plant debris, and root exudates of rice. For soil-based CF, the increased activity of micro-organisms likely drove the decrease in emissions. In terms of carbon footprint composition, the carbon source mainly depended on the direct emission of GHGs in both CF types, though it is clear that CH4 emissions are a primary contributor to the direct emission of greenhouse gases from paddy fields, as shown in previous studies [38,39,40]. For example, Zhou [41] also reported that reducing paddy field CH4 emissions may be paramount to reducing the overall CF of rice production. Moreover, numerous studies have shown that lower tillage rates [42], alternating dry and wet conditions, midseason flooding [43], high-yield and low-carbon crop varieties [44], and the application of fertilizers in moderation [12] can effectively reduce methane emissions in paddy fields. In our study, the carbon footprint of rice was lowest when N was reduced by 10% (N1), whereas it increased when N was reduced by 20% (N2), when CH4 emissions increased. This result illustrates the threshold effect of reducing N fertilizer on the CF in rice production, which is also supported in Zhou’s study [16], wherein moderately reducing N most effectively lowered the CF. Based on the two carbon footprint assessment methods, greater plant density had no obvious effect on the CF of rice production in 2020 or 2021, suggesting that N fertilizer was the main factor affecting the CF.
The grain yield of crops results from total biomass accumulation and the partitioning of biomass into grains [45]. In this study, the results of the two-year experiment showed that reducing N fertilizer did not noticeably decrease rice yield, whereas increasing planting density significantly increased rice yield compared to that of CK because increasing the number of rice panicles increased overall biomass [46]. While rice yields were higher in the N1 treatment group than those in the N2 treatment group during the two-year study, likely because the N supply of rice in the vegetative growth stage was insufficient with a 20% reduction in N, which was not conducive to rice growth. Although increased density can offset the effect of reduced N application, excessive reductions in basic fertilizer input may lead to a reduction in rice yield [47]; when the N application rate is reduced by 20%, there is a greater risk of crop yields being reduced.
CFy is a comprehensive index for measuring carbon footprint and rice yield. In our study, although N2D3 had a low CFy, there were more environmental and reduced yield risks owing to its high greenhouse gas emissions and substantial N reduction. The 10% N reduction (N1) had the lowest CF and could also increase the grain yield by increasing the transplanting density, whereas N1D3 had the lowest CFy in the two-year study. Briefly, the best N application rate and transplant density treatment to achieve a high yield, low emissions, and low carbon footprint in rice production is N1D3.

5. Conclusions

In conclusion, this study shows that N fertilizer and transplanting density can significantly affect yield, GHG emissions, and both crop- and soil-based carbon footprints in southern China. In paddy fields, increasing the plant density can significantly increase rice yield, and appropriate N reduction can reduce methane emissions; however, excessive N reduction promotes methane emissions and can reduce yield. Therefore, excessive N reduction is not recommended in this study. Our results showed that of the different combinations of N reduction and plant densification, 10% N reduction combined with 20% densification (N1D3) significantly increased the yield of double-cropped rice and reduced its carbon footprint per unit yield. Thus, the conditions in N1D3 are recommended to achieve high yield and low environmental risk in double-cropping rice fields in southern China.

Supplementary Materials

The following supporting information can be downloaded at: https://www.mdpi.com/article/10.3390/agronomy14040803/s1, Figure S1: Total nitrogen content in 0–20 cm soil layer during late rice season in 2020 and 2021. Note: The vertical line on the broken line represents the standard error (n = 3). Different lowercase letters indicate significant differences between early, late rice seasons and the annual year at p < 0.05.

Author Contributions

Conceptualization, Z.F., X.Z., Y.X. and P.L.; Investigation, W.Z., H.G., M.Z., L.Z., Y.Y. and W.L.; Writing—original draft, W.Z.; Writing—review & editing, P.L.; Supervision, L.Y.; Funding acquisition, P.L. All authors have read and agreed to the published version of the manuscript.

Funding

This work was supported by the National Key Research and Development Program of China (2022YFD2300310, 2017YFD0300410).

Data Availability Statement

Dataset available on request from the authors.

Conflicts of Interest

Author Xinhui Zhao was employed by the company Yuan Longping High-Tech Agriculture Co. The remaining authors declare that the research was conducted in the absence of any commercial or financial relationships that could be construed as a potential conflict of interest.

References

  1. Liang, K.; Zhong, X.; Pan, J.; Huang, N.; Liu, Y.; Peng, B.; Fu, Y.; Hu, X. Reducing nitrogen surplus and environmental losses by optimized nitrogen and water management in double rice cropping system of South China. Agric. Ecosyst. Environ. 2019, 286, 106680. [Google Scholar] [CrossRef]
  2. Frolking, S.; Qiu, J.; Boles, S.; Xiao, X.; Liu, J.; Zhuang, Y.; Li, C.; Qin, X. Combining remote sensing and ground census data to develop new maps of the distribution of rice agriculture in China. Glob. Biogeochem. Cycles 2002, 16, 38-1–38-10. [Google Scholar] [CrossRef]
  3. Zhu, D.; Zhang, Y.; Chen, H.; Wang, Y. Development and Prospect of Cultivation Technology of Rice in China. China Rice 2021, 27, 45–49. [Google Scholar]
  4. Fu, Y.-Q.; Zhong, X.-H.; Zeng, J.-H.; Liang, K.-M.; Pan, J.-F.; Xin, Y.-F.; Liu, Y.-Z.; Hu, X.-Y.; Peng, B.-L.; Chen, R.-B.; et al. Improving grain yield, nitrogen use efficiency and radiation use efficiency by dense planting, with delayed and reduced nitrogen application, in double cropping rice in South China. J. Integr. Agric. 2021, 20, 565–580. [Google Scholar] [CrossRef]
  5. Huang, M.; Zou, Y.-B. Reducing environmental risk of nitrogen by popularizing mechanically dense transplanting for rice production in China. J. Integr. Agric. 2020, 19, 2362–2366. [Google Scholar] [CrossRef]
  6. Zhang, D.; Wang, H.; Pan, J.; Luo, J.; Liu, J.; Gu, B.; Liu, S.; Zhai, L.; Lindsey, S.; Zhang, Y.; et al. Nitrogen application rates need to be reduced for half of the rice paddy fields in China. Agric. Ecosyst. Environ. 2018, 265, 8–14. [Google Scholar] [CrossRef]
  7. Gu, B.; Ge, Y.; Ren, Y.; Xu, B.; Luo, W.; Jiang, H.; Gu, B.; Chang, J. Atmospheric reactive nitrogen in China: Sources, recent trends, and damage costs. Environ. Sci. Technol. 2012, 46, 9420–9427. [Google Scholar] [CrossRef]
  8. Wang, Z.; Zhang, X.; Liu, L.; Wang, S.; Zhao, L.; Wu, X.; Zhang, W.; Huang, X. Inhibition of methane emissions from Chinese rice fields by nitrogen deposition based on the DNDC model. Agric. Syst. 2020, 184, 102919. [Google Scholar] [CrossRef]
  9. Owino, O. Scientists torn over Kenya’s recent GM food ban. Nature 2012, 10. [Google Scholar] [CrossRef]
  10. Guo, J.H.; Liu, X.J.; Zhang, Y.; Shen, J.L.; Han, W.X.; Zhang, W.F.; Christie, P.; Goulding, K.W.T.; Vitousek, P.M.; Zhang, F.S. Significant Acidification in Major Chinese Croplands. Science 2010, 327, 1008–1010. [Google Scholar] [CrossRef]
  11. Zhang, G.B.; Huang, Q.; Song, K.F.; Yu, H.Y.; Ma, J.; Xu, H. Responses of greenhouse gas emissions and soil carbon and nitrogen sequestration to field management in the winter season: A 6-year measurement in a Chinese double-rice field. Agric. Ecosyst. Environ. 2021, 318, 107506. [Google Scholar] [CrossRef]
  12. Jiang, Z.H.; Zhong, Y.M.; Yang, J.P.; Wu, Y.X.Y.; Li, H.; Zheng, L. Effect of nitrogen fertilizer rates on carbon footprint and ecosystem service of carbon sequestration in rice production. Sci. Total Environ. 2019, 670, 210–217. [Google Scholar] [CrossRef] [PubMed]
  13. Xia, L.; Cao, L.; Yang, Y.; Ti, C.; Liu, Y.; Smith, P.; van Groenigen, K.J.; Lehmann, J.; Lal, R.; Butterbach-Bahl, K.; et al. Integrated biochar solutions can achieve carbon-neutral staple crop production. Nat. Food 2023, 4, 236–246. [Google Scholar] [CrossRef] [PubMed]
  14. Zhong, Y.; Wang, X.; Yang, J.; Zhao, X.; Ye, X. Exploring a suitable nitrogen fertilizer rate to reduce greenhouse gas emissions and ensure rice yields in paddy fields. Sci. Total Environ. 2016, 565, 420–426. [Google Scholar] [CrossRef] [PubMed]
  15. Jiang, J.; Jiang, S.; Xu, J.; Wang, J.; Li, Z.; Wu, J.; Zhang, J. Lowering nitrogen inputs and optimizing fertilizer types can reduce direct and indirect greenhouse gas emissions from rice-wheat rotation systems. Eur. J. Soil Biol. 2020, 97, 103152. [Google Scholar] [CrossRef]
  16. Zhou, W.; Long, W.; Wang, H.; Long, P.; Xu, Y.; Zhong, K.; Xiong, R.; Xie, F.; Chen, F.; Fu, Z. Reducing carbon footprints and increasing net ecosystem economic benefits through dense planting with less nitrogen in double-cropping rice systems. Sci. Total Environ. 2023, 891, 164756. [Google Scholar] [CrossRef] [PubMed]
  17. Xie, X.; Shan, S.; Wang, Y.; Cao, F.; Chen, J.; Huang, M.; Zou, Y. Dense planting with reducing nitrogen rate increased grain yield and nitrogen use efficiency in two hybrid rice varieties across two light conditions. Field Crops Res. 2019, 236, 24–32. [Google Scholar] [CrossRef]
  18. Huang, M.; Chen, J.N.; Cao, F.B.; Zou, Y.B. Increased hill density can compensate for yield loss from reduced nitrogen input in machine-transplanted double-cropped rice. Field Crops Res. 2018, 221, 333–338. [Google Scholar] [CrossRef]
  19. Huang, J.; Chen, Y.; Sui, P.; Gao, W. Estimation of net greenhouse gas balance using crop- and soil-based approaches: Two case studies. Sci. Total Environ. 2013, 456–457, 299–306. [Google Scholar] [CrossRef]
  20. West, T.O.; Marland, G. A synthesis of carbon sequestration, carbon emissions, and net carbon flux in agriculture: Comparing tillage practices in the United States. Agric. Ecosyst. Environ. 2002, 91, 217–232. [Google Scholar] [CrossRef]
  21. Jia, J.X.; Ma, Y.C.; Xiong, Z.Q. Net ecosystem carbon budget, net global warming potential and greenhouse gas intensity in intensive vegetable ecosystems in China. Agric. Ecosyst. Environ. 2012, 150, 27–37. [Google Scholar] [CrossRef]
  22. Deng, J.; Feng, X.; Wang, D.; Lu, J.; Chong, H.; Shang, C.; Liu, K.; Huang, L.; Tian, X.; Zhang, Y. Root morphological traits and distribution in direct-seeded rice under dense planting with reduced nitrogen. PLoS ONE 2020, 15, e0238362. [Google Scholar] [CrossRef] [PubMed]
  23. Xu, Y.; Liang, L.Q.; Wang, B.R.; Xiang, J.B.; Gao, M.T.; Fu, Z.Q.; Long, P.; Luo, H.B.; Huang, C. Conversion from double-season rice to ratoon rice paddy fields reduces carbon footprint and enhances net ecosystem economic benefit. Sci. Total Environ. 2022, 813, 152550. [Google Scholar] [CrossRef] [PubMed]
  24. Liu, X.; Xu, F.; Li, Z.; Chu, Q.; Yang, X.; Chen, F. The missteps, improvement and application of carbon footprint methodology in farmland ecosystems with the case study of analyzing the carbon efficiency of china’s intensive farming. Chin. J. Agric. Resour. Reg. Plan. 2013, 34, 1–11. [Google Scholar]
  25. Yao, Z.; Zheng, X.; Dong, H.; Wang, R.; Mei, B.; Zhu, J. A 3-year record of N2O and CH4 emissions from a sandy loam paddy during rice seasons as affected by different nitrogen application rates. Agric. Ecosyst. Environ. 2012, 152, 1–9. [Google Scholar] [CrossRef]
  26. He, G.; Wang, Z.; Cui, Z. Managing irrigation water for sustainable rice production in China. J. Clean. Prod. 2020, 245, 118928. [Google Scholar] [CrossRef]
  27. Linquist, B.A.; Anders, M.M.; Adviento-Borbe, M.A.; Chaney, R.L.; Nalley, L.L.; da Rosa, E.F.; van Kessel, C. Reducing greenhouse gas emissions, water use, and grain arsenic levels in rice systems. Glob. Chang. Biol. 2015, 21, 407–417. [Google Scholar] [CrossRef]
  28. Zhu, Z.; Ge, T.; Liu, S.; Hu, Y.; Ye, R.; Xiao, M.; Tong, C.; Kuzyakov, Y.; Wu, J. Rice rhizodeposits affect organic matter priming in paddy soil: The role of N fertilization and plant growth for enzyme activities, CO2 and CH4 emissions. Soil Biol. Biochem. 2018, 116, 369–377. [Google Scholar] [CrossRef]
  29. Linquist, B.A.; Adviento-Borbe, M.A.; Pittelkow, C.M.; van Kessel, C.; van Groenigen, K.J. Fertilizer management practices and greenhouse gas emissions from rice systems: A quantitative review and analysis. Field Crops Res. 2012, 135, 10–21. [Google Scholar] [CrossRef]
  30. Liu, C.; Lu, M.; Cui, J.; Li, B.; Fang, C. Effects of straw carbon input on carbon dynamics in agricultural soils: A meta-analysis. Glob. Chang. Biol. 2014, 20, 1366–1381. [Google Scholar] [CrossRef]
  31. Shang, Q.; Yang, X.; Gao, C.; Wu, P.; Liu, J.; Xu, Y.; Shen, Q.; Zou, J.; Guo, S. Net annual global warming potential and greenhouse gas intensity in Chinese double rice-cropping systems: A 3-year field measurement in long-term fertilizer experiments. Glob. Chang. Biol. 2011, 17, 2196–2210. [Google Scholar] [CrossRef]
  32. Wang, W.; Hou, Y.; Pan, W.; Vinay, N.; Mo, F.; Liao, Y.; Wen, X. Continuous application of conservation tillage affects in situ N2O emissions and nitrogen cycling gene abundances following nitrogen fertilization. Soil Biol. Biochem. 2021, 157, 108239. [Google Scholar] [CrossRef]
  33. Liu, Y.; Ge, T.; van Groenigen, K.J.; Yang, Y.; Wang, P.; Cheng, K.; Zhu, Z.; Wang, J.; Li, Y.; Guggenberger, G.; et al. Rice paddy soils are a quantitatively important carbon store according to a global synthesis. Commun. Earth Environ. 2021, 2, 154. [Google Scholar] [CrossRef]
  34. Ge, T.; Li, B.; Zhu, Z.; Hu, Y.; Yuan, H.; Dorodnikov, M.; Jones, D.L.; Wu, J.; Kuzyakov, Y. Rice rhizodeposition and its utilization by microbial groups depends on N fertilization. Biol. Fertil. Soils 2016, 53, 37–48. [Google Scholar] [CrossRef]
  35. Ge, T.; Yuan, H.; Zhu, H.; Wu, X.; Nie, S.a.; Liu, C.; Tong, C.; Wu, J.; Brookes, P. Biological carbon assimilation and dynamics in a flooded rice—Soil system. Soil Biol. Biochem. 2012, 48, 39–46. [Google Scholar] [CrossRef]
  36. Liu, Y.; Ge, T.; Zhu, Z.; Liu, S.; Luo, Y.; Li, Y.; Wang, P.; Gavrichkova, O.; Xu, X.; Wang, J.; et al. Carbon input and allocation by rice into paddy soils: A review. Soil Biol. Biochem. 2019, 133, 97–107. [Google Scholar] [CrossRef]
  37. Cui, H.; Wang, Y.; Luo, Y.; Jin, M.; Chen, J.; Pang, D.; Li, Y.; Wang, Z. Tillage strategies optimize SOC distribution to reduce carbon footprint. Soil Tillage Res. 2022, 223, 105499. [Google Scholar] [CrossRef]
  38. Xue, J.-F.; Pu, C.; Liu, S.-L.; Zhao, X.; Zhang, R.; Chen, F.; Xiao, X.-P.; Zhang, H.-L. Carbon and nitrogen footprint of double rice production in Southern China. Ecol. Indic. 2016, 64, 249–257. [Google Scholar] [CrossRef]
  39. Linquist, B.; van Groenigen, K.J.; Adviento-Borbe, M.A.; Pittelkow, C.; van Kessel, C. An agronomic assessment of greenhouse gas emissions from major cereal crops. Glob. Chang. Biol. 2012, 18, 194–209. [Google Scholar] [CrossRef]
  40. Cao, Y.; Tian, Y.; Yin, B.; Zhu, Z. Assessment of ammonia volatilization from paddy fields under crop management practices aimed to increase grain yield and N efficiency. Field Crops Res. 2013, 147, 23–31. [Google Scholar] [CrossRef]
  41. Zhou, Y.; Ji, Y.; Zhang, M.; Xu, Y.; Li, Z.; Tu, D.; Wu, W. Exploring a sustainable rice-cropping system to balance grain yield, environmental footprint and economic benefits in the middle and lower reaches of the Yangtze River in China. J. Clean. Prod. 2023, 404, 136988. [Google Scholar] [CrossRef]
  42. Chen, Z.; Zhang, H.; Xue, J.; Liu, S.; Chen, F. A nine-year study on the effects of tillage on net annual global warming potential in double rice-cropping systems in Southern China. Soil Tillage Res. 2021, 206, 104797. [Google Scholar] [CrossRef]
  43. Hou, H.; Peng, S.; Xu, J.; Yang, S.; Mao, Z. Seasonal variations of CH4 and N2O emissions in response to water management of paddy fields located in Southeast China. Chemosphere 2012, 89, 884–892. [Google Scholar] [CrossRef] [PubMed]
  44. Shi, Y.; Lou, Y.; Zhang, Y.; Xu, Z. Quantitative contributions of climate change, new cultivars adoption, and management practices to yield and global warming potential in rice-winter wheat rotation ecosystems. Agric. Syst. 2021, 190, 103087. [Google Scholar] [CrossRef]
  45. Fageria, N.K. Yield Physiology of Rice. J. Plant Nutr. 2007, 30, 843–879. [Google Scholar] [CrossRef]
  46. Huang, M.; Yang, C.; Ji, Q.; Jiang, L.; Tan, J.; Li, Y. Tillering responses of rice to plant density and nitrogen rate in a subtropical environment of southern China. Field Crops Res. 2013, 149, 187–192. [Google Scholar] [CrossRef]
  47. Zhu, X.; Zhang, J.; Zhang, Z.; Deng, A.; Zhang, W. Dense planting with less basal nitrogen fertilization might benefit rice cropping for high yield with less environmental impacts. J. Eur. J. Agron. 2016, 75, 50–59. [Google Scholar] [CrossRef]
Figure 1. The temperature and precipitation of the rice production in Yiyang during 2020 and 2021.
Agronomy 14 00803 g001
Figure 2. System boundaries of crop-based and soil-based carbon footprints in double-cropping rice production.
Agronomy 14 00803 g002
Figure 3. The grain yield of early-, late-, and annual rice from different reducing nitrogen combinations with planting density during 2020 and 2021. Note: Different lowercase letters indicate significant differences in different treatment between early, late rice seasons, and the annual year at p < 0.05.
Agronomy 14 00803 g003
Figure 4. Dynamics of CO2, CH4, and N2O fluxes under different reducing nitrogen combinations with planting density in early-rice, late-rice, and annual seasons from 2020 to 2021. Note: The black arrow indicates the date of nitrogen fertilization. The vertical line on the broken line represents the standard error (n = 3).
Agronomy 14 00803 g004
Figure 5. The cumulative emissions of CO2, CH4 and N2O fluxes under different reducing nitrogen combinations with planting density in early-rice, late-rice, and annual seasons from 2020 to 2021. Note: Different lowercase letters indicate significant differences in different treatment between early, late rice seasons, and the annual year at p < 0.05.
Agronomy 14 00803 g005
Figure 6. Crop-based CF and soil-based CF constitute different reducing nitrogen combinations with planting density in 2020–2021. Note: Different lowercase letters indicate significant differences in different treatment at p < 0.05.
Agronomy 14 00803 g006
Figure 7. CF and CFy are based on the carbon footprints of different reducing nitrogen combinations with planting density during 2020 and 2021. Different lowercase letters indicate significant differences in different treatment at p < 0.05.
Agronomy 14 00803 g007
Table 1. Nitrogen application rate and transplanting density of different treatments in the double rice.
SeasonTreatmentNitrogen Application Rate (kg ha−2)Transplanting Density
Total FertilizerBased FertilizerTiller FertilizerPanicle FertilizerPlant and Row Spacing (cm × cm)Hole Number
(×104 ha−2)
Early rice season(CK) N0D1120.060.036.024.020 × 2025
N1D1108.054.032.421.620 × 2025
N1D2108.054.032.421.620 × 16.730
N1D3108.054.032.421.617 × 16.735
N2D196.048.028.819.220 × 2025
N2D296.048.028.819.220 × 16.730
N2D396.048.028.819.217 × 16.735
Late rice season(CK) N0D1150.075.045.030.020 × 2025
N1D1135.067.540.527.020 × 2025
N1D2135.067.540.527.020 × 16.730
N1D3135.067.540.527.017 × 16.735
N2D1120.060.036.024.020 × 2025
N2D2120.060.036.024.020 × 16.730
N2D3120.060.036.024.017 × 16.735
Table 2. The indirect emission coefficient factors of the agricultural inputs.
ItemItem UnitIndirect Emissions CoefficientUnitReference
Nkg/hm24.96kg CO2 eq kg−1CLCD v0.7
Pkg/hm21.14kg CO2 eq kg−1CLCD v0.7
Kkg/hm20.66kg CO2 eq kg−1CLCD v0.7
Herbicideskg/hm210.15kg CO2 eq kg−1[23]
Pesticideskg/hm216.61kg CO2 eq kg−1[23]
Fungicideskg/hm210.57kg CO2 eq kg−1[23]
Rice seedkg/hm21.84kg CO2 eq kg−1[23]
Mechanical kg/hm23.32kg CO2 eq kg−1[24]
Electricity for irrigationKW·h−10.92kg CO2 eq kw·h−1[24]
laborperson·day·hm−20.86kg CO2 eq person−1 day−1[24]
Table 3. Effect of different reducing nitrogen combinations with planting density on SOC, BD, SOC stock, and SOCSR after four years from 2018 to 2021.
TreatmentSOC (g kg−1)BD (g cm−3)SOCstock2018 (kg ha−1)SOCstock2021 (kg ha−1)SOCSR (kg ha−1 yr−1)
CK22.95 ± 1.46 a1.12 ± 0.05 a38,641.33 ± 826.42 a51,275.83 ± 907.62 a3158.62 ± 226.91 a
N1D123.51 ± 0.13 a1.11 ± 0.08 a38,641.33 ± 826.42 a52,175.46 ± 4034.12 a3383.53 ± 1008.53 a
N1D223.09 ± 0.74 a1.16 ± 0.07 a38,641.33 ± 826.42 a53,419.07 ± 1811.19 a3694.43 ± 452.8 a
N1D322.57 ± 0.23 a1.19 ± 0.07 a38,641.33 ± 826.42 a53,829.9 ± 3541.71 a3797.14 ± 885.43 a
N2D122.81 ± 1.07 a1.16 ± 0.06 a38,641.33 ± 826.42 a53,025.76 ± 5170.44 a3596.11 ± 1292.61 a
N2D223.05 ± 1.64 a1.15 ± 0.1 a38,641.33 ± 826.42 a53,214.21 ± 5877.67 a3643.22 ± 1469.42 a
N2D321.86 ± 3 a1.16 ± 0.07 a38,641.33 ± 826.42 a50,567.32 ± 5801.25 a2981.5 ± 1450.31 a
Different lowercase letters indicate significant differences in different treatment p < 0.05.
Disclaimer/Publisher’s Note: The statements, opinions and data contained in all publications are solely those of the individual author(s) and contributor(s) and not of MDPI and/or the editor(s). MDPI and/or the editor(s) disclaim responsibility for any injury to people or property resulting from any ideas, methods, instructions or products referred to in the content.

