2. Materials and Methods
This study concentrated on the productivity and the level of biochemical components in tubers of 13 Russian potato cultivars and cv. ‘Nayada’ was used as the standard. Cv. ‘Nayada’ was released in 2004 by LiGa, which is a breeding company located in the North-Western region of Russia. Today, ‘Nayada’ is a commonly grown potato in Russia (
Table 1).
Most potato cultivars selected for this study were created in the A.G. Lorkh Potato Research Centre: ‘Barin’, ‘Grand’, ‘Kalibr’, ‘Krasa Meŝery’, ‘Krasavchik’, ‘Kumach’, ‘Plamya’, ‘Siverskij’, ‘Sudarynya’, ‘Fioletovyi’, ‘Eliksred’. Cvs. ‘Narymskaya nochka’ and ‘Sokur’ were created in the Siberian potato breeding center. Studied potato cultivars belong to mid-early and mid-season maturity groups, except for a mid-late cv. ‘Fioletovyi’ (
Table 1). Cvs. ‘Nayada’, ‘Sudarynya’ and ‘Grand’ were recommended for cultivation in various soil and climatic conditions. Cvs. ‘Barin’, ‘Kumach’, ‘Krasavchik’, ‘Kalibr’ and ‘Sokur’ are suited to different single regions. Potato cultivars were selected for this study because of their preliminary test for quality traits essential to consumers (taste, aroma and texture).
Experimental Design: Potato was cultivated in the experimental field of VIR (Pushkin and Pavlovsk Laboratories Research and Production Base of VIR) in the three years of 2019, 2020 and 2021 in a completely randomized design with three replications. Each cultivar was represented by 20 plants and planted in two-row plots of 10 tubers per row with inter-row spacing of 70 cm and intra-row spacing of 30 cm. The soil at the VIR experimental site is a soddy-podzolic sandy loam with light loam, a humus content of 3–3.5%, and pH 4.8–5.1. Agricultural practices for growing potatoes were used in accordance with standard practice for the North-Western region of the Russian Federation. Harvesting was carried out manually when the haulm began to turn yellow and died.
For biochemical analysis, the harvested tubers were bulked into two sets every year. The first set of tubers was analyzed immediately after harvesting (post-harvest analysis) and the second set was analyzed after 4–6 months of keeping in potato storage at 2–4 °C.
Every set of tubers consisted of samples for each potato cultivar in three replications. For every sample, 1 typical tuber (weighing 50–90 g) was chosen from each of the 10 plants selected among 20 plants of the cultivar. That is, a combined sample for each cultivar was formed in three reps, too. In preparation, biochemical probe tubers were cut lengthwise, and one-half was taken and crushed.
Biochemical analysis was carried out for 12 parameters, such as the content of dry matter, starch, protein, vitamin C, carotenoids and β-carotene, anthocyanins, reducing sugars and total sugars, phenolic compounds, as well as total acidity and antioxidant activity. Tuber samples were processed and analyzed as previously described in Ermakov et al. (1987) [
20]: the content of dry matter was determined gravimetrically.
Sugars were determined by the standard method: Bertrand’s method is based on the reducing action of sugar on the alkaline solution of tartrate complex with cupric ion; the cuprous oxide formed is dissolved in the warm acid solution of ferric alum. The ferric alum is reduced to FeSO
4, which is titrated against standardized KMnO
4; Cu equivalence is correlated with the table to obtain the amount of reducing sugar [
21].
Total (titratable) acidity was determined by titration of the extract with 0.1 N alkali converted to malic acid; ascorbic acid was determined by direct extraction from plants with 1% hydrochloric acid, followed by titration with 2,6-dichloroindofinol sodium salt hydrate (Fluka, Germany); and protein was determined according to Kjeldahl on the Foss Kjeltec 2200 analyzer (Sweden).
Starch was determined by the Evers polarimetric method, using an Atago 5952 SAC-i 589/882 automatic polarimeter/saccharimeter (Japan). The main method used to determine starch content is the polarimetric Evers method, the essence of which is the hydrolysis of starch to sugars by boiling in a solution of hydrochloric acid [
22].
Carotenoid pigments were isolated with 100% acetone and their absorption was measured on an Ultrospec II spectrophotometer (LKB Biochrom, Cambridge, England) at different wavelengths: 470 nm for carotenoids and 454 nm for β-carotene [
23].
Anthocyanins were obtained by the extraction with a 1% hydrochloric acid solution, followed by spectrophotometry at a wavelength of 510 nm, in terms of cyanidin3,5-diglycoside chloride (Phyproof, reference substance, Germany). The content of the total anthocyanins was calculated using the formula using the specific absorption index of cyanidin3,5-diglycoside chloride in a 1% aqueous solution of hydrochloric acid (453). To correct the green pigment content, the optical density of the obtained extracts was simultaneously determined at 657 nm [
24].
The main method for the phenolic substances determination was the spectrophotometric method with the Folin–Ciocalteu reagent [
25]. The phenolic compounds determination was based on the reduction of Mo6+ to Mo5+, as a result of which the analyzed solution acquires a blue color and becomes optically measurable. The extract is mixed with the Folin–Ciocalteu reagent and the saturated sodium carbonate solution in the 1:1:2 ratios, and the absorbance in the final mixture is measured at 765 nm. The obtained values are expressed in mg/100 g of the initial material in terms of gallic acid (mg GA/100 g). Total polyphenols in a sample are usually expressed as gallic acid equivalents, which are used as quantitative standards [
26,
27].
The DPPH method (a method for determining antioxidant activity by quenching free radicals using the 2,2-diphenyl-1-picrylhydrazyl reagent) is based on the reaction of a stable synthetic DPPH (2,2-diphenyl-1-picrylhydrazyl) radical dissolved in ethanol with an antioxidant sample presumably contained in the extract [
28]. When the DPPH free radical is reduced with antioxidant substances in the studied extracts, the saturated blue color of DPPH gradually changes to yellow: the free radical of 2,2-diphenyl-1-picrylhydrazyl (with a saturated blue color) transforms into a stable molecule of yellow-colored 2,2-diphenyl-1-picrylhydrazyl. Free radicals of 2,2-diphenyl-1-picrylhydrazyl were determined at a wavelength of 515 nm. The data are expressed in mg-eq.·ascorbic acid/100 g of substance.
All data are given in terms of fresh weight (FW).
Data analysis: The obtained results were subjected to two-way ANOVA in order to test the single effect of potato genotypes (cultivar), meteorological conditions (year) and their interaction on biochemical components in tubers. Tukey’s tests with a significance level of α = 0.05 were used for detailed analyses of the mean values by isolating statistically homogeneous groups. Results of biochemical analyses are presented as mean values plus standard deviation. The calculations were performed with the software package Statistica 13 (StatSoft Russia
http://statsoft.ru/company (accessed on 1 October 2021)).
In 2019–2022, weather conditions were characterized by contrasting periods of heat and moisture supply (
Table 2). In 2019, potato growth and development proceeded in conditions of low temperatures and lack of moisture in July and August with 75% and 34% of the normal precipitation, respectively; the growing season duration was 76–83 days. In 2020, growth and development took place at low temperatures and excess moisture in July and August with 116 and 130% of the monthly rainfall, respectively; the growing season lasted for 78 days. In 2021, the growth and development of potatoes took place in hot and dry weather in June and July with just 16 and 7% of the monthly rainfall, respectively, and during heavy rains in August, which resulted in 164% of the monthly rainfall (
Table 2). The growing season lasted for 84 days in 2021.
3. Results
Productivity: An important component of potato yield is the mean weight of tubers per plant. Potato cultivars noticeably differ in productivity, which ranged from 467 g/plant (‘Fioletovyi’) to 1398 g/plant (‘Kumach’) in 2019, from 539 g/plant (‘Fioletovyi’) to 1140 g/plant (‘Kumach’ and ‘Grand’) in 2020 and from 302 g/plant (‘Nayada’) to 1019 g/plant (‘Eliksred’) in 2021 (
Table 3).
Differences in productivity between cultivars in the years of the study were significant: the values of the Fisher’s test (F) were 9.69, 3.41 and 5.37 (p < 0.05) for the experimental data of 2019, 2020 and 2021, respectively. The effect size of the year factor was also significant with the Fisher’s test value of 3.18 (p = 0.0004). Also, we noted differences in the response of cultivars to weather conditions during the growing season. The productivity of cvs. ‘Sudarynya’ and ‘Eliksred’ during the years of research were stable at 958–1011 g/plant and 1019–1064 g/plant, respectively. Cvs. ‘Grand’, ‘Kalibr’, ‘Krasa Meŝery’ and ‘Kumach’ demonstrated high productivity (over 1000 g/plant) in 2019–2020 and reduced productivity (805–926 g/plant) in 2021. Cvs. ‘Plamya’ and ‘Siverskij’ were highly productive (over 1000 g/plant) in 2020, but lowered to 847–905 g/plant in 2019 and 2021. Cvs. ‘Grand’, ‘Kalibr’, ‘Krasa Meŝery’, ‘Kumach’, ‘Narymskaya nochka’, ‘Plamya’, ‘Sudarynya’ and ‘Eliksred’ displayed an average variability in yield, with a coefficient of variation from 10% to 20%. Four other cultivars displayed high variability in yield, with a coefficient of variation of 21–28%.
Biochemical composition of tubers: An analysis of the biochemical composition of tubers of 14 potato cultivars carried out after harvesting revealed significant differences in the content of the studied substances (
Table 4), the amount of which depended on the genotype (varietal characteristics) and meteorological condition in the growing season.
Dry matter: The main indicator of the quality and value of a potato is its chemical composition, i.e., the content of essential nutrients. The total content of these elements is represented by the dry matter indicator. The accumulation of dry matter mass in the studied potato cultivars ranged from 16.40 to 27.28%, with a mean content of 22.02% (
Table 5).
As a rule, tubers with dry matter content above 18–20% tend to be more susceptible to superficial injury, but such tubers are more easily boiled soft when cooked. For the manufacturing of potato products, tubers with a dry matter content of 20–25% are used, which results in an attractive color when frying potatoes. According to Gosstandard [
29], potato cultivars are subdivided into those with high dry matter content above 25%, as well as medium (22–25%) and low (less than 22%). The highest dry matter content (above 24%) is displayed by cv. ‘Sokur’. The content of dry matter is below 20% in tubers of cvs. ‘Kumach’ (19.30%) and ‘Fioletovyi’ (19.67%), which can be recommended for low-calorie diets. Most cultivars belong to the group of medium dry matter content; these are cvs. ‘Barin’, ‘Grand’, ‘Krasa Meŝery’, ‘Krasavchik’, ‘Narymskaya nochka’, ‘Sokur’, ‘Eliksred’ and ‘Nayada’. It should be noted that cv. ‘Nayada’ (reference) grown under favorable conditions turned out to be close to cultivars with high dry matter content that amounted to over 25% in 2019 and 2020. However, in the hot and dry year of 2021, the dry matter mass in tubers of cv. ‘Nayada’ decreased to 22.24%. High content of dry matter mass was noted in cvs. ‘Grand’ (23.71%) and ‘Krasavchik’ (23.31%).
In general, a tendency towards a decrease in the content of dry matter is characteristic of the process of potato storage (the mean value for the studied sample was 21.79%). The analysis of experimental data showed that the cultivars are divided into three groups: the first one includes those tubers that showed a decrease in the mass of dry matter after storage (‘Barin’, ‘Grand’, ‘Kalibr’, ‘Krasavchik’, ‘Narymskaya nochka’, ‘Plamya’ and ‘Eliksred’); the second contains those with an increase in the mass of dry matter after storage (‘Krasa Meŝery’, ‘Kumach’, ‘Siverskij’ and ‘Nayada’); and the third group unites cultivars in the tubers of which the mass of dry matter did not change (‘Sokur’, ‘Sudarynya’ and ‘Fioletovyi’).
Starch: In our research, starch amounting to 59–73% of dry mass was the main component of potato and the main carbohydrate, the content of which in the studied cultivars ranged from 8.96 to 20.08%, with a mean of 14.31% of fresh mass (
Table 6).
Depending on the cultivar, tubers contained from 10.70 to 20.08% starch, with a mean of 14.9%, after harvesting, while after storage the amount of starch decreased to 8.96–18.12% (mean of 13.70%). The observed decreased amount of starch in tubers during storage was a result of the hydrolytic decomposition of starch to sugars. The relationship between the starch content in tubers during the post-harvest analysis and the post-storage is medium, and the correlation coefficient (R) is 0.61.
According to the value of starch variation coefficient (V) (
Table 6), it can be concluded that five cultivars, namely ‘Grand’, ‘Kalibr’, ‘Siverskij’, ‘Sokur’ and ‘Sudarynya’, are distinguished by low variability (less than 10%) in the starch content in tubers. For other cultivars, medium variation from 10 to 20% in the starch content was established.
The greatest amount of accumulated starch was noted in tubers of cv. ‘Sokur’, both after harvesting (16.71%) and after storage (15.95%). Cv. ‘Grand’ also had 16.35% starch in tubers after harvesting, but after storage, their starchiness decreased to 14.56% (
Table 4 and
Table 6). Cv. ‘Nayada’ (reference) differed from all other cultivars by an increase in the amount of starch after storage (up to 16.34% vs. 16.07%). Cvs. ‘Kumach’ and ‘Fioletovyi’ can be recommended for low-calorie diets, as they are characterized by the lowest starch content of 12% or below.
According to the literature, the starch content depends on the precocity of varieties, this indicator being higher in mid-season and mid-late cultivars, compared with early and mid-early ones [
30]. In our research, the mid-late cv. ‘Fioletovyi’ accumulated little starch (12.75%) in comparison with other cultivars. It is obvious that the short growing season (84–88 days) in the conditions of the North-Western region is insufficient for a cultivar from the mid-late maturity group and is the reason for the low yield and starch content in cv. ‘Fioletovyi’. Cultivars with the maximum starch content (‘Grand’, ‘Sokur’ and ‘Nayada’) are mid-early ones. The production of starch requires potato cultivars with a high amount, from 15 to 25% starch, in tubers [
31], and seven cultivars—’Grand’, ‘Krasa Meŝery’, ‘Krasavchik’, ‘Narymskaya nochka’, ‘Sokur’, ‘Eliksred’ and ‘Nayada’—meet these criteria.
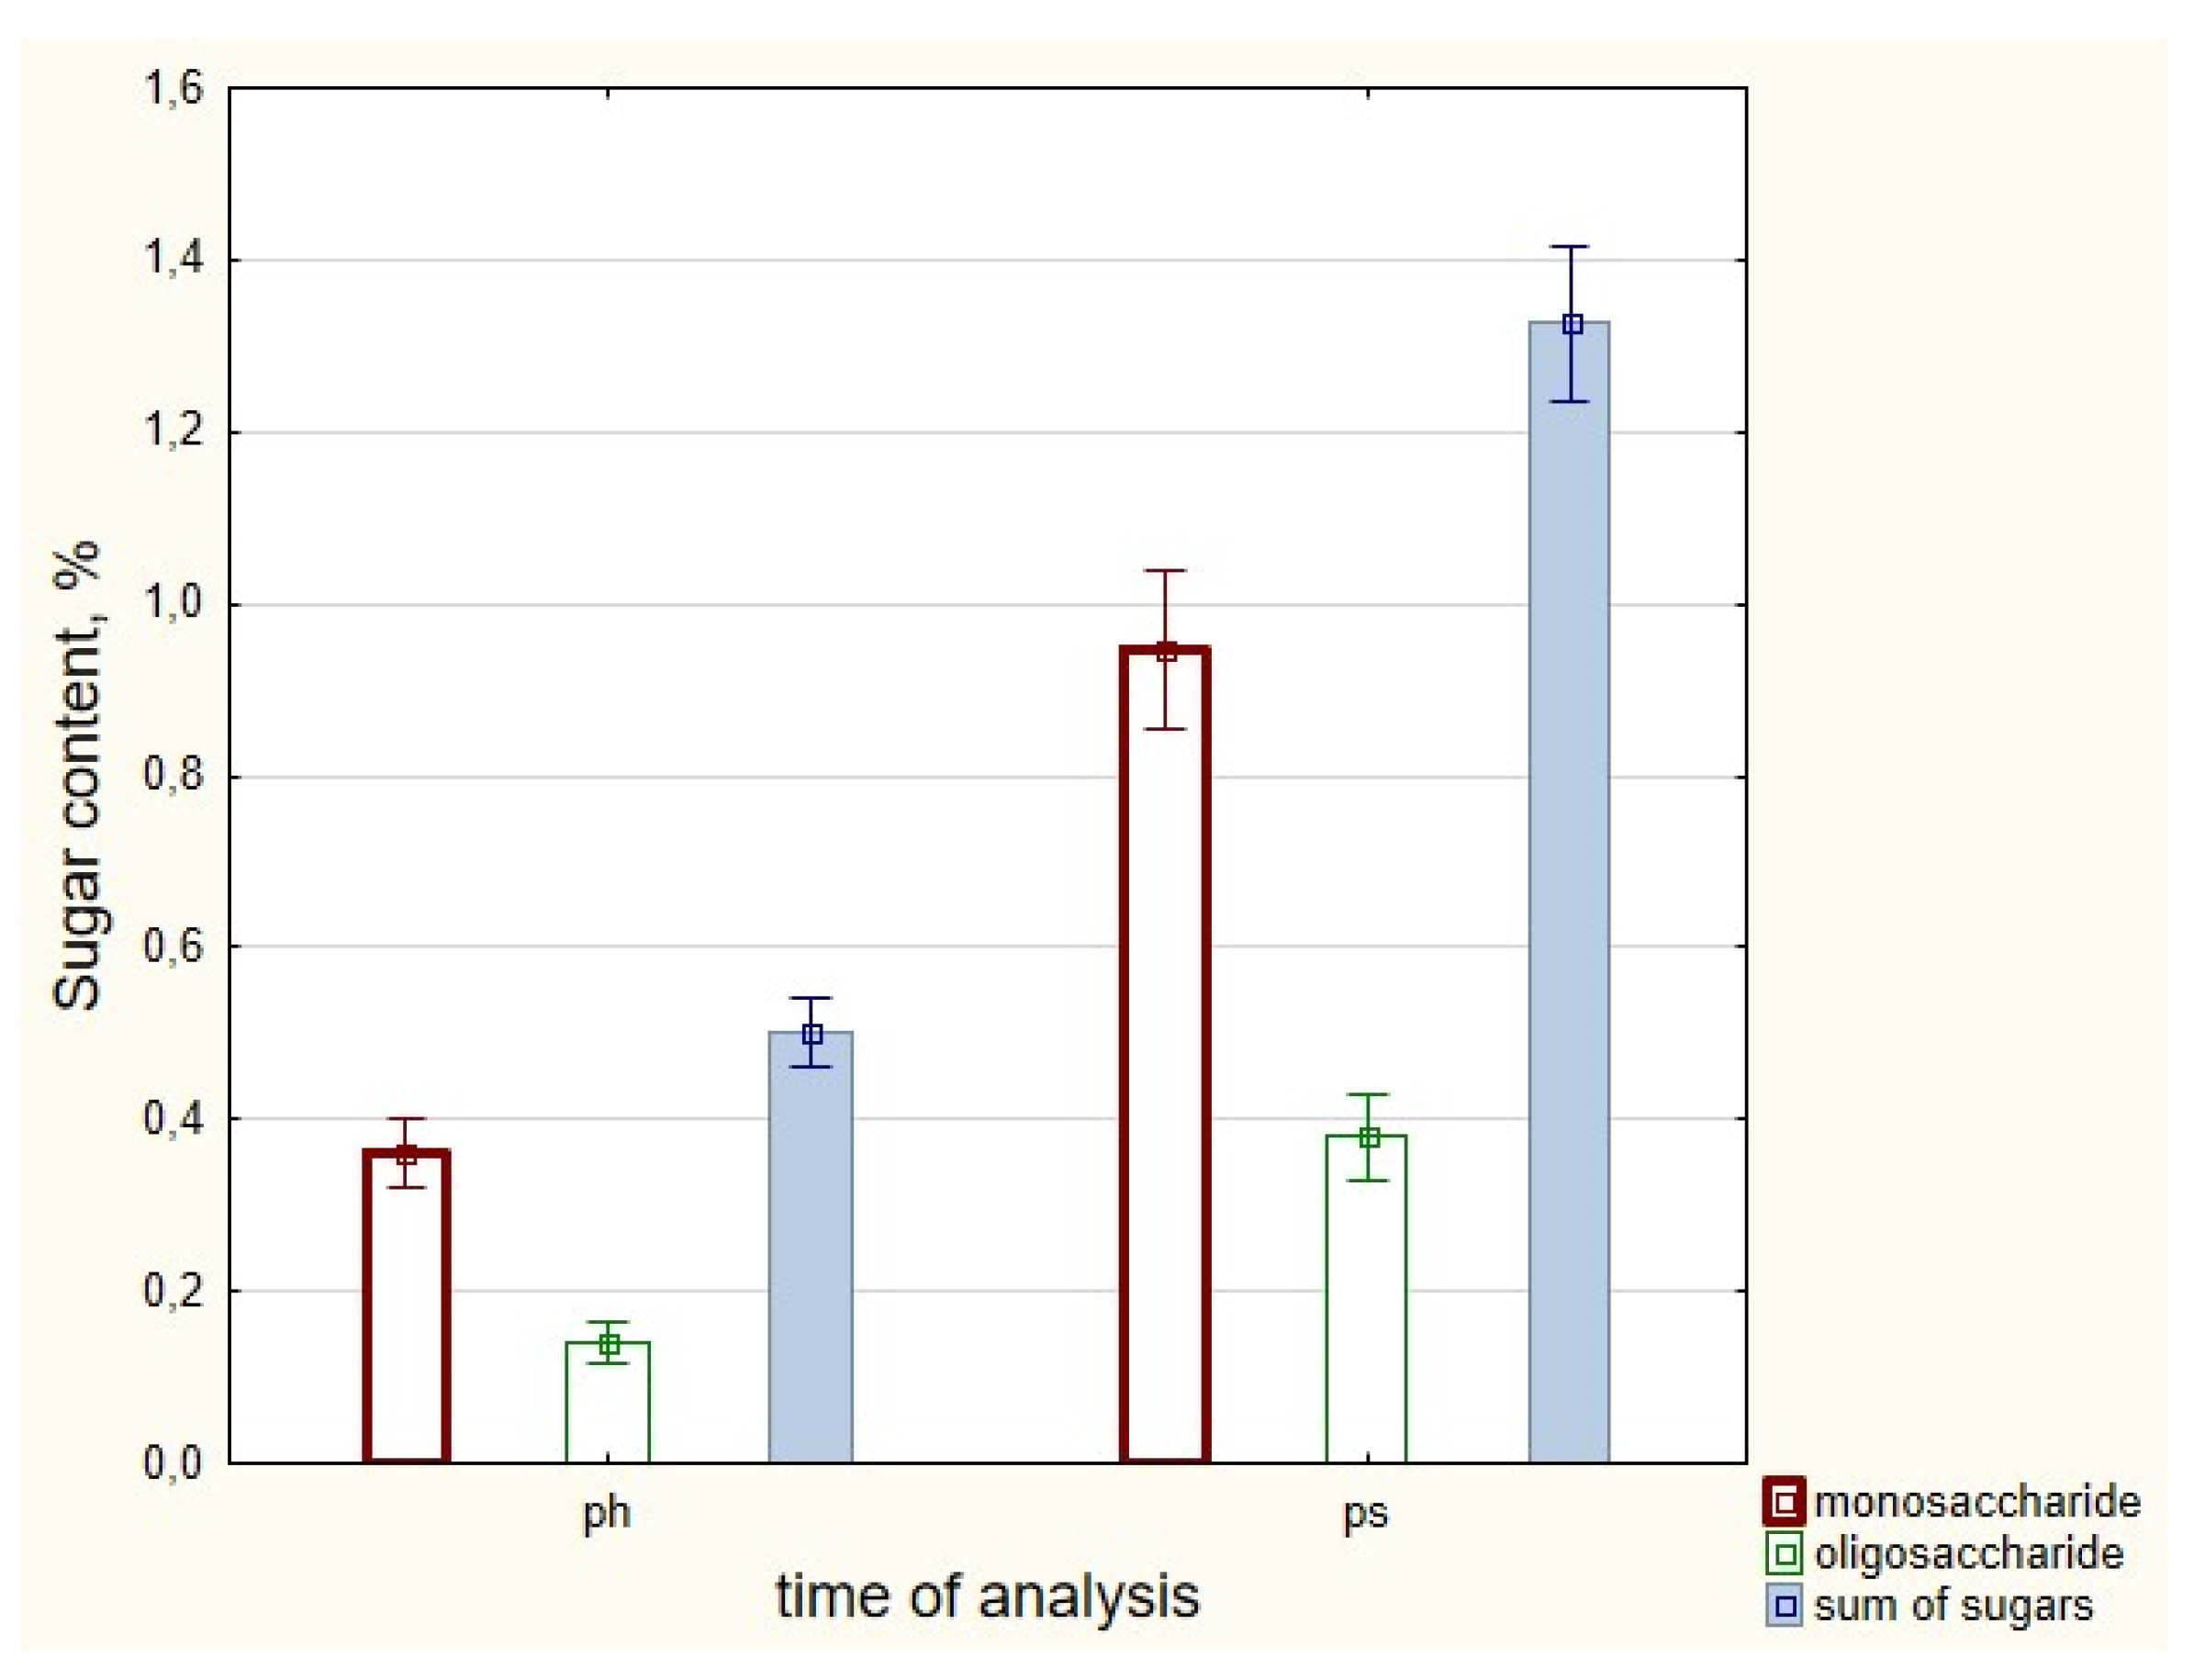
Sugar: In our research, the total sugar content varied from 0.18 to 2.46%, with a mean of 0.91%, and reducing sugars varied from 0.10 to 2.10% (mean of 0.65%), which amounted to 18–100% (mean of 69%) of the total sugar content. After storage, a significant increase in sugars was observed, which resulted from the hydrolytic decomposition of starch: total sugars after harvesting were 0.51% vs. 1.32% after storage, and the content of reducing sugars was 0.35 vs. 0.93%, respectively (
Table 6,
Figure 1). The relationship between the content of total sugars and reducing sugars in tubers during the post-harvest analysis and post-storage is strong, with a correlation coefficient (R) of 0.80 and 0.83, respectively. It should be noted that the monosaccharides/oligosaccharides ratio remained approximately the same both after harvesting and after storage (31.37% and 29.55%, respectively).
An increase in sugar content by more than 1.5–2% adversely affects potato quality (it causes darkening during cooking due to the formation of melanoidins, renders sweet taste, etc.) [
32,
33]. In our study, all cultivars accumulated less than 1% of sugars after harvesting, and more than 1.5% of sugars were noted after storage in cvs. ‘Krasavchik’, ‘Narymskaya nochka’, ‘Siverskij’ and ‘Sudarynya’. Notable is that cv. ‘Siverskij’ had the maximum sugar content of 1.96%. In cvs. ‘Sokur’, ‘Eliksred’ and ‘Plamya’, the number of sugars did not exceed 1% even after storage (
Table 4).
In 10 out of 14 studied cultivars, the content of reducing sugars (monosaccharides) was below 0.4% after harvesting (
Table 4). In our research, high content of dry matter mass was demonstrated by cvs. ‘Grand’ (23.71%), ‘Krasavchik’ (23.31%), ‘Sokur’ (24.32%) and ‘Nayada’ (24.68%). Tubers of cv. ‘Krasavchik’ contain 0.46% reducing sugars, and those of cv. ‘Nayada’ are at 0.36%. Therefore, tubers of two cvs., ‘Grand’ and ‘Sokur’, can be recommended for industrial processing after harvesting. A significant increase in the content of reducing sugars in tubers of all cultivars was noted after storage, except for cv. ‘Plamya’ (0.24 and 0.47%, respectively).
Raw protein: The amount of nitrogenous substances in potatoes is 1.5–2.5%, of which proteins are a significant part. There is 1.5 to 2 times more protein nitrogen in tubers than non-protein nitrogen. Among non-protein substances, free amino acids and amides are present in significant amounts. An insignificant part of the nitrogen is present in nucleic acids, some glycosides, B vitamins and in the form of ammonia and nitrates. The main potato protein, tuberin, is a globulin (55–77% of total proteins), while glutamines account for 20–40%. Potato proteins are highly water soluble, and in terms of biological value, they surpass proteins of many grain crops and are not much inferior to the proteins of meat and eggs. The usefulness of proteins is determined by the composition of amino acids, in particular, by the ratio of essential amino acids, and, therefore, the digestibility of potato protein is much higher than that from other sources of plant foods. The protein and free amino acids of potatoes contain all the amino acids found in plants, including the essential ones (lysine, methionine, threonine, tryptophan, valine, phenylalanine, leucine and isoleucine), which are found in a good ratio [
30].
Depending on the cultivar and growing conditions, the range of protein content in tubers of 14 potato cultivars varied from 1.02 to 2.77%, with a mean of 1.83% of fresh weight. After storage, the mean value of protein did not change significantly in the tubers of all studied cultivars (
Table 4).
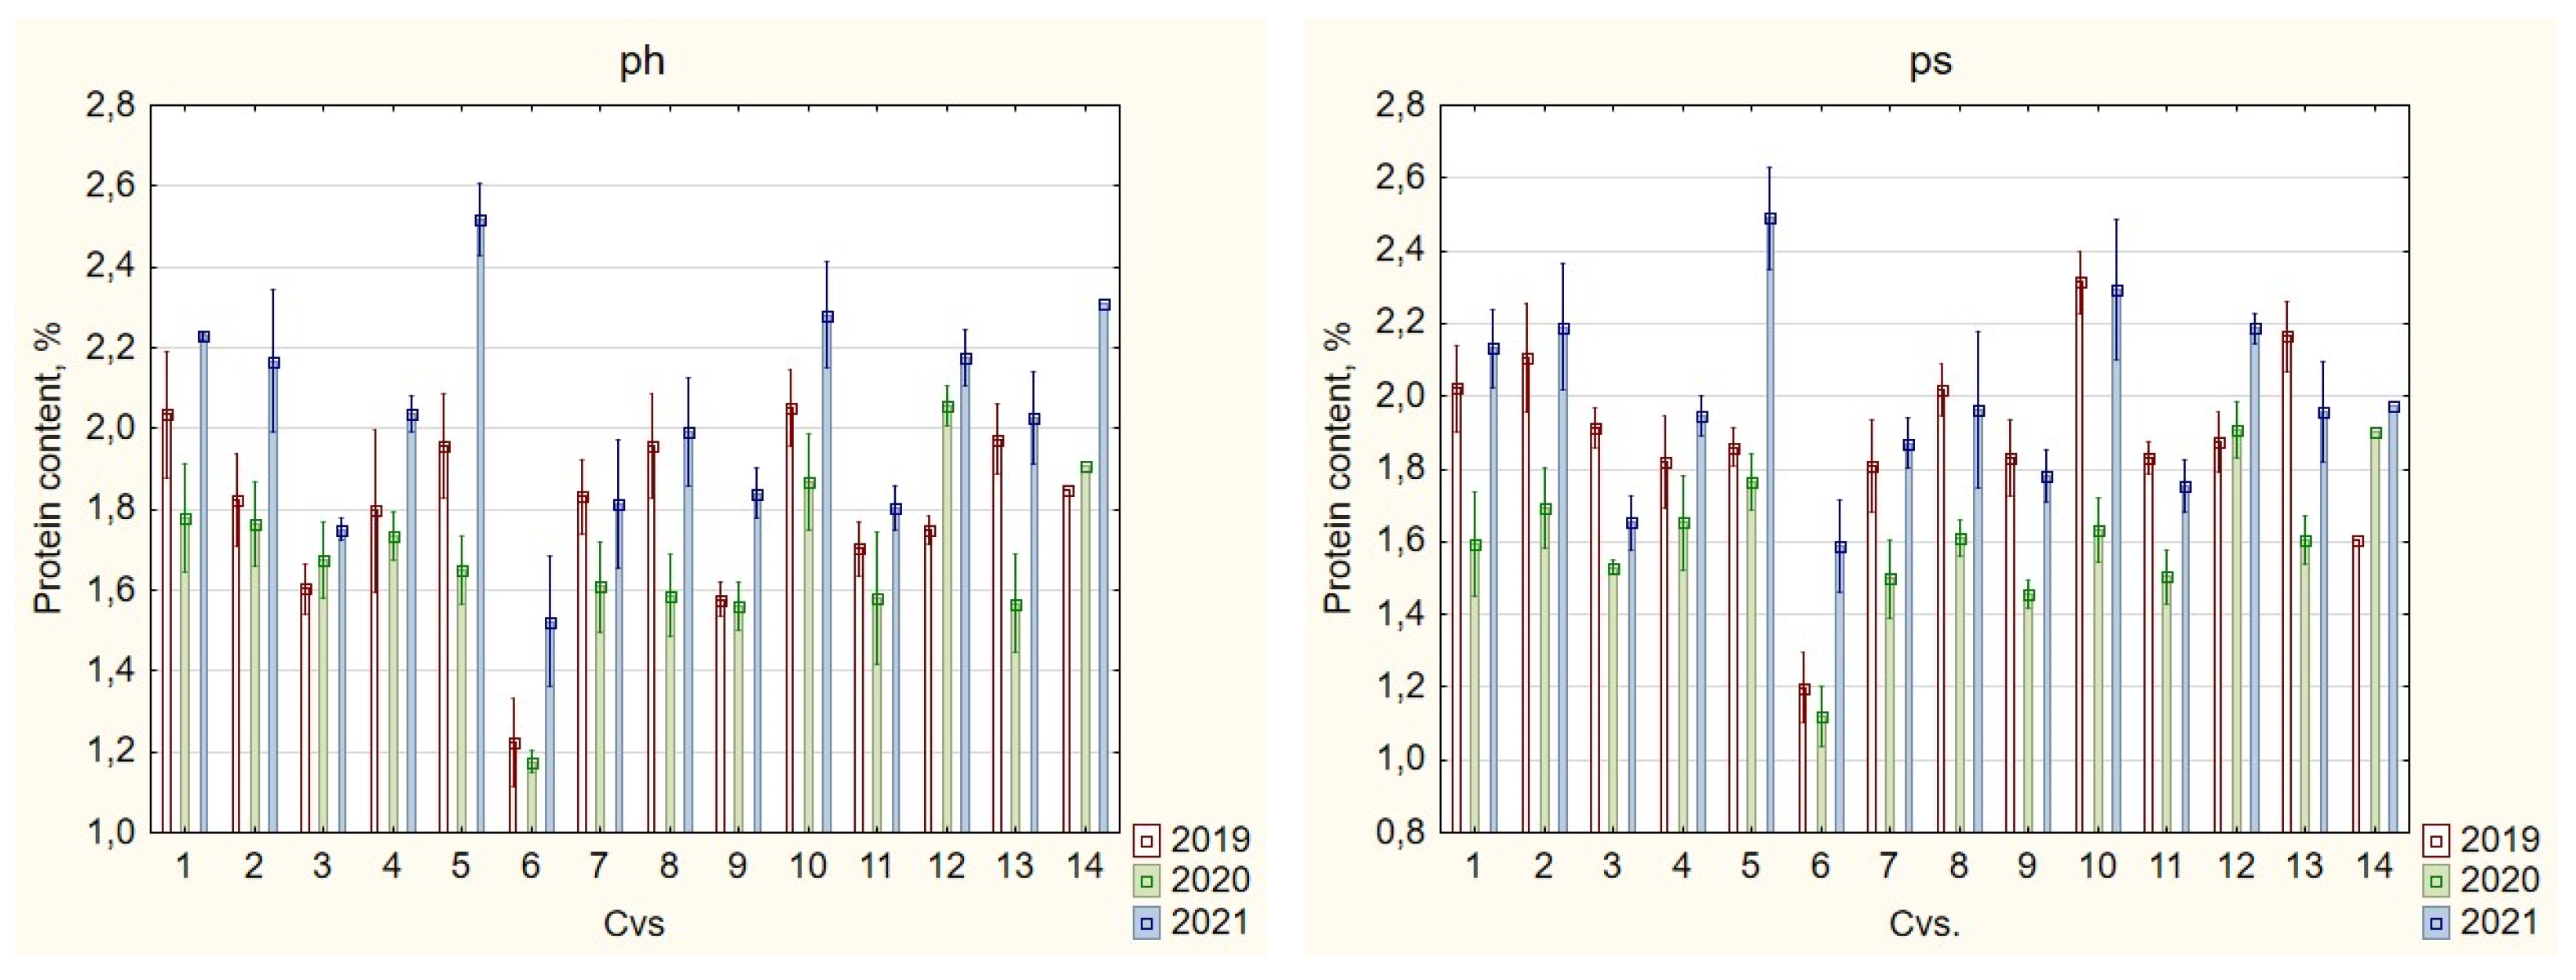
According to the content of proteins in tubers, potatoes are divided into high-protein (over 1.23%), medium-protein (1.15–1.23%) and low-protein (1.06–1.15%) ones. All the studied cultivars are high-protein ones. The highest amount of protein (over 2%) was noted in tubers of cvs. ‘Barin’, ‘Krasavchik’, ‘Sokur’ and ‘Nayada’, with the highest accumulation in cv. ‘Sokur’ (2.07%). In our study, among the four mid-early cultivars, the highest accumulation of protein (2.04%) was recorded for cv. ‘Krasavchik’, while other cultivars with a high protein content in tubers were classified as mid-season. Cv. ‘Kumach’ was distinguished by the lowest protein content in all the years of study (mean of 1.31%). In most cultivars, protein accumulation depended on the year of cultivation: the highest content was noted in 2021, and the lowest in 2020 in all cultivars, except for ‘Kalibr’, ‘Fioletovyi’ and ‘Nayada’ (
Figure 2).
After storage, the amount of protein in tubers depends on potato genotypes and year (
Figure 2). The dimension of the variability of protein content is not significant and the size is equal to 0.2–0.3%. It is more remarkable that protein content in tubers of some varieties increased in 2019 and decreased in 2020. After storage, the protein content in tubers of cvs. ‘Kumach’, ‘Narymskaya nochka’ and ‘Plamya’ remained stable for all three years (
Figure 2). The amount of protein in potatoes is known to have an inverse relationship with the content of starch: the more starch, the less protein [
34]. This is explained by the different directions of protein and carbohydrate metabolism in tubers. The greater part of the protein in potato tubers is water soluble and is found in cell sap. It should be noted that cv. ‘Sokur’ has the highest content of both protein and starch in the studied set of potato cultivars (
Table 4).
Vitamin C: Vitamins determine the biological value of potatoes as a food product. Tubers contain a variety of vitamins, among which vitamin C (ascorbic acid) dominates and plays an important role in the formation of nutritional value. Vitamin C is known to have a low reduction potential, and the free radical that forms during its oxidation has low reactivity, which meets the criteria for a primary antioxidant [
35]. The maximum content of vitamin C in tubers is found shortly after the beginning of their formation, i.e., during a period of rapid growth. By the time tubers reach physiological maturity, the content of vitamin C decreases [
31].
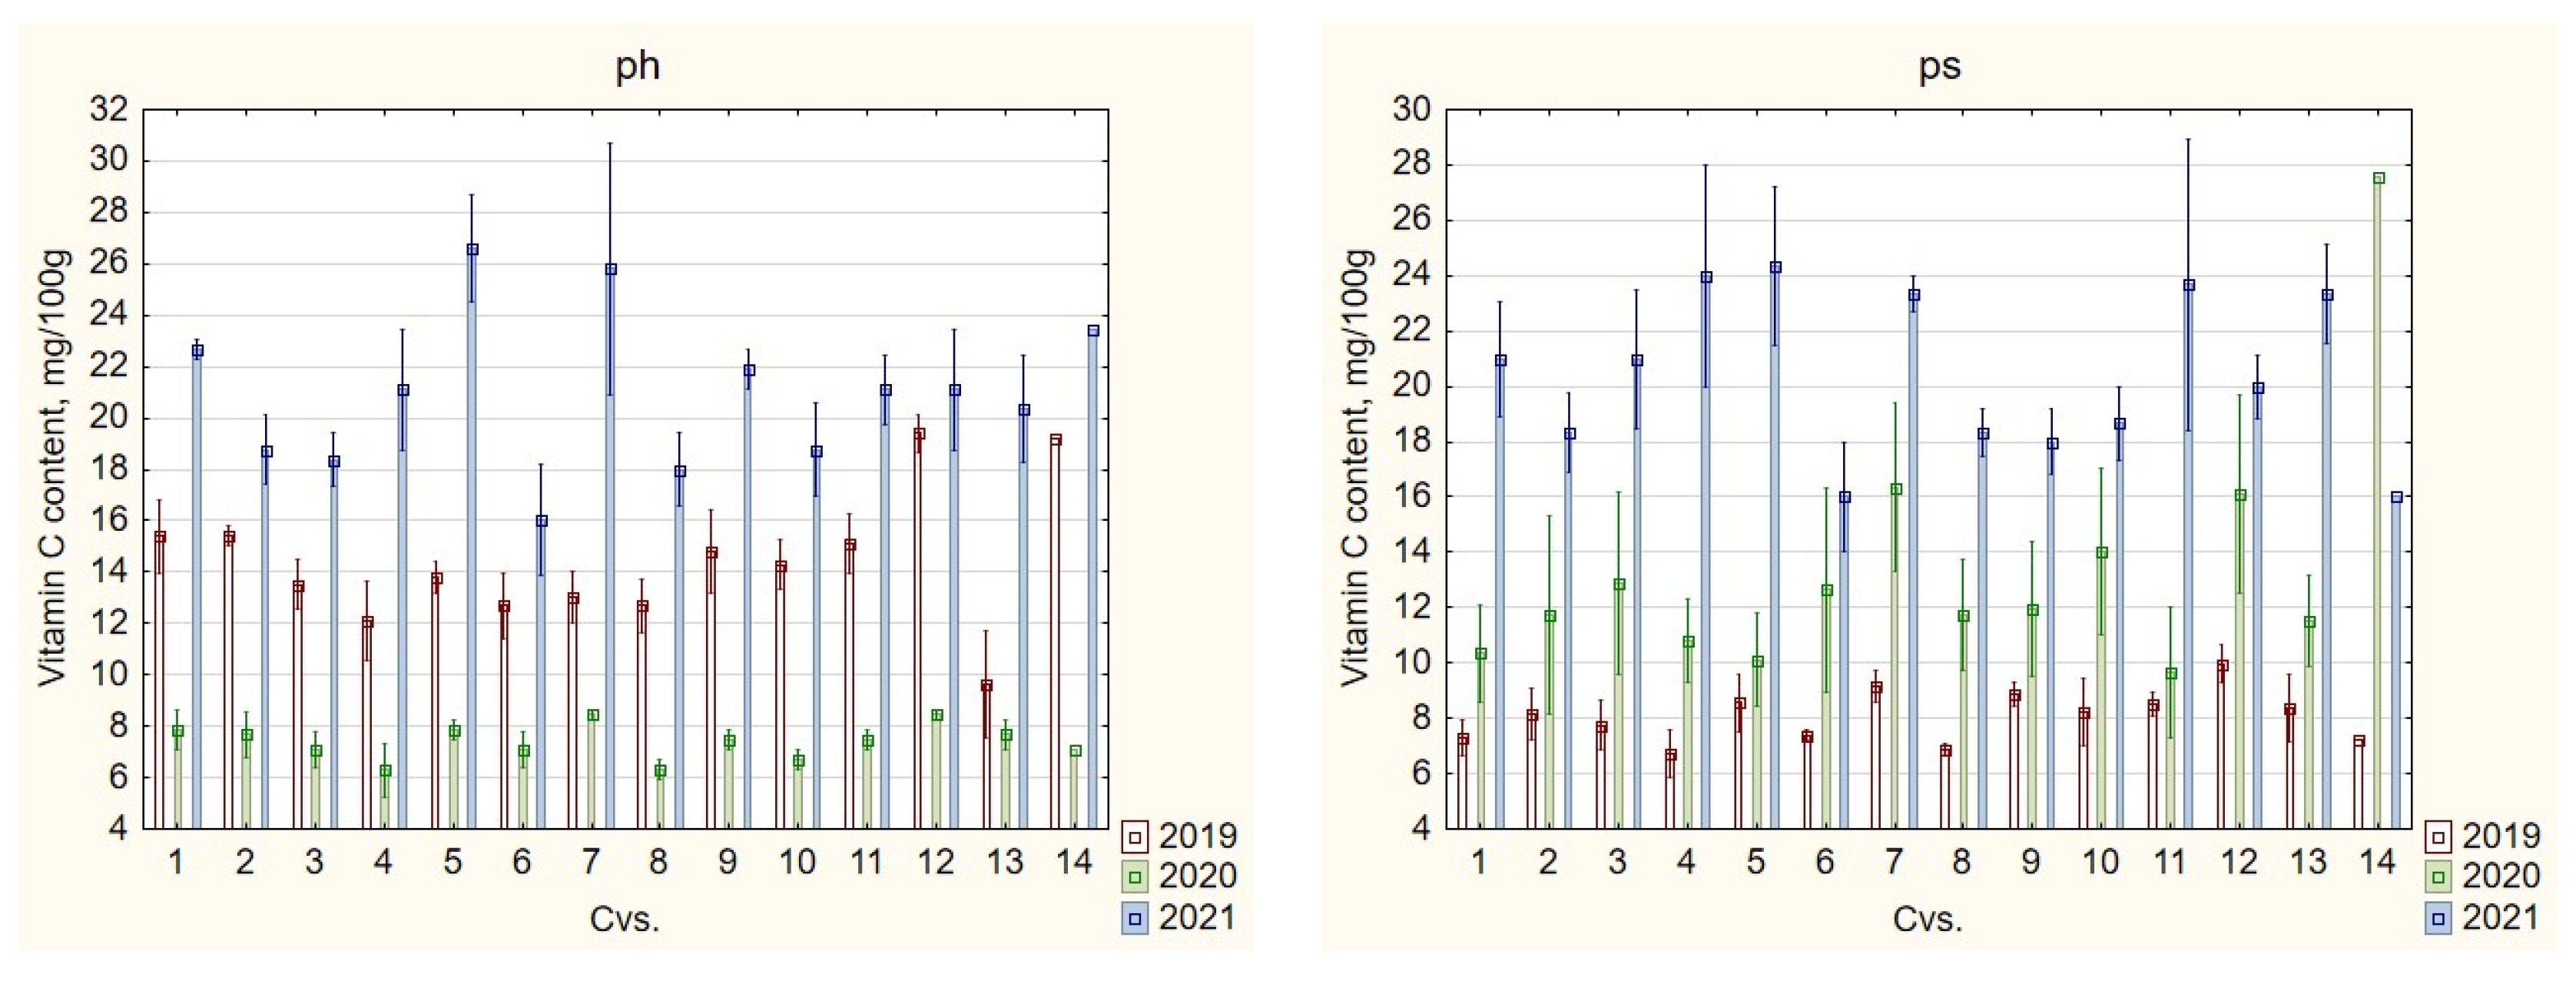
In our study, the mean content of vitamin C in potato tubers was 14.1 mg/100 g FW and the range of variability of this indicator was large: from 6.3 mg/100 g FW in cv. ‘Krasa Meŝery’ to 26.6 mg/100 g FW in cv. ‘Krasavchik’ in post-harvest analyses (
Figure 3). The highest amount of vitamin C (over 16 mg/100 g, the three-year mean) was observed in cvs. ‘Krasavchik’ (16.1), ‘Fioletovyi’ (16.3) and ‘Nayada’ (16.6). According to Platonova and Savina (2010) [
36], early and mid-early cultivars are superior in vitamin C content to mid-season and late varieties. This conclusion was confirmed in our study by the results of the biochemical analysis of cv. ‘Krasavchik’, a mid-early cultivar. However, among two other cultivars, ‘Fioletovyi’ is mid-late and ‘Nayada’ is mid-season.
Meteorological conditions of the growing season had a significant impact on the vitamin C and protein content (
Figure 2 and
Figure 3). The tubers harvested in 2020 (with heat deficiency and heavy rainfall) contained the lowest (6.3–8.5 mg/100 g) amounts of vitamin C in all the studied cultivars. The weather conditions in 2019 were more favorable for the formation of vitamin C, so the mean per sample was 14.3 mg/100 g, with the most noticeable increase in the vitamin C content (up to 19.4 mg/100 g) in tubers of cvs. ‘Fioletovyi’ and ‘Nayada’ (
Figure 3). The weather conditions in 2021 had the most positive effect on the level of vitamin C; an increase in this indicator was noted in all tested cultivars compared to 2019. The highest vitamin C content (up to 25.8 and 26.6 mg/100 g) was noted in cvs. ‘Narymskaya nochka’ and ‘Krasavchik’, respectively.
After storage, the concentration of vitamin C varied depending on potato genotypes and year. In general, the content of vitamin C increased in all potato varieties after storage in 2020 and decreased in 2019 (
Figure 3). Earlier studies have shown that more vitamin C is accumulated in potato tubers in dry than in wet years [
31]. Our results confirm this conclusion, as the content of vitamin C in tubers was significantly higher in hot and dry 2021 than in previous years (
Figure 3). The indicator of tubers’ total acidity changed in a similar way, as was shown by the post-harvest analysis.
Titratable acidity: Organic acids are found in plants in a free state or in the form of acidic and neutral salts. The accumulation of one or another acid in a plant is closely connected with the whole complex of organic acids transformation during the development of a plant, with the type of metabolism in general and its dependence on environmental conditions. Organic acids determine the acidity of potato cell sap. The pH value (active acidity) for potatoes is found in the 5.6–6.2 range. Potato tubers contain citric, malic, oxalic, isocitric, lactic, pyruvic, tartaric, chlorogenic, quinic and other organic acids. Potatoes are rich in citric acid. The total titratable acidity of potato is also determined by the presence of acid phosphates in its composition.
In our research, we determined the titratable acidity, which characterizes the total amount of free acids and acid salts. The range of variability of titratable acidity in the studied potato cultivars varied from 0.1 to 0.68% in terms of citric acid (mean of 0.25%). After harvesting, the total acidity was low, with a mean of 0.25% (from 0.14 to 0.43%), and, after storage, it decreased to 0.26% (mean value), although in some cultivars this indicator increased. The accumulation of total acidity was observed only in accessions harvested in 2020, which is probably due to the quality of tubers and their keeping ability. The cool and wet weather in 2020 has led to an outbreak of tuber diseases during storage. The most vulnerable were cvs. ‘Narymskaya nochka’ (up to 0.52% total acidity), ‘Sokur’ (up to 0.54%), ‘Nayada’ (up to 0.56%), ‘Sudarynya’ (up to 0.63%) and ‘Siverskij’ (up to 0.68%).
The total content of acids does not accurately characterize the degree of sour taste of the product. To determine an objective measure of taste, the percentage of sugars is divided by the percentage of acids. In our research, the sugar–acid ratio varied from 0.7 to 15.62, with a mean of 4.08. In the study of accessions in the post-harvest period, the mean value of this indicator was 2.2 (0.7 to 6.33 range) and increased sharply up to 5.96 (1.94–15.62) when determined after storage, which also indicates the hydrolysis of sugars in this period. The acidity of potatoes, which sharply increases from microbiological damage during storage, also negatively affects the course of the technological process [
37].
Pigments: The pigment complex of plants is an intricate and labile system that sensitively reacts and adapts to changes in environmental conditions within the framework of its hereditarily fixed program. Potato tubers usually contain two main classes of pigments, carotenoids and anthocyanins: however, a third class of pigments, chlorophylls, may appear after the exposure of tubers to light. Since tuber color is an important feature of potato cultivars, these classes of pigments are considered in more detail.
Carotenoids: The flesh of all potato cultivars has a stronger or lighter yellow tint, and this is mainly due to the presence of carotenoids, a class of plastid pigments related to lipochromes. The main representatives of carotenoids in higher plants are two pigments: β-carotene (orange) C
40H
56 and xanthophyll (yellow) C
40H
56O
2. In potato tubers, the main carotenoid components are xanthophylls: violaxanthin, lutein and lutein-5,6-epoxide, with a small amount of neoxanthine and neoxanthin-A [
38]. β-carotene, a common carotenoid in many plants, is also present in the aerial parts of the potato plant, and is either absent or present only in trace amounts in tubers [
39]. There is a direct correlation between the yellow color of the flesh and the total carotenoid content, which is a hereditary characteristic. A high carotenoid content is believed to be controlled by one dominant gene, and there are modifier genes [
40].
The range of carotenoid variability in the studied potato cultivars ranged from 0.10 to 2.01 mg/100 g, with a mean of 0.477 mg/100 g. There were no significant changes in the content of carotenoids after storage (
Table 7); a slight upward trend was observed (0.43 vs. 0.52 mg/100 g). The total content of carotenes varied from 0.032 to 0.278 mg/100 g (mean of 0.111). About 62% of the total carotenes accounted for β-carotene and ranged from trace amounts to 0.296 mg/100 g (mean of 0.069). Also, no changes in the content of β-carotene were observed during storage; a slight increase was within the error.
Tuber greening due to the formation of chlorophyll (a class of plastid pigments) as a result of the influence of light is not uncommon, but is usually accompanied by the appearance of toxic glycoalkaloids such as solanine and chaconine [
39], and therefore green-colored tubers should not be eaten. However, chlorophylls are found in small amounts both in the flesh and skin of tubers. In our research, the range of chlorophyll content varied from trace amounts to 5.56 mg/100 g, with a mean of 0.82 mg/100 g. During storage, the amount of chlorophylls decreased (1.26 vs. 0.32 mg/100 g). The maximum content of chlorophylls was found in cv. ‘Siverskij’ (1.00 mg/100 g), ‘Narymskaya nochka’ (0.96) and ‘Eliksred’ (0.92).
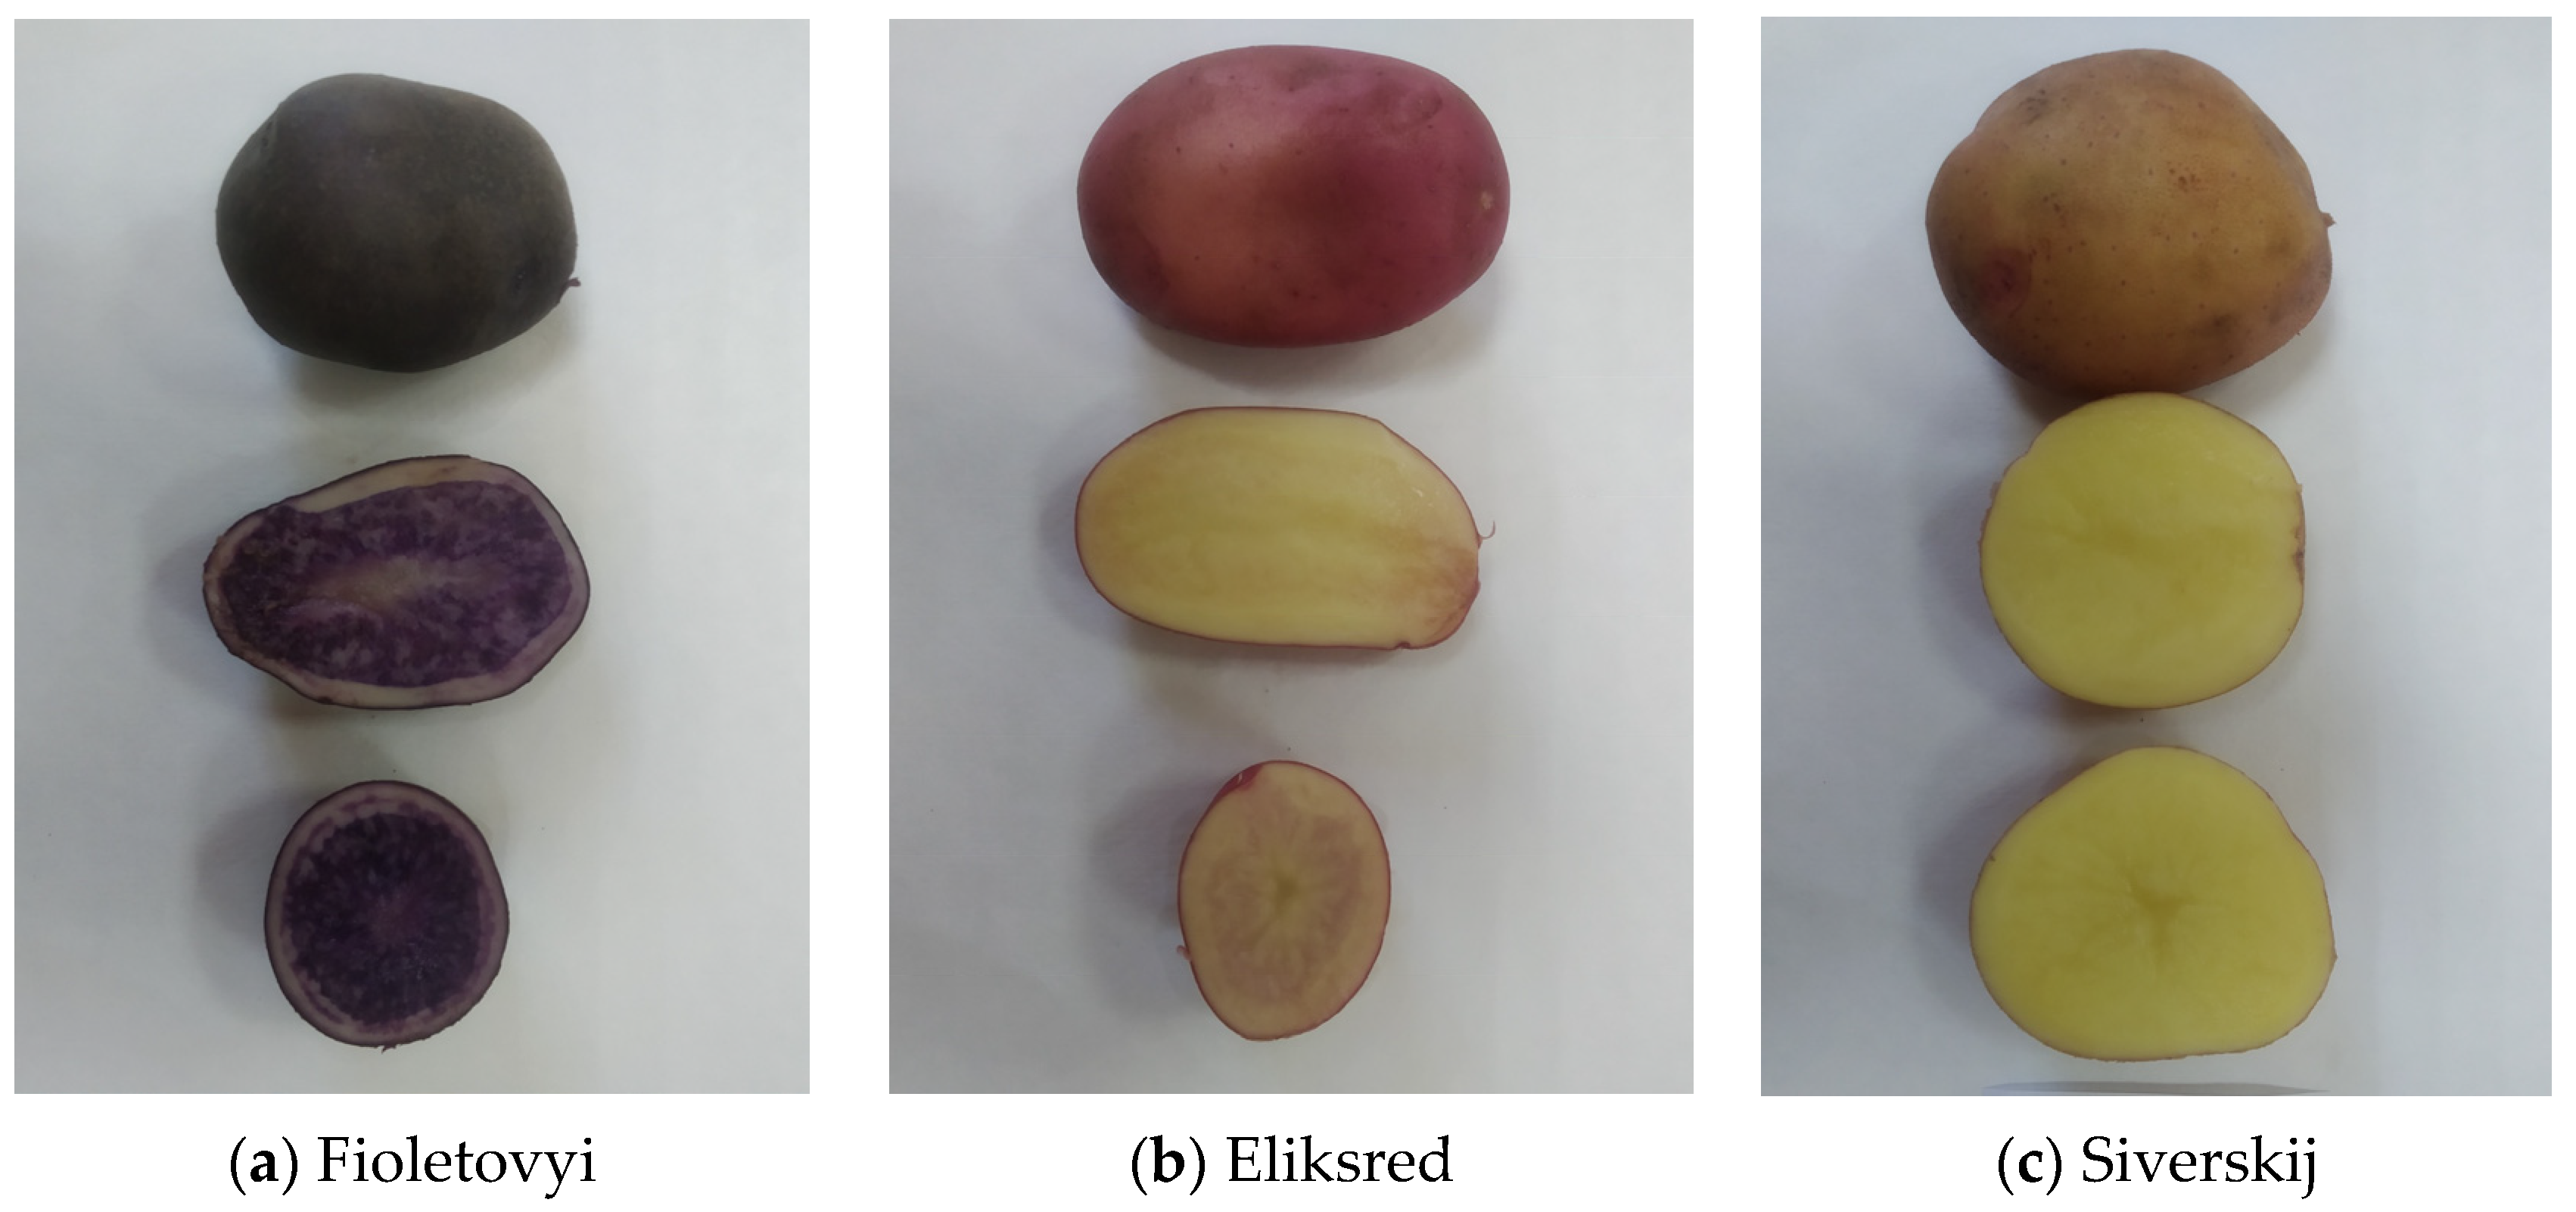
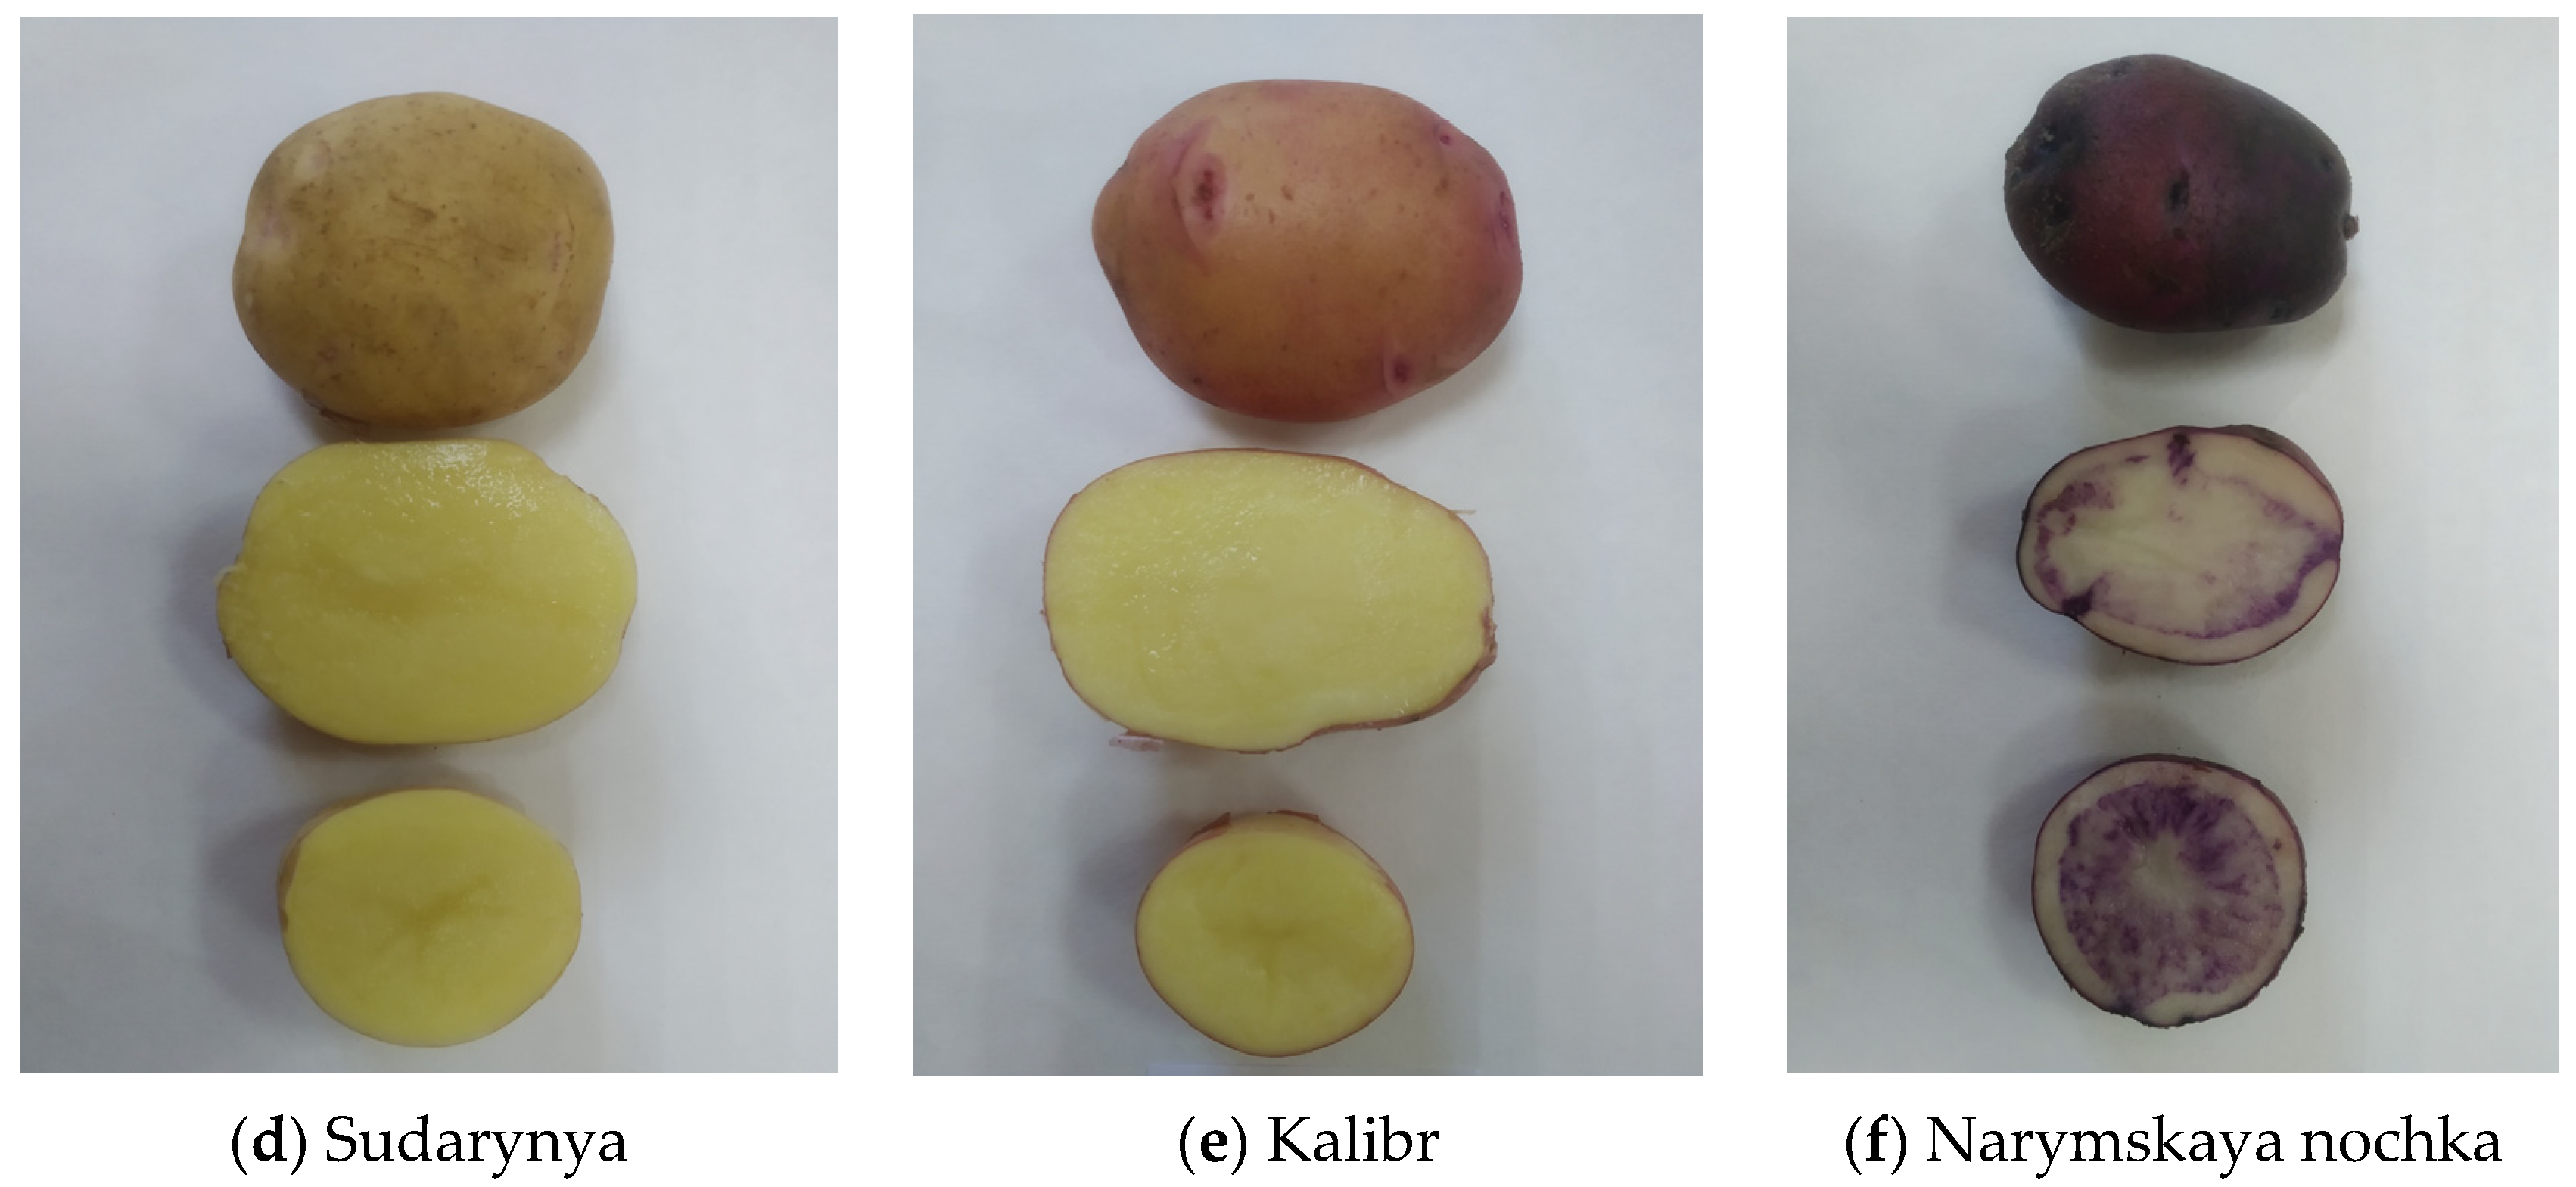
Anthocyanins: Another major group of pigments that can be found in tubers of some potato cultivars are anthocyanins. These are vacuolar pigments that give the tuber skin or flesh a red or purple, sometimes almost black color (
Figure 4), and these colors often mask those rendered by carotenoids. Anthocyanins are found in cell sap in the form of glycosides, which decompose during hydrolysis into glucose, galactose, rhamnose and colored aglycones (anthocyanides). Anthocyanins belong to a class of compounds called flavonoids, but most other flavonoids are usually colorless, or colored yellow. Other flavonoids, such as flavonols and flavones, which are yellow, may be present in trace amounts, although they are unlikely to have any significant effect on skin or flesh color [
39].
The color and distribution of anthocyanin pigmentation in different parts of a plant are characteristics that are of great importance for the identification of a potato cultivar. Tuber skin can be completely or partially colored. Tuber flesh can also be completely colored or have a different distribution of pigment color. The color of sprouts, which tubers produce in natural diffused light, also varies depending on the cultivar [
39]. The studied sample includes cultivars with different colors of tuber skin (white, pink, bright red and purple) and flesh (white, pink, or purple) (
Table 1,
Figure 4). In our study, the content of anthocyanins in potato tubers varied from 1.04 (not colored tubers) to 283.04 mg/100 g (colored tubers), with a mean of 20.28 mg/100 g (
Table 4 and
Table 8).
During storage, there was an insignificant decrease in the amount of anthocyanins (20.62 vs. 19.93 mg/100 g). Depending on the conditions in the year of cultivation, the mean values were as follows: 13.99 mg/100 g in 2019, 35.73 mg/100 g in 2020 and 12.14 mg/100 g in 2021. These data show that the most favorable conditions for the accumulation of anthocyanins were cool temperatures and excess moisture. Hot and dry conditions in 2021 resulted in the lowest anthocyanin values.
The highest content of anthocyanins was observed in cultivars with pigmented skin and flesh, e.g., cv. ‘Fioletovyi’ with purple skin and flesh (102.00 mg/100 g), ‘Narymskaya nochka’ with purple skin and a purple ring in white flesh (49.48 mg/100 g) and ‘Eliksred’ with red skin and pink flesh (36.20 mg/100 g).
Phenolic compounds are a group of substances, the molecules of which contain one or more aromatic (benzene) rings bearing one or more hydroxyl groups. The formation of these compounds is characteristic of plant cells, which are capable of synthesizing dozens of thousands of such compounds. Changes in the chemical composition of phenolic compounds occur due to various biosynthesis and chemical reactions, such as hydroxylation, glycosylation and formation of esters and glycosides. The antioxidant activity of phenols is based on their ability to donate an electron and a proton and are transformed into a relatively stable phenoxy radical capable of delocalizing an unpaired electron [
35]. Phenolic compounds are secondary plant metabolites, and the most common phenolic acids, primarily chlorogenic, account for up to 90% of the total amount of phenolic compounds in potatoes [
41]. Potato tubers contain significantly more phenolic compounds in the skin than in the flesh, especially the pigmented ones [
42]. Determination of the phenolic substance content is one of the main analyses in antioxidant activity studies [
43].
An analysis of the obtained data showed that the total soluble phenolic compounds In potato cultivars varied from 25 to 333 mg-eq. gallic acid (GA)/100 g of fresh weight, with a mean of 118 mg-eq. GA/100 g. The highest accumulation of phenolic compounds was noted in potato cvs. ‘Narymskaya nochka’ (168 mg-eq. GA/100 g) and ‘Fioletovyi’ (175 mg-eq. GA/100 g). This confirmed the data of O.V. Polivanova and E.M. Gins (2019) [
44] that tubers with colored flesh contain the maximum amount of phenolic compounds.
Antioxidant activity (AOA): Recent years witnessed an increased interest in potato AOA, high values of which were noted in cultivars with colored tuber flesh. The main groups of AOA substances contained in potato tubers include carotenoids, vitamin E, vitamin C and phenolic compounds, such as phenolic acids and anthocyanins [
44]. The AOA of potatoes is at the same level as that of tomatoes, carrots and some lettuces, but is below that of berries. However, unlike berries, potatoes are available all year round and are regularly consumed around the world in larger quantities than berries and fruits. Therefore, potatoes can serve as a constant source of antioxidants [
45]. Many studies have shown that the antioxidant activity of the potato skin is 2–3 times higher than that of the flesh [
45]. Stressful situations during potato cultivation increase the content of antioxidants.
Determination of the AOA level in tubers of 14 studied cultivars showed that its mean value was 30 mg-eq. ascorbic acid (AA)/100 g and varied from 0.6 to 145 mg-eq. AA/100 g. The maximum AOA was noted in the tubers of cvs. ‘Narymskaya nochka’ (145 mg-eq. AA/100 g), ‘Fioletovyi’ (142 mg-eq. AA/100 g), ‘Eliksred’ (133 mg-eq. AA/100 g), ‘Plamya’ (132 mg-eq. AA/100 g), ‘Kumach’ (120 mg-eq. AA/100 g) and ‘Krasa Meŝery’ (117 mg-eq. AA/100 g). Cvs. ‘Narymskaya nochka’ and ‘Fioletovyi’ have a purple color of tuber skin and flesh, the other varieties have red skin, and ‘Eliksred’ has pink flesh. Our study confirmed the conclusion of Zhevora (2021) [
45] that, among the colored potato cultivars, those with purple tubers have the highest content of antioxidants.
DPPH test: One of the main methods for studying AOA is the DPPH (2,2-diphenyl-1-picrylhydrazyl) test. The free radical 2,2-diphenyl-1-picrylhydrazyl is used to analyze the ability of tested accessions to slow down and completely stop chain reactions of radical oxidation [
46]. Reactive oxygen species produced as a by-product of metabolic reactions are widely interrelated in biological systems that control processes such as growth, environmental stress regulation, development and protective mechanisms [
47]. Indeed, potatoes have been cited as a better source of phenolic compounds with antioxidant capacity compared to other vegetables and fruits, such as carrots, onions and tomatoes, due to their higher daily intake [
41]. By using the DPPH test, we measured the radical scavenging activity of potato tuber extracts, which ranged from 0.15 to 18%, with a mean of 10%. The highest absorption activity was noted in the same cultivars as in the case with AOA determination, namely ‘Narymskaya nochka’ (14.59%), ‘Fioletovyi’ (14.61%), ‘Eliksred’ (11.69%), ‘Plamya’ (12.41%) and ‘Kumach’ (11.33%). Cv. ‘Krasa Meŝery’ was an exception, as the absorption activity of its tubers turned out to be below 10%.
The effect of growth and development conditions on the biochemical composition of potato tubers.
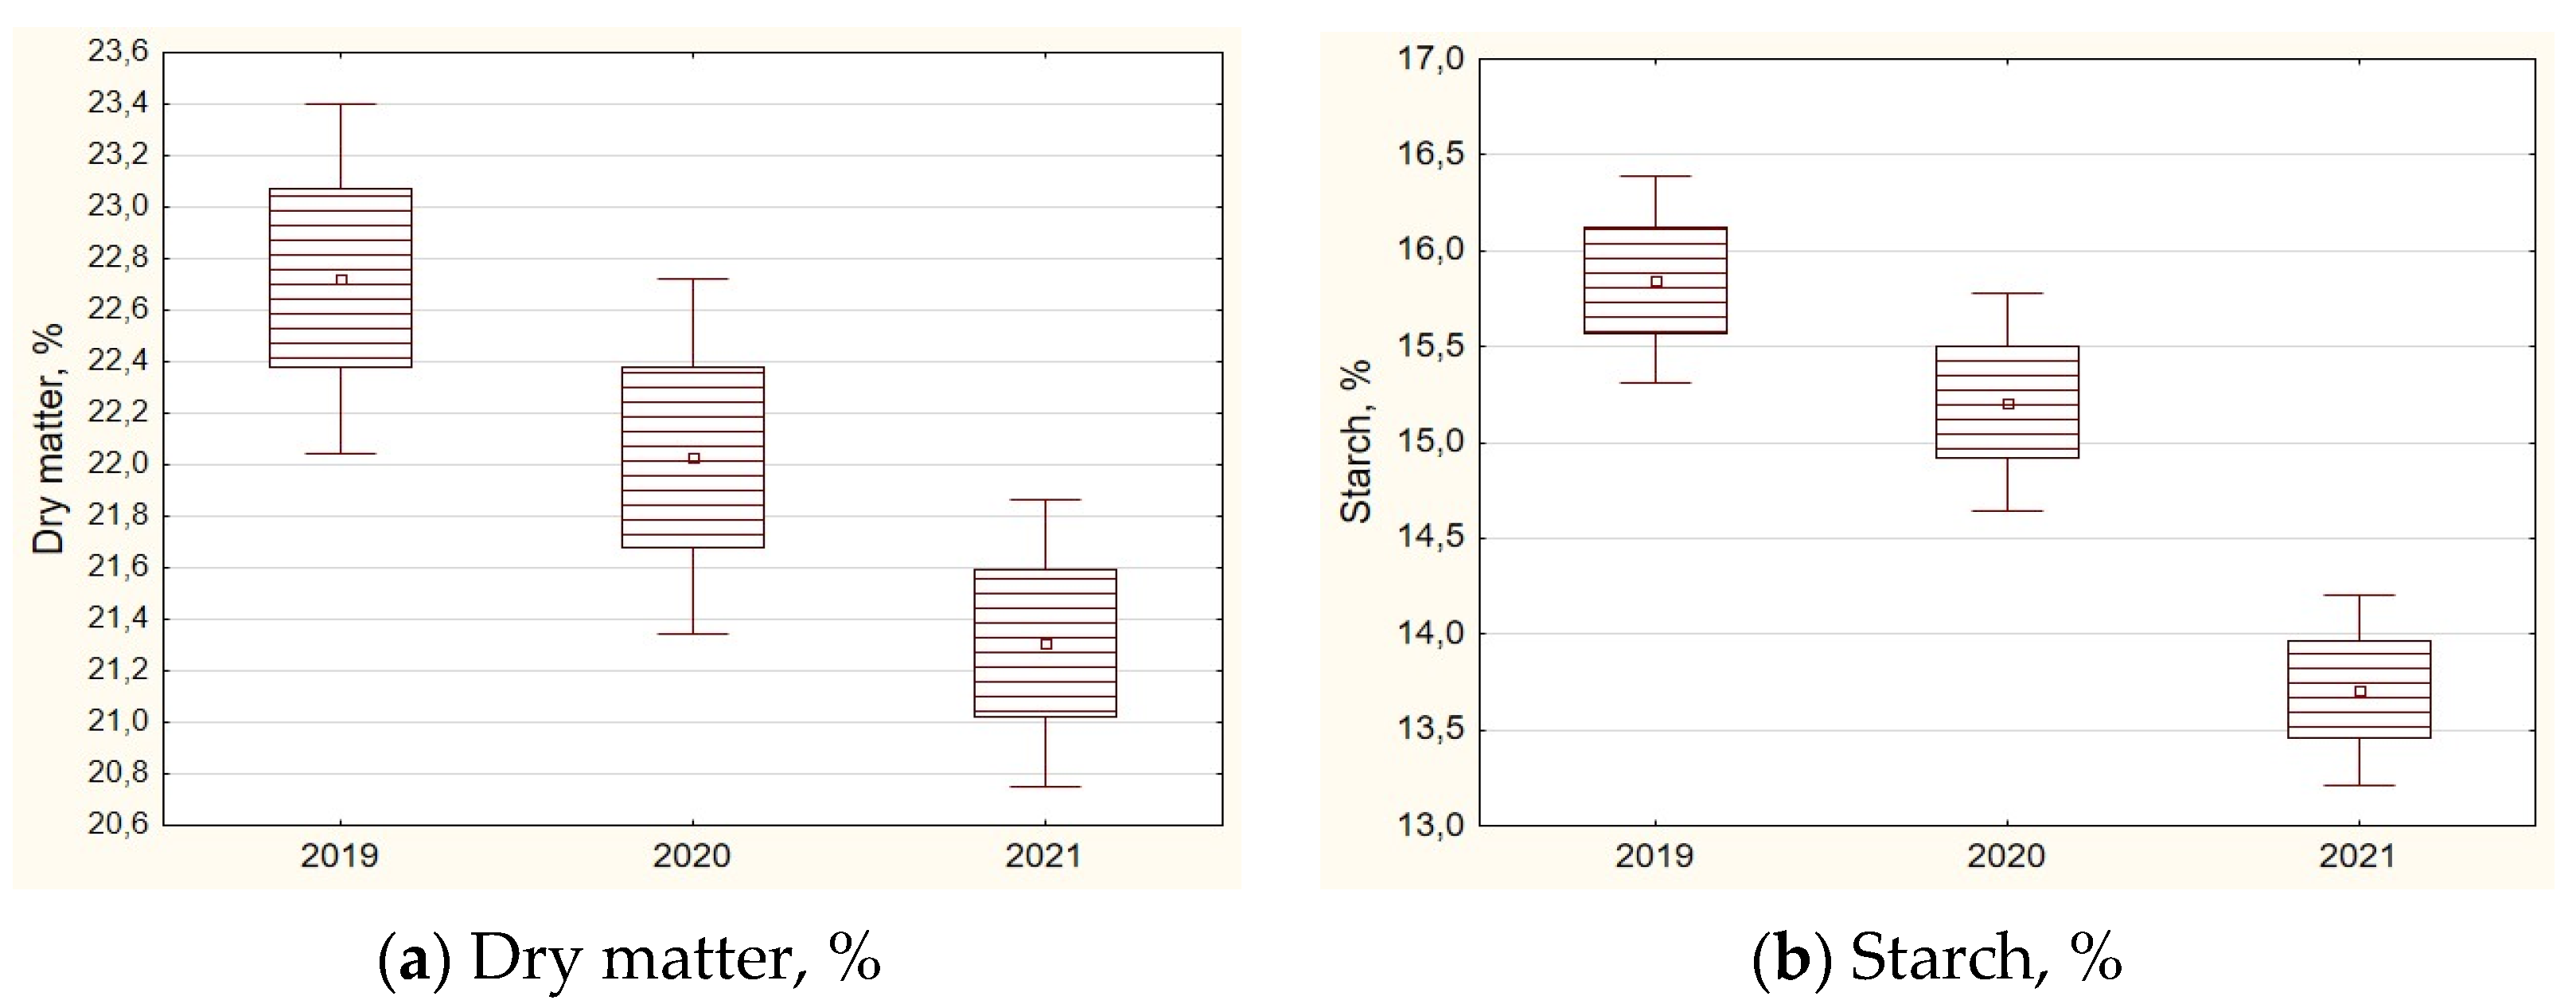
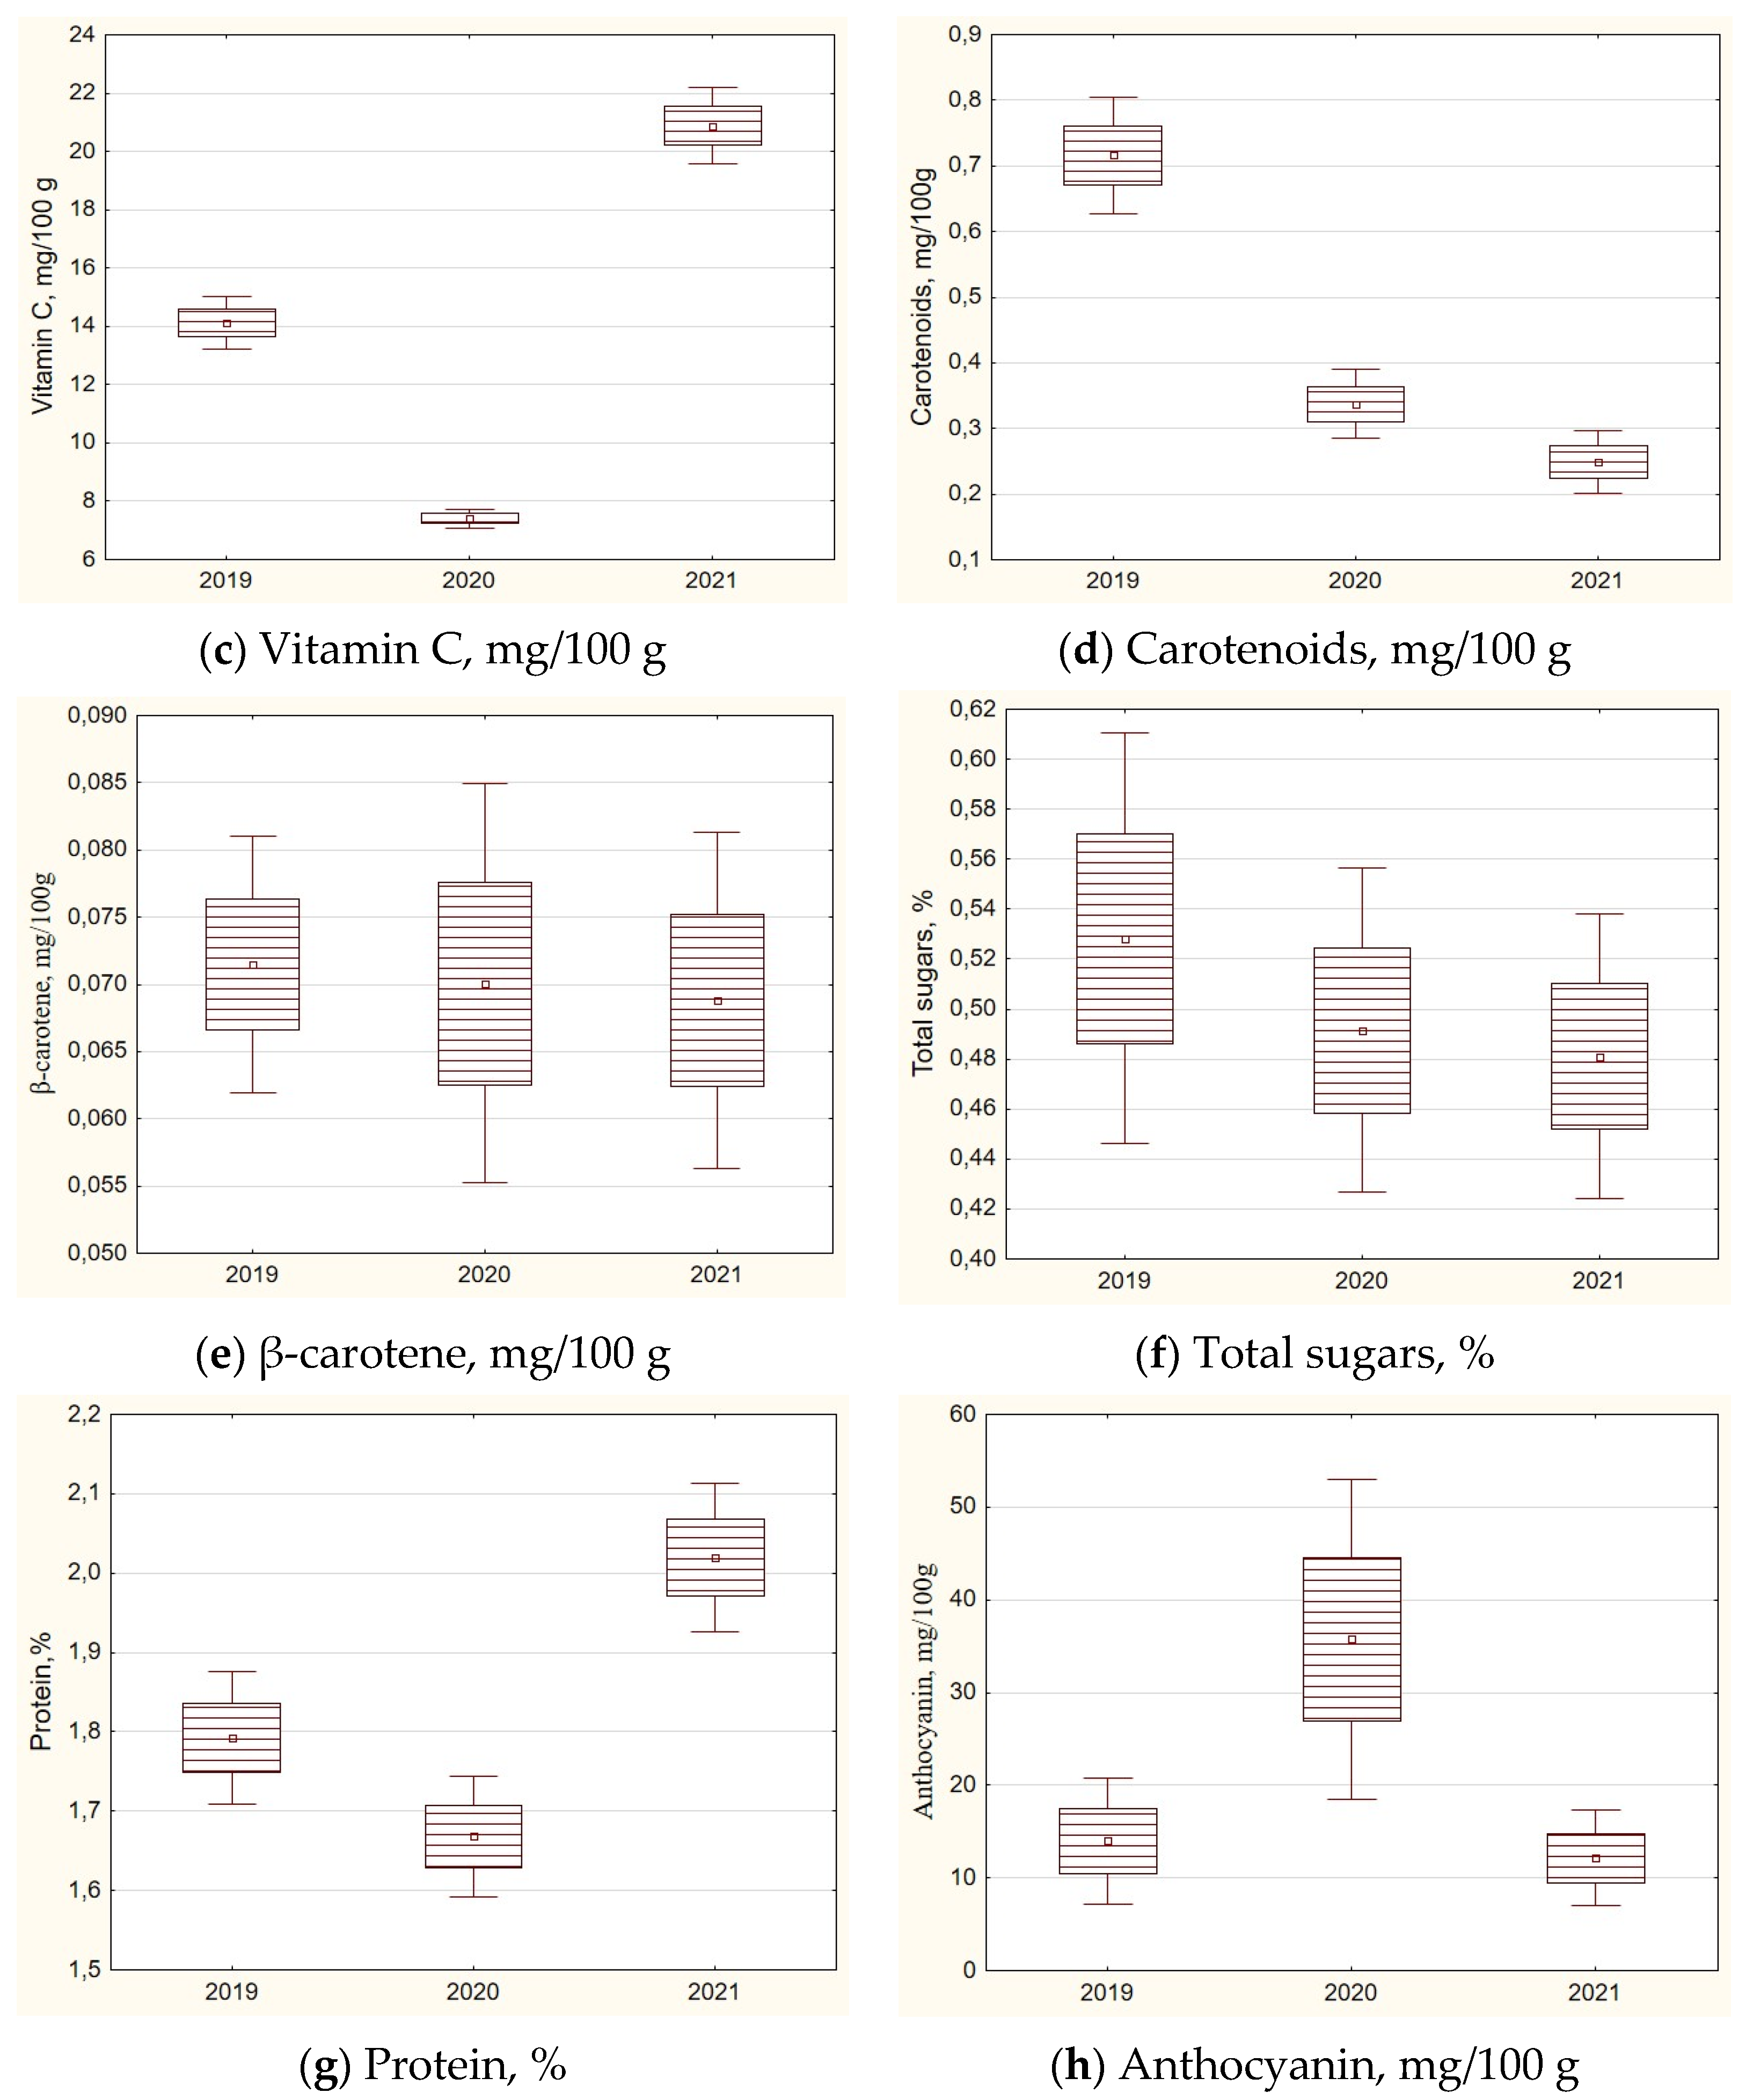
The heat and moisture supply during the growing season largely determined the biochemical composition of tubers of the studied potato cultivars (
Figure 5). The highest content of dry matter, starch and carotenoids (
Figure 5) was noted in tubers harvested in 2019, marked by low temperatures and lack of moisture during growing season (
Table 2). The lowest content of dry matter, starch and carotenoids (
Figure 5) was recorded in tubers harvested in 2021, which was characterized by hot and dry weather during the period of plant growth and development (
Table 2). The maximum amount of sugars (0.53%) for the entire sample was noted in potato tubers in 2019 under low temperatures and lack of moisture. The conditions of 2020 with low temperatures and excess moisture, and of 2021 (hot and dry weather), led to a reduced accumulation of sugars (0.49 and 0.48%, respectively). However, the year factor effect size for the content of monosaccharides and total sugars in general was not significant for the studied sample of cultivars (
Figure 5,
Table 9). Meteorological conditions during three growing seasons affected in a similar way the content of vitamin C and protein in tubers of 14 Russian potato cultivars (
Figure 5). Notably, 2020 was the most favorable for anthocyanin accumulation in potato tubers, while not for other biochemical parameters.
The biochemical parameters of tubers, which determine the nutritional value of potatoes (the content of dry matter, protein, starch and sugars), are influenced by the varietal characteristics to a greater extent than by the growing conditions (
Table 9). The post-harvest and the post-storage analyses of tubers produced by 14 Russian cultivars showed that the genotype determines 38–53% variability in the content of dry matter, protein, starch and sugars. The dry matter content was just slightly affected by growing conditions and storage (8–11% variability). Protein content largely depended on the cultivar and the environment. Genotype and year factors had a significant impact (21–43%) on the amount of protein in harvested potato tubers and after their storage (
Table 9).
Varietal characteristics do not affect the variability of total acidity in tubers and have little effect on the vitamin C content in harvested tubers. However, we revealed that both biochemical parameters are highly affected by external factors (
Figure 5,
Table 9). Varietal characteristics have a significant impact (28–52% variability) on the total and reducing sugars content in post-harvest and post-storage tubers. The year factor determines variability on the total and reducing sugars content in stored tubers only. The content of disaccharides, as well as of β-carotene in tubers, depended just a little on the cultivar and the year of study (
Figure 5,
Table 9).
The analysis of variance revealed that genotype and environment interactions determine a 7% variability in the content of vitamin C and a 15% variability in the anthocyanin content of harvested potato tubers. Genotype and environment interactions determine an 8% variability in the content of reducing sugars and a 15% variability in dry matter and protein content in potato tubers after storage.
The content of carotenoids in tubers after harvesting depended on the cultivar and the weather conditions during the cultivation period; likewise, the content of anthocyanins was also determined by varietal characteristics and growing conditions (
Figure 5,
Table 9). The tubers harvested in 2020 were noted to have the highest level of anthocyanins; an increase in the content of these substances was especially noticeable in cvs. ‘Krasavchik’, ‘Kumach’, ‘Narymskaya nochka’, ‘Sokur’, ‘Fioletovyi’ and ‘Eliksred’ (
Table 7). It should be noted that the intensity of the pink color of the tuber skin in cv. ‘Kalibr’ varies significantly depending on the growing conditions, which also reflects changes in the anthocyanin content in tubers of this cultivar. In 2019, tubers of ‘Eliksred’ had a lower anthocyanin content than in 2021, while tubers of ‘Fioletovyi’, on the contrary, had a higher anthocyanin content in 2019.
4. Discussion
The creation of new potato cultivars, which differ in maturing periods and have specific parameters of economically useful traits determining their purpose use in accordance with the demands of the domestic market, is the main direction of Russian potato breeding [
6]. Depending on the purpose of use, cultivars must comply with a set of specific requirements, including the biochemical parameters of tubers [
2,
48]. At present, information on the biochemical composition of tubers in the assortment of modern potato cultivars is humble due to the evaluation of a small number of cultivars or breeding lines for a limited set of traits [
49,
50,
51]. There has been no knowledge of the content of carotenoids, chlorophylls, organic acids, phenolic compounds and AOA for new Russian potato cultivars.
In our study, 13 Russian potato cultivars and cv. ‘Nayada’ were examined on 12 parameters to characterize the biochemical composition of tubers in post-harvest and after cold storage. Our results and previous reports of biochemical parameters of cvs. ‘Grand’, ‘Kalibr’, ‘Krasavchik’, ‘Krasa Meŝery’, ‘Siverskij’, ‘Sokur’, ‘Sudarynya’ and ‘Eliksred’ indicate the significant influence of varietal characteristics and growing conditions on the content of dry matter, starch, vitamin C, protein and reducing sugars in tubers. Cvs. ‘Grand’, ‘Krasavchik’, ‘Krasa Meŝery’, ‘Sokur’ and ‘Eliksred’ were noted for a high dry matter content (23% and above) in both the North-Western and Central regions [
49,
51]. The conditions of the North-Western region, however, are unfavorable for the accumulation of starch in potato tubers that does not exceed 16% in cvs. ‘Grand’, ‘Krasavchik’, ‘Sokur’ and ‘Eliksred’, while in the Central region, these cultivars are highly starchy [
49,
51].
In all potato cultivars, the content of vitamin C in tubers produced in the North-Western region was noticeably lower (by 5–12 mg/100 g) compared to that in tubers from the Central region. Vitamin C content in cvs. ‘Grand’, ‘Krasavchik’, ‘Krasa Meŝery’, ‘Sokur’, ‘Sudarynya’, ‘Fioletovyi’ and ‘Eliksred’ did not exceed 16.3 mg/100 g in the North-Western region, while in the southern regions of Russia and Belarus, the content of vitamin C in tubers exceeded 18 mg/100 g and even reached 25.8 mg/100 g in cv. ‘Fioletovyi’ [
2,
49,
50,
51,
52].
Potatoes from the North-Western region have a higher protein content and a lower content of reducing sugars compared to potatoes in the Central region. In our research, the protein content above 1.5% was noted in all cultivars of the studied sample, except for cv. ‘Kumach’, while in the Central region, cvs. ‘Grand’ and ‘Barin’ are not among the high-protein ones [
49,
51].
In the North-Western region, cvs. ‘Barin’, ‘Grand’, ‘Kalibr’, ‘Krasa Meŝery’, ‘Plamya’, ‘Sokur’, ‘Fioletovyi’ and ‘Eliksred’ accumulate less than 0.4% of reducing sugars, while in the Central region, cvs. ‘Grand’ and ‘Eliksred’ have such features only [
49,
51]. It should be noted that cv. ‘Sokur’, recommended for cultivation in the West Siberian region, has a high content of dry matter and protein when grown both in the North-Western and Central regions. The stability of the biochemical composition of ‘Sokur’ tubers means that this cultivar is promising for cultivation in different soil and climatic conditions.
It is noticeable that the levels of antioxidants reported by many authors for potatoes in different regions are higher than those in tubers of the Russian varieties. Vitamin C content mentioned in the literature varied between 10 and 36 mg per 100 g FW [
6,
9,
12]. The carotenoid contents mentioned in the literature range from 35 to 795 mcg per 100 g FW [
6,
16,
17], with higher concentrations extending up to 1043.50 mcg/100 g FW [
14]. Anthocyanins in certain cultivars extend up to 368 mg per 100 g FW [
6]. That discrepancy may arise from differences in assessment methods or environmental conditions. The difficulty of comparing studies due to the large number of different techniques was mentioned by Brown (2005) [
6]. Moreover, it is worth remembering that potato cultivars examined in the present study have been created in Russian breeding programs as most adaptive to a separate region, but not to achieve a high nutrition value.
The effects of environmental factors on the accumulation of biochemical components in potato tubers were evaluated in many studies. To date, there has been conclusive evidence that temperature and precipitation during growing potato cycles affect the chemical characteristics of the produced potato tubers [
11,
15,
17]. In our study, anthocyanin concentration was significantly higher under conditions at low temperatures and excess moisture in 2020. This finding is in line with Hu, Tsao et al. (2012) [
11], who found that the year with the higher rainfall was accompanied by higher total anthocyanins content.
There is some contradiction in the assessment of the effect of environments on the carotenoid content. Tatarowska et al. (2019) [
53] found that the effects of the year and location play the most important role in controlling the accumulation of carotenoids, while Haynes et al. (2010) [
16] discussed some discrepancies in the effect of environments for individual carotenoids or for the totals. Escuredo et al. (2018) [
17] reported that the temperature positively favored the flavonoid content and carotenoid content. By contrast, our study revealed that carotenoid content increases significantly in potato tubers formed in conditions of low temperatures and a lack of moisture.
An evaluation of the biochemical parameters of tubers after storage has established a significant effect of the genotype on the change in the content of basic nutrients. In our studies, a decrease in protein content was noted in 2020 for cvs ‘Barin’, ‘Kalibr’, ‘Krasa Meŝery’, ‘Siverskij’, ‘Sokur’ and ‘Fioletovyi’, whereas the protein content increased in tubers of G’rand, Kalibr, ‘Siverskij’, ‘Sokur’, ’Sudarynya’, ‘Fioletovyi’ and ‘Eliksred’ in 2019. According to a number of authors, storage at 4 °C usually leads to protein degradation in potato tubers [
18,
44]. Our data are consistent with the previously published data on an increase in the anthocyanin content after storage in tubers with colored flesh, and a decrease in those with uncolored (white) flesh. At the same time, high AOA activity was found not only in cultivars with colored tuber flesh (‘Narymskaya nochka’, ‘Fioletovyi’ and ‘Eliksred’), but also in those with colored skin and uncolored tuber flesh (‘Plamya’ and ‘Kumach’).


