
Genome-Wide Association Analysis of Active Accumulated Temperature versus Flowering Time in Soybean [Glycine max (L.) Merr.]

Abstract
:1. Introduction
2. Materials and Methods
2.1. Elite Soybean Cultivars
2.2. Experimental Design and Data Collection
2.3. DNA Extraction and SNP Genotyping
2.4. Statistical Analyses
3. Results
4. Discussion
5. Conclusions
Supplementary Materials
Author Contributions
Funding
Data Availability Statement
Acknowledgments
Conflicts of Interest
References
- Vollmann, J.; Škrabišová, M. Going north: Adaptation of soybean to long-day environments. J. Exp. Bot. 2023, 74, 2933–2936. [Google Scholar] [CrossRef] [PubMed]
- Döttinger, C.A.; Hahn, V.; Leiser, W.L.; Würschum, T. Do We Need to Breed for Regional Adaptation in Soybean?—Evaluation of Genotype-by-Location Interaction and Trait Stability of Soybean in Germany. Plants 2023, 12, 756. [Google Scholar] [CrossRef] [PubMed]
- Wang, F.; Li, S.; Kong, F.; Lin, X.; Lu, S. Altered regulation of flowering expands growth ranges and maximizes yields in major crops. Front. Plant Sci. 2023, 14, 1094411. [Google Scholar] [CrossRef] [PubMed]
- Mourtzinis, S.; Conley, S.P. Delineating Soybean Maturity Groups across the United States. Agron. J. 2017, 109, 1397–1403. [Google Scholar] [CrossRef]
- Wen, H.; Wu, T.; Jia, H.; Song, W.; Xu, C.; Han, T.; Sun, S.; Wu, C. Analysis of Relationship between Soybean Relative Maturity Group, Crop Heat Units and ≥10 °C Active Accumulated Temperature. Agronomy 2022, 12, 1444. [Google Scholar] [CrossRef]
- Di, Y.; You, N.; Dong, J.; Liao, X.; Song, K.; Fu, P. Recent soybean subsidy policy did not revitalize but stabilize the soybean planting areas in Northeast China. Eur. J. Agron. 2023, 147, 126841. [Google Scholar] [CrossRef]
- Li, R.; Guo, J.; Song, Y. Optimizing parameters of a non-linear accumulated temperature model and method to calculate linear accumulated temperature for spring maize in Northeast China. Theor. Appl. Climatol. 2020, 141, 1629–1644. [Google Scholar] [CrossRef]
- Li, H.; Du, H.; He, M.; Wang, J.; Wang, F.; Yuan, W.; Huang, Z.; Cheng, Q.; Gou, C.; Chen, Z.; et al. Natural variation of FKF1 controls flowering and adaptation during soybean domestication and improvement. New Phytol. 2023, 238, 1671–1684. [Google Scholar] [CrossRef] [PubMed]
- Xia, Z.; Zhai, H.; Wu, H.; Xu, K.; Watanabe, S.; Harada, K. The Synchronized Efforts to Decipher the Molecular Basis for Soybean Maturity Loci E1, E2, and E3 That Regulate Flowering and Maturity. Front. Plant Sci. 2021, 12, 632754. [Google Scholar] [CrossRef] [PubMed]
- Lin, X.; Liu, B.; Weller, J.L.; Abe, J.; Kong, F. Molecular mechanisms for the photoperiodic regulation of flowering in soybean. J. Integr. Plant Biol. 2020, 63, 981–994. [Google Scholar] [CrossRef] [PubMed]
- Yang, G.; LI, W.; Fan, C.; Liu, M.; Liu, J.; Liang, W.; Wang, L.; Di, S.; Fang, C.; Li, H.; et al. Genome-wide association study uncovers major genetic loci associated with flowering time in response to active accumulated temperature in wild soybean population. BMC Genom. 2022, 23, 749. [Google Scholar] [CrossRef] [PubMed]
- Zhu, X.; Leiser, W.L.; Hahn, V.; Würschum, T. The genetic architecture of soybean photothermal adaptation to high latitudes. J. Exp. Bot. 2023, 74, 2987–3002. [Google Scholar] [CrossRef] [PubMed]
- Yao, X.; Xu, J.; Liu, Z.-X.; Pachner, M.; Molin, E.M.; Rittler, L.; Hahn, V.; Leiser, W.; Gu, Y.; Lu, Y.; et al. Genetic diversity in early maturity Chinese and European elite soybeans: A comparative analysis. Euphytica 2023, 219, 17. [Google Scholar] [CrossRef]
- Fehr, W.R.; Caviness, C.E.; Burmood, D.T.; Pennington, J.S. Stage of Development Descriptions for Soybeans, Glycine max (L.) Merrill 1. Crop Sci. 1971, 11, 929–931. [Google Scholar] [CrossRef]
- Yin, L.; Zhang, H.; Tang, Z.; Xu, J.; Yin, D.; Zhang, Z.; Yuan, X.; Zhu, M.; Zhao, S.; Li, X.; et al. rMVP: A Memory-efficient, Visualization-enhanced, and Parallel-accelerated Tool for Genome-wide Association Study. Genom. Proteom. Bioinform. 2021, 19, 619–628. [Google Scholar] [CrossRef] [PubMed]
- Zhang, R.; Jia, G.; Diao, X. geneHapR: An R package for gene haplotypic statistics and visualization. BMC Bioinform. 2023, 24, 199. [Google Scholar] [CrossRef] [PubMed]
- Wu, T.; Lu, S.; Cai, Y.; Xu, X.; Zhang, L.; Chen, F.; Jiang, B.; Zhang, H.; Sun, S.; Zhai, H.; et al. Molecular breeding for improvement of photothermal adaptability in soybean. Mol. Breeding 2023, 43, 60. [Google Scholar] [CrossRef] [PubMed]
- Zimmer, G.; Miller, M.J.; Steketee, C.J.; Jackson, S.A.; de Tunes, L.V.M.; Li, Z. Genetic control and allele variation among soybean maturity groups 000 through IX. Plant Genome 2021, 14, e20146. [Google Scholar] [CrossRef] [PubMed]
- Perfil’ev, R.; Shcherban, A.; Potapov, D.; Maksimenko, K.; Kiryukhin, S.; Gurinovich, S.; Panarina, V.; Polyudina, R.; Salina, E. Impact of Allelic Variation in Maturity Genes E1–E4 on Soybean Adaptation to Central and West Siberian Regions of Russia. Agriculture 2023, 13, 1251. [Google Scholar] [CrossRef]
- Wang, L.; Li, H.; He, M.; Dong, L.; Huang, Z.; Chen, L.; Nan, H.; Kong, F.; Liu, B.; Zhao, X. GIGANTEA orthologs, E2 members, redundantly determine photoperiodic flowering and yield in soybean. J. Integr. Plant Biol. 2023, 65, 188–202. [Google Scholar] [CrossRef] [PubMed]
- Hou, Z.; Fang, C.; Liu, B.; Yang, H.; Kong, F. Origin, variation, and selection of natural alleles controlling flowering and adaptation in wild and cultivated soybean. Mol. Breeding 2023, 43, 36. [Google Scholar] [CrossRef] [PubMed]
- Zhang, J.; Xu, M.; Dwiyanti, M.S.; Watanabe, S.; Yamada, T.; Hase, Y.; Kanazawa, A.; Sayama, T.; Ishimoto, M.; Liu, B.; et al. A Soybean Deletion Mutant That Moderates the Repression of Flowering by Cool Temperatures. Front. Plant Sci. 2020, 11, 429. [Google Scholar] [CrossRef] [PubMed]
- Staniak, M.; Szpunar-Krok, E.; Kocira, A. Responses of Soybean to Selected Abiotic Stresses—Photoperiod, Temperature and Water. Agriculture 2023, 13, 146. [Google Scholar] [CrossRef]
- Zhai, H.; Wan, Z.; Jiao, S.; Zhou, J.; Xu, K.; Nan, H.; Liu, Y.; Xiong, S.; Fan, R.; Zhu, J.; et al. GmMDE genes bridge the maturity gene E1 and florigens in photoperiodic regulation of flowering in soybean. Plant Physiol. 2022, 189, 1021–1036. [Google Scholar] [CrossRef] [PubMed]
- Xia, Z.; Zhai, H.; Liu, B.; Kong, F.; Yuan, X.; Wu, H.; Cober, E.R.; Harada, K. Molecular identification of genes controlling flowering time, maturity, and photoperiod response in soybean. Plant Syst. Evol. 2012, 298, 1217–1227. [Google Scholar] [CrossRef]
- Tang, Y.; Lu, S.; Fang, C.; Liu, H.; Dong, L.; Li, H.; Su, T.; Li, S.; Wang, L.; Cheng, Q.; et al. Diverse flowering responses subjecting to ambient high temperature in soybean under short-day conditions. Plant Biotechnol. J. 2023, 21, 782–791. [Google Scholar] [CrossRef] [PubMed]


| Environment | Minimum | Mean | Maximum | SD | CV% | Skewness | Kurtosis |
|---|---|---|---|---|---|---|---|
| AT | 803.00 | 1118.14 | 1588.00 | 155.98 | 13.95 | 0.27 | −0.40 |
| DE | 793.00 | 1022.90 | 1392.00 | 229.89 | 22.47 | −1.20 | −0.93 |
| PL | 797.00 | 1279.66 | 1796.00 | 278.43 | 21.76 | 0.02 | −1.48 |
| CH | 714.00 | 931.92 | 1341.00 | 139.22 | 14.94 | 1.23 | 0.68 |
| SRB | 1056.00 | 1167.70 | 1395.00 | 59.19 | 5.07 | 1.01 | 2.07 |
| Gene ID | Homologs | Functional Annotation |
|---|---|---|
| Glyma.06g204300 | AT5G60970 | TCP family transcription factor |
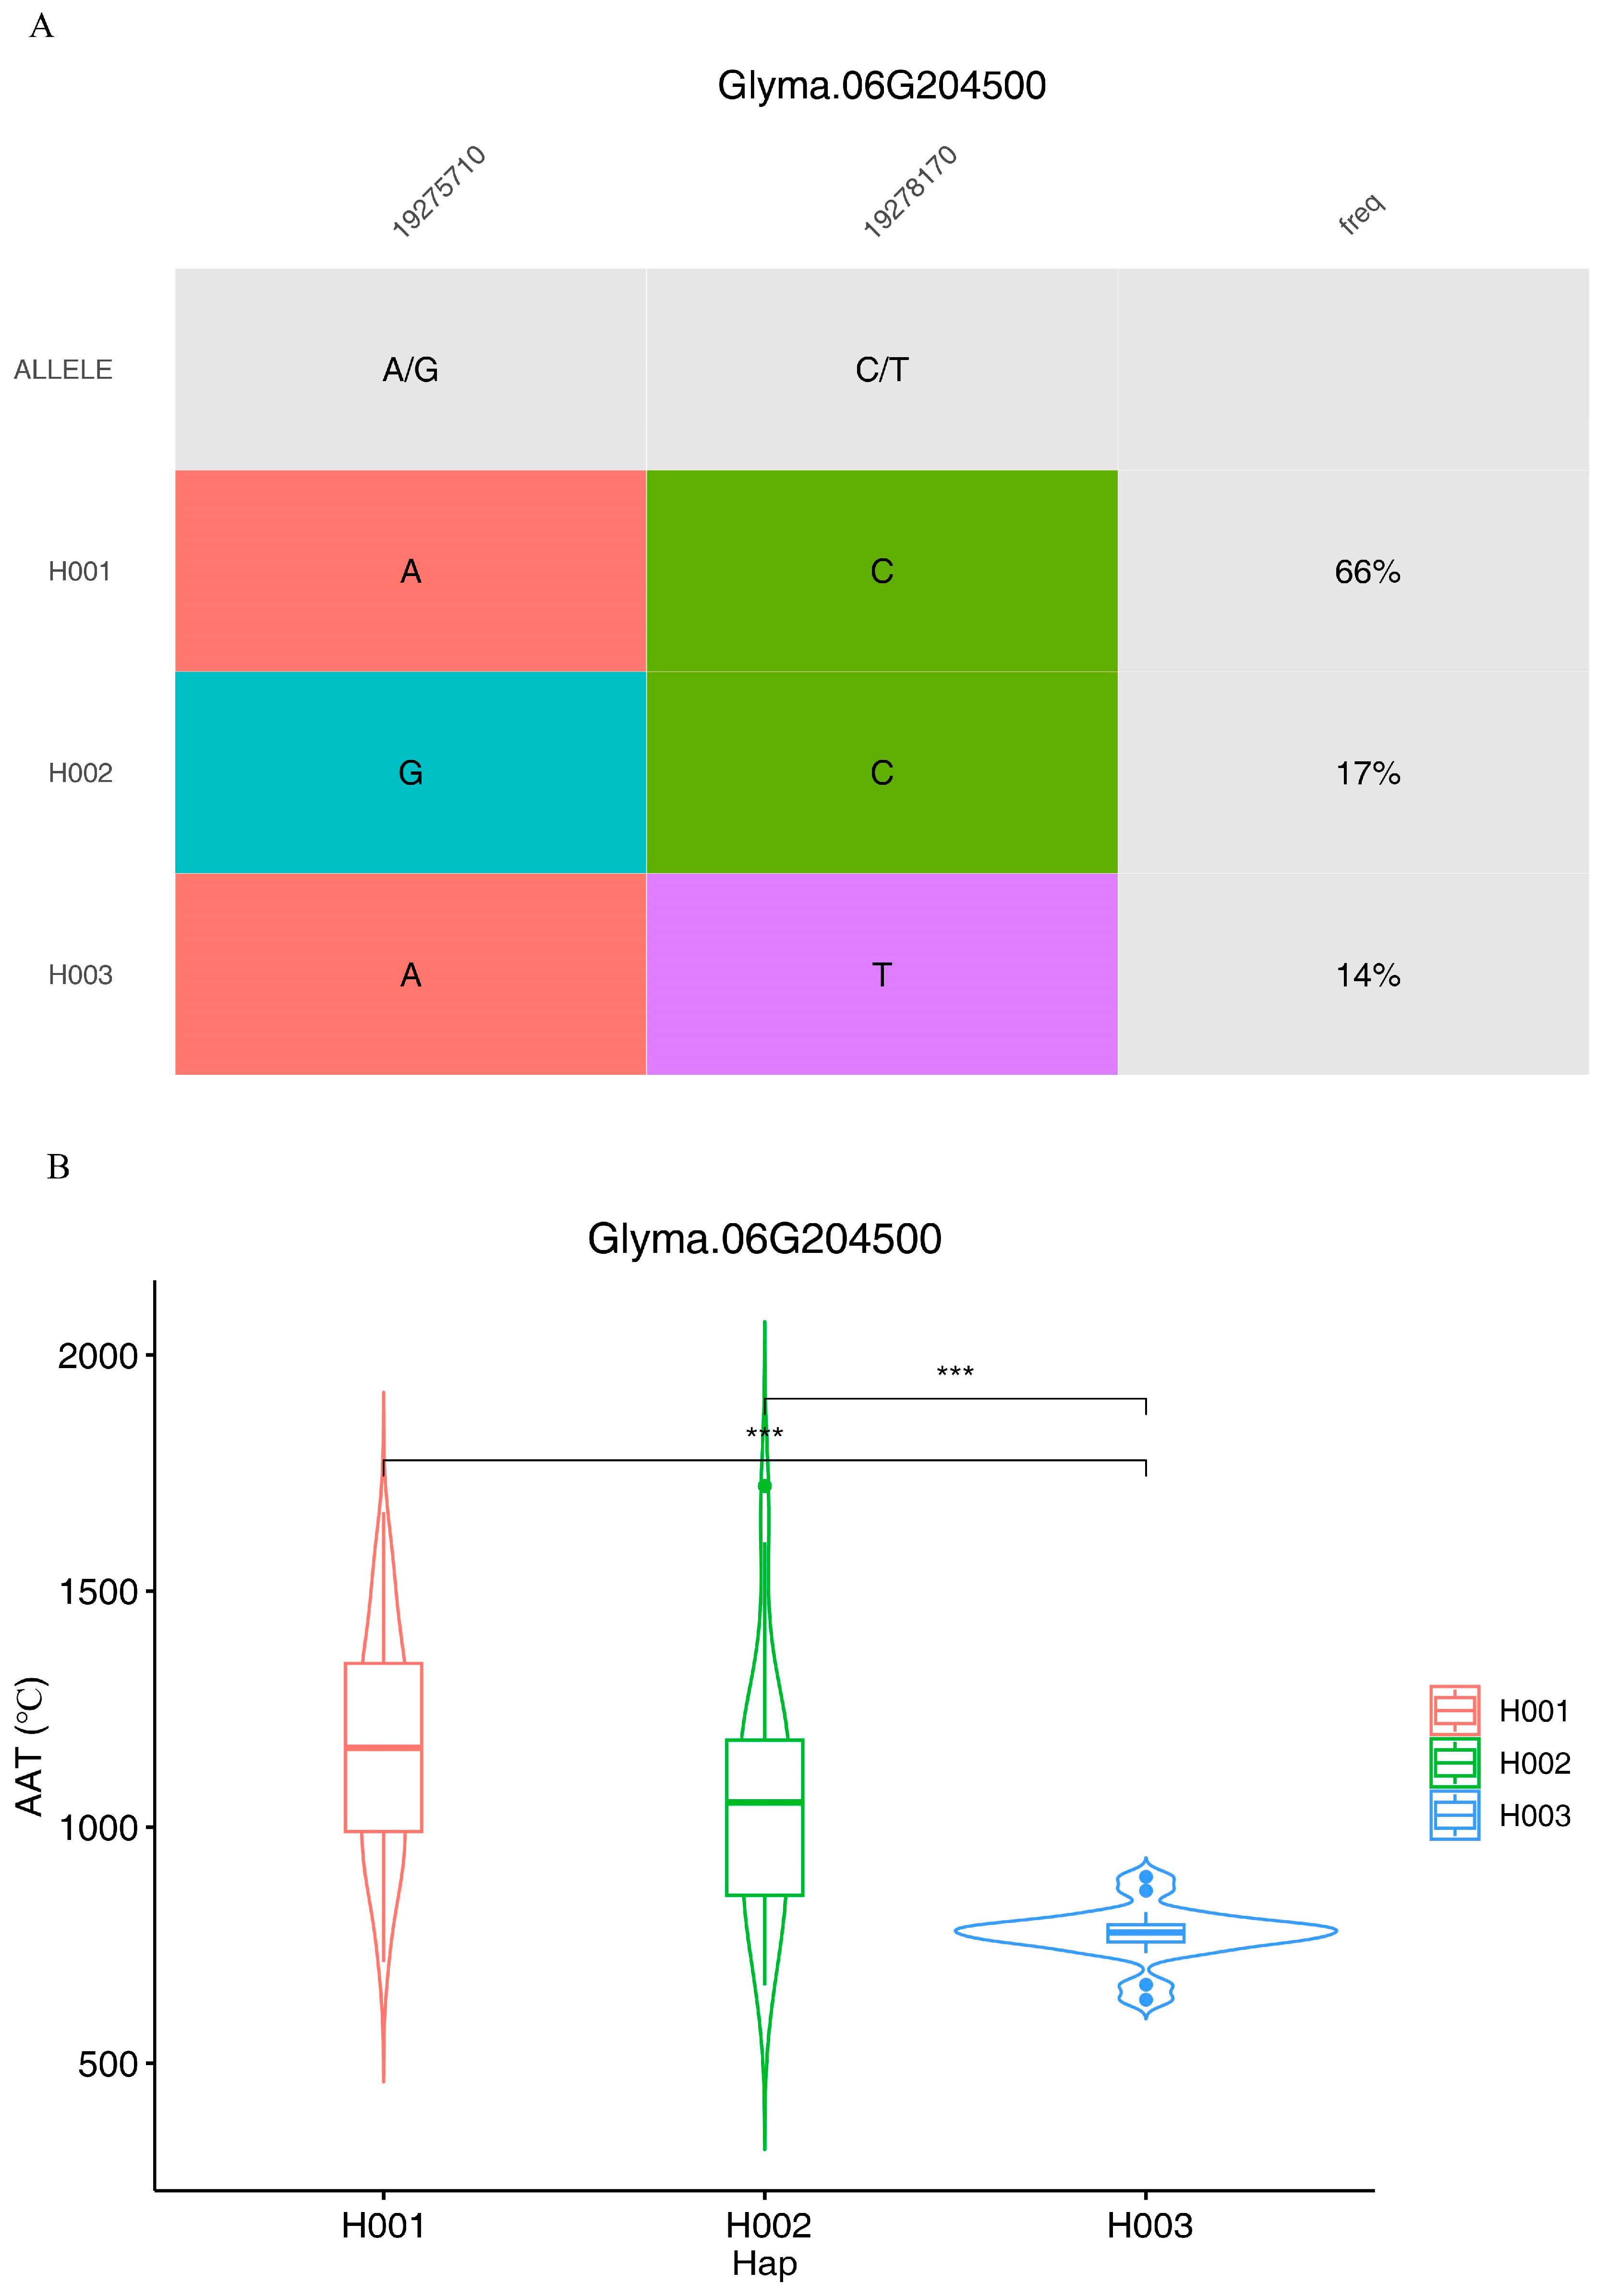
| Glyma.06g204500 | AT4G2619 | NLI interacting factor-like phosphatase |
| Glyma.06g204600 | AT3G26850 | histone-lysine N-methyltransferases |
| Glyma.06g204800 | AT1G18610 | KELCH REPEAT DOMAIN |
| Glyma.06g205000 | AT5G60940 | cleavage stimulation factor |
| Glyma.06g205400 | AT5G60920 | COBRA-like protein |
| Glyma.06g205600 | AT3G08900 | Reversibly glycosylated polypeptide |
Disclaimer/Publisher’s Note: The statements, opinions and data contained in all publications are solely those of the individual author(s) and contributor(s) and not of MDPI and/or the editor(s). MDPI and/or the editor(s) disclaim responsibility for any injury to people or property resulting from any ideas, methods, instructions or products referred to in the content. |
© 2024 by the authors. Licensee MDPI, Basel, Switzerland. This article is an open access article distributed under the terms and conditions of the Creative Commons Attribution (CC BY) license (https://creativecommons.org/licenses/by/4.0/).
Share and Cite
Yao, X.; Zhang, D. Genome-Wide Association Analysis of Active Accumulated Temperature versus Flowering Time in Soybean [Glycine max (L.) Merr.]. Agronomy 2024, 14, 833. https://doi.org/10.3390/agronomy14040833
Yao X, Zhang D. Genome-Wide Association Analysis of Active Accumulated Temperature versus Flowering Time in Soybean [Glycine max (L.) Merr.]. Agronomy. 2024; 14(4):833. https://doi.org/10.3390/agronomy14040833
Chicago/Turabian StyleYao, Xindong, and Dayong Zhang. 2024. "Genome-Wide Association Analysis of Active Accumulated Temperature versus Flowering Time in Soybean [Glycine max (L.) Merr.]" Agronomy 14, no. 4: 833. https://doi.org/10.3390/agronomy14040833