Abstract
The rice spike, a crucial part of rice plants, plays a vital role in yield estimation, pest detection, and growth stage management in rice cultivation. When using drones to capture photos of rice fields, the high shooting angle and wide coverage area can cause rice spikes to appear small in the captured images and can cause angular distortion of objects at the edges of images, resulting in significant occlusions and dense arrangements of rice spikes. These factors are unique challenges during drone image acquisition that may affect the accuracy of rice spike detection. This study proposes a rice spike detection method that combines deep learning algorithms with drone perspectives. Initially, based on an enhanced version of YOLOv5, the EMA (efficient multiscale attention) attention mechanism is introduced, a novel neck network structure is designed, and SIoU (SCYLLA intersection over union) is integrated. Experimental results demonstrate that RICE-YOLO achieves a mAP@0.5 of 94.8% and a recall of 87.6% on the rice spike dataset. During different growth stages, it attains an AP@0.5 of 96.1% and a recall rate of 93.1% during the heading stage, and a AP@0.5 of 86.2% with a recall rate of 82.6% during the filling stage. Overall, the results indicate that the proposed method enables real-time, efficient, and accurate detection and counting of rice spikes in field environments, offering a theoretical foundation and technical support for real-time and efficient spike detection in the management of rice growth processes.
1. Introduction
Rice, as one of the most crucial food crops globally, serves as a staple food for over 60% of the world’s population [1]. As a key reproductive and nutritional organ of rice, the accurate detection of rice spikes plays an important role in various field management applications, such as yield prediction [2], pest and disease detection [3], nutritional diagnosis [4], and growth stage identification [5]. However, conventional manual sampling and counting techniques fall short in meeting the escalating demand for rice spike detection in the field. To efficiently acquire rice spike images, accurately detect rice spikes, and alleviate labor costs, there is an urgent need for a convenient, rapid, and precise method of rice spike detection.
Over the past two decades, numerous researchers have explored the use of computer vision techniques for identifying rice spikes. Traditional machine learning methods depend on manual feature engineering and classification for spike detection [6,7,8]. However, the generalization ability of these methods drops significantly when the application domain or environment changes [9,10]. With the rapid development of artificial intelligence technology, deep learning-based object detection methods have demonstrated excellent performance in the agricultural field, introducing innovative possibilities for detecting various crops, including wheat [11], maize [12], sorghum [13], rice [14], and others [15]. These methods are mainly classified into two categories: pixel-based semantic segmentation and target-based detection.
Pixel-based semantic segmentation is a method that utilizes complex deep learning models for the detailed analysis of pixel-level features, accurately classifying each pixel in an image into predefined categories. This approach is exemplified by the use of models such as FCN [16], U-Net [17], and Mask-RCNN [18]. Hong et al. [19] presented an enhanced Mask R-CNN for rice spike detection, integrating Otsu preprocessing of rice images under field conditions to improve rice spike detection efficiency. Target-based deep learning models fall into two categories, namely two-stage detection models and single-stage detection models. The first category is two-stage detection methods, known for their high detection accuracy but slower speed, such as Faster RCNN [20], Cascade RCNN [21], etc. Zhou et al. [22] developed and implemented a spike detection and counting system based on improved region-based fully convolutional networks. By generating a series of bounding boxes containing the detected rice spikes and comparing the number of spikes in each box with manually labeled results, they demonstrated the accuracy of their system in rice detection and counting in the field. Tan et al. [23] proposed a new architecture, RiceRes2Net, based on an enhanced Cascade RCNN, to enhance the efficiency of rice spike detection and to classify rice spike images captured by smart phones in the field. The utilization of deep learning models for spike detection in the above study showcases its effectiveness. The single-stage detection methods are well-known algorithms, such as SSD [24], RetinaNet [25], YOLOv5, YOLOv7 [26], YOLOv8, etc. Sun et al. [27] proposed an enhanced YOLOv4 method for detecting curved rice spikes, which utilized MobileNetv2 as a backbone network and combined focal point loss and attention mechanisms to enhance the detection of various types of rice spikes. Wang et al. [28] introduced a novel extreme value suppression method based on the YOLOv5 network, demonstrating higher robustness and accuracy in recognizing rice spike images captured by smart phones.
However, these studies primarily focus on detecting rice within small regions, with the results often used for close-range field photography and counting of rice. In such scenarios, where rice sizes are normal, modifying the loss function (Wang) and utilizing lightweight modules (Sun) are applicable. In contrast, drone-captured field rice spike images present challenges such as a larger capture range, minor spikes, and severe occlusion issues at the image edges. Research on drone-based detection has provided valuable insights [29,30,31]. Lyu et al. [32] used a drone equipped with a high-resolution camera to capture rice spike images at a height of 1.2 m, and then employed Mask R-CNN for rice spike detection. The experimental results demonstrated that this method achieved an average precision of 79.46% and is suitable for field detection of rice spikes. Teng et al. [33] enhanced the YOLOv5 model by incorporating a feature extraction module and integrating the SE attention mechanism. They developed an online rice spike detection platform based on this improved algorithm, demonstrating the feasibility of accurately detecting rice spikes in the field using drone. However, the abovementioned studies failed to consider the small size and prominent edge features of drone-captured rice spikes, making the proposed methods inadequate for accurate drone-based rice spike detection.
Therefore, in response to occlusion, dense distribution, and small targets in drone-captured rice spike images, a novel detection method was proposed, which can be deployed on drone platform for real-time detection of rice spikes in the field for future application. Given the requirement for a compact model size, YOLOv5 from the single-stage network was selected as the baseline model. Compared to existing studies, our research focuses on the challenging identification of rice spikes in the field with unique texture features. An EMA (efficient multiscale attention) attention mechanism emphasizing the width and height directions was introduced to enhance the model’s feature extraction capabilities for rice spike edges. Additionally, a novel neck network design was proposed, indicating that in the drone’s perspective, not only can small object detection layers be added but also detection heads for large objects can be removed. Furthermore, addressing edge deformation distortion, the incorporation of the SIOU (SCYLLA intersection over union) loss function may lead to favorable outcomes. Finally, the detection accuracy and practical applicability of the improved model are comprehensively evaluated via experimental analysis.
2. Materials and Methods
2.1. Experimental Site
In this study, Research Centre Shapu, located in Zhaoqing, Guangdong Province, China (23.16° N and 11.57° E), served as the primary site for conducting a comprehensive rice cultivation experiment. A double-season rice planting scheme was implemented, utilizing four distinct rice varieties (Huahang No. 51, Huahang No. 57, Guangyou 2156, Liangyou 3089), two different planting densities (30 × 21 or 30 × 14 ), and five levels of nitrogen fertilizer (0/45/90/180/270/360 kg/hectare). In total, 30 planting patterns were formed, with 3 repetitions in 90 experimental plots per season. Detailed information regarding the experimental locations and the design of the double-cropping rice experiments can be found in Figure 1.
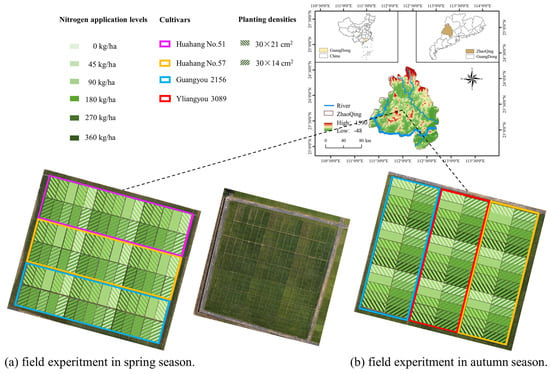
Figure 1.
Research site and double–season rice experiment design.
2.2. Image Acquisition
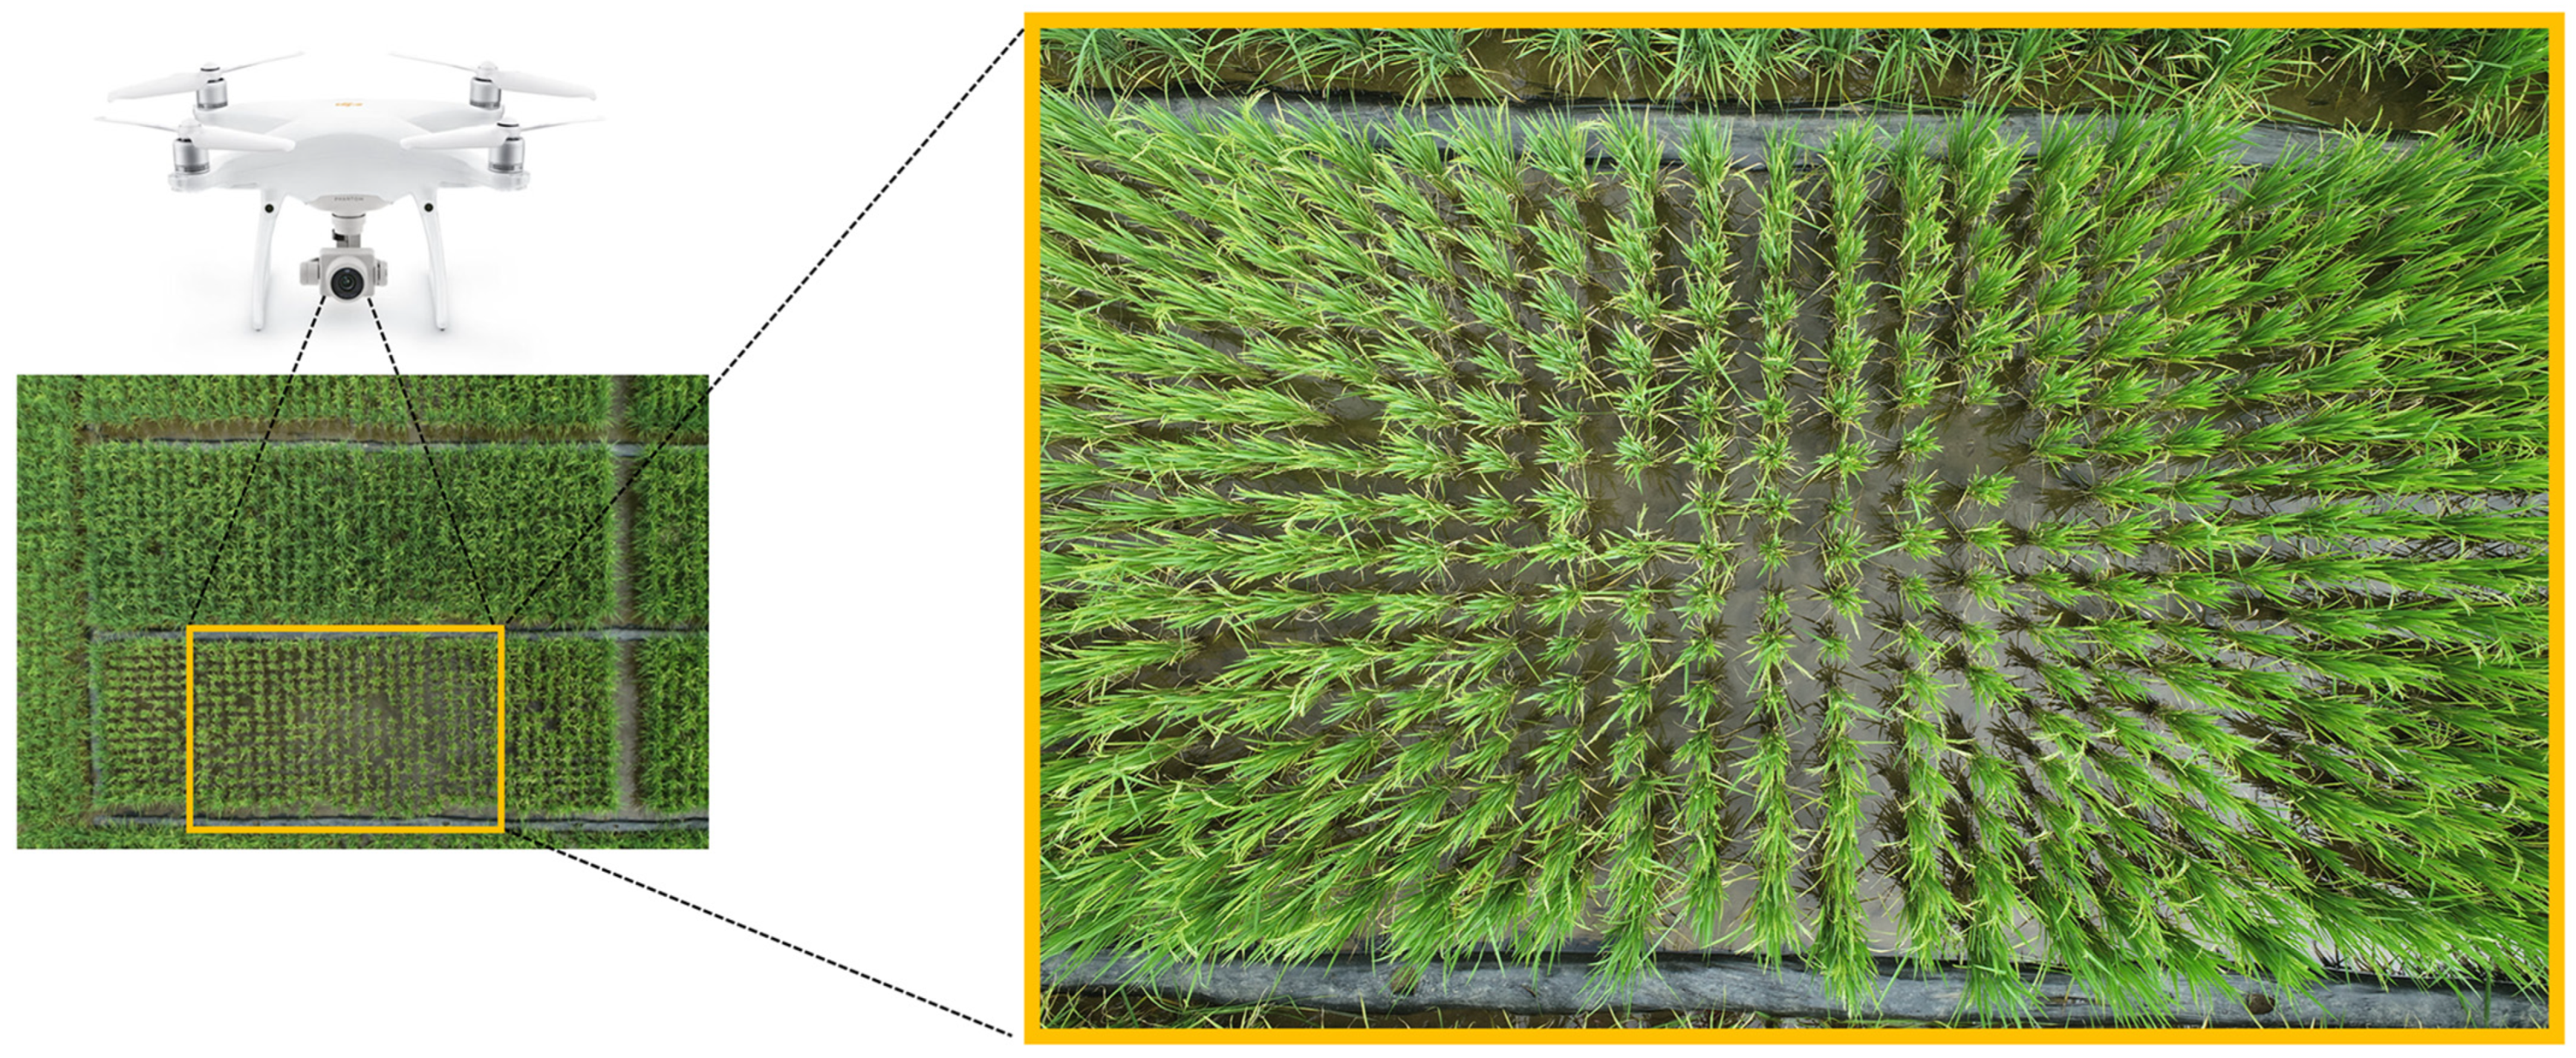
A DJI Phantom 4 RTK drone was employed for image acquisition to obtain the rice canopies, capturing images by its built-in camera from a height of 5 m directly above the central area of the rice field plots, as shown in Figure 2. The camera model is FC6310R with a resolution of 5472 × 3648 pixels. The images were captured from 9 a.m. to 11 a.m., and from 2 p.m. to 5 p.m., from 90 planting plots of each planting seasons, inevitably encompassing shadows, paddy fields, and varying light conditions.

Figure 2.
Image acquisition using drones.
2.3. Data Preprocessing
2.3.1. Image Cropping
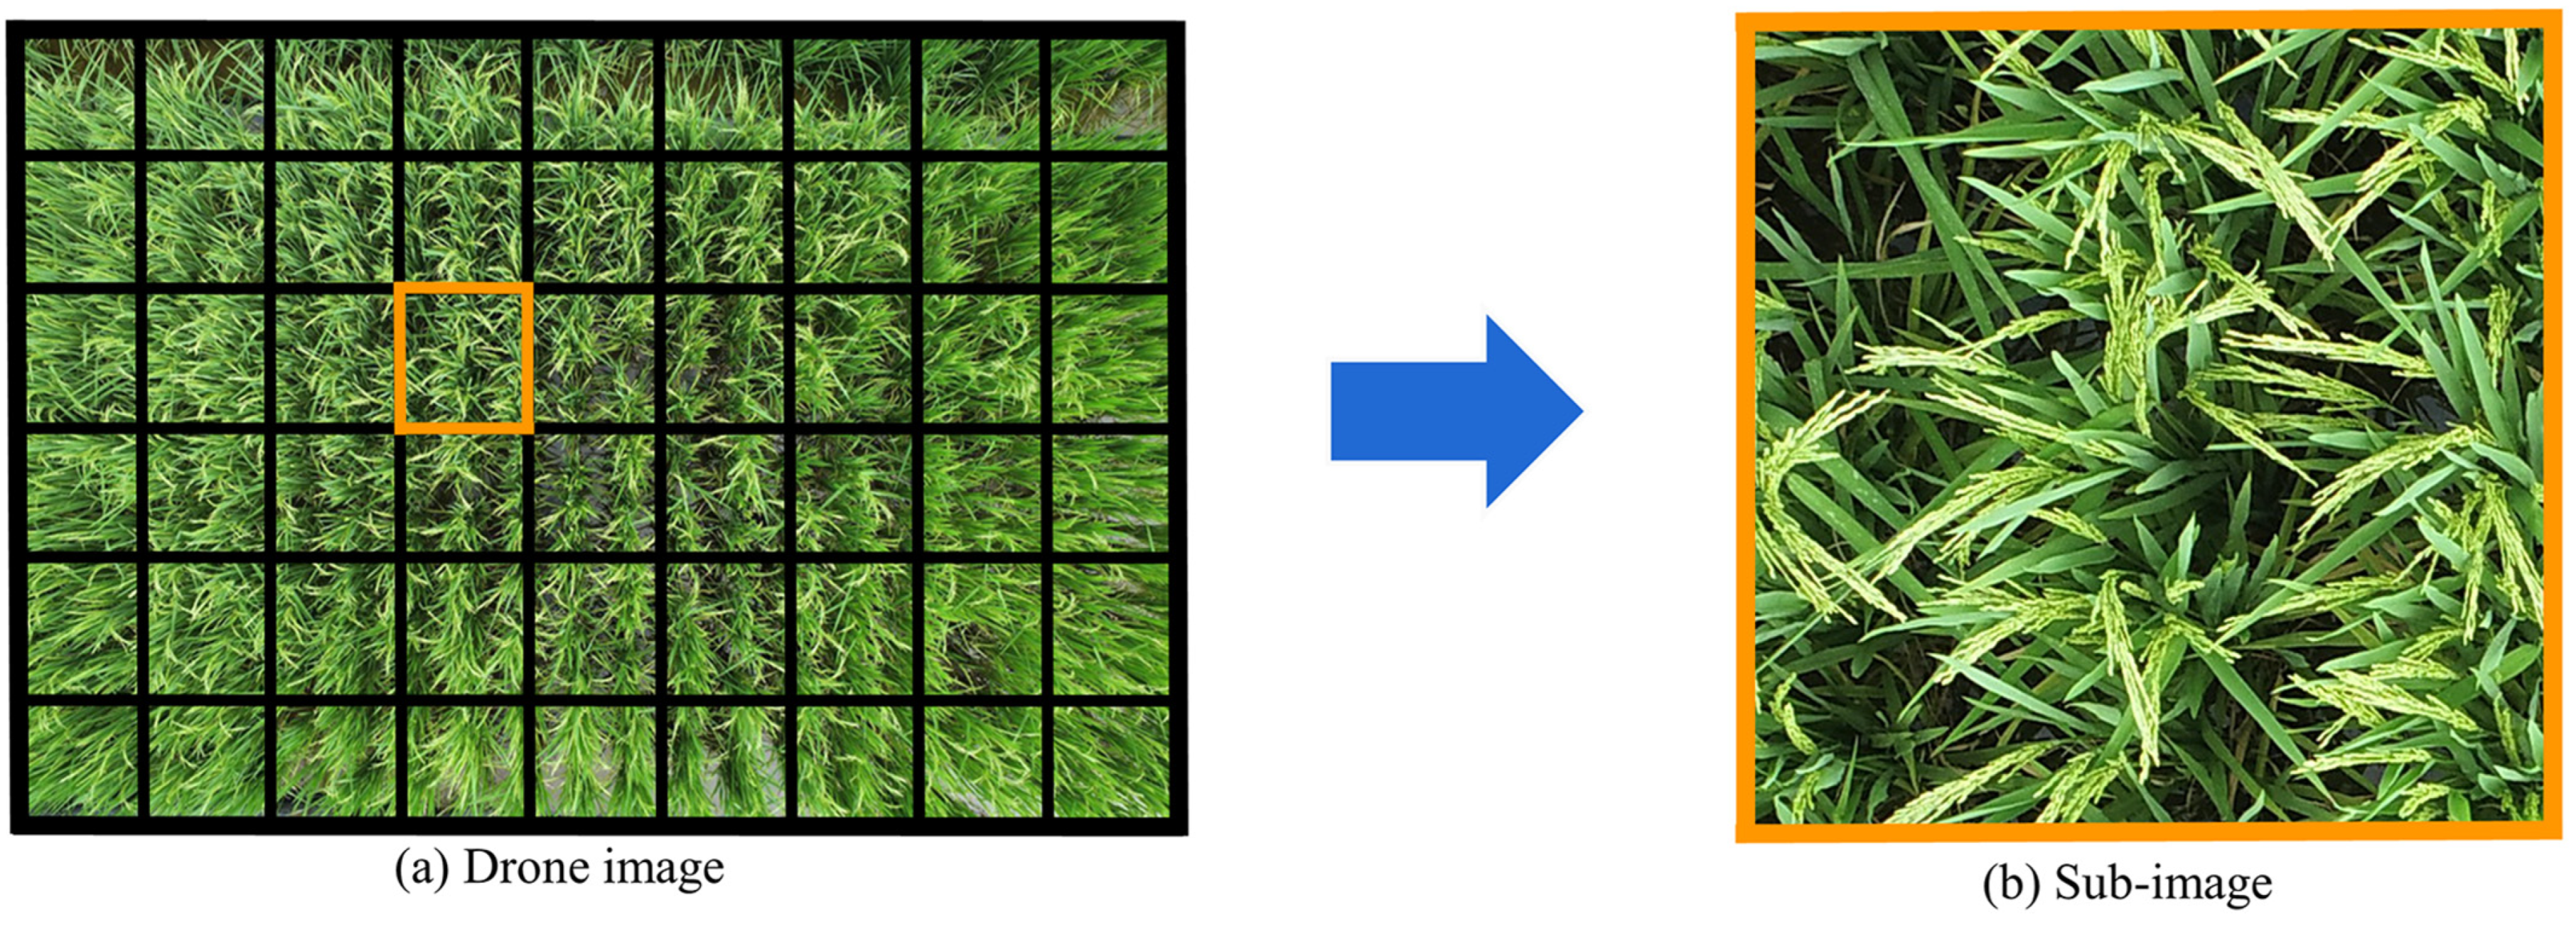
After data acquisition, rice images acquired by drone cover a large range of the field plot, and the resolution of rice images is 5472 × 3648 pixels which increase data processing time in later deep learning training process. Hence, this study crops the original image into 54 equal-sized subimages, organized in a grid layout of six rows by nine columns, as illustrated in Figure 3. The cropped images are beneficial to optimize model training and algorithm efficiency. Each cropped subimage has a resolution of 608 × 608 pixels.
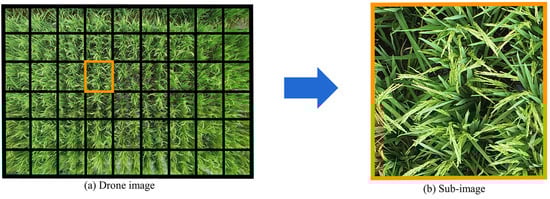
Figure 3.
Image cropping process.
2.3.2. Manual Annotation
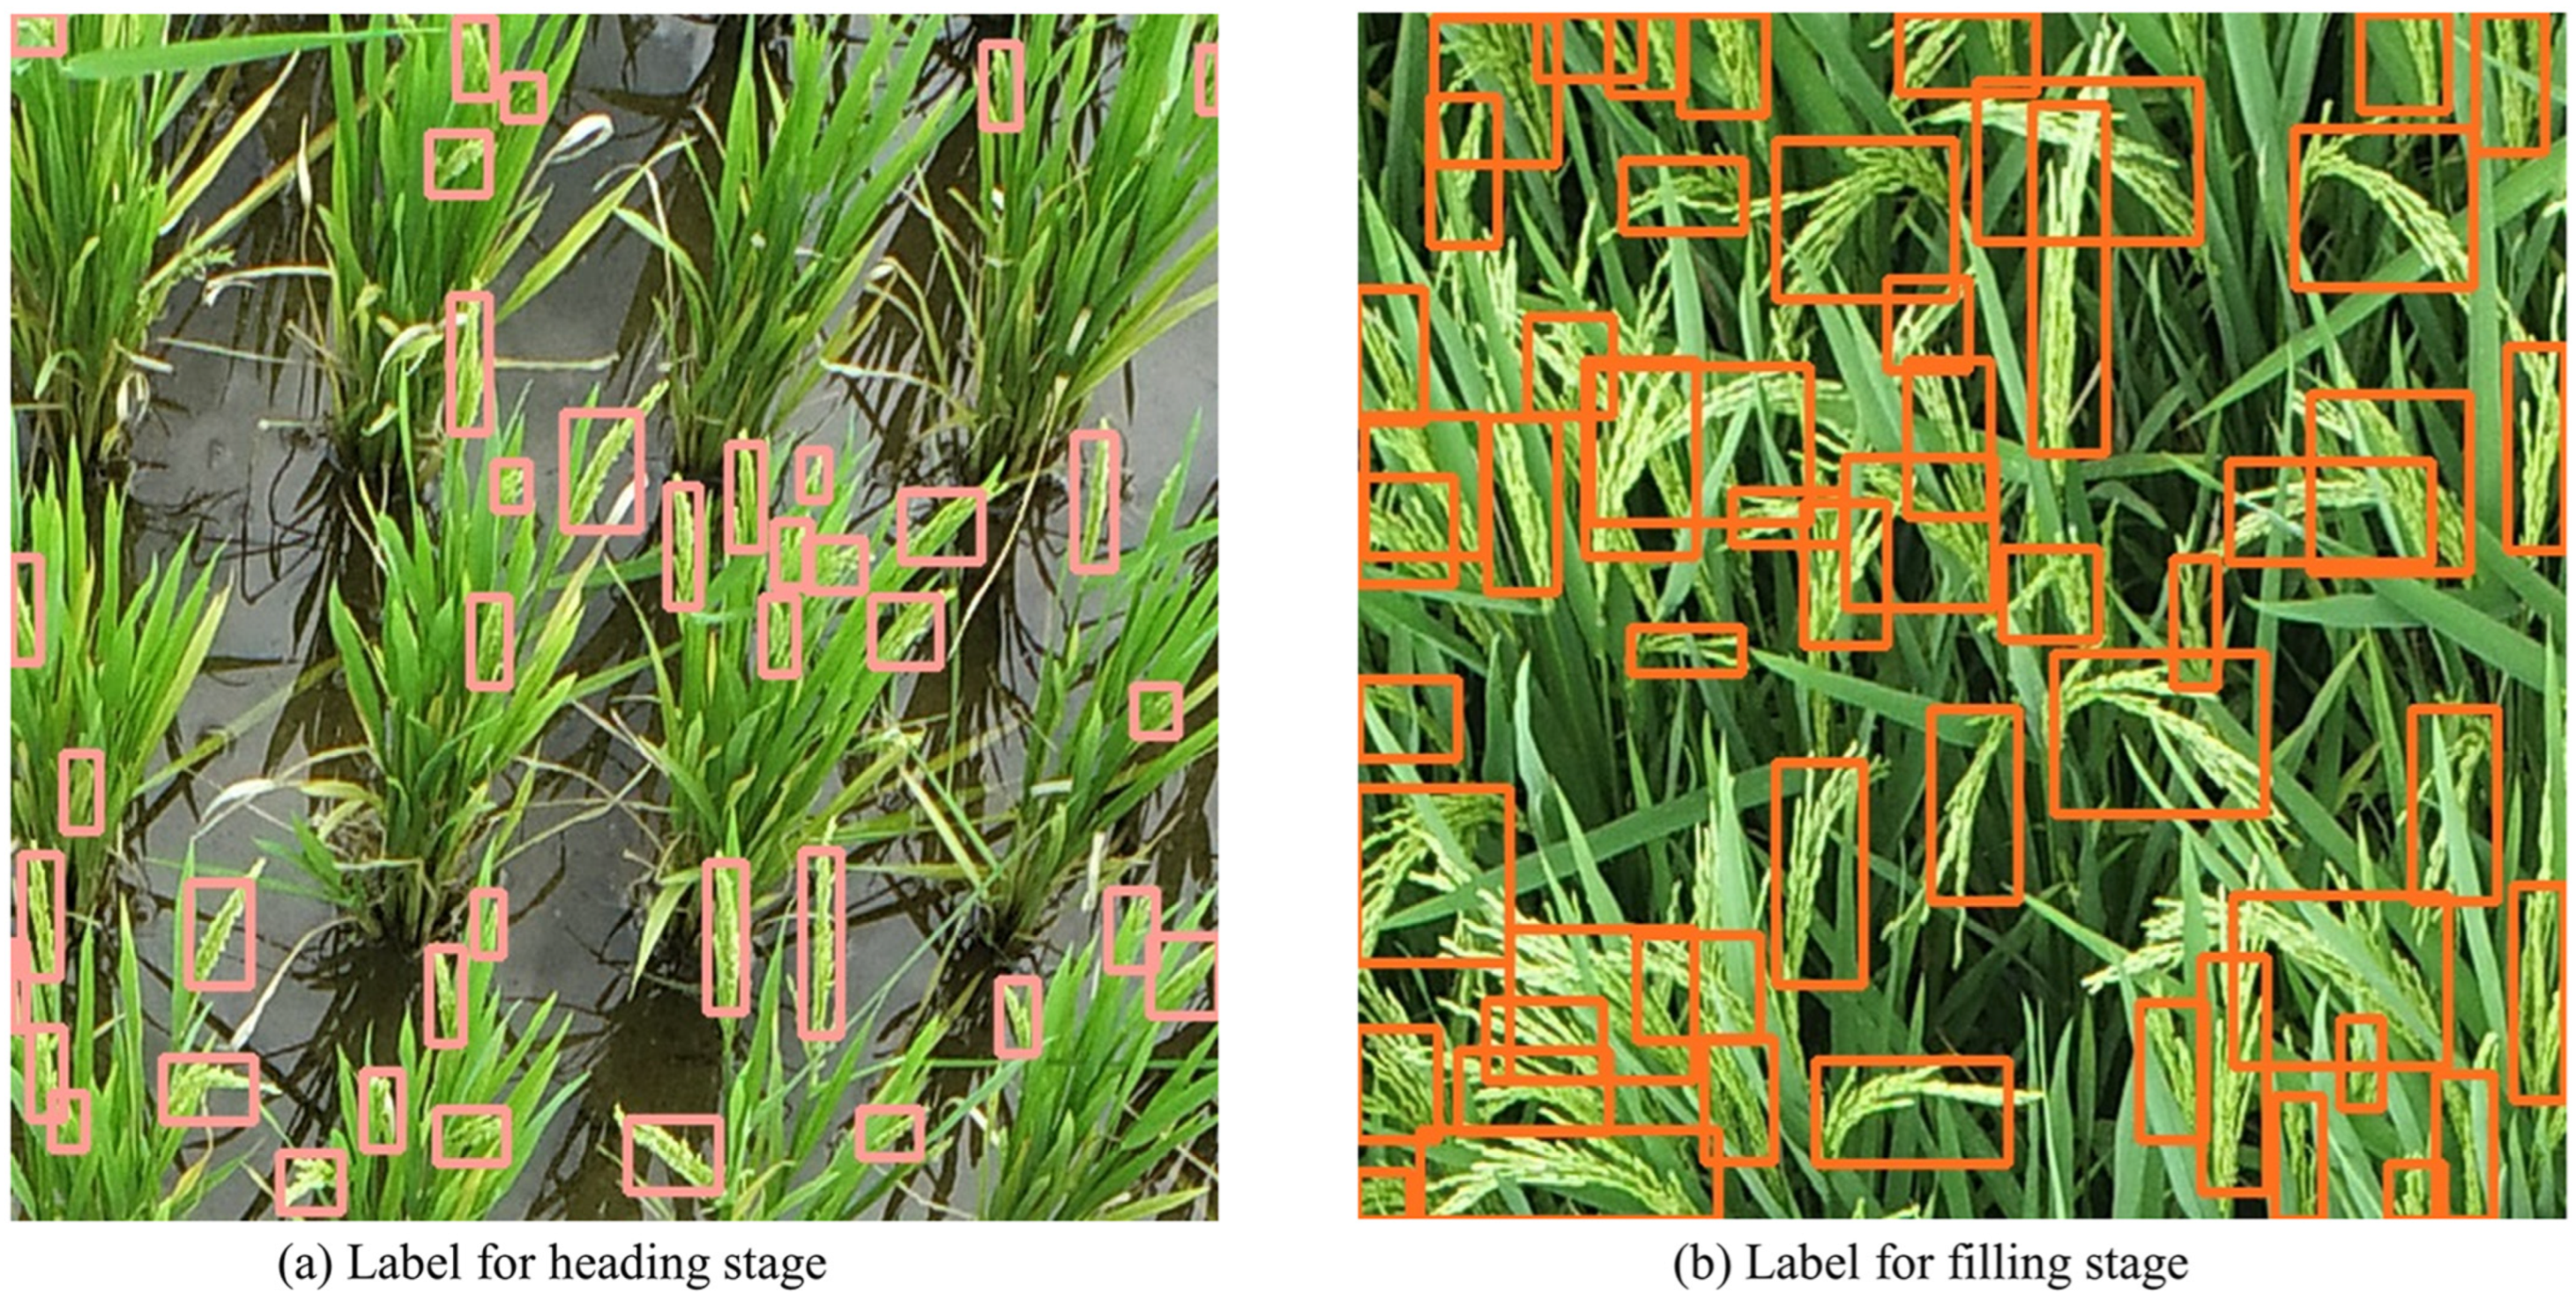
Rice spike images at the heading stage and filling stages were selected, and rice cultivated in autumn was used as the training set, while rice cultivated in spring was used as the test set. The open-source image annotation tool, LabelImg, was used to outline the minimal outer rectangular bounding box around each spike. Different colors, as shown in Figure 4, were used to distinguish spikes at different growth stages. Specifically, pink is used for heading stages and orange is used for filling stages. After image cropping, there were 3253 images selected at the heading stage and 1771 images at the filling stage, with a total of 5024 images. These images were divided into training and test sets in an 8:2 ratio for model training and evaluation. After image annotation, 79,160 and 22,792 bounding boxes were labeled in training and test images of rice spike of heading stages, respectively. Meanwhile, 54,016 and 20,255 bounding boxes were labeled in training and test images of rice spikes of filling stages, respectively. The construction of rice spike dataset is shown in Table 1.

Figure 4.
Manually labeled images of spikes at different growth stages. Pink boxes are spikes at heading stage and orange boxes are spikes at filling stage.

Table 1.
Rice spike dataset construction.
2.4. Data Augmentation
In our research, the built-in online data augmentation method of YOLOv5 was employed to bolster the generalization capabilities and resilience of our model in rice spike detection tasks. The improved YOLOv5 model incorporated various augmentation techniques during training. The probabilities of HSV (hue, saturation, value) transformations were 1.5%, 70%, and 40%, respectively. Other techniques included image flipping with a 50% probability, image translation with a probability of 10%, perspective transformation with a probability of 0.05%, and mosaic with a probability of 100%. Image flipping, a basic yet potent method, diversifies perspectives by flipping images horizontally or vertically. Adjusting HSV parameters allows for the emulation of rice under varying lighting conditions, enhancing model adaptability to environmental light fluctuations. Image translation, moving images randomly across the plane, improves target recognition across diverse locations. Perspective transformations offer simulations of rice from varied viewpoints, critical for the model’s accuracy and reliability in field scenarios. Introducing the mosaic technique, which combines four images into one, not only elevates scene complexity but also facilitates target recognition across scales. Figure 5 demonstrates the effects of data augmentation. This online data augmentation method effectively reduces memory consumption while meeting the data expansion requirements.
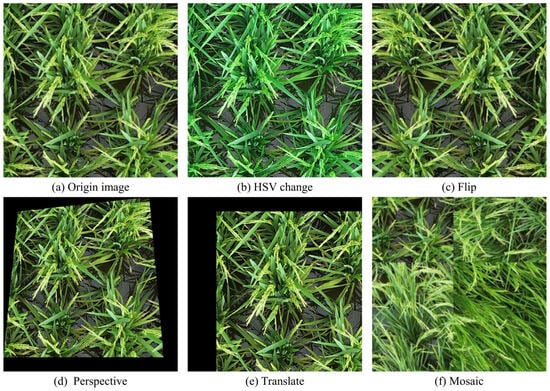
Figure 5.
Five data augmentation methods.
2.5. Improved YOLOv5 Model for Rice Spike Detection in the Field
YOLOv5 is a well-established target detection algorithm developed by Ultralytics [34]. The YOLOv5 version 6.0 is offered in five different size configurations: YOLOv5n, YOLOv5s, YOLOv5m, YOLOv5l, and YOLOv5x. It is reported that YOLOv5m demonstrates higher precision, balanced performance, and rapid target detection [35]. The network architecture comprises three main modules: the backbone network, the neck network, and the output layer. The backbone network comprises CBS (convolution, batch normalization, and SiLU activation functions), focus, C3 (CSP bottleneck with 3 convolutions), and SPPF (spatial pyramid pooling fast) modules, primarily tasked with extracting image features via progressive downsampling. The neck network incorporates top-down and bottom-up components to merge deep semantic features with shallow visual features, enabling deeper layers to integrate information from shallower ones. The output layer features three detection heads, providing category probability, confidence score, and target bounding box position information, yielding detection outcomes for targets of different sizes. The network architecture of YOLOv5 is shown in Figure 6a.
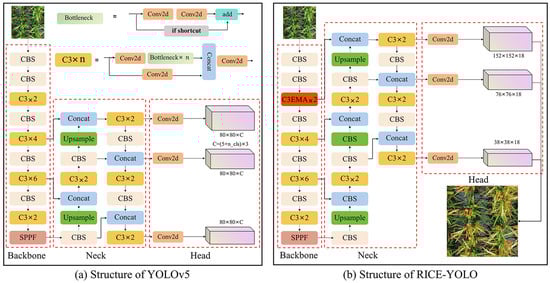
Figure 6.
Structure comparison of YOLOv5 and RICE-YOLO.
However, several downside characteristics of rice spikes acquired using drones are observed in our study: numerous small targets, rice spikes closely overlapped, and inevitable edge deformation in large images. YOLOv5 encounters challenges in accurately detecting rice spikes in such a complex scenario. Therefore, an improved YOLOv5, namely RICE-YOLO, was proposed. In the RICE-YOLO, the EMA module [36] was integrated into the first C3 module of the backbone to form the C3-EMA module to enhance important rice spike features and suppress irrelevant features. Then, the C3-EMA module of the backbone was introduced into the neck as a small target detection layer, aiming to improve the model’s recognition capability for small targets. Furthermore, the SCYLLA Intersection over union loss (SIoU) function introducing mismatched direction was employed to better predict the bounding boxes of rice spikes with deformations at the edges in drone-captured images. The network architecture of RICE-YOLO is shown in Figure 6b.
2.5.1. C3-EMA Module
When rice spikes and leaves were intertwined, mutual occlusion occurred, causing the model to encounter increased difficulty in accurately detecting rice spikes, resulting in a decrease in detection accuracy. It was observed that rice spikes exhibited prominent edge features, appearing as rough protrusions. However, the feature extraction process of YOLOv5 involved basic convolution operations on feature maps, which may not have effectively captured the edge features of rice spikes. Therefore, we introduced here the EMA attention mechanism.
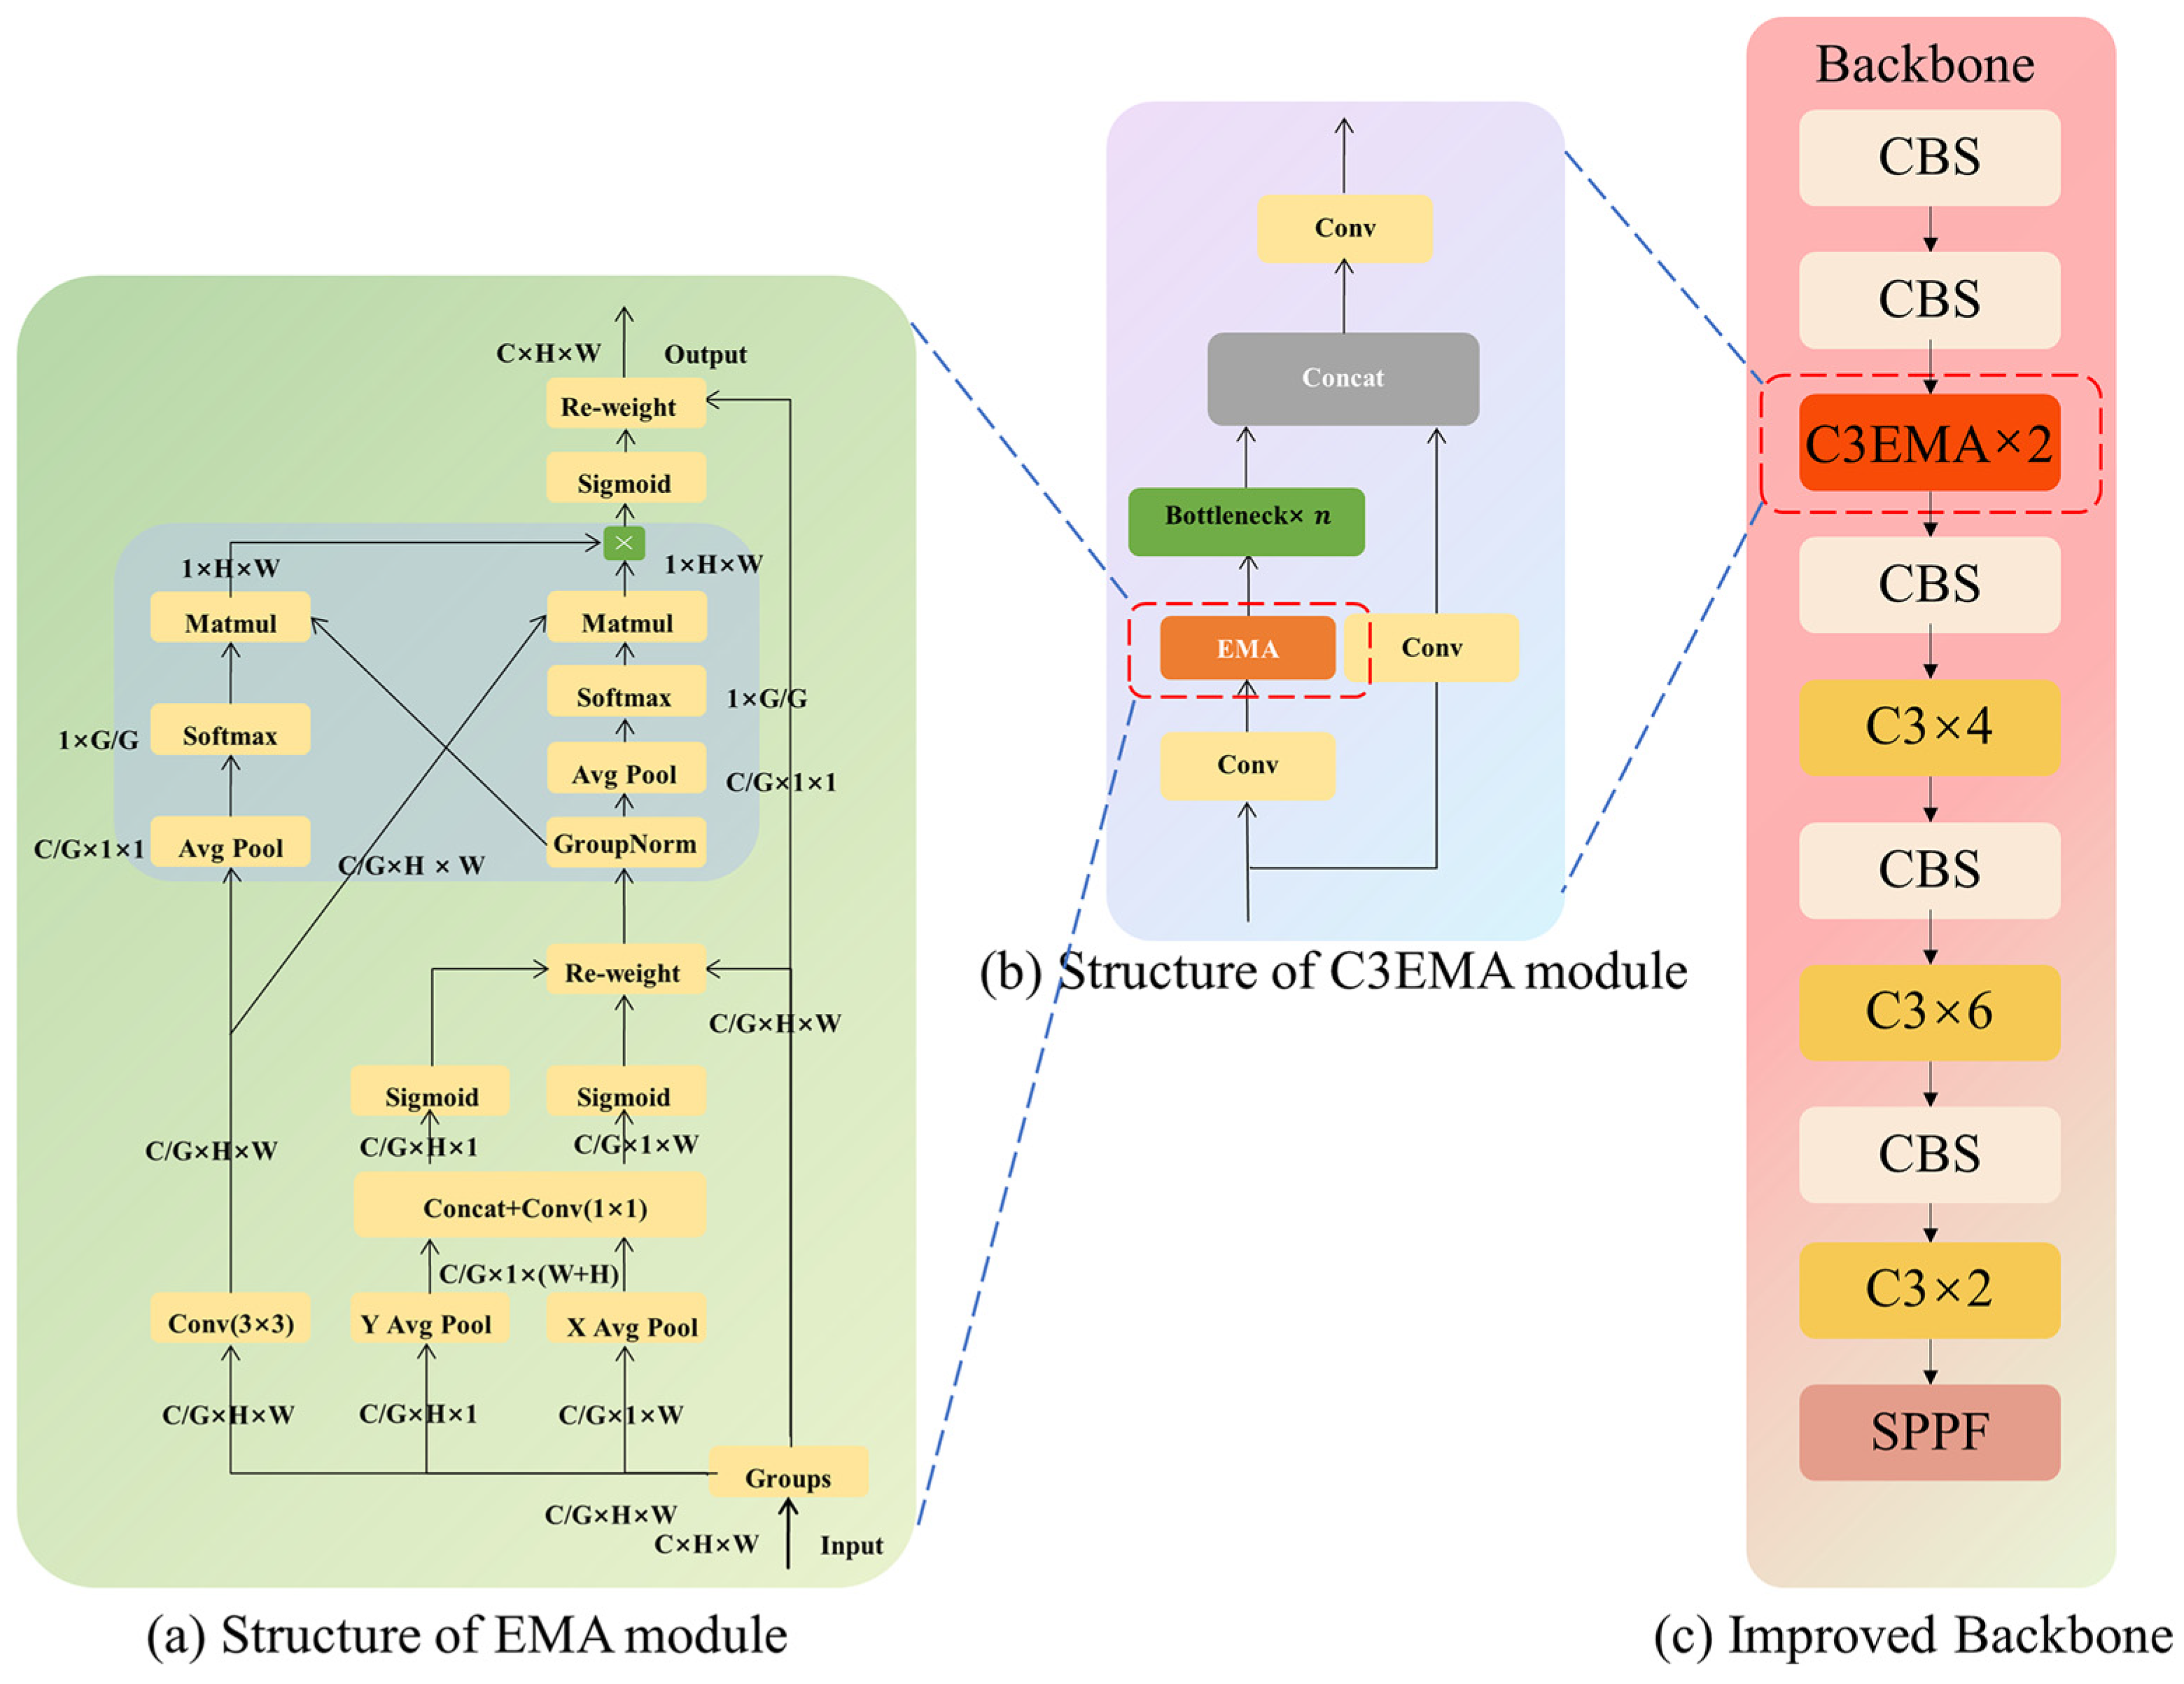
The feature extraction process of EMA is illustrated in Figure 7a. This helps establish effective short-term and long-term dependency relationships between features, leading to improved performance. Considering the strong feature extraction capability of the EMA attention mechanism, we integrate it with the C3 module to form the C3-EMA module, as depicted in Figure 7b.
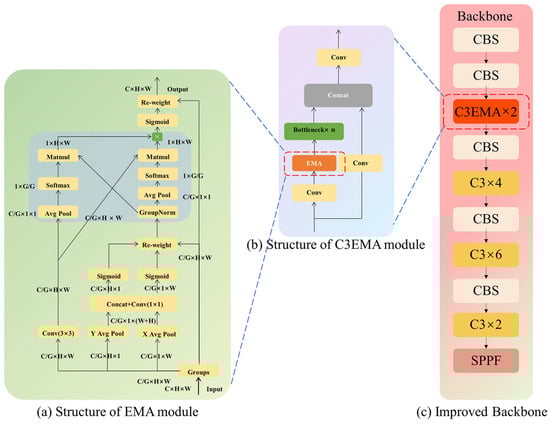
Figure 7.
C3-EMA Module.
Suppose the input features are given as , where H and W denote the height and width dimensions of the feature map, respectively, and C denotes the number of channels of the feature map. The EMA module divides the feature map’s channels C into G groups uniformly according to , where means that the spatial width and height of the features remain unchanged, and the number of feature channels in each group becomes G, totally C divided by G groups of features. Subsequently, three parallel computation routes are performed for each group of features. Two of these routes are processed via a subnetwork containing 1 × 1 convolutional kernels, which perform one-dimensional global average pooling of the feature set in the H and W directions, respectively, with subsequent splicing and group normalization. The equation for the pooling operation in this process is as follows:
In Equation (1), denotes the input feature of channel c. denotes the result of pooling operation on over the width after fixing the height, and similarly, in Equation (2), denotes the result of pooling operation on over the height after fixing the width, an operation that extracts information at different spatial locations in the feature map. The use of group normalization allows the EMA to perform intragroup statistics rather than global statistics, which improves the EMA’s ability to extract local features. The pooling operation that immediately follows is a 2D pooling of width and height to further compress the features, using Equation (3):
where denotes the result of the 2D pooling operation performed on the feature. For the 3 × 3 convolutional kernel subnetwork, the process remains largely unchanged, except for the omission of subsequent group batch normalization. The features extracted from both subnetworks are aggregated, subjected to a sigmoid activation, and then element-wise multiplied by a distinct set of original features. These augmented features are then reshaped to align with the initial input size to produce the final output.
2.5.2. The Improved Neck Network with Construction of Microscale Detection Layer
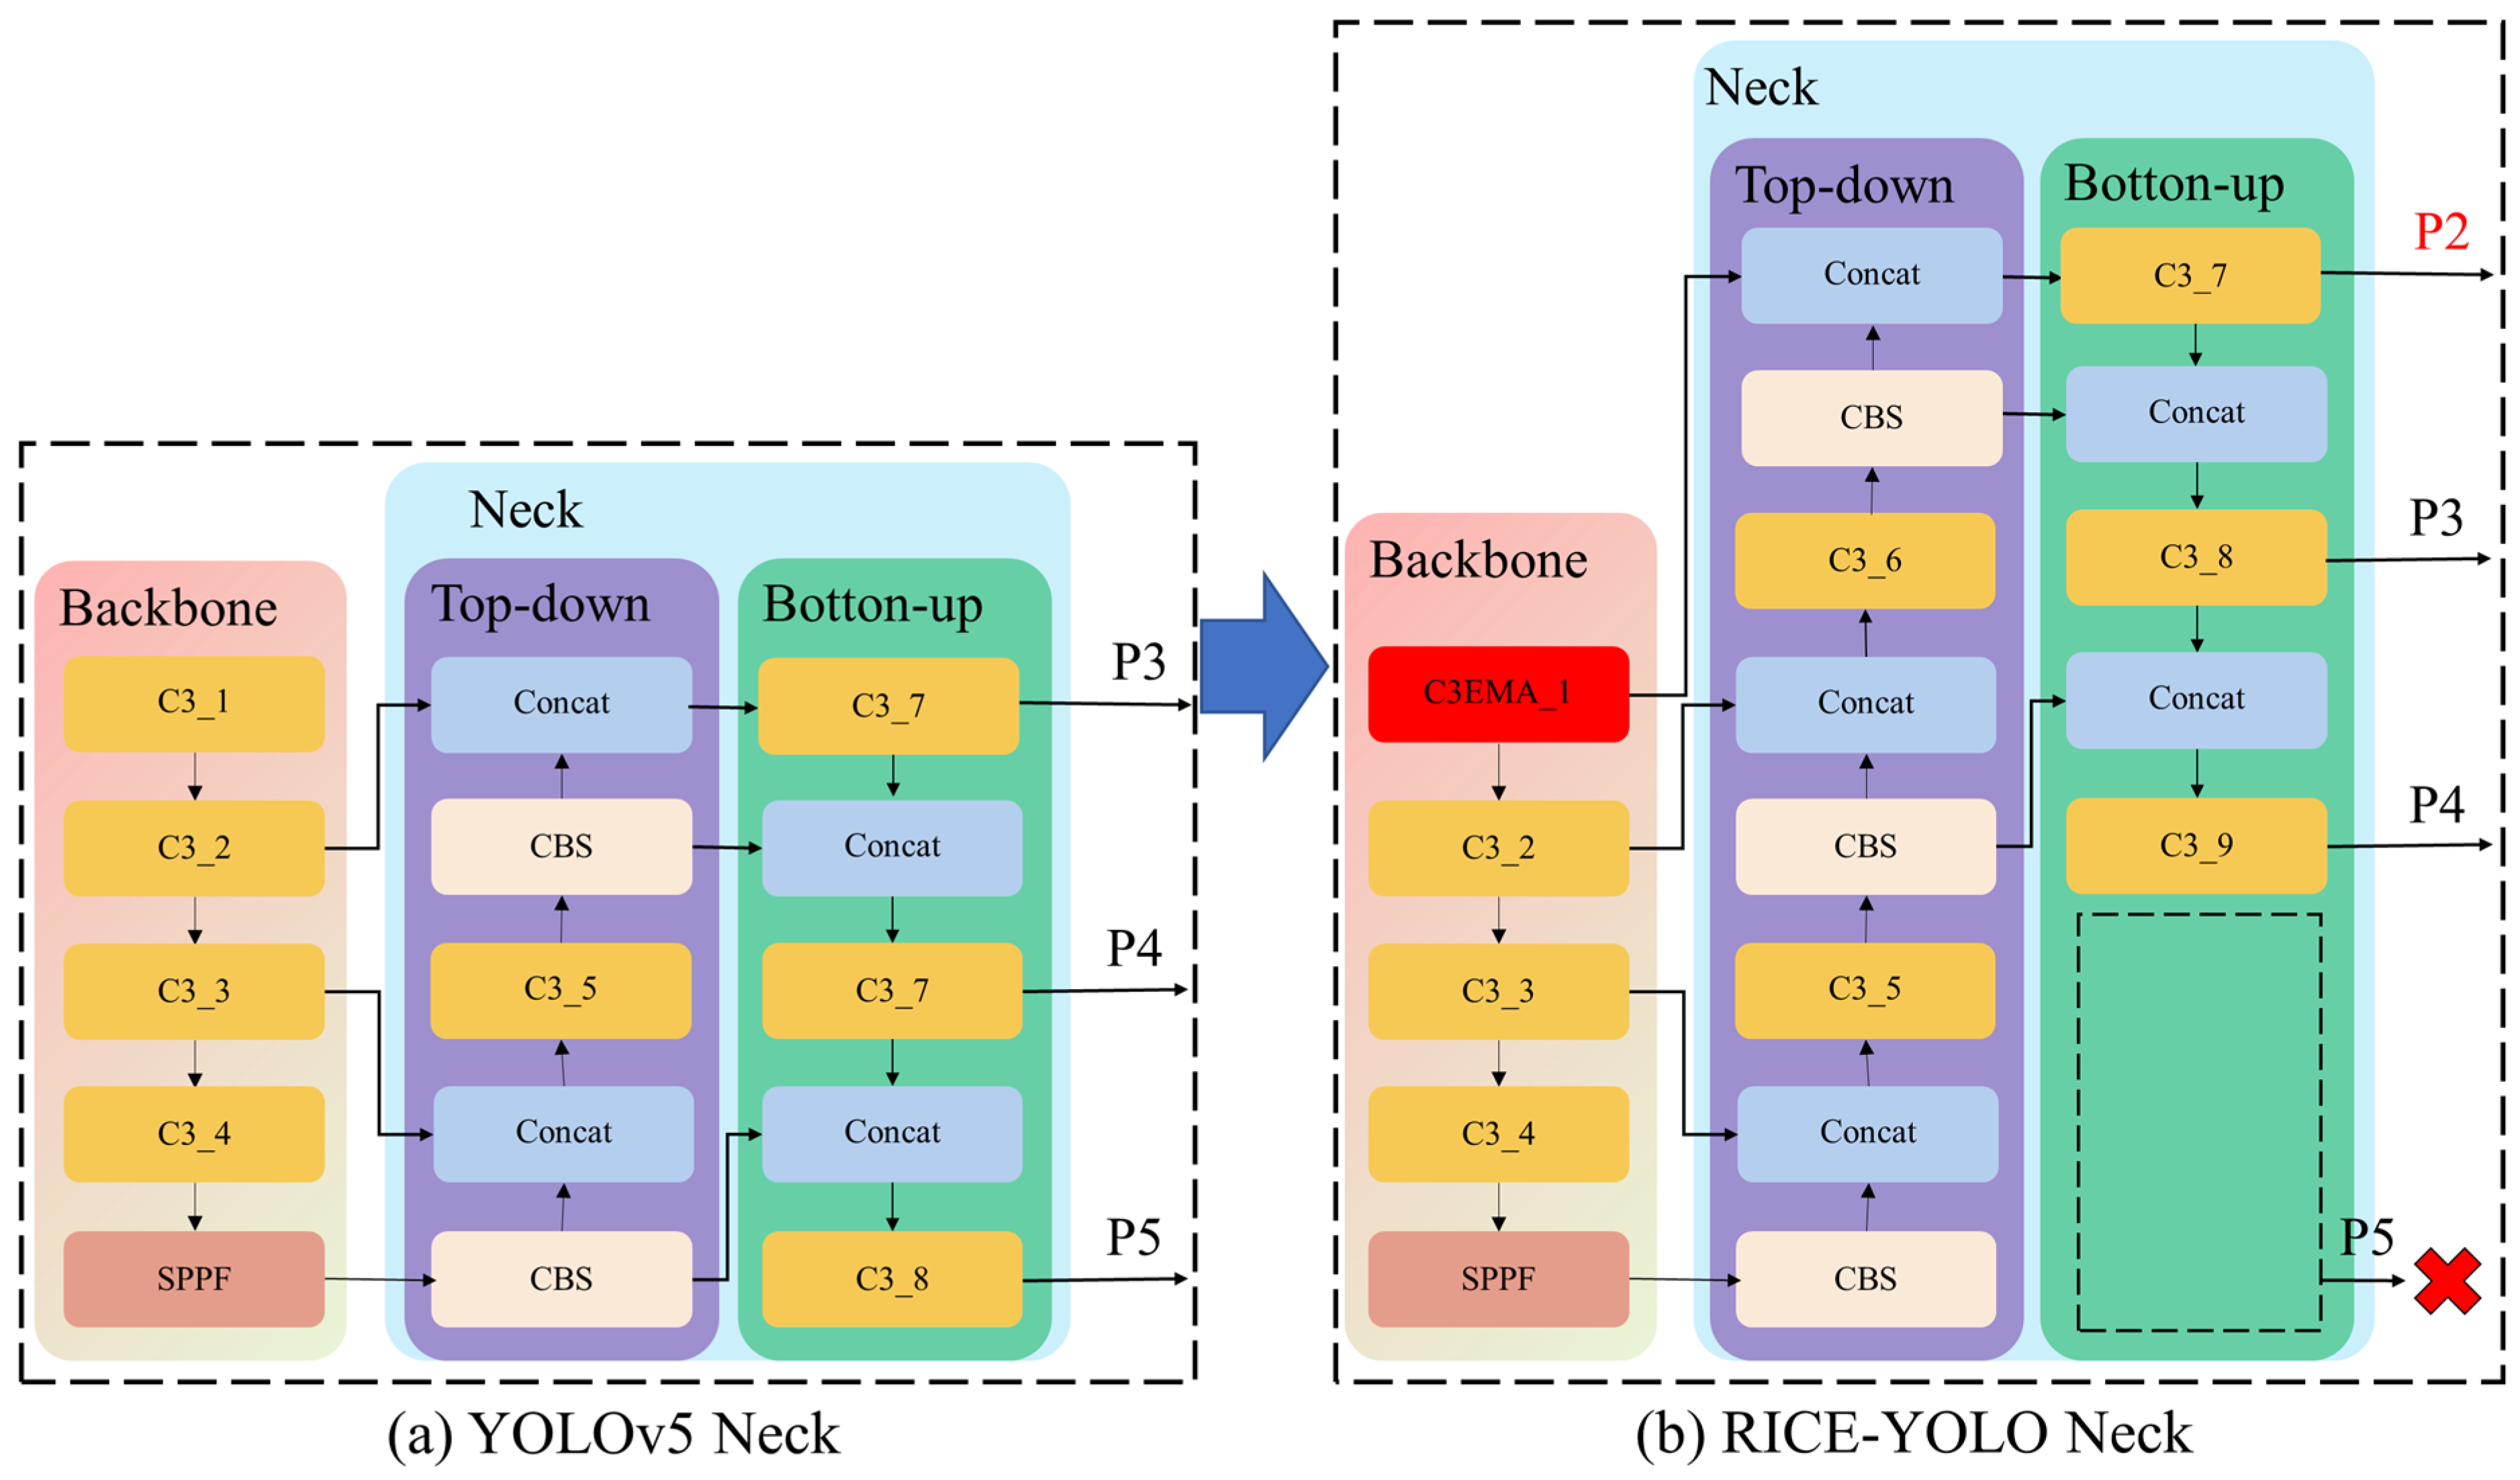
In deep learning networks, shallow features are typically abundant in detail but short of sufficient semantic information and have a smaller receptive field. Conversely, deep features offer robust semantic information while potentially fail to capture details adequately. YOLOv5 enhanced the integration of shallow and deep features within its neck network via the path aggregation network (PAN), thereby enriching the contextual semantic information. However, the rice dataset utilized in this study encompasses a considerable amount of small-scale rice spikes, towards which the original design of the neck network exhibited suboptimal detection performance. Consequently, a new neck network with enhanced small target detection capabilities was developed. The first C3 module of the backbone network was introduced to be a small object detection layer of the existing neck network and was used for the development of a deep feature detection head P2 specifically tailored for small-scale objects. This adjustment significantly bolstered the model’s capability to detect small-scale objects. Given the dataset’s characteristic scarcity of large objects, this study further eliminates the deep feature detection head P5 for large objects within the neck network. The revised neck network, depicted in Figure 8, incorporates the small-scale object detection layer C3_1 and removes the deep feature detection head P5 for large objects. This modification substantially enhances the detection accuracy for small rice spikes without compromising the detection efficacy of other objects, thereby achieving superior performance.
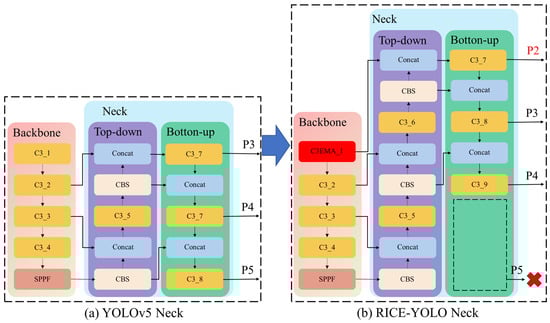
Figure 8.
Improved neck network.
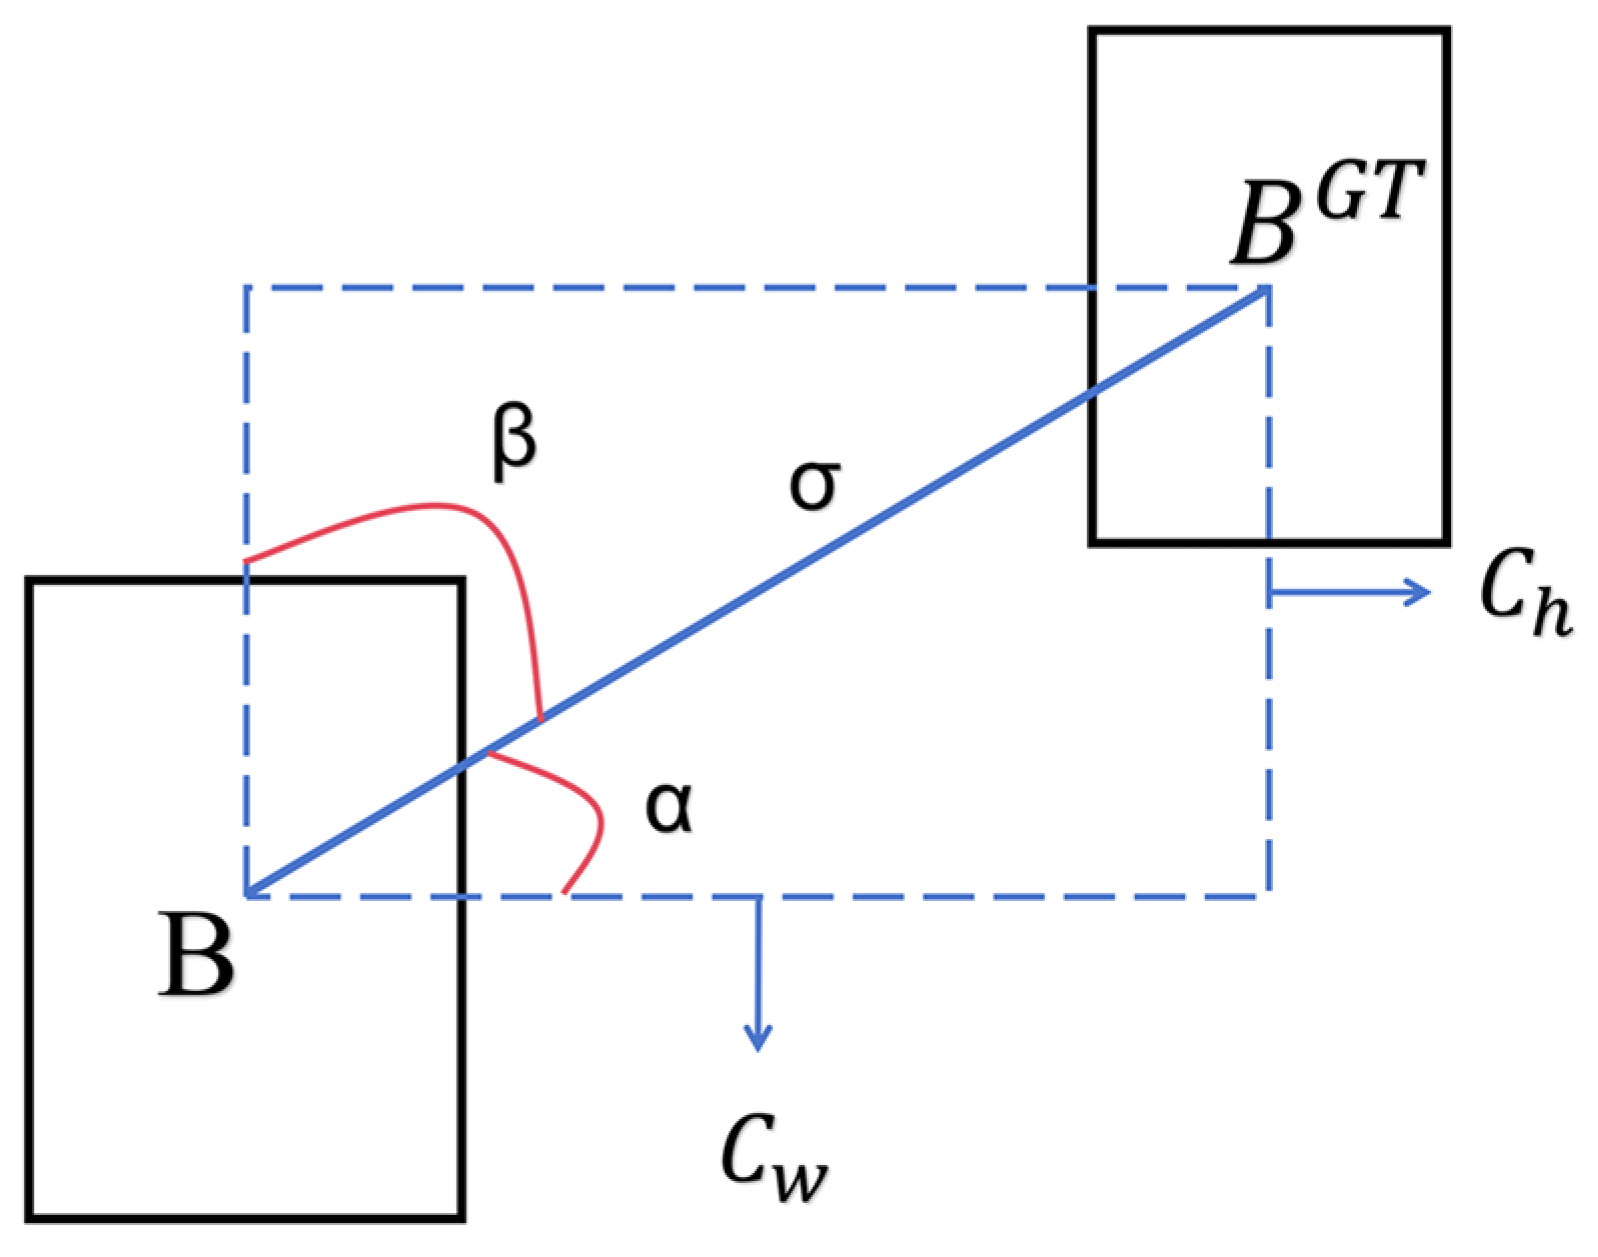
2.5.3. SIoU Loss Function
We introduce SIoU [37] to enhance the regression loss function of the original model. SIoU considers the directional error between the real bounding box and the predicted bounding box, redefining the associated loss function by incorporating the angle vector between the predicted bounding box and the real bounding box as a constraint. This method accurately represents the level of correspondence between the predicted and real bounding boxes, thereby improving detection performance.
As shown in Figure 9, where σ represents the distance between the centers of the real bounding box and the predicted bounding box and denote the differences in width and height of the centers, α is the angle between the centers of the two boxes and the X-axis, and β is the angle between the centers of the two boxes and the Y-axis. When the angle α is 0 or 180, the angle loss is 0. SIoU comprises four losses: angle loss, distance loss, shape loss, and IoU loss, as shown in the following equations:
In the above equations, e represents the natural constant, is the squared difference between the x-coordinates of the two center points, is the squared difference between the y-coordinates of the two center points, , Λ is the angle loss as defined in the Equation (4), is the absolute difference in width between the two boxes, is the absolute difference in height between the two boxes, and θ indicates the emphasis of the loss function on shape loss.

Figure 9.
SIoU loss function.
Figure 9.
SIoU loss function.
2.6. Evaluation Metrics
To objectively evaluate the detection performance of models on rice spike images captured using drones, this study selects five evaluation metrics, including mean average precision (mAP), precision, recall, number of parameters (Params), FLOPs (floating-point operations), and frames per second (FPS), to accurately assess the performance of the improved model.
In this study, P refers to the proportion of true rice spikes in the model’s predictions, while R indicates the ratio of correctly identified rice spikes to all actual rice spikes. In the Equations (9) and (10), TP represents true positives, indicating instances where the true class is rice spikes and the model predicts rice spikes; FP denotes false positives, where the model predicts rice spikes, but the true class is different background elements; FN stands for false negatives, representing cases where the true class is rice spikes, but the model predicts otherwise. Typically, when the model performs well, both P and R remain at a high level close to 1. Average precision (AP), the area under the curve of precision-recall (PR), is another indicator of model performance. while mAP is the average of AP, where i represents rice growth stage category, AP(i) is the value of the ith rice growth stage category, and n represents the number of rice growth stage categories. In our study, n is 2.
In the context of the other two metrics, the number of parameters (Params) is a key indicator for evaluating the size and complexity of the model, derived by summing the weight parameters of each layer in the model. The FLOPs (floating-point operations per second) metric reflects the number of floating-point operations the model can perform per second during the inference process, aiding in assessing the computational complexity and performance of the model.
2.7. Experimental Environment and Parameters
The experiment was conducted on the Ubuntu 20.08 operating system, utilizing PyCharm 2022, Python 3.8, PyTorch 1.8.1, and CUDA 11.3. The hardware setup consisted of an Intel I9-10700KF CPU (3.7 GHz base frequency), a NVIDIA GeForce RTX 3090 GPU (24 GB VRAM), and a RAM of 64 GB. The enhanced algorithm achieved peak accuracy within 300 epochs, with a batch size set to the maximum allowable by the GPU memory. After using the default hyperparameters on the YOLOv5, this study determined the hyperparameters list in Table 2.
Table 2.
Model parameters for this experiment.
3. Results
3.1. Analysis Performance of C3-EMA Modules
The C3 module adopts the CSPNet [38] architecture, comprising a CSP Bottleneck with three convolutional layers. The C3 module splits the base layer’s feature maps into two segments, facilitating feature reintegration across layers, which is instrumental in augmenting the network’s depth and receptive field, thus enhancing feature extraction efficiency. In our study, the EMA modules were integrated into different C3 modules of YOLOv5, such as backbone network, neck network, and SPPF layer. Then, the detection performance was evaluated by experiment results.
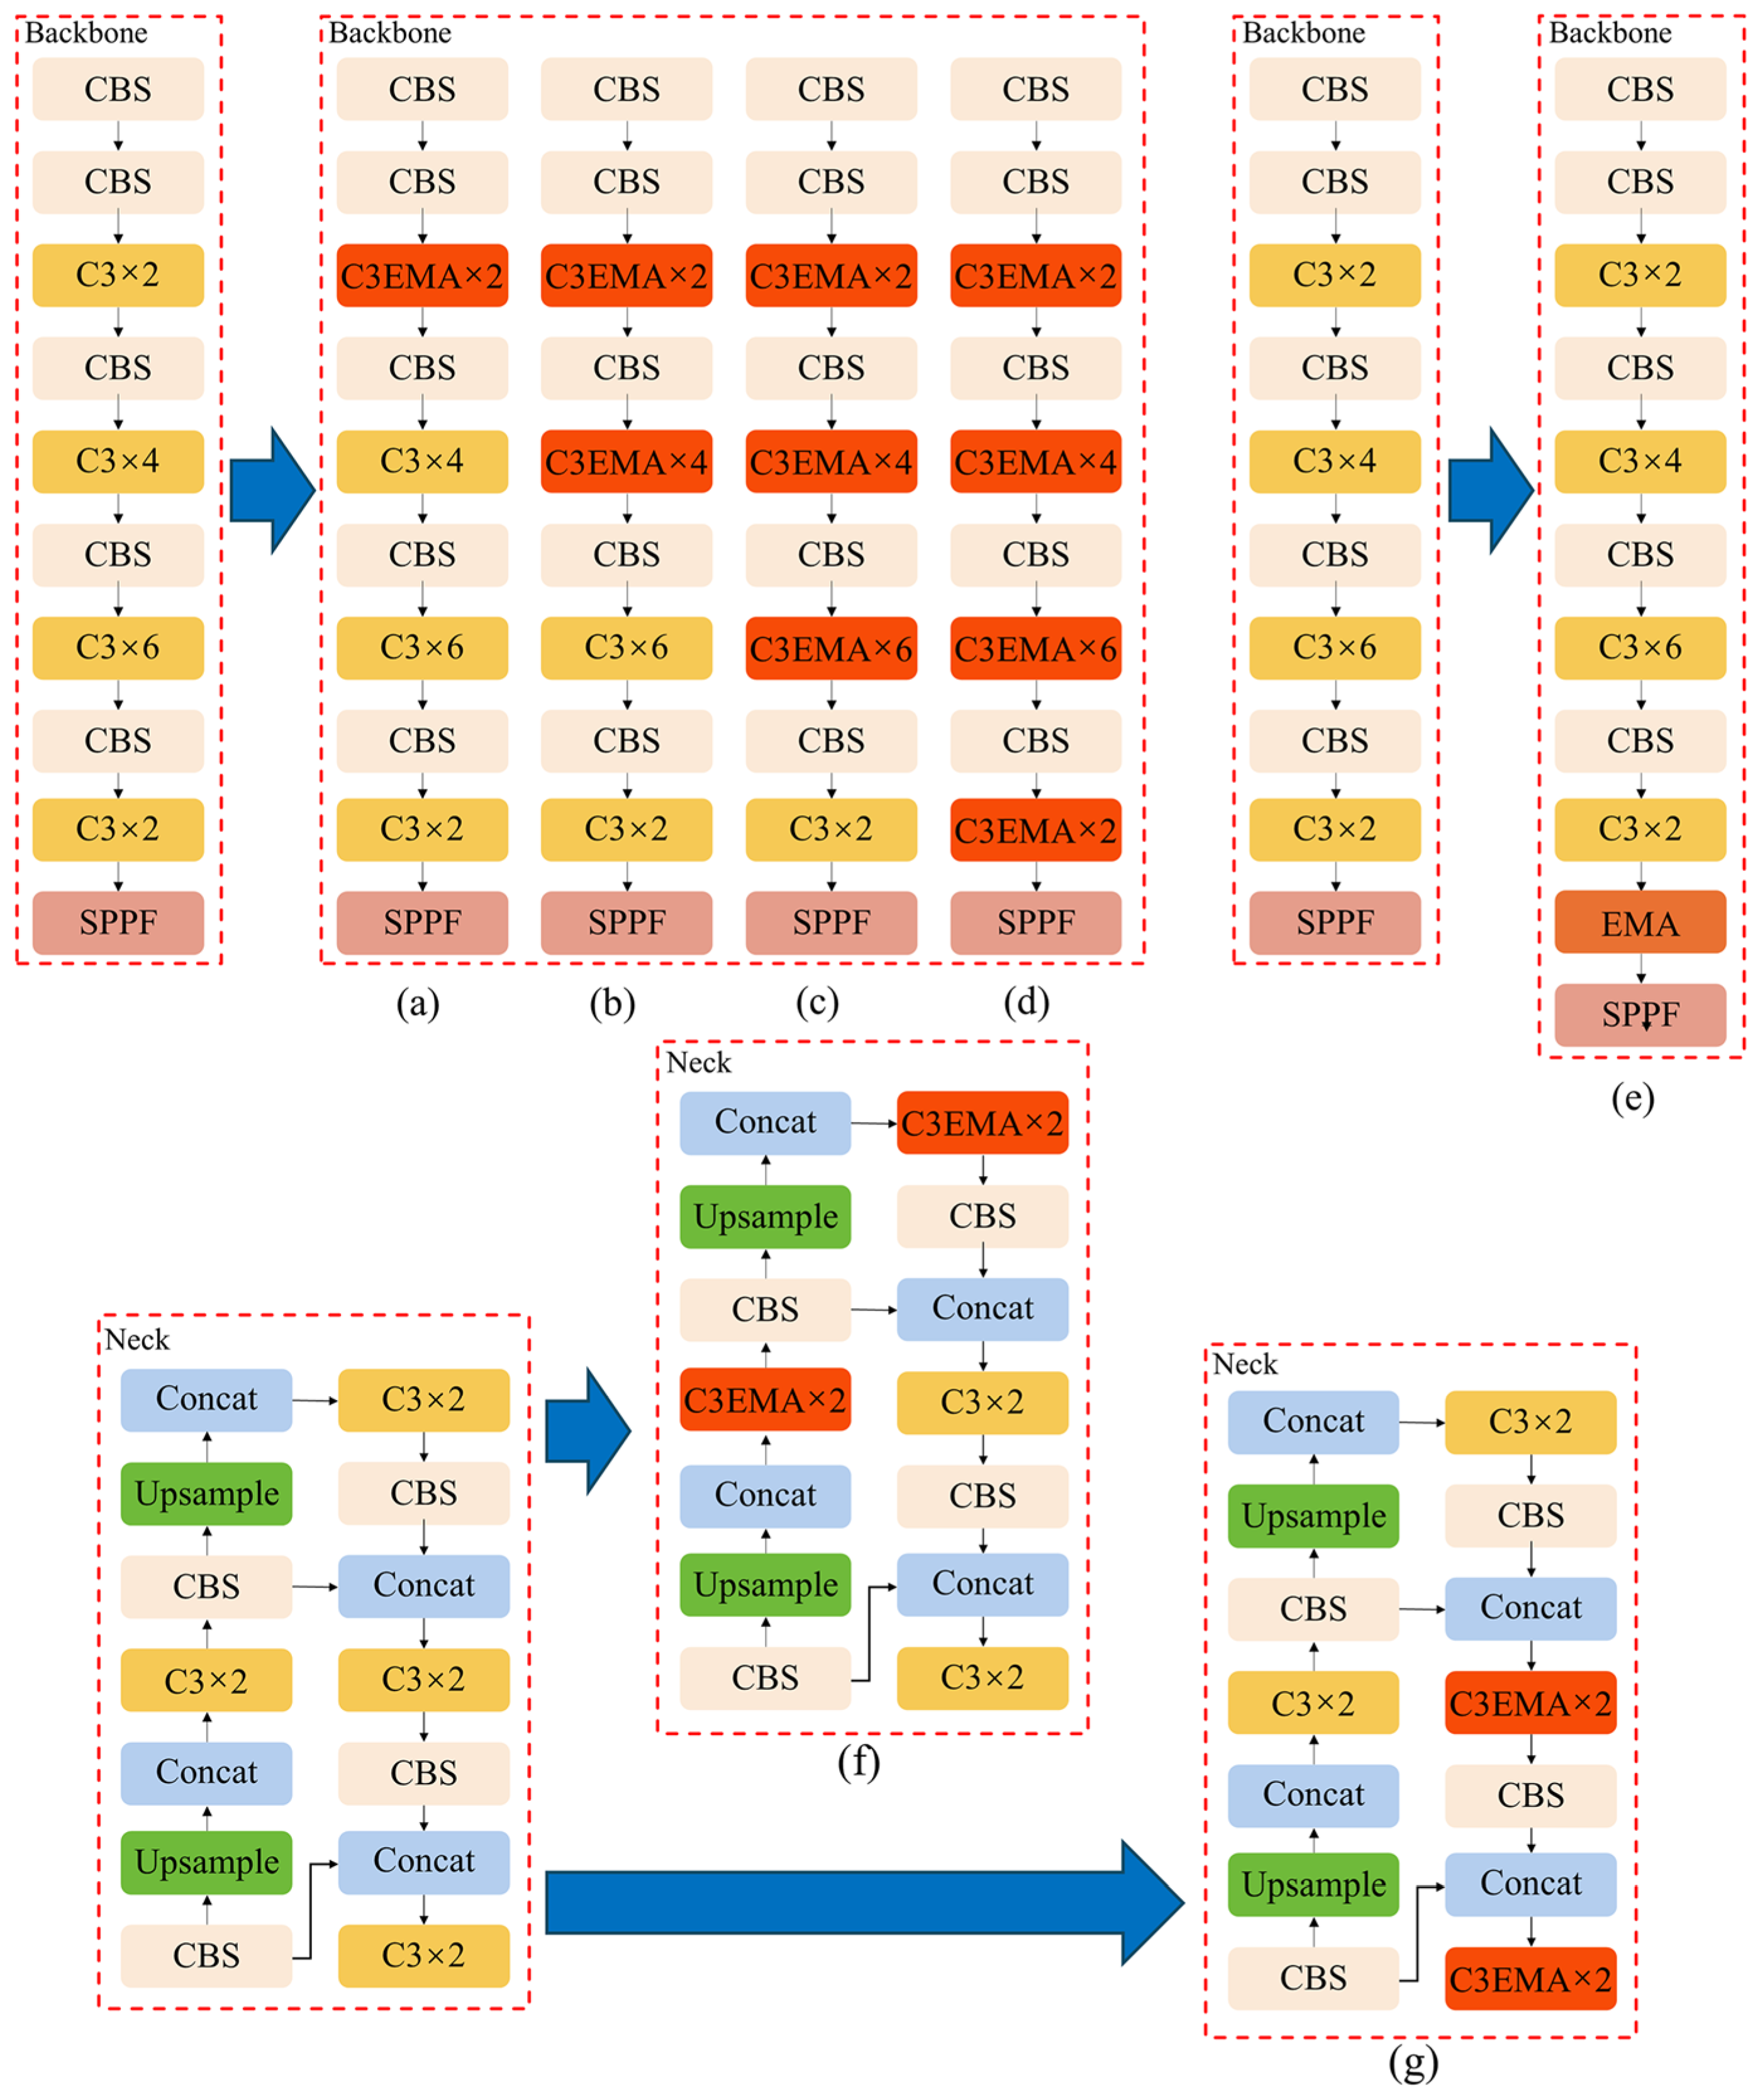
The results are shown in Table 3, the original YOLOv5 model yielded an mAP@0.5 accuracy of 92.7%. Substituting the backbone network’s C3 module with the C3-EMA module resulted in a notable augmentation of model accuracy, as shown in Figure 10a,b compared with the YOLOv5, the integration of the EMA module in the first C3 of the backbone network led to a mAP@0.5 increase of 1.4% with mAP@0.5 value of 94.1%, while integration of the EMA module in the first two C3 of the backbone network led to a mAP@0.5 increase of 1.5%. However, in Figure 10c,d, the further the EMA module was integrated in C3 module of the backbone network, the less the mAP@0.5 values increased. The application of the C3-EMA module within the neck network, specifically replaced the C3 module in the top-down and bottom-up components, as shown in Figure 10f,g, yield only 0.1% and 0.2% increase in mAP@0.5 value, compared with YOLOv5. Furthermore, adding the EMA module between the CBS module and the SPPF module (Figure 10e) in the backbone, achieved in a model accuracy of 93.1%, a modest uplift of 0.4% relative to the YOLOv5 model.
Table 3.
Ablation experiment of the C3-EMA module.
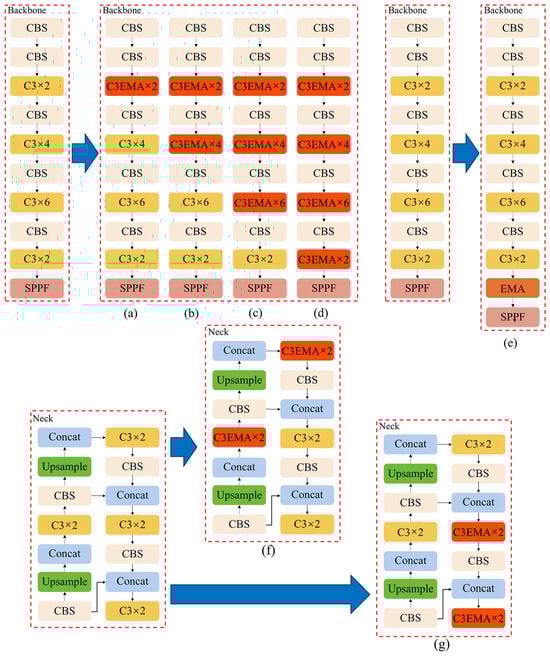
Figure 10.
C3-EMA configurated in different modules of YOLOv5. EMA modules integrated in the first (a), two (b), three (c), and all (d) C3 modules of the backbone network. EMA module integrated in C3 between the SPPF module and backbone network (e), and the top–down (f) and bottom–up (g) of the neck network, respectively.
Upon analysis, EMA module integrated in C3 of backbone network performed better than that of Neck networks and SPPF module. In multilayer network models, as information traversed deeper layers, target features become fuzzy at deeper levels. Therefore, the introduction of the C3-EMA module at the outset of the backbone network is suggested to preserve the clarity and integrity of target features, facilitating the network in capturing key features more effectively and enhancing detection accuracy. Conversely, in deeper layers, such as the top-down components and bottom-up components in the neck network and similar positions within the backbone network, the network’s depth and complexity may introduce interference and blurring of target features, leading to the degradation of semantic information. In these instances, attention modules may struggle to focus effectively on target features due to the complexity of feature maps, potentially obscuring critical details. Hence, when designing network architectures, the consideration of target feature extraction at various layers is crucial to fully exploit attention mechanisms for enhancing feature extraction and detection performance.
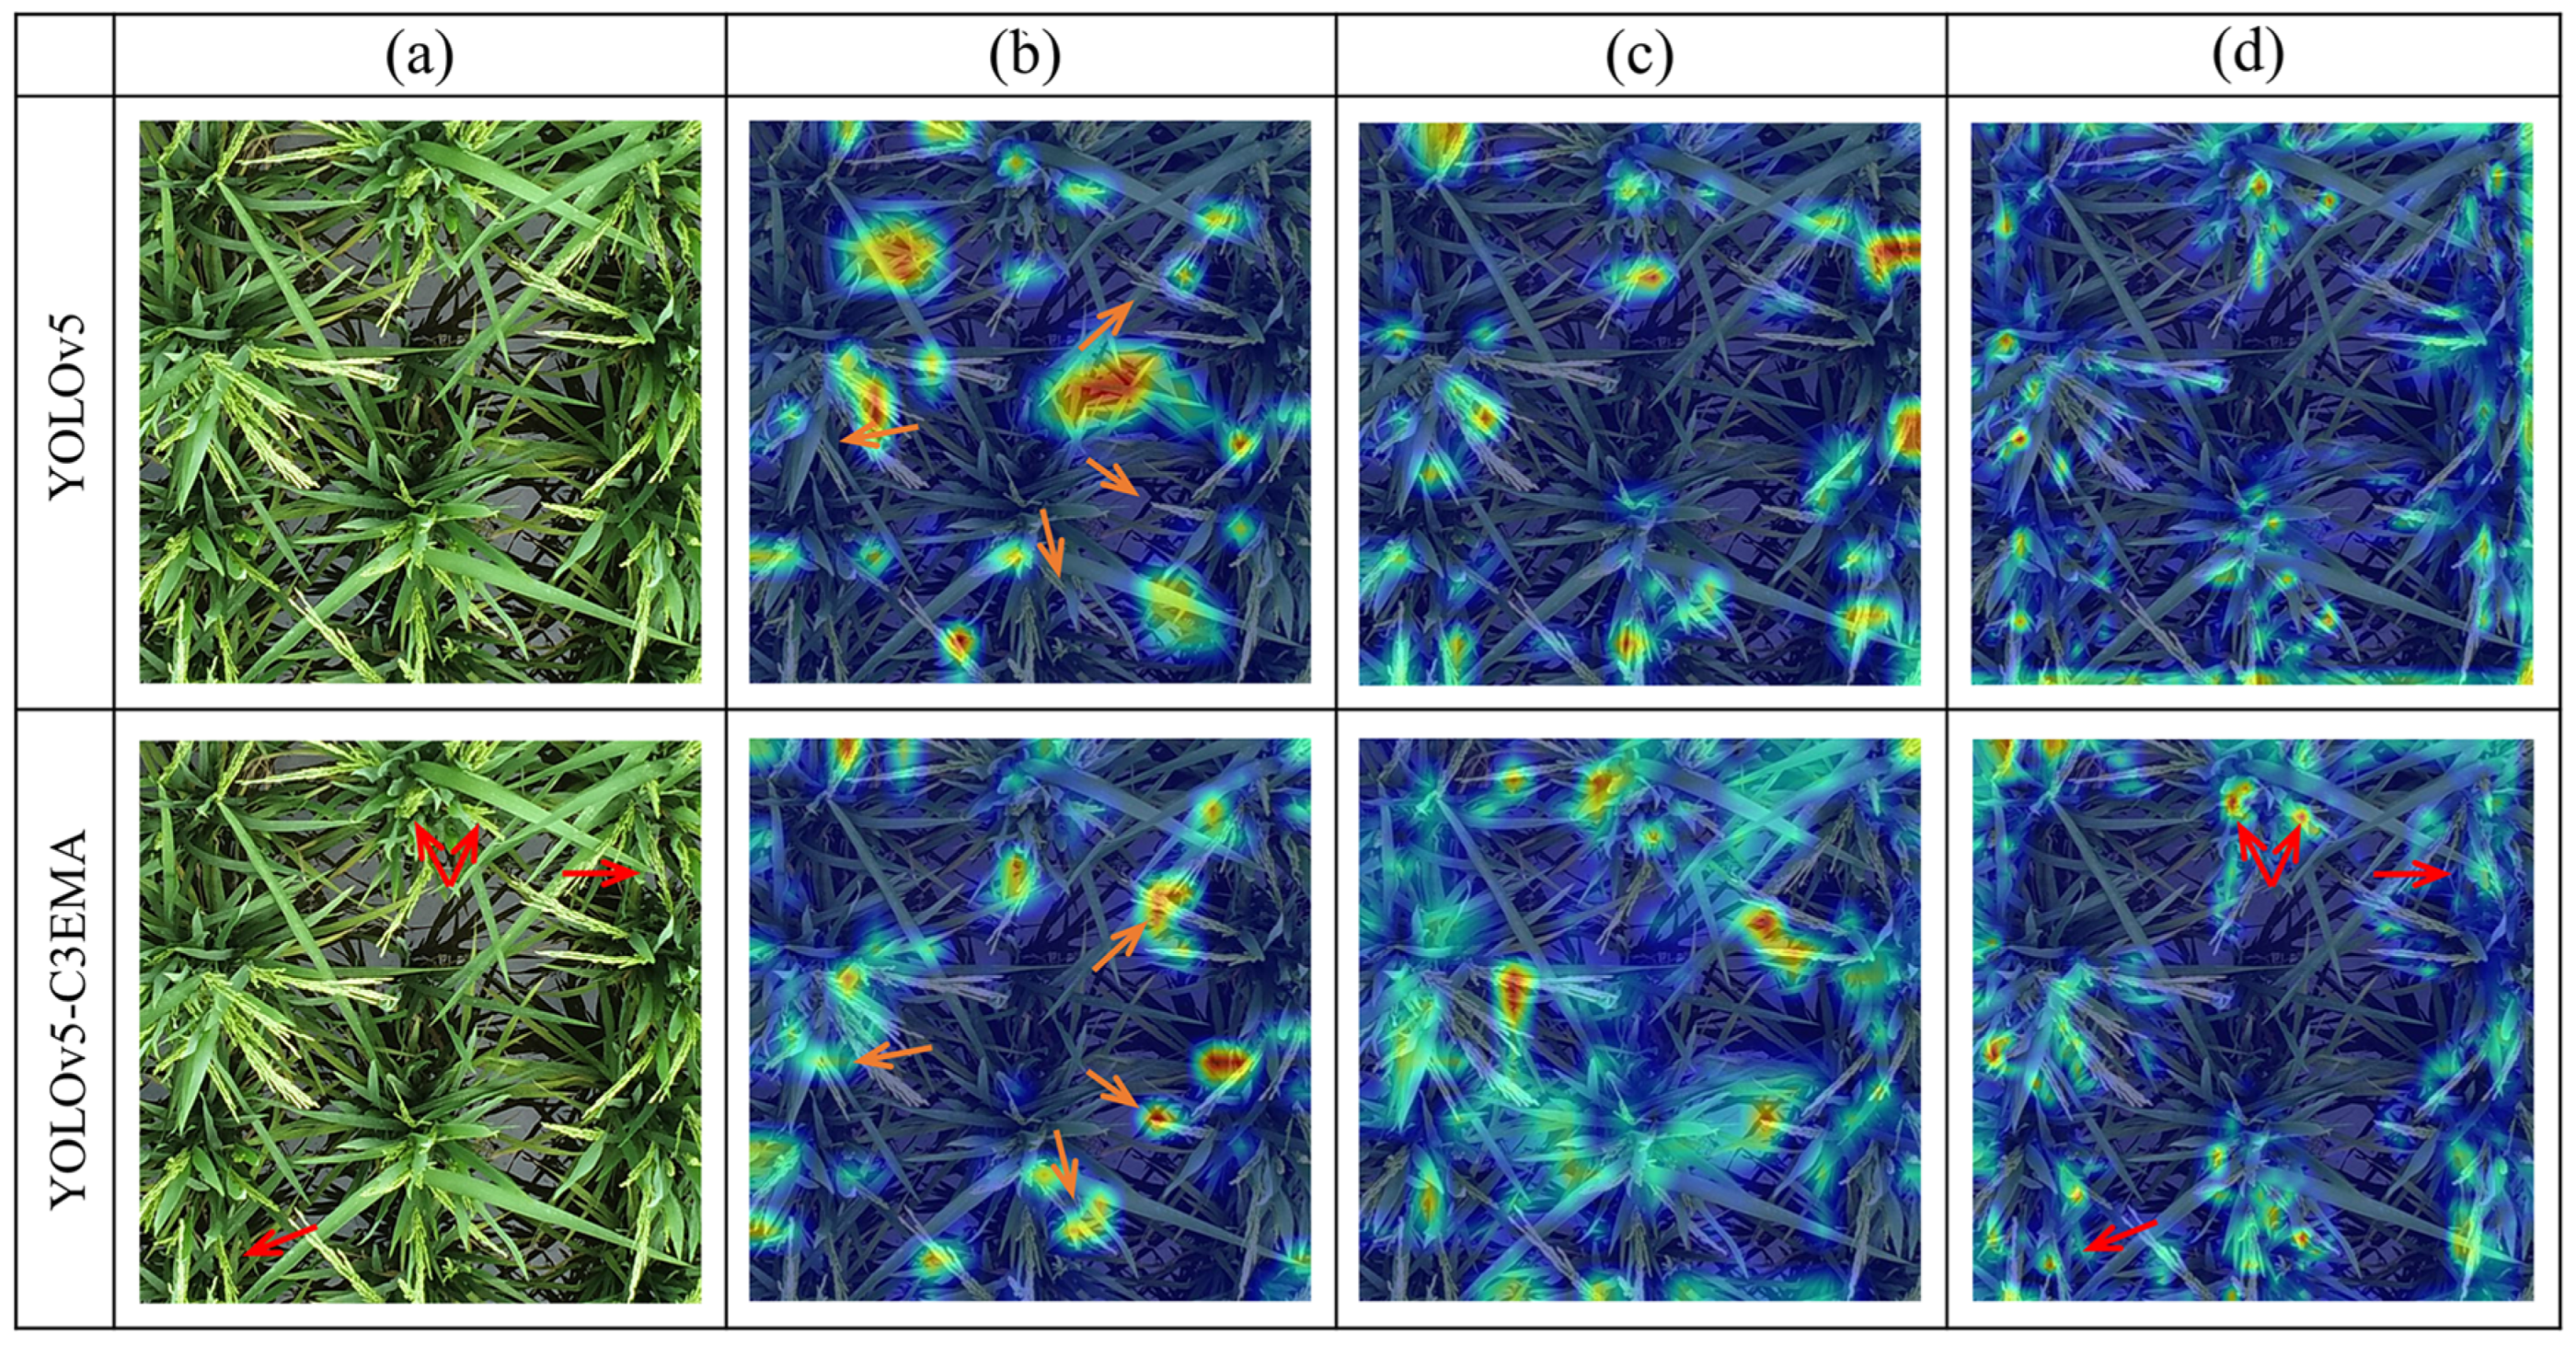
In addition, to visualize the feature extraction capability of backbone network of YOLOv5 and RICE-YOLO, grad-class activation mapping (Grad-CAM) was adopted. In Figure 11, the Grad-CAM used the gradient information of the feature map from different layers of YOLOv5 and RICE-YOLO, presented separately, to understand the importance of each feature point to the target decision. Each pixel of Grad-CAM contributes uniquely to the final classification result, with varying colors indicating the level of impact on the detection outcome: darker colors denote significant influence, while lighter colors suggest lesser impact. In Figure 11b, four orange arrows point to rice spikes that were correctly identified by the YOLOv5 C3-EMA model but missed by the YOLOv5 model. This indicates that the introduction of the C3-EMA module enhances feature extraction, as the EMA module’s two subnetworks improve the model’s spatial and channel feature extraction capabilities, thereby enhancing rice spike detection performance. At the deeper layer of network, as shown in Figure 11d, four red arrows pointing out four bright areas showed that the feature network of RICE-YOLO model can clearly distinguish four small-scale rice spikes, while the Figure 11b,c fails to make this distinction The results indicated that the improved backbone network bolstered the model’s proficiency in extracting both global and local features.

Figure 11.
Comparison of heatmaps generated using YOLOv5 and RICE-YOLO for rice spike detection: (a) RGB image, (b–d) heatmap of different layers of the network.
3.2. Ablation Study
To comprehensively evaluate the effectiveness of the EMA attention mechanism, small object detection layer, and SIoU loss function proposed in this study, YOLOv5 was chosen as the baseline model for conducting comprehensive ablation experiments. The experimental results are summarized in Table 4.
Table 4.
Experimental results of ablation study.
The results presented in Table 4 demonstrated the significant impact of the proposed enhancement modules and methods on enhancing the accuracy of rice spike detection on drone image in field environment. In Model B, the integration of the C3-EMA module resulted in a 1.4% improvement in mAP@0.5 value, demonstrating the efficacy of the EMA attention mechanism in enhancing the model’s ability to integrate channel information. In Model C, addition of microscale detection layer (MDL) and elimination of detection layer for large targets in the PAN network, revealed a 1.8% enhancement in mAP@0.5 value, indicating the effectiveness of improvement in addressing the imbalance of target sizes in drone rice spike images. Model D exhibited a 0.5% performance increase upon incorporating the SIoU loss function, underscoring its advantage in mitigating errors associated with angular deformations at image edges and enhancing detection accuracy. The combined utilization of the three modules in model E, F, and G further improved model accuracy. Model G, the proposed RICE-YOLO with YOLOv5 incorporating C3-EMA, MDL, and SIoU loss function, achieved the best performance with mAP@0.5 value of 94.8% which showed a 2.1% performance enhancement while reducing parameters comparing with YOLOv5.
3.3. Detection Performance of RICE-YOLO at Different Growth Stages
To rigorously assess the rice spike detection performance of the proposed model across two critical growth stages, rice spike detection experiments were performed at heading stage and filling stage. Results are shown in Table 5.
Table 5.
Rice spike detection results of YOLOv5 and RICE-YOLO at different growth periods.
At heading stage, the RICE-YOLO model demonstrated remarkable precision, achieving a mAP@0.5 of 96.1% and a recall rate of 93.1%, outperforming the YOLOv5 model which posted metrics of 94.9% and 86.8%, respectively. In the subsequent filling stage, the performance of RICE-YOLO remained robust, with a mAP@0.5 of 86.2% and a recall rate of 82.6%, thereby exceeding the outcomes of YOLOv5, which recorded a mAP@0.5 of 83.2% and a recall rate of 77.2%.
Upon conducting a comparative analysis of detection performance at the two stages, it was observed that RICE-YOLO experienced a notable reduction in detection accuracy, from 96.1% during the heading stage to 86.2% in the filling stage. This phenomenon suggests a reduced complexity in detection tasks during the heading stage relative to the filling stage, likely due to the distinct phenotypic characteristics of the rice spikes at these growth stages, which in turn impacts the algorithm’s efficiency in the latter stage.
Overall, Table 5 indicated that the RICE-YOLO model, in comparison to the original YOLOv5 model, not only achieved performance improvements of 2.1% in AP@0.5 and 3.2% in recall but also showed better performance at two growth stage with an increase of 1.2% and 6.3% during the heading stage, and 3% and 5.4% during the filling stage, respectively. These results validate the capability of the RICE-YOLO model to effectively execute detection tasks for rice spikes captured via drones in field environment.
3.4. Performance Comparison with Other Deep Learning Models
To evaluate the RICE-YOLO more comprehensively, the RICE-YOLO was compared with other four classic deep learning models, including two single-stage models (YOLOv7 and YOLOv8) and two two-stage models (Faster R-CNN and Cascade R-CNN). YOLOv7 and YOLOv8 are newer versions in the YOLO series gaining significant attention. Fast R-CNN demonstrates stable performance as a traditional two-stage method, while Cascade R-CNN enhances detection with its cascading structure, serving as a widely adopted improved model. The rice spike dataset in Section 2.1 was used, and mAP@0.5, Recall, FPS, Params and FLOPs were adopted as evaluation metrics. The comparative results are presented in Table 6.
Table 6.
Comparative analysis of other deep learning models.
According to Table 6, the proposed RICE-YOLO model achieves a mAP@0.5 of 94.8% and a Recall of 87.6%, meeting the real-time detection requirements for rice spike images in field conditions. Compared to the YOLOv8 model introduced in 2023 within the YOLO series, the RICE-YOLO model outperforms in mAP@0.5 and Recall, increasing by 4.7% and 5.5%, respectively. RICE-YOLO model was also superior to the YOLOv7 in all aspects except for FPS, exhibiting improvements of 2% in mAP@0.5 and 2.8% in recall. Notably, it achieves a reduction of 20.46 in parameter count and 48.5 in FLOPs. Furthermore, the RICE-YOLO and YOLOv7 perform better than the two-stage models in both the mAP@0.5 and Recall.
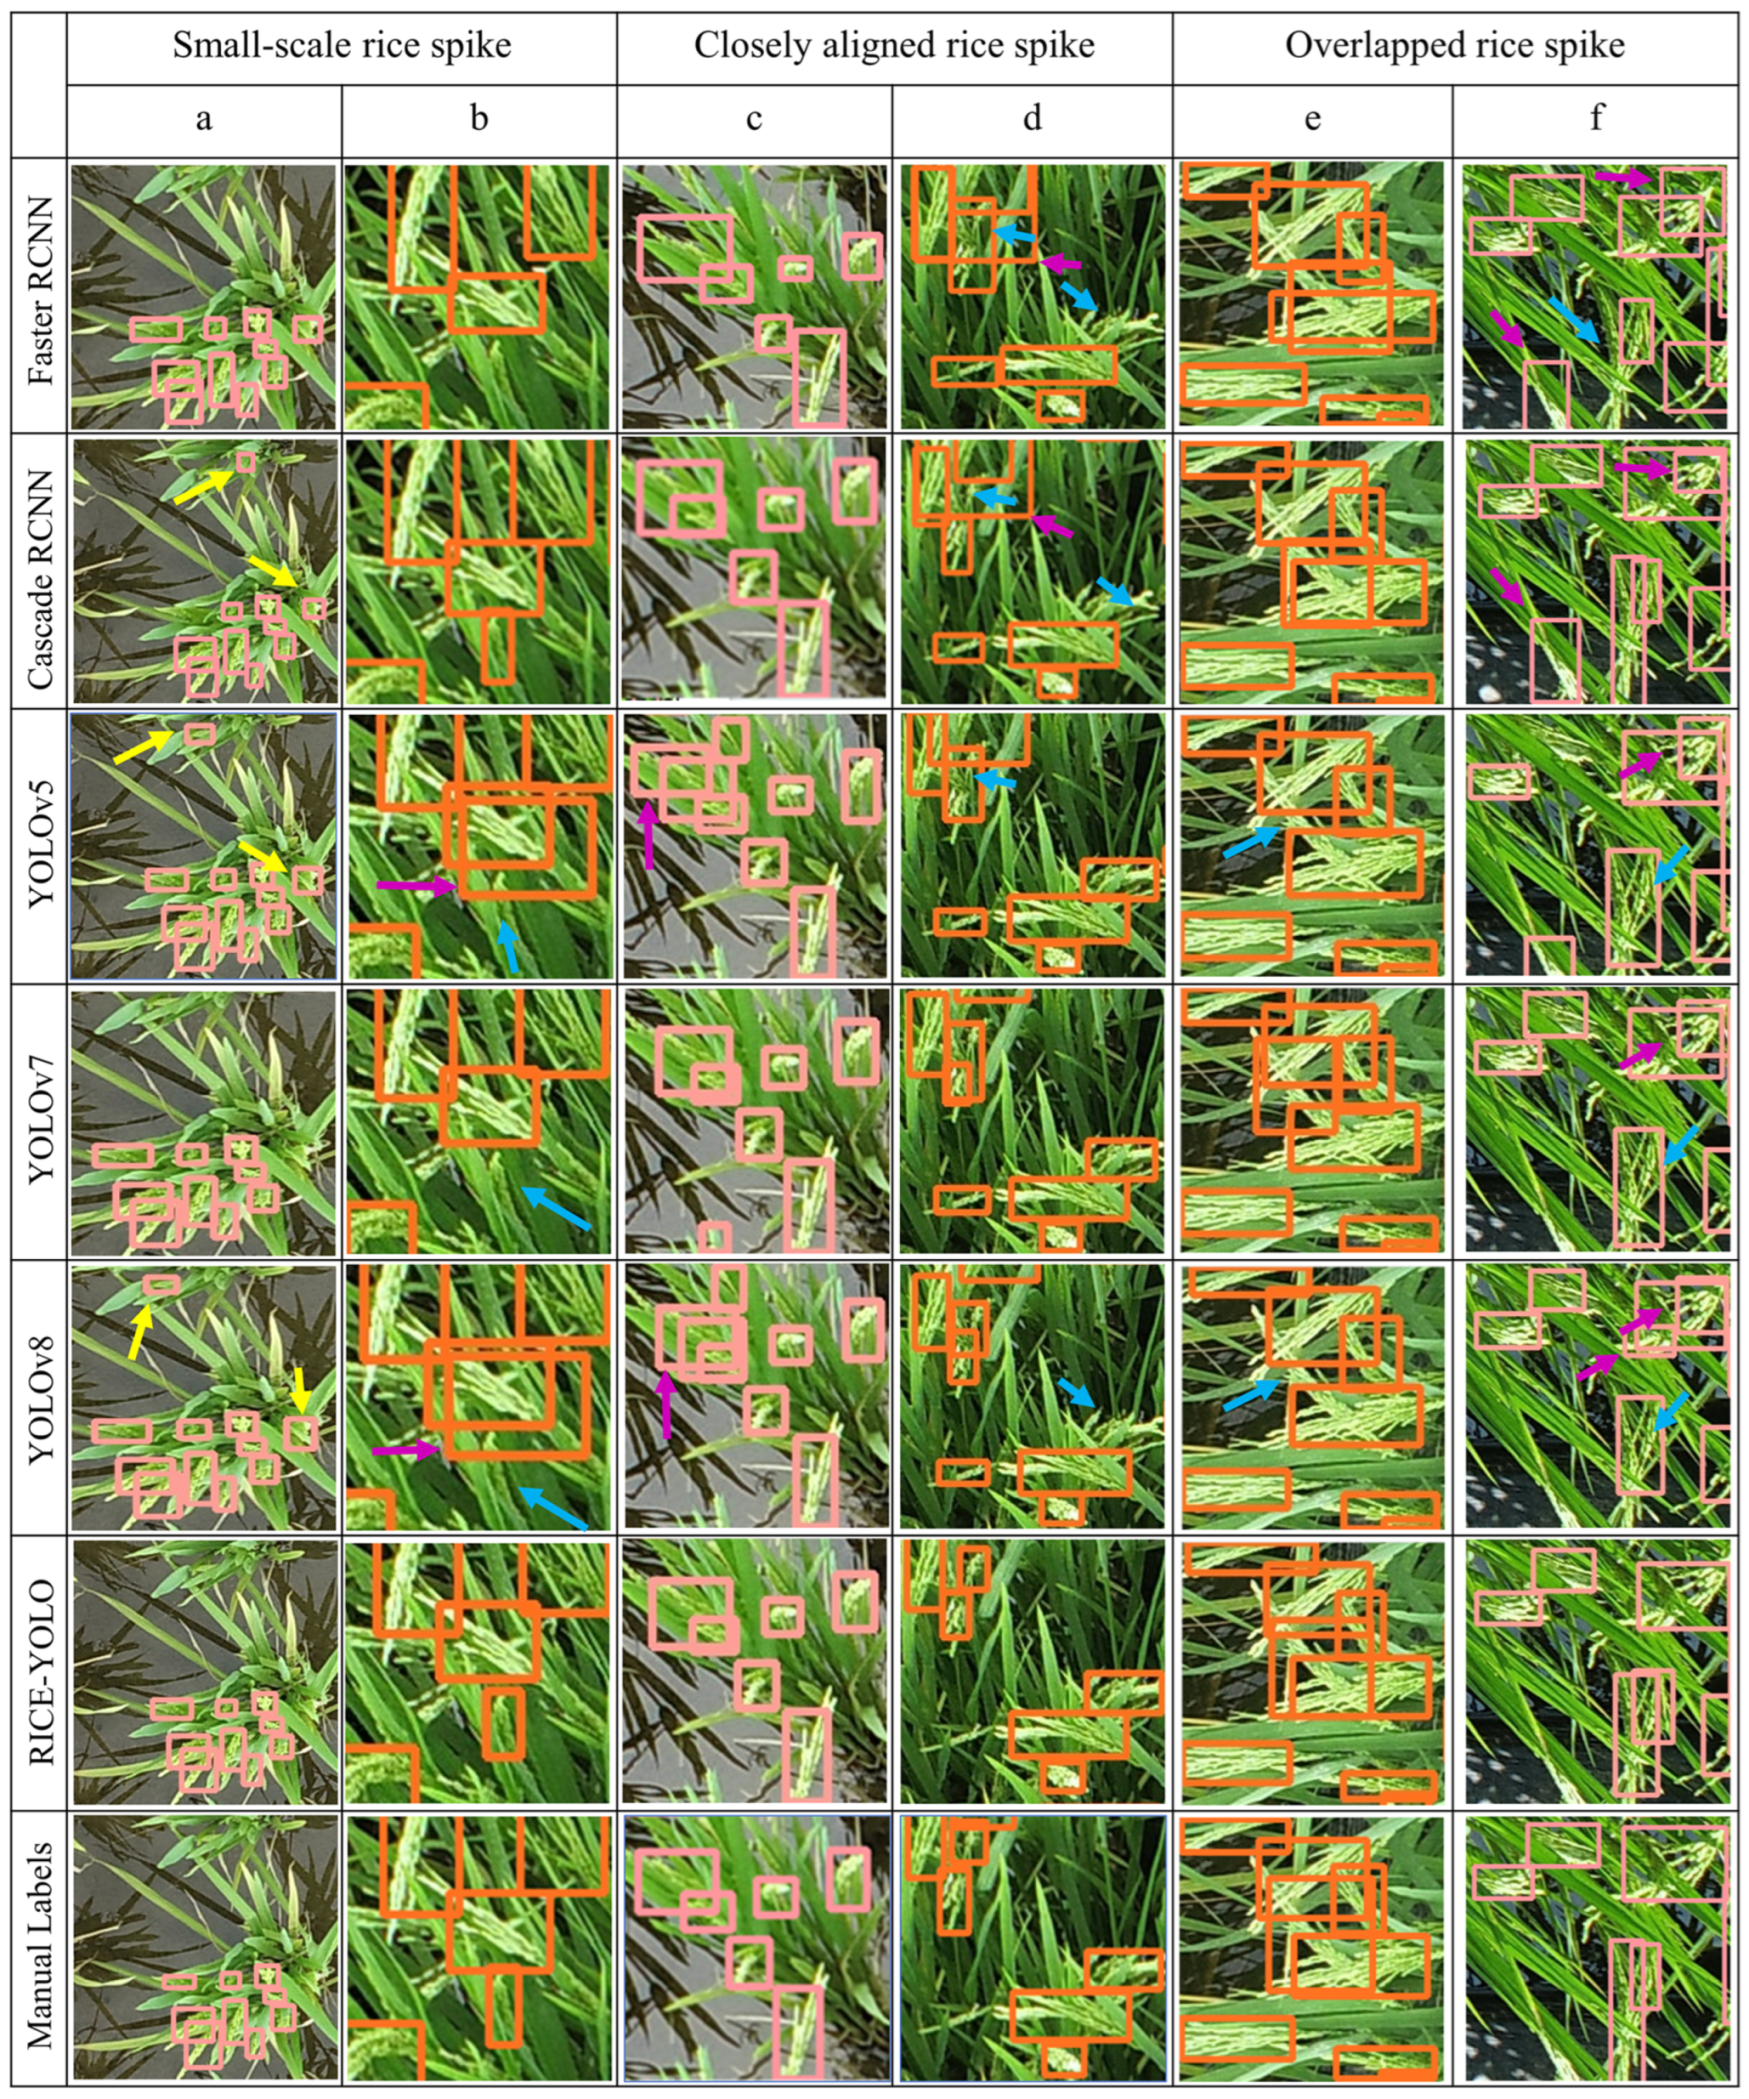
In addition, Figure 12 demonstrates the rice spike detection results obtained from six different models. RICE-YOLO shows superior detection performance when it comes to identifying small, aligned, and partially obscured rice spikes that are commonly found during the rice growth stages. By introducing a small target detection layer and removing the large target detection head, this model ensures accurate detection of small-scale rice spikes. In the scenario depicted in Figure 12a, most rice spikes are small in scale. RICE-YOLO successfully detects all spikes, while YOLOv8, YOLOv5, Faster RCNN, and Cascade RCNN falsely detected the leaves as rice spikes. In Figure 12b, YOLOv8, YOLOv7, YOLOv5, and Faster RCNN all missed detected a small rice spike. In field environments, rice spikes often grow densely, forming aligned spikes or spikes overlapped by spikes, stems, and leaves. These situations can make it challenging for deep learning models to accurately detect spikes, leading to missed or false detection. In Figure 12c, two spikes grow side by side, with the purple arrows highlighting the repeated detections of these spikes by YOLOv5 and YOLOv8. In Figure 12d, the blue arrows show instances where those models struggled to detect closely arranged rice spikes, and the purple arrows point to the prediction boxes where Faster RCNN and Cascade RCNN repeat detections due to closely arranged multiple rice spikes, whereas RICE-YOLO effectively detect the spikes in both situations. In Figure 12e,f, rice spikes are overlapped by leaves, the RICE-YOLO precisely detection the whole rice spikes, however, the YOLOv8, YOLOv7, YOLOv5, Faster RCNN, and Cascade RCNN recognized the whole spike as two separated spikes, causing repeated detection.
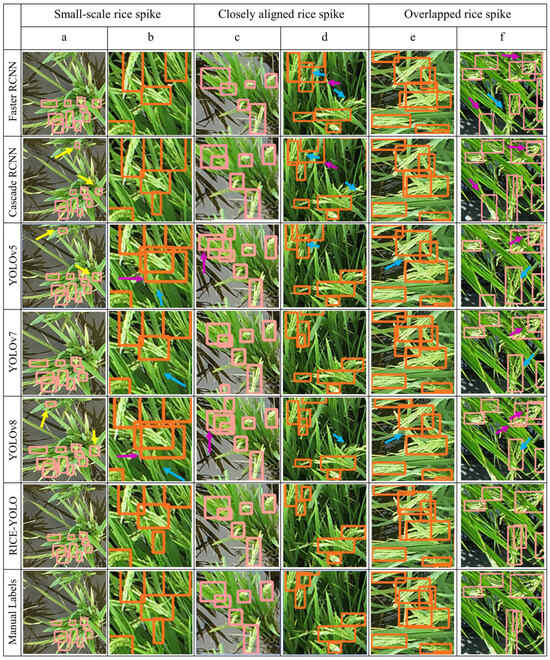
Figure 12.
Comparison results among deep learning models, with yellow, blue, and purple arrows pointing out the false detection, missed detection, and repeated detection, respectively. Scenarios of spikes of small-scale (a) and (b), closely aligned (c) and (d), overlapped (e) and (f).
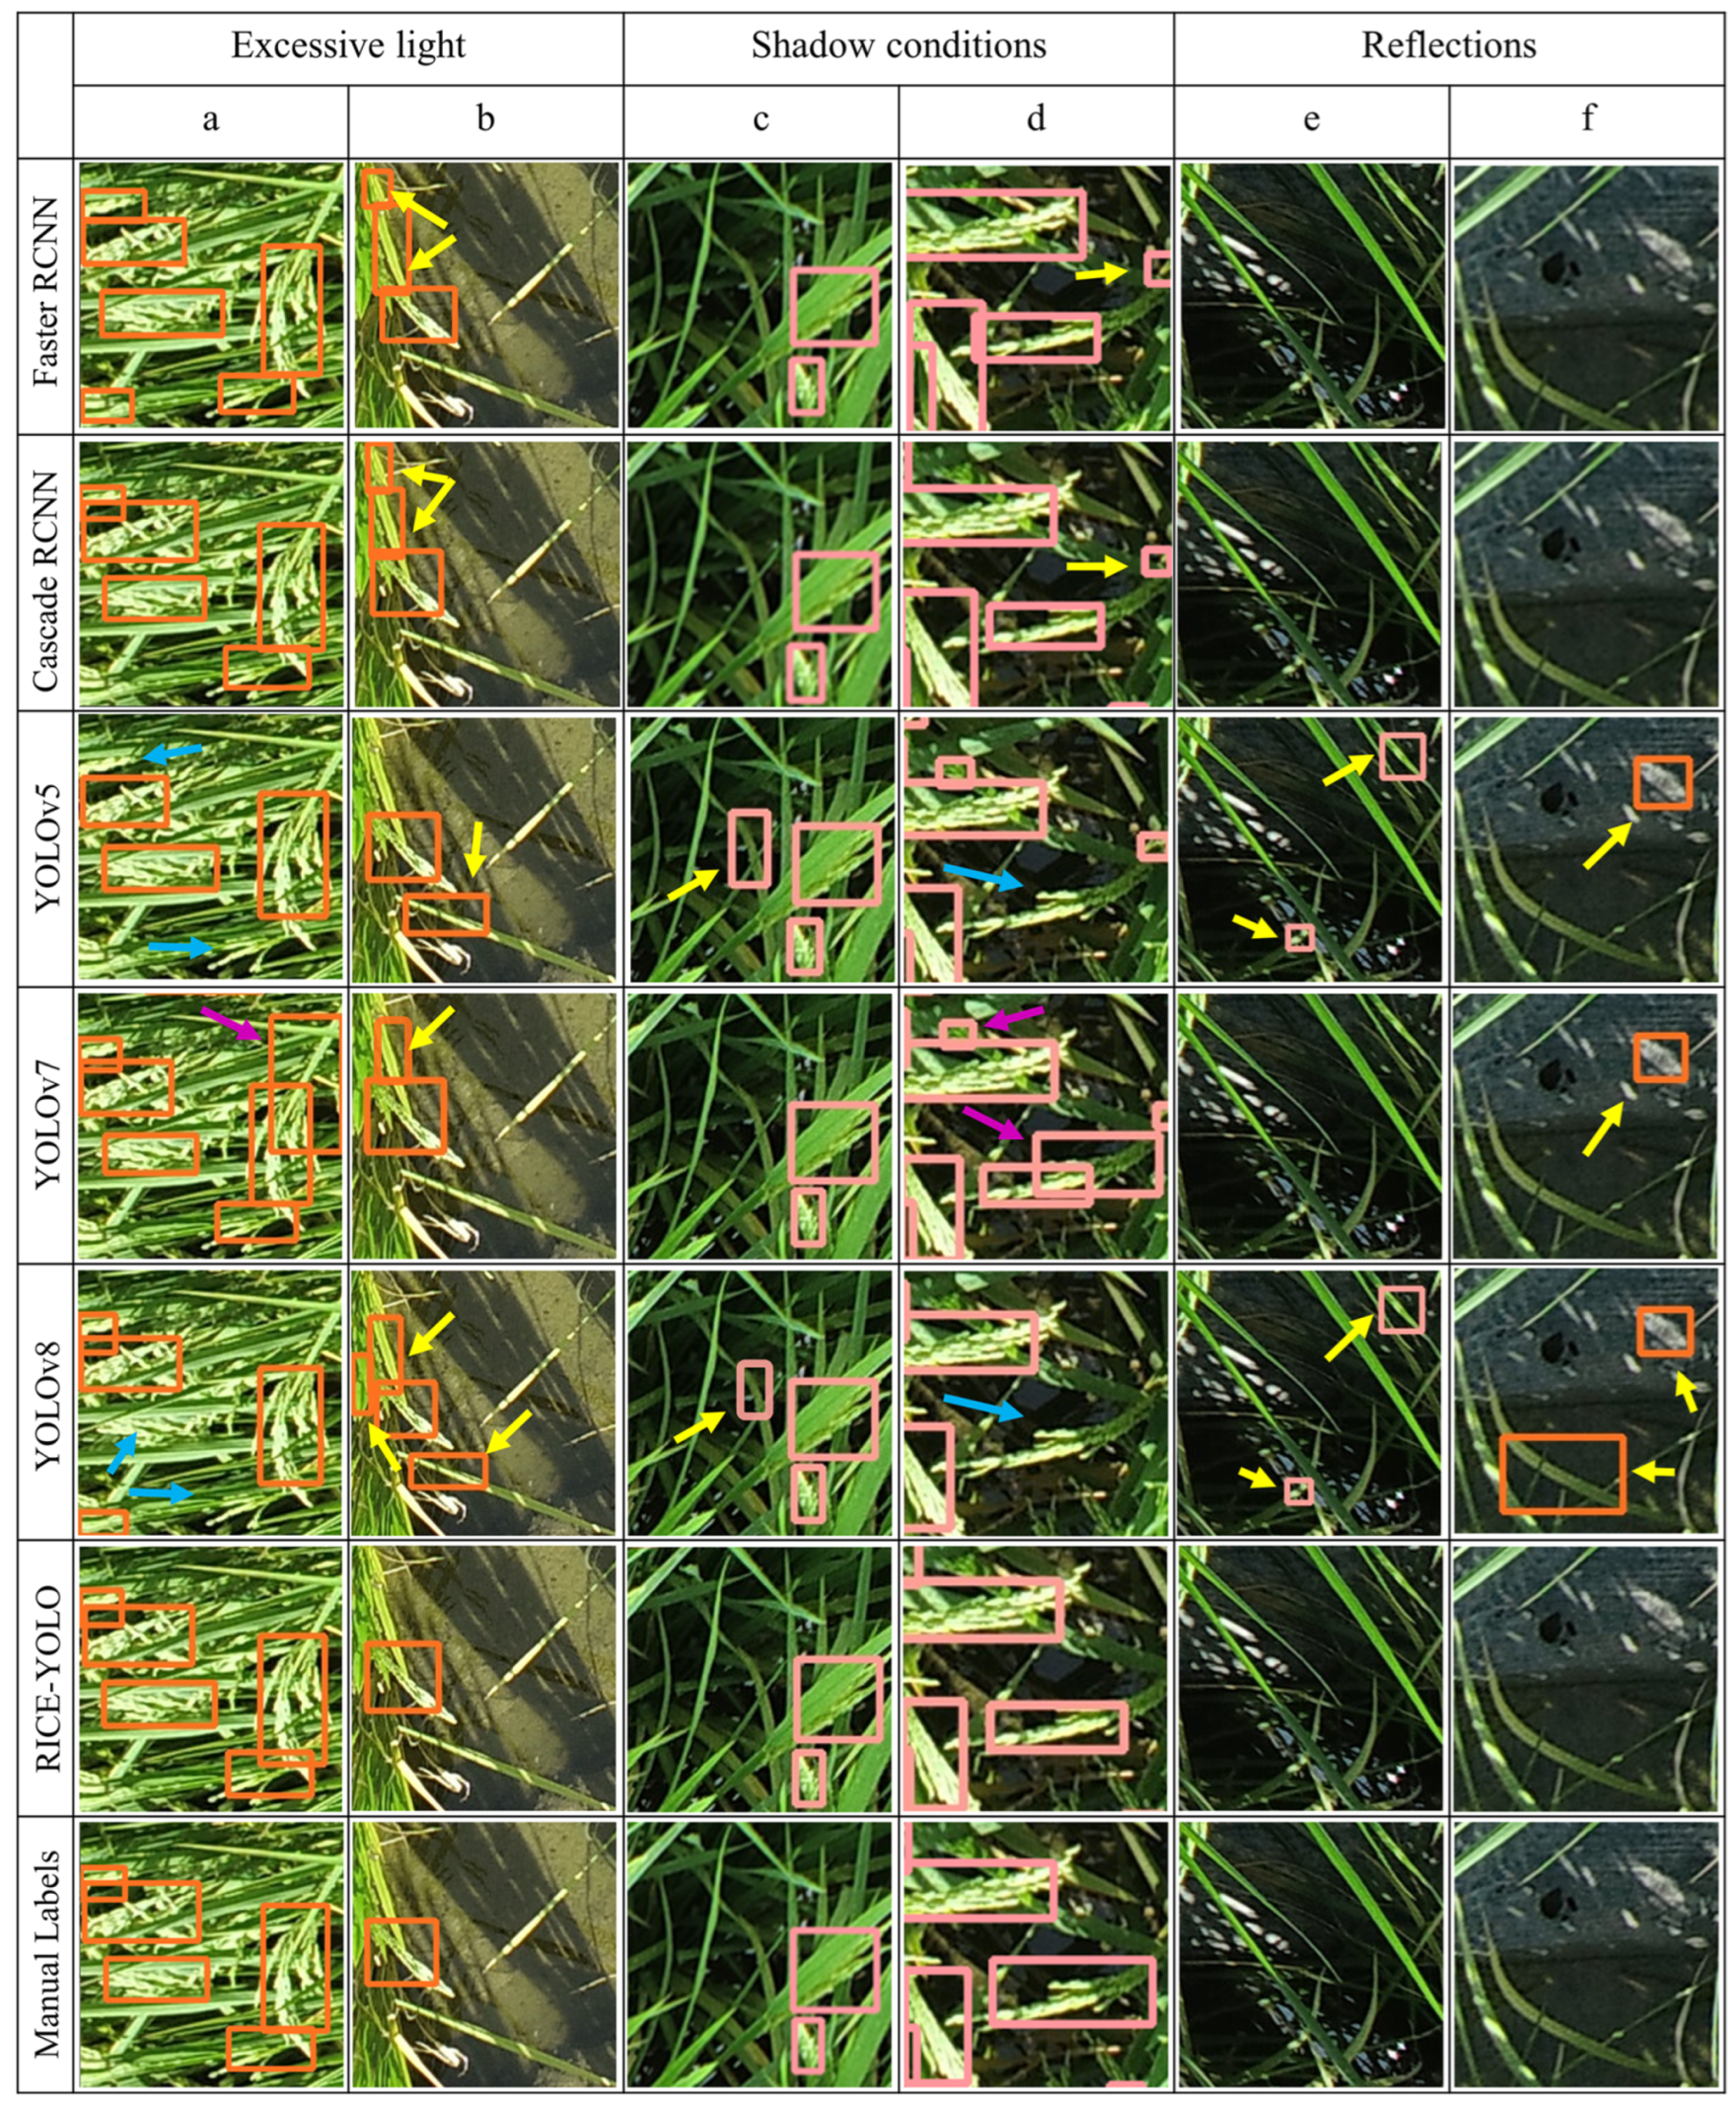
To further evaluate the rice spike detection performance of the RICE-YOLO, models above were tested under complex field environment, such as excessive light, strong shade, and water reflections. Figure 13 presents the detection results of six models under these complex field conditions. In Figure 13a, several rice spikes were missed detected by YOLOv5, YOLOv7, and YOLOv8, which can be attributed to spikes with overexposure from strong lighting, but RICE-YOLO can successfully detect these rice spikes. In Figure 13b, some leaves in strong light exposure were falsely detected as rice spikes by YOLOv5, YOLOv7, YOLOv8, and two two-stage models, whereas RICE-YOLO avoided this situation. In Figure 13c, a leaf in shade is falsely detected as rice spike by YOLOv5 and YOLOv8. In addition, a rice spike in shade, as shown in Figure 13d, is missed detected by YOLOv5 and YOLOv8, and caused repeated detection by YOLOv7, with the two two-stage models misclassifying the background as spikes. In case of water surface reflections and dark light, as shown in Figure 13e,f, YOLOv5, YOLOv7, and YOLOv8 falsely detected background as rice spikes. These results demonstrate that the proposed RICE-YOLO model effectively identifies rice spikes in various field environments.
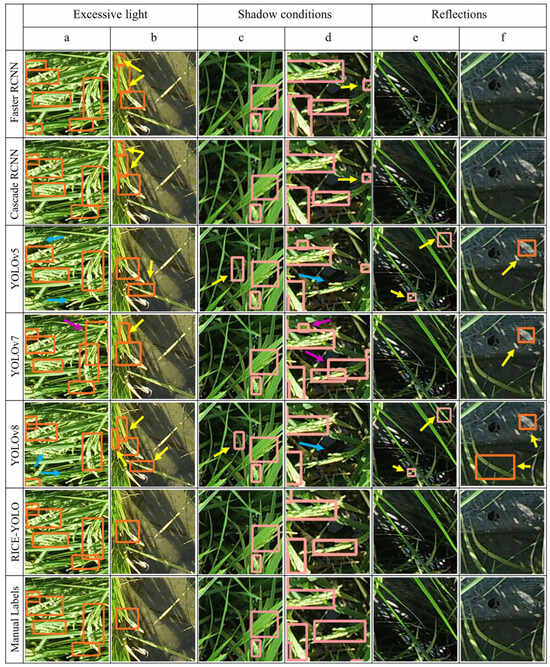
Figure 13.
Comparison results among deep learning models in a complex field environment, with yellow, blue, and purple arrows pointing out the false detection, missed detection and repeated detection, respectively. Scenarios of spikes in excessive light (a) and (b), shadow conditions (c) and (d), reflections (e) and (f).
In the aspect of computational complexity, all the single-stage models were faster than the two-stage models. The FPS of Faster RCNN and Cascade RCNN were 14 and 12, respectively. Meanwhile, the FPS of RICE-YOLO, YOLOv7, and YOLOv8 were 36, 45, and 82, respectively; the proposed RICE-YOLO had a lower FPS than YOLOv8 and YOLOv7.
The presented results showed that the RICE-YOLO model proposed in this paper can learn a more representative set of features which helped better locate the rice spikes at different growth stages, thus met the requirements of high recognition accuracy. However, while RICE-YOLO demonstrates superior recognition accuracy, it was at the expense of the time consumption, compared to other YOLO series models, indicating room for improvement.
4. Discussion
This study provides significant insights into the detection of rice spikes in drone-captured images in agricultural fields, with a focus on optimizing rice spike detection and local drone perspective detection.
To improve detection precision, RICE-YOLO was proposed for rice spike detection by designing three new scale detection branches, introducing EMA attention mechanism, and integrating the SIoU loss function. Compared with YOLOV5m, RICE-YOLO increased by 2.1% on mAP@0.5, and with improvements of 1.2% and 3.0% in AP@0.5 during the heading and the filling stages, respectively. Finally, RICE-YOLO achieved a mAP@0.5 of 94.8% on our in-field rice spike dataset, ranking highest among five representative object detection models in comparison. In comparison to the research conducted by Wang [28], which also centered on the detection of rice spikes, our proposed model demonstrates robust performance in more intricate drone perspectives and natural field lighting conditions, despite both studies utilize the YOLO series as a baseline. Secondly, Wang’s study employed cameras at close range to capture rice spike images in limited paddy field areas, whereas our model, trained to detect rice spikes from drone angles, enhances robustness to viewpoint variations and practicality in field operations. Furthermore, our research includes separate optimizations for small targets and occluded rice spikes, enhancing the model’s applicability in complex field aerial scenarios with dense rice spikes and occluded targets. It is noteworthy that Wang conducted preliminary research on eliminating duplicate detections, which warrants further investigation in future studies. In summary, our model effectively meets the requirements in practical field applications, exhibiting outstanding performance in both detection speed and accuracy.
Our model demonstrates commendable detection results, primarily attributed to our targeted optimization strategies. Firstly, a novel detection branch with three scales guided the network to focus on rice spike targets ranging from medium to small scales, enabling the network to effectively capture features of targets with corresponding sizes. While the common practice for improvement in drone perspectives is to add more detection branches, occasionally reducing redundant scale detection branches can enhance efficiency. This not only simplifies the network structure but also has the potential to boost network performance by eliminating unnecessary gradients and promoting targeted feature learning. This concept holds promise for extension to other detection tasks involving medium and small targets. Secondly, the EMA module introduced in our model directs more attention to the spatial width and height features of rice spikes, enhancing the model’s detection capability for spikes with prominent edge features, which are crucial for identifying occluded rice spikes and improves our model’s detection performance in challenging scenarios.
In our study, RICE-YOLO effectively mitigated incorrect detections of occluded and small rice spikes. Figure 11 illustrates the capacity of RICE-YOLO to rectify false detections, duplication detections and missed detections of small, densely arranged, and occluded rice spikes. In particular, as shown in Figure 13, RICE-YOLO demonstrates robust performance in identifying rice spikes under field conditions with lighting shadows, while other well-performing models failed to do so. Thus, RICE-YOLO could effectively detect small, occluded, and rice spikes under varying lighting conditions. However, similarly to other advanced target detection models, RICE–YOLO has limitations in detecting highly occluded or excessive light. The detection of these targets in two-dimensional images remains a challenging task.
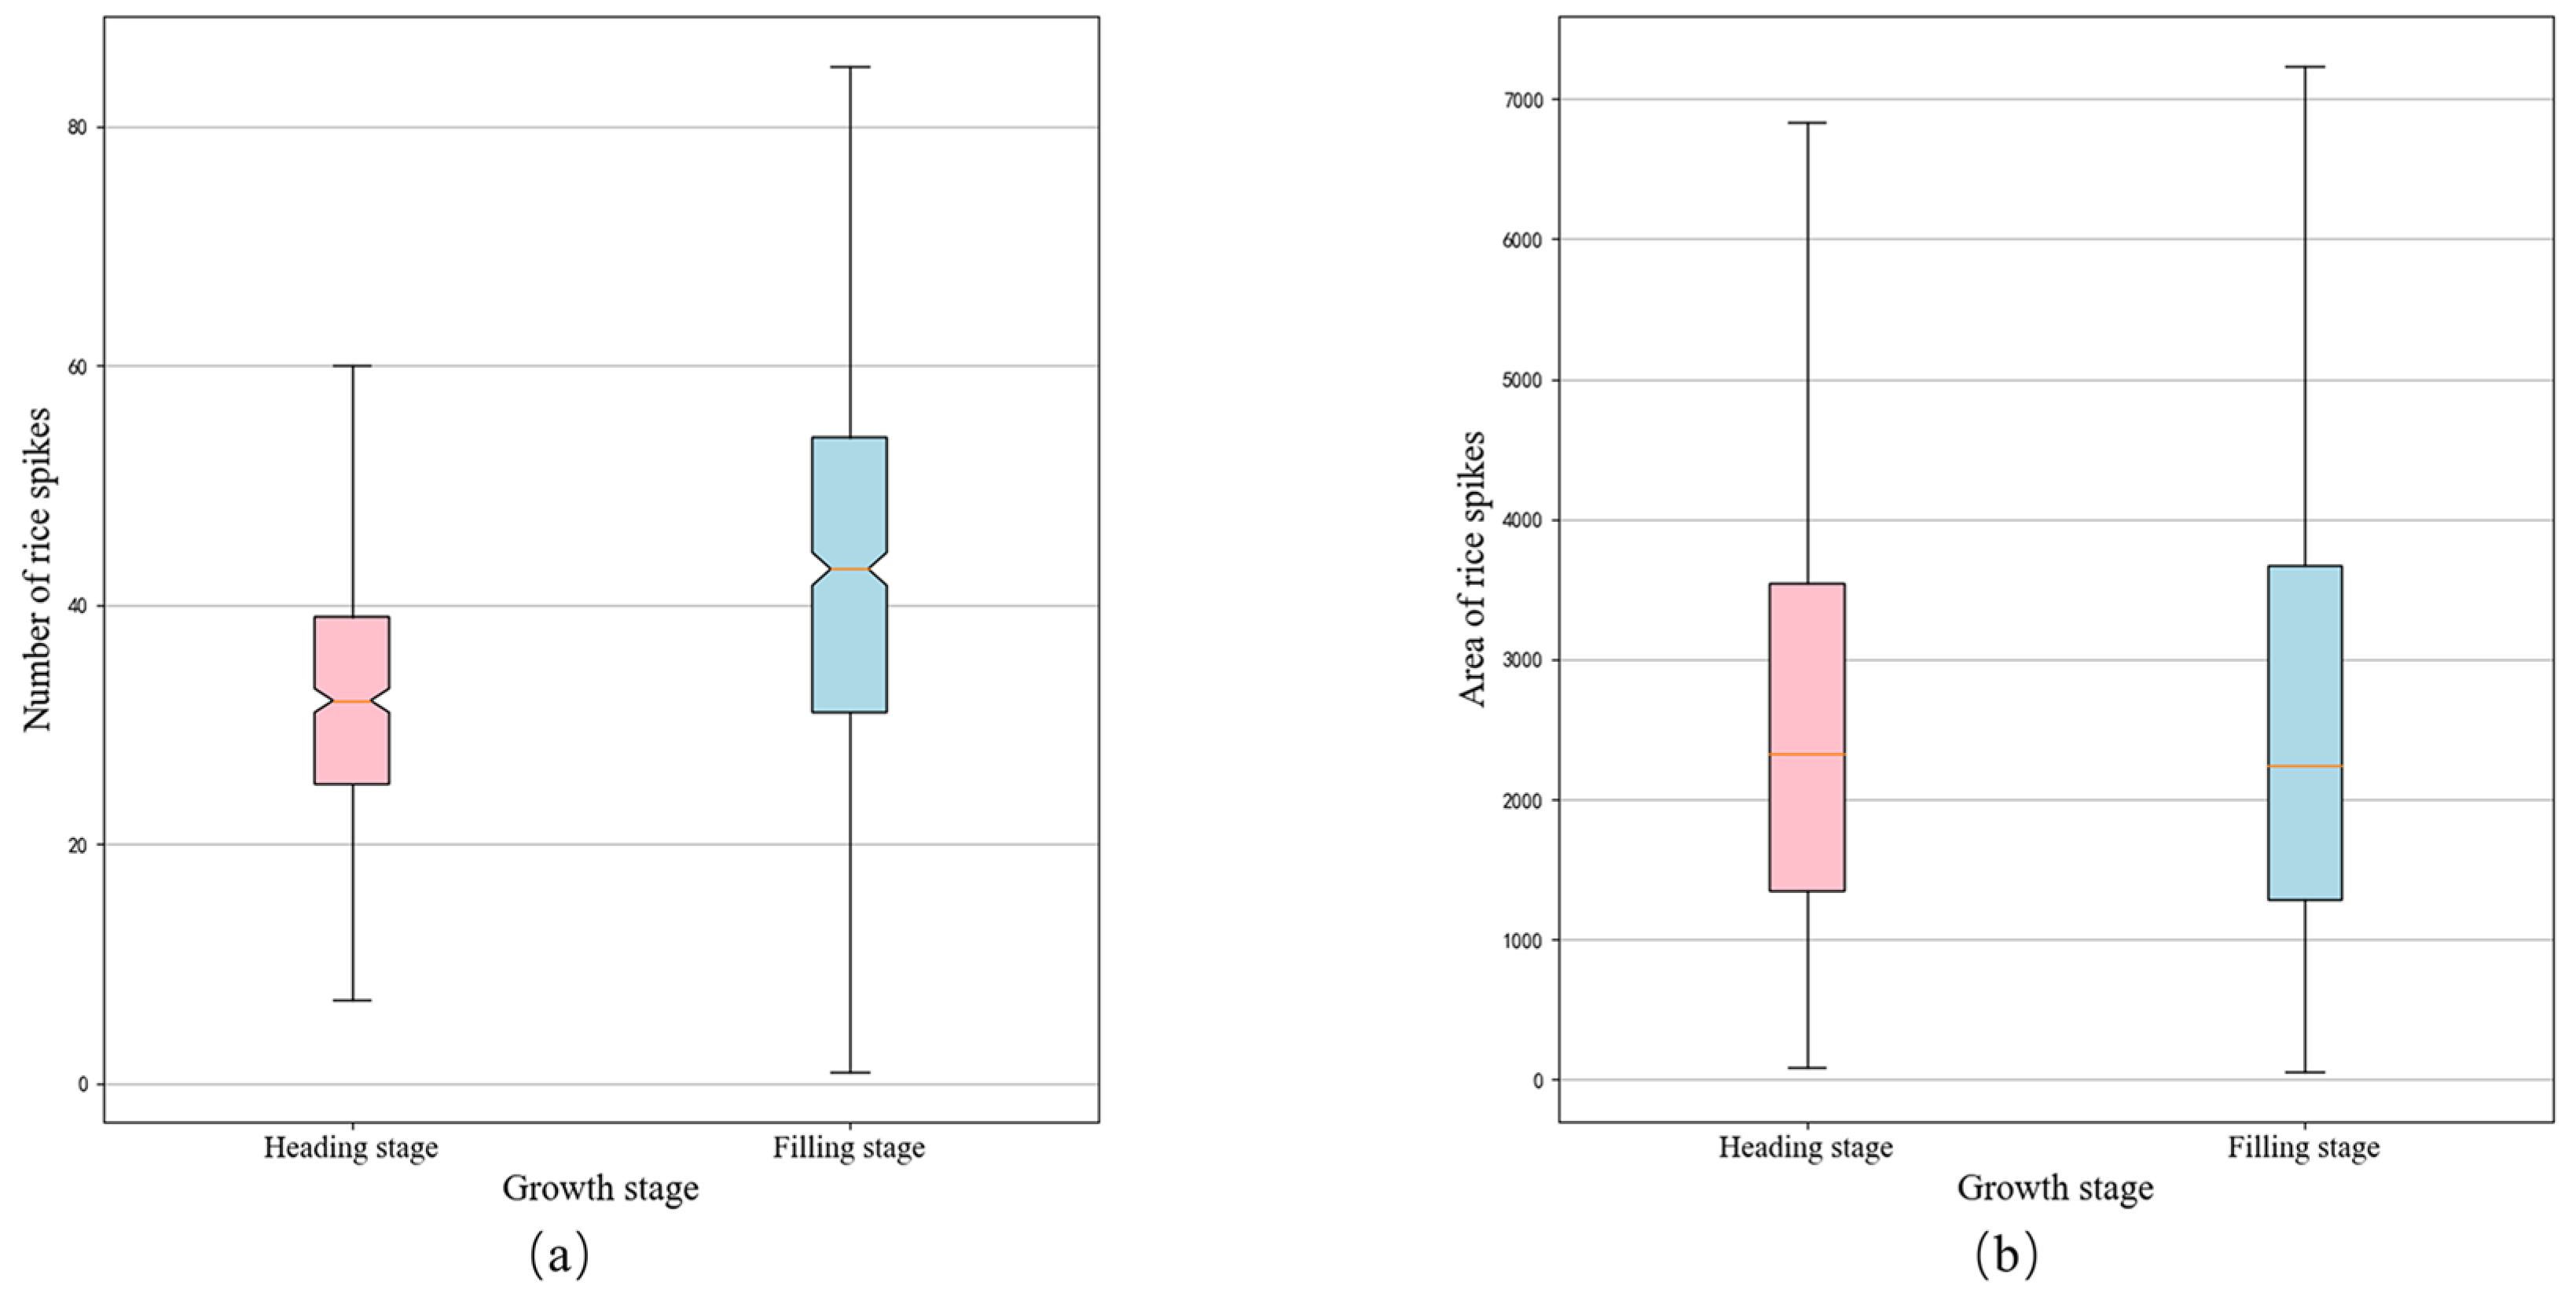
The filling stage of the rice spikes contains instances of significant occlusion and excessive lighting conditions. A detailed analysis of the model’s reduced accuracy across the two stages was conducted. The box plots in Figure 14 depict the distribution characteristics of spikes in images from the two rice growth stages. Observing Figure 14a,b, it is evident that the median number of rice spikes per image increased from 31 during the heading stage to 43 during the grain filling stage, with similar in area. This observation suggests a significant increase in spike density within a single image as rice plants mature. Furthermore, visual representation of the datasets from the two stages in Figure 15 reveals distinct characteristics during the grain filling stage, with noticeable bending of spikes, common occurrences of occlusion, and dense arrangements. Additionally, to enhance the algorithm’s capacity against excessed light, some images were captured closer to noon during the filling stage. All these factors together led to a decline in the accuracy and recall of the filling stage.
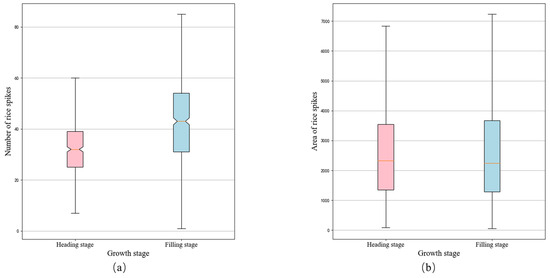
Figure 14.
Rice spike distribution in different growth stages: (a) average number of rice spikes per image, (b) average area of rice spike.
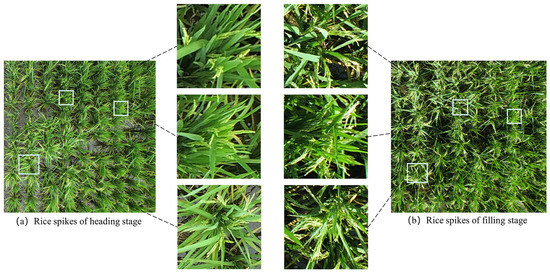
Figure 15.
Differences in rice in different growth stages.
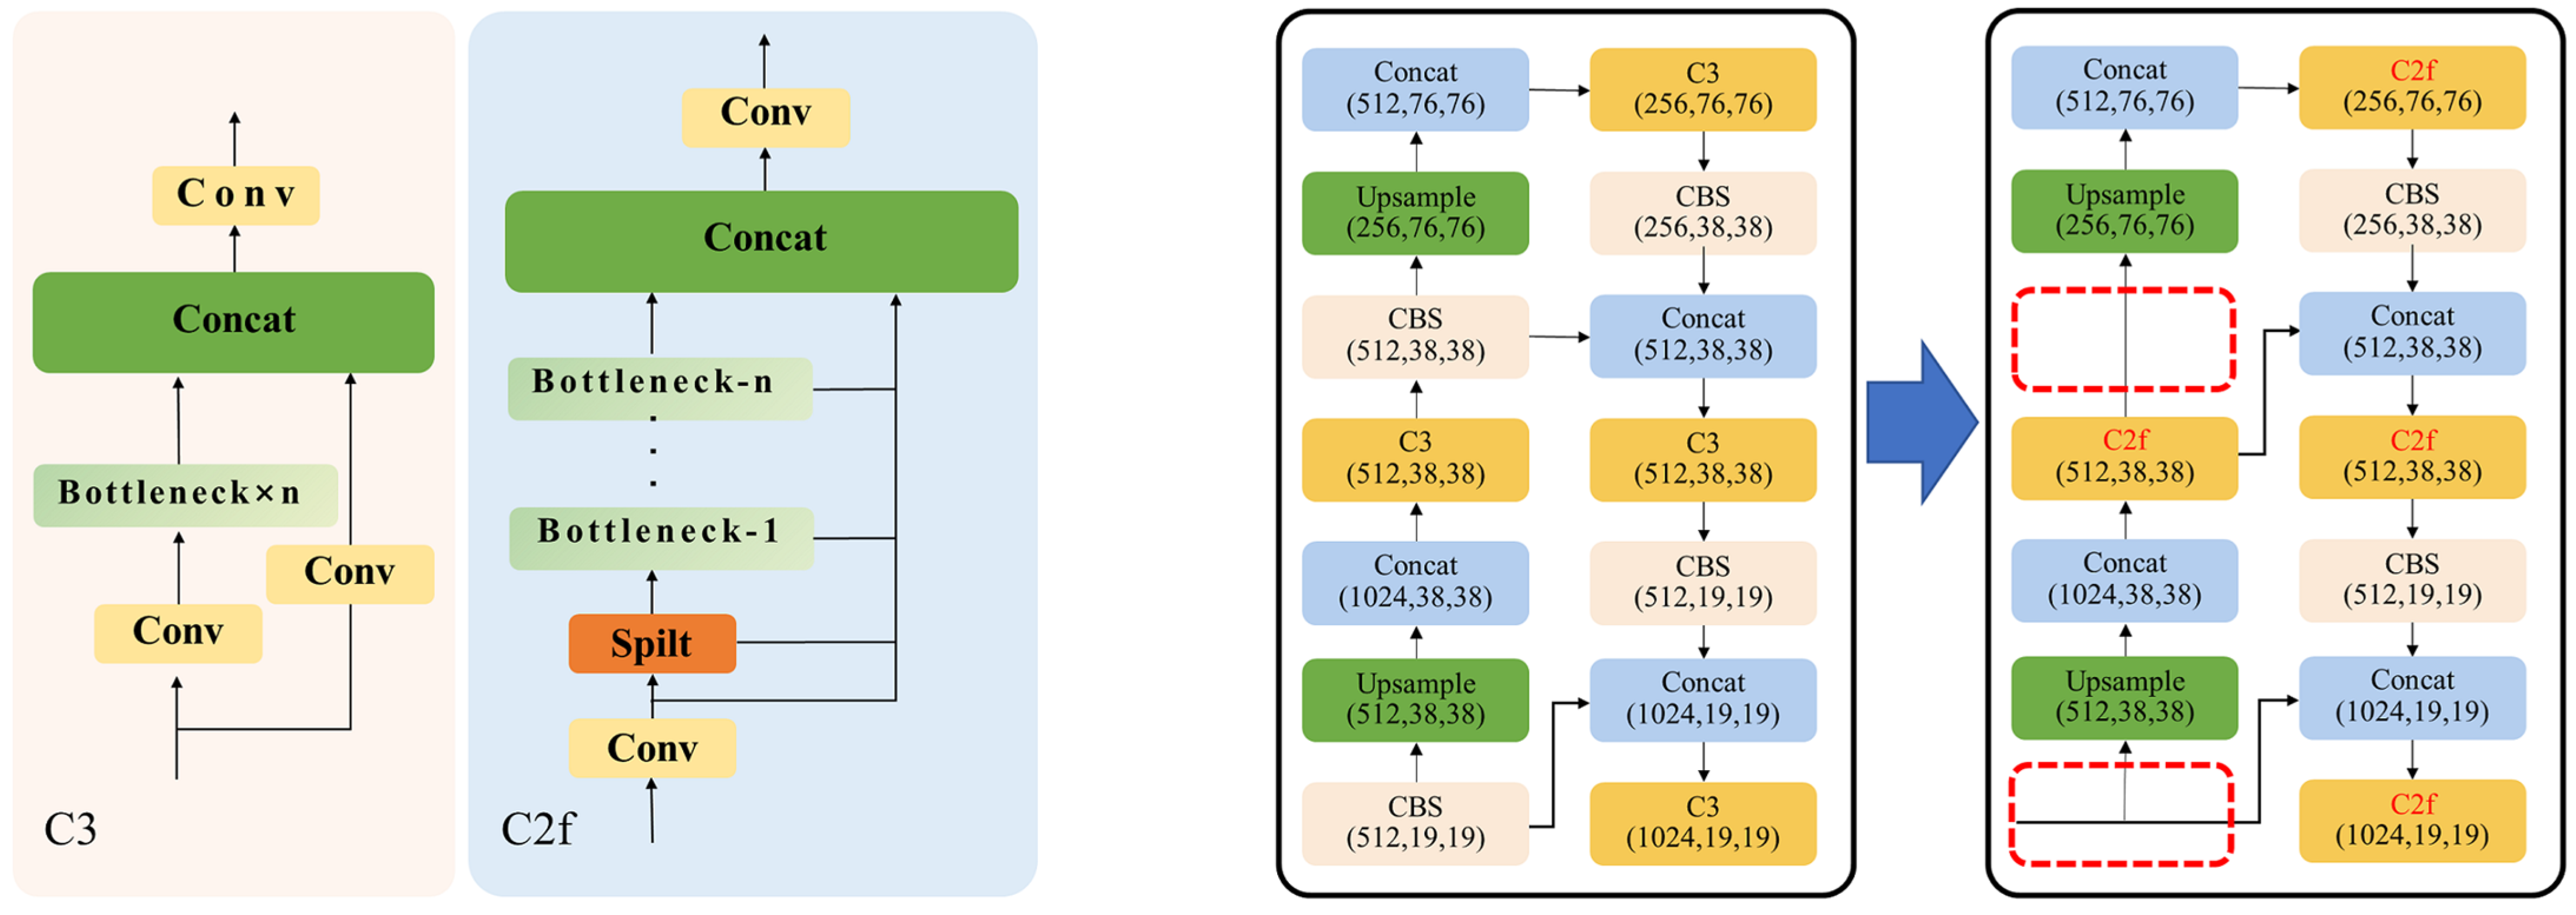
The performance of the YOLO Series varied. As an advanced version in the YOLO series, YOLOv7 has made significant improvements by incorporating technologies like E-ELAN (extended-efficient layer attention network), RepConv [39], and an auxiliary head. These enhancements have increased its parameter count and computational complexity, measured in FLOPS, while also leading to a slight accuracy boost of 0.2%. This incremental improvement aligns with the expected outcomes considering the model’s enhanced capabilities. On the other hand, YOLOv8, another Ultralytics product [34], has shown a noticeable drop in accuracy to 90.2% on the same dataset. This decrease can be mainly attributed to YOLOv8′s architecture, which was specifically optimized for the COCO dataset, potentially limiting its adaptability to the dataset used in this study. The architectural changes and optimizations with YOLOv5 to YOLOv8 are outlined in Figure 16.
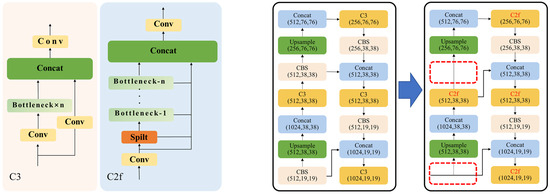
Figure 16.
Differences between YOLOv8 and YOLOv5 feature extraction modules and neck networks.
To enhance its performance in detecting larger objects within the COCO dataset, YOLOv8 has replaced the C3 module used in YOLOv5 with the C2f (CSP bottleneck with two convolutions) module. Figure 16a details the differences between the two modules. The C2f module adds an extra path between each bottleneck, merging with other modules, while removing the important shortcut connection between the first Conv module and the output in the C3 module. This architectural change shifts the model’s focus towards deeper, convolutionally processed features, enhancing its capacity to detect larger objects. However, the elimination of shortcut connections leads to a loss of shallow information from the initial input features, which is not reconcatenated in later stages, resulting in reduced accuracy in detecting smaller objects. Additionally, as depicted in Figure 16b, YOLOv8 has eliminated the convolutional layer in the upsample phase of the top-down components in the neck network featured in YOLOv5. This further reduces YOLOv8′s feature extraction capability, negatively impacting its performance in more intricate detection tasks.
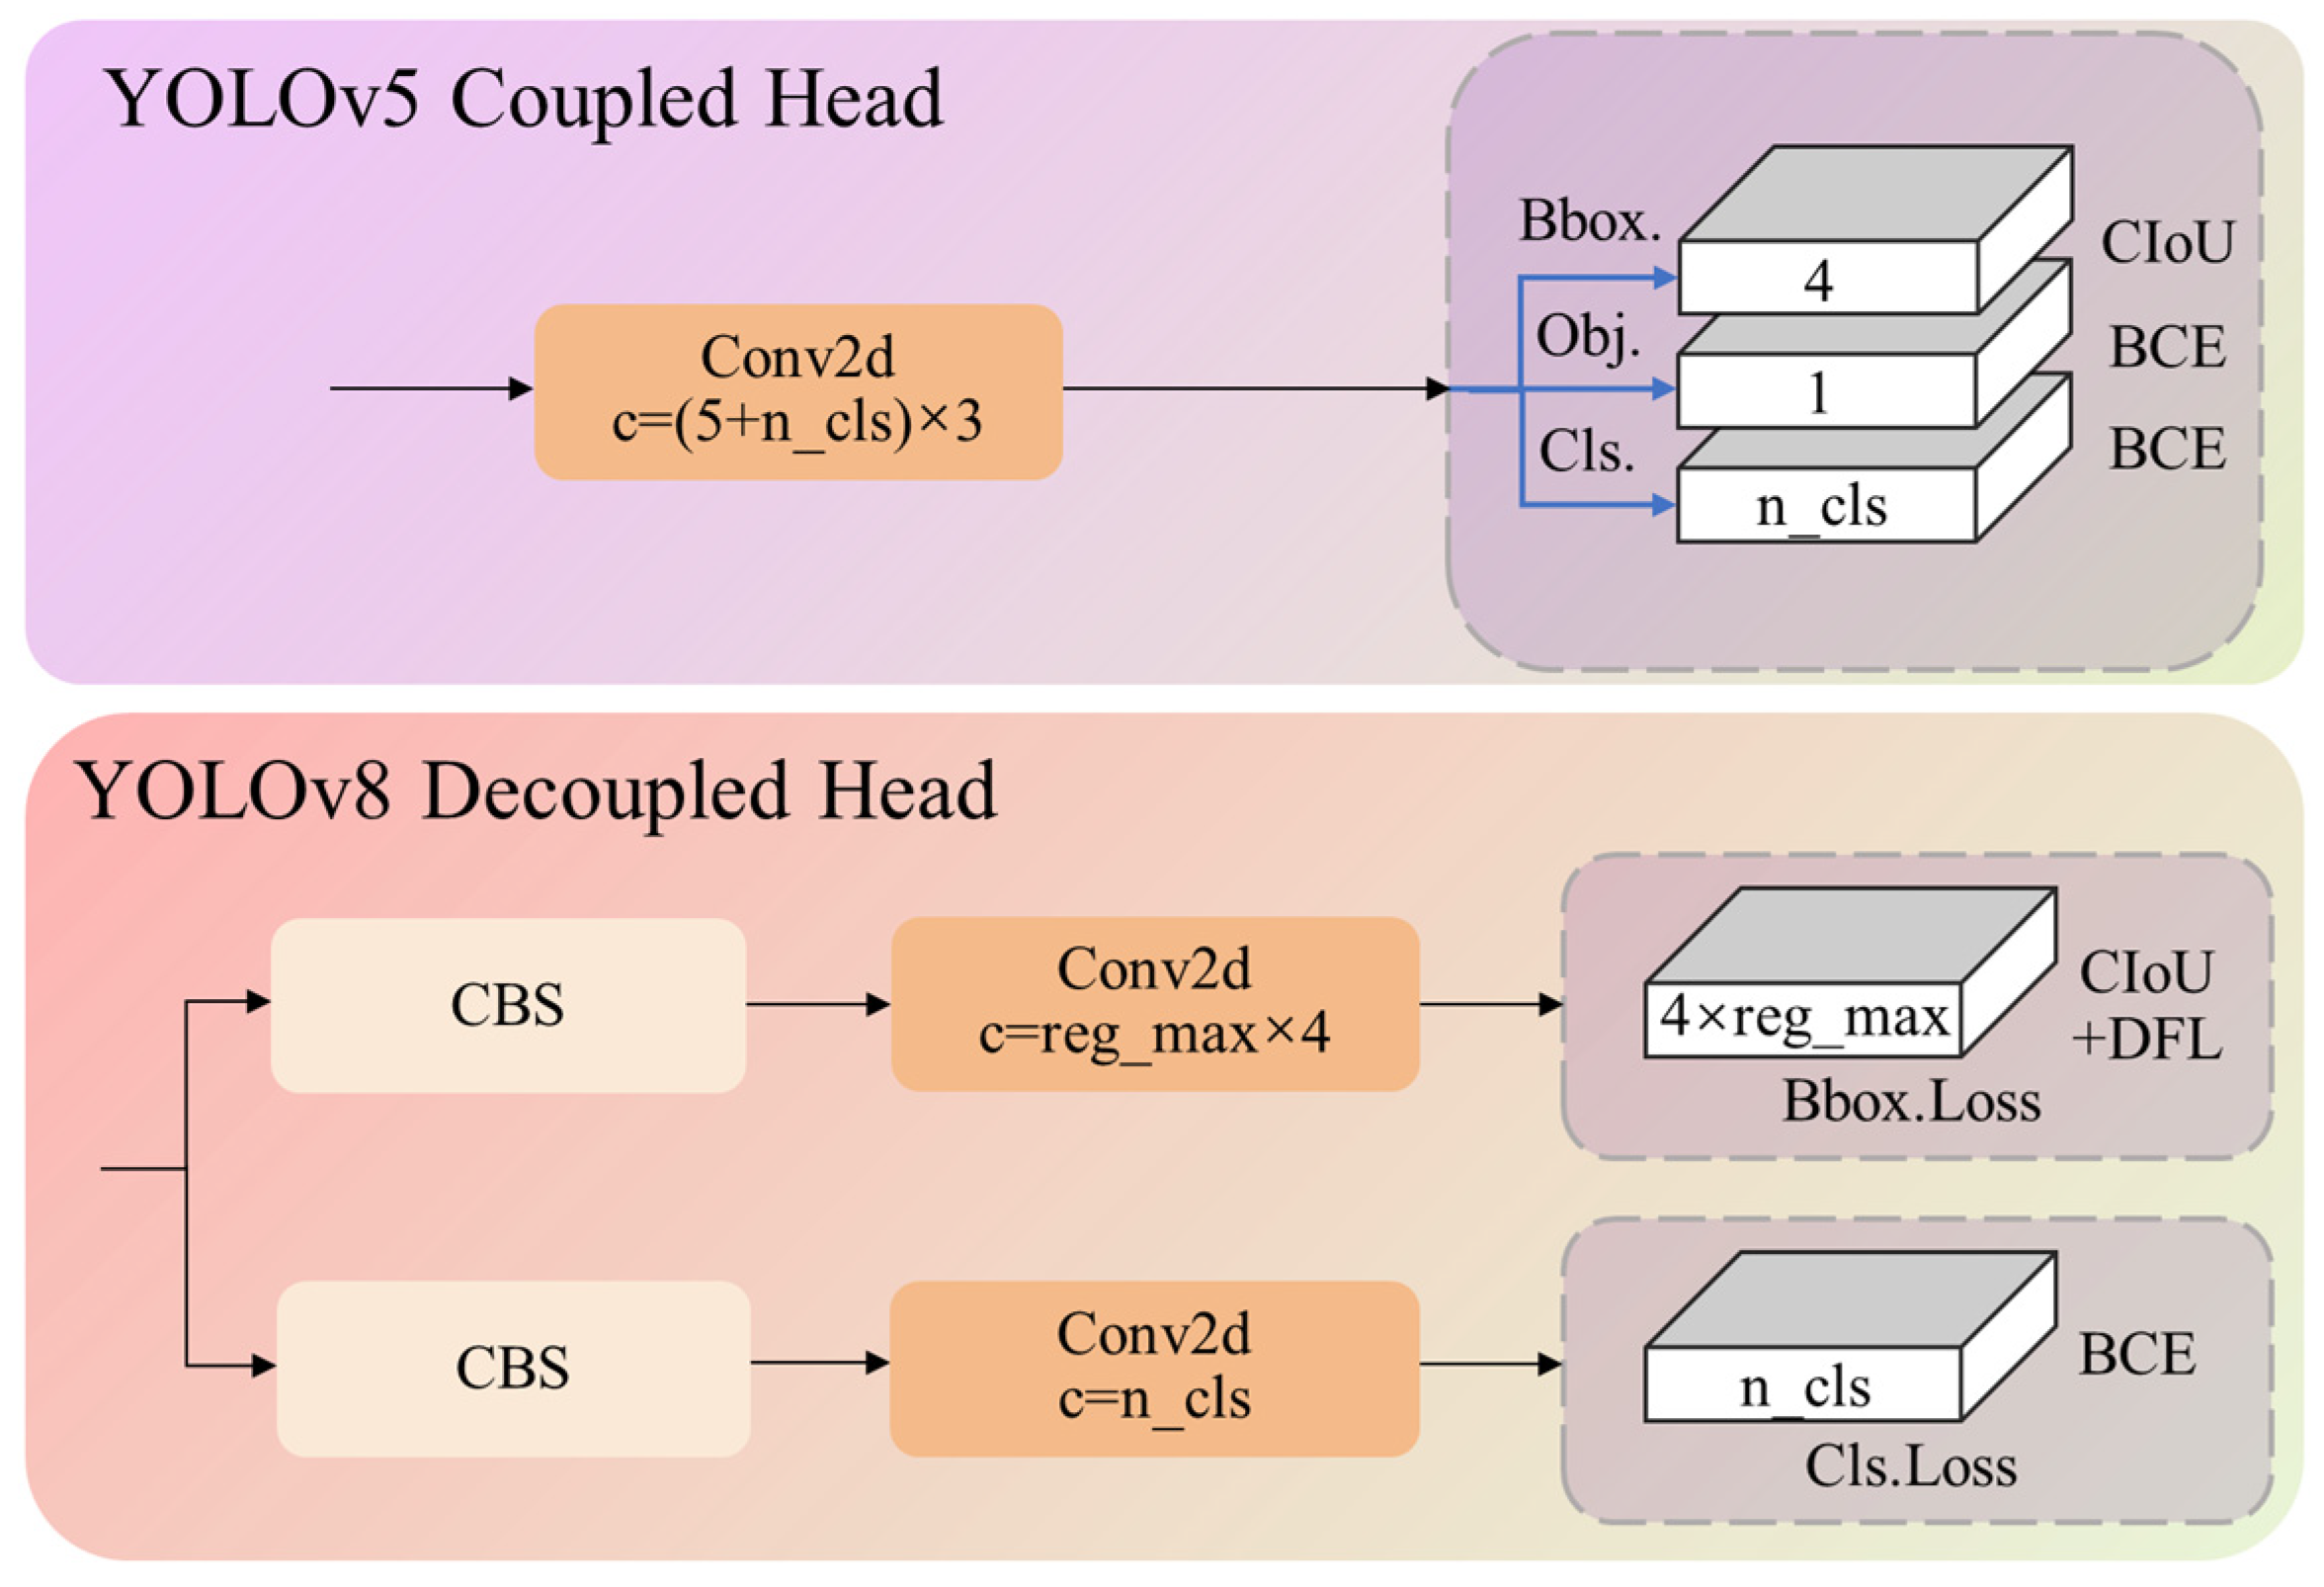
Moreover, YOLOv8 brings a significant refinement to its architecture by implementing a decoupled-head structure, as shown in Figure 17. This signifies a departure from the original YOLOv5, which utilized a unified detection head sharing parameters for classification and regression tasks. In contrast, YOLOv8 distinctively separates the classification and regression functions, abolishing the shared-parameter mechanism. This architectural advancement aims to enhance the model’s accuracy and efficiency by assigning dedicated pathways for the distinct tasks of object classification and bounding box regression.
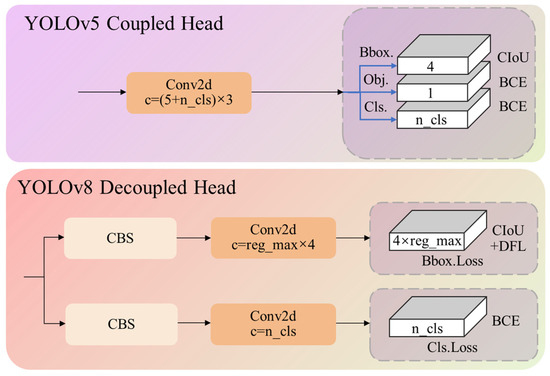
Figure 17.
Compare the difference between the detection heads of YOLOv8 and YOLOv5.
The processes of classification and localization have distinct objectives in object detection. Classification focuses on identifying the most similar category among predefined classes, while localization adjusts bounding box parameters to match ground truth (GT) box coordinates closely [40]. Implementing these tasks allows for faster model convergence. However, in this study, focusing on only the single rice spike category and considering the challenges of their dense and diminutive nature, this approach does not improve precision. Therefore, it is crucial to evaluate the model’s design against the specific requirements of the object detection task to choose an architecture that ensures the highest detection efficacy.
While the effectiveness of RICE-YOLO in detecting rice spikes in the field has been validated, there is still room for improvement. Firstly, due to the complexity condition in the field and the significant occlusion with the growth of rice, this model has inevitable occurrences of false detections, duplication detections and missed detections. One potential solution is to use the generative adversarial networks to connect separated rice spikes, enhancing the training of better performance detection models. Secondly, in our dataset, one image is captured for one rice field plot. Since the drone’s field of view (FOV) is relatively large, the rice plants in the center of the image appear more upright, where occlusion phenomenon for rice spikes is occurring less. However, the further away the rice plants are from the center of the FOV, the more inclined they will be in the image, and the more the occlusion phenomenon will be occurring. In practical applications, a possible approach to reduce such phenomenon is to capture additional images for the rice spikes that are originally at the edges of the image. Moreover, excessive lighting conditions significantly impact detection accuracy. While the current improvement algorithm assumes extreme sampling conditions at noon, intense lighting can still adversely affect detection accuracy in practical scenarios. A viable approach would be to conduct sampling in the morning or afternoon to achieve better precision for rice spike detection.
5. Conclusions
Rice spike detection is a crucial step in rice growth management. To address challenges posed by dense targets, small rice spikes, and varying weather conditions, this study proposes a rice spike recognition method namely RICE-YOLO. This method strikes a delicate balance between detection accuracy and efficiency, yielding significant advancements, as outlined below:
- (1)
- By integrating the EMA module, a microscale detection layer and the SIoU loss function into the network, the enhanced RICE-YOLO model substantially improves detection accuracy compared to YOLOv5. It excels in detecting densely planted and small-scale rice spikes.
- (2)
- Utilizing Grad-CAM heat map visualization, it was observed that the EMA module enhances the model’s feature extraction capabilities, while the optimized neck network facilitates the recognition of small rice ears and reduces model complexity.
- (3)
- The RICE-YOLO model showcases exceptional performance in rice spike detection, achieving the highest mAP@0.5 and recall scores of 94.8% and 87.6%, respectively, with a frame rate of 37fps and approximately 16.03 million parameters. Compared to YOLOv5, it enhances mAP@0.5 by 2.1 percentage points and reduces parameters by 4.8 million. Furthermore, it outperforms other detection methods in terms of model size, mAP, and recall, surpassing Faster R-CNN, Cascade R-CNN, YOLOv7, and YOLOv8 models.
- (4)
- Moving forward, this approach will be integrated with drone signal transmission technology to establish a real-time rice spike detection system in field for further validation in practical production settings.
Author Contributions
Conceptualization, methodology, formal analysis, investigation, and writing—review and editing, S.T. and M.L.; software, validation, and data curation, M.L.; validation and resources, C.L., W.C. and Y.P.; methodology and investigation, H.Z. and Y.W.; investigation and supervision, C.X.; and supervision, project administration, and funding acquisition, S.T. All authors have read and agreed to the published version of the manuscript.
Funding
This work was supported by Guangzhou Science and Technology Project (No. 2024B03J1310) and the National Natural Science Foundation of China (No. 52175226).
Data Availability Statement
The datasets in this study are available from the corresponding author on reasonable request.
Conflicts of Interest
The authors declare no conflicts of interest.
References
- Kargbo, M.B.; Pan, S.; Mo, Z.; Wang, Z.; Luo, X.; Tian, H.; Hossain, M.F.; Ashraf, U.; Tang, X. Physiological Basis of Improved Performance of Super Rice (Oryza sativa) to Deep Placed Fertilizer with Precision Hill-drilling Machine. Int. J. Agric. Biol. 2016, 18, 797–804. [Google Scholar] [CrossRef]
- Zhao, S.; Zheng, H.; Chi, M.; Chai, X.; Liu, Y. Rapid yield prediction in paddy fields based on 2D image modelling of rice panicles. Comput. Electron. Agric. 2019, 162, 759–766. [Google Scholar] [CrossRef]
- Huang, S.-W.; Wang, L.; Liu, L.-M.; Tang, S.-Q.; Zhu, D.-F.; Savary, S. Rice spikelet rot disease in China—2. Pathogenicity tests, assessment of the importance of the disease, and preliminary evaluation of control options. Crop. Prot. 2011, 30, 10–17. [Google Scholar] [CrossRef]
- Deng, C.; Wang, Y.; Navarro, G.; Sun, Y.; Cota-Ruiz, K.; Hernandez-Viezcas, J.A.; Niu, G.; Li, C.; White, J.C.; Gardea-Torresdey, J. Copper oxide (CuO) nanoparticles affect yield, nutritional quality, and auxin associated gene expression in weedy and cultivated rice (Oryza sativa L.) grains. Sci. Total Environ. 2022, 810, 152260. [Google Scholar] [CrossRef] [PubMed]
- Zhang, Y.; Xiao, D.; Liu, Y.; Wu, H. An algorithm for automatic identification of multiple developmental stages of rice spikes based on improved Faster R-CNN. Crop J. 2022, 10, 1323–1333. [Google Scholar] [CrossRef]
- Guo, W.; Fukatsu, T.; Ninomiya, S. Automated characterization of flowering dynamics in rice using field-acquired time-series RGB images. Plant Methods 2015, 11, 7. [Google Scholar] [CrossRef] [PubMed]
- Zhou, B.; Khosla, A.; Lapedriza, A.; Oliva, A.; Torralba, A. Learning Deep Features for Discriminative Localization. In Proceedings of the 2016 IEEE Conference on Computer Vision and Pattern Recognition (CVPR), Las Vegas, NV, USA, 26 June–1 July 2016; pp. 2921–2929. [Google Scholar]
- Reza, M.N.; Na, I.S.; Baek, S.W.; Lee, K.-H. Rice yield estimation based on K-means clustering with graph-cut segmentation using low-altitude UAV images. Biosyst. Eng. 2019, 177, 109–121. [Google Scholar] [CrossRef]
- Duan, L.; Huang, C.; Chen, G.; Xiong, L.; Liu, Q.; Yang, W. Determination of rice panicle numbers during heading by multi-angle imaging. Crop. J. 2015, 3, 211–219. [Google Scholar] [CrossRef]
- Xu, X.; Li, H.; Yin, F.; Xi, L.; Qiao, H.; Ma, Z.; Shen, S.; Jiang, B.; Ma, X. Wheat ear counting using K-means clustering segmentation and convolutional neural network. Plant Methods 2020, 16, 106. [Google Scholar] [CrossRef]
- Zhang, Y.; Li, M.; Ma, X.; Wu, X.; Wang, Y. High-Precision Wheat Head Detection Model Based on One-Stage Network and GAN Model. Front. Plant Sci. 2022, 13, 787852. [Google Scholar] [CrossRef]
- Zhang, X.; Zhu, D.; Wen, R. SwinT-YOLO: Detection of densely distributed maize tassels in remote sensing images. Comput. Electron. Agric. 2023, 210, 107905. [Google Scholar] [CrossRef]
- Li, H.; Wang, P.; Huang, C. Comparison of Deep Learning Methods for Detecting and Counting Sorghum Heads in UAV Imagery. Remote Sens. 2022, 14, 3143. [Google Scholar] [CrossRef]
- Gao, Y.; Li, Y.; Jiang, R.; Zhan, X.; Lu, H.; Guo, W.; Yang, W.; Ding, Y.; Liu, S. Enhancing Green Fraction Estimation in Rice and Wheat Crops: A Self-Supervised Deep Learning Semantic Segmentation Approach. Plant Phenomics 2023, 5, 0064. [Google Scholar] [CrossRef]
- Wosner, O.; Farjon, G.; Bar-Hillel, A. Object detection in agricultural contexts: A multiple resolution benchmark and comparison to human. Comput. Electron. Agric. 2021, 189, 106404. [Google Scholar] [CrossRef]
- Shelhamer, E.; Long, J.; Darrell, T. Fully Convolutional Networks for Semantic Segmentation. IEEE Trans. Pattern Anal. Mach. Intell. 2017, 39, 640–651. [Google Scholar] [CrossRef] [PubMed]
- Ronneberger, O.; Fischer, P.; Brox, T. U-Net: Convolutional Networks for Biomedical Image Segmentation. arXiv 2015, arXiv:1505.04597. [Google Scholar] [CrossRef]
- He, K.; Gkioxari, G.; Dollár, P.; Girshick, R. Mask R-CNN. arXiv 2017, arXiv:1703.06870. [Google Scholar] [CrossRef]
- Hong, S.; Jiang, Z.; Liu, L.; Wang, J.; Zhou, L.; Xu, J. Improved Mask R-CNN Combined with Otsu Preprocessing for Rice Panicle Detection and Segmentation. Appl. Sci. 2022, 12, 1701. [Google Scholar] [CrossRef]
- Ren, S.; He, K.; Girshick, R.; Sun, J. Faster R-CNN: Towards Real-Time Object Detection with Region Proposal Networks. IEEE Trans. Pattern Anal. Mach. Intell. 2017, 39, 1137–1149. [Google Scholar] [CrossRef]
- Cai, Z.; Vasconcelos, N. Cascade R-CNN: Delving into High Quality Object Detection. arXiv 2017, arXiv:1712.00726. [Google Scholar] [CrossRef]
- Zhou, C.; Ye, H.; Hu, J.; Shi, X.; Hua, S.; Yue, J.; Xu, Z.; Yang, G. Automated Counting of Rice Panicle by Applying Deep Learning Model to Images from Unmanned Aerial Vehicle Platform. Sensors 2019, 19, 3106. [Google Scholar] [CrossRef]
- Tan, S.; Lu, H.; Yu, J.; Lan, M.; Hu, X.; Zheng, H.; Peng, Y.; Wang, Y.; Li, Z.; Qi, L.; et al. In-field rice panicles detection and growth stages recognition based on RiceRes2Net. Comput. Electron. Agric. 2023, 206, 7704. [Google Scholar] [CrossRef]
- Liu, W.; Anguelov, D.; Erhan, D.; Szegedy, C.; Reed, S.; Fu, C.-Y.; Berg, A.C. SSD: Single Shot MultiBox Detector. arXiv 2015, arXiv:1512.02325. [Google Scholar] [CrossRef]
- Lin, T.-Y.; Goyal, P.; Girshick, R.; He, K.; Dollár, P. Focal Loss for Dense Object Detection. arXiv 2017, arXiv:1708.02002. [Google Scholar] [CrossRef]
- Wang, C.-Y.; Bochkovskiy, A.; Liao, H.-Y.M. YOLOv7: Trainable Bag-of-Freebies Sets New State-of-the-Art for Real-Time Object Detectors. In Proceedings of the 2023 IEEE/CVF Conference on Computer Vision and Pattern Recognition (CVPR), Vancouver, BC, Canada, 17–24 June 2023; pp. 7464–7475. [Google Scholar]
- Sun, B.; Zhou, W.; Zhu, S.; Huang, S.; Yu, X.; Wu, Z.; Lei, X.; Yin, D.; Xia, H.; Chen, Y.; et al. Universal detection of curved rice panicles in complex environments using aerial images and improved YOLOv4 model. Front. Plant Sci. 2022, 13, 1021398. [Google Scholar] [CrossRef] [PubMed]
- Wang, X.; Yang, W.; Lv, Q.; Huang, C.; Liang, X.; Chen, G.; Xiong, L.; Duan, L. Field rice panicle detection and counting based on deep learning. Front. Plant Sci. 2022, 13, 966495. [Google Scholar] [CrossRef]
- Mogili, U.M.R.; Deepak, B.B.V.L. Review on Application of Drone Systems in Precision Agriculture. Procedia Comput. Sci. 2018, 133, 502–509. [Google Scholar] [CrossRef]
- Murugan, D.; Garg, A.; Singh, D. Development of an Adaptive Approach for Precision Agriculture Monitoring with Drone and Satellite Data. IEEE J. Sel. Top. Appl. Earth Obs. Remote Sens. 2017, 10, 5322–5328. [Google Scholar] [CrossRef]
- Song, E.; Shao, G.; Zhu, X.; Zhang, W.; Dai, Y.; Lu, J. Estimation of Plant Height and Biomass of Rice Using Unmanned Aerial Vehicle. Agronomy 2024, 14, 145. [Google Scholar] [CrossRef]
- Lyu, S.; Noguchi, N.; Ospina, R.; Kishima, Y. Development of phenotyping system using low altitude UAV imagery and deep learning. Int. J. Agric. Biol. Eng. 2021, 14, 207–215. [Google Scholar] [CrossRef]
- Teng, Z.; Chen, J.; Wang, J.; Wu, S.; Chen, R.; Lin, Y.; Shen, L.; Jackson, R.; Zhou, J.; Yang, C. Panicle-Cloud: An Open and AI-Powered Cloud Computing Platform for Quantifying Rice Panicles from Drone-Collected Imagery to Enable the Classification of Yield Production in Rice. Plant Phenomics 2023, 5, 0105. [Google Scholar] [CrossRef] [PubMed]
- Jocher, G.; Chaurasia, A.; Qiu, J. Yolo by Ultralytics. Available online: https://github.com/ultralytics (accessed on 2 January 2023).
- Fan, Y.; Zhang, S.; Feng, K.; Qian, K.; Wang, Y.; Qin, S. Strawberry Maturity Recognition Algorithm Combining Dark Channel Enhancement and YOLOv5. Sensors 2022, 22, 419. [Google Scholar] [CrossRef] [PubMed]
- Ouyang, D.; He, S.; Zhang, G.; Luo, M.; Guo, H.; Zhan, J.; Huang, Z. Efficient Multi-Scale Attention Module with Cross-Spatial Learning. In Proceedings of the ICASSP 2023—2023 IEEE International Conference on Acoustics, Speech and Signal Processing (ICASSP), Rhodes Island, Greece, 4–10 June 2023; pp. 1–5. [Google Scholar]
- Gevorgyan, Z. SIoU Loss: More Powerful Learning for Bounding Box Regression. arXiv 2022, arXiv:2205.12740. [Google Scholar] [CrossRef]
- Wang, C.-Y.; Liao, H.-Y.M.; Wu, Y.-H.; Chen, P.-Y.; Hsieh, J.-W.; Yeh, I.H. CSPNet: A New Backbone that can Enhance Learning Capability of CNN. In Proceedings of the 2020 IEEE/CVF Conference on Computer Vision and Pattern Recognition Workshops (CVPRW), Seattle, WA, USA, 14–19 June 2020; pp. 1571–1580. [Google Scholar]
- Soudy, M.; Afify, Y.; Badr, N. RepConv: A novel architecture for image scene classification on Intel scenes dataset. Int. J. Intell. Comput. Inf. Sci. 2022, 22, 63–73. [Google Scholar] [CrossRef]
- Song, G.; Liu, Y.; Wang, X. Revisiting the Sibling Head in Object Detector. In Proceedings of the 2020 IEEE/CVF Conference on Computer Vision and Pattern Recognition (CVPR), Seattle, WA, USA, 14–19 June 2020; pp. 11560–11569. [Google Scholar]


Disclaimer/Publisher’s Note: The statements, opinions and data contained in all publications are solely those of the individual author(s) and contributor(s) and not of MDPI and/or the editor(s). MDPI and/or the editor(s) disclaim responsibility for any injury to people or property resulting from any ideas, methods, instructions or products referred to in the content. |
© 2024 by the authors. Licensee MDPI, Basel, Switzerland. This article is an open access article distributed under the terms and conditions of the Creative Commons Attribution (CC BY) license (https://creativecommons.org/licenses/by/4.0/).