Article

The Influence of Different, Long-Term Fertilizations on the Chemical and Spectroscopic Properties of Soil Organic Matter

1
Institute of Soil Science, Plant Nutrition and Environmental Protection, Wrocław University of Environmental and Life Sciences, 50-375 Wrocław, Poland
2
Department of Bioengineering, West Pomeranian University of Technology in Szczecin, 70-310 Szczecin, Poland
3
Department of Soil Science, University of Rostock, 18051 Rostock, Germany
4
Institute of Environmental Engineering, Warsaw University of Life Sciences, 02-787 Warsaw, Poland
5
Department of Soil Science and Environmental Chemistry, West Pomeranian University of Technology in Szczecin, 70-310 Szczecin, Poland
*
Author to whom correspondence should be addressed.
Agronomy 2024, 14(4), 837; https://doi.org/10.3390/agronomy14040837
Submission received: 1 March 2024 / Revised: 29 March 2024 / Accepted: 13 April 2024 / Published: 17 April 2024

Abstract

:
Currently, revealing soil management strategies that store the maximum atmospheric CO2 in the soil is a major issue. This is best explored by investigating long-term experiments, like the Skierniewice (Poland) field trial, established in 1921 on sandy loam Luvisol. In this trial, the variants analyzed included control (CON), manure (MAN), legumes (LEG), and manure + legumes (MAN + LEG). Soil samples from the A horizon were analyzed for total organic carbon (TOC), carbon content of humic acids (HA), fulvic acids (FA), and humin (HUM), as well as for spectroscopic properties of bulk soil and isolated HUM. Compared to the control, all other treatments caused an increase in TOC, while the application of manure resulted in an increase in the amount of HUM. Legume application caused an increase in UV-Vis absorbance and fluorescence emission. Thermochemolysis and gas chromatography/mass spectrometry showed that HUM was enriched in carbohydrates in almost all pairs of soil and HUM. Compared to the CON, the largest proportion of carbohydrate in HUM was found in MAN + LEG. Different long-term soil management strategies not only altered TOC, but also, surprisingly, the chemical composition of HUM, which is considered to be particularly stable and a long-term sink of atmospheric carbon.

1. Introduction

Currently, an important European and global challenge is to counteract unfavorable climate change or at least mitigate it [1]. One of the options is to develop a soil management strategy that will capture and store the maximum amount of atmospheric CO2 in the soil [2]. This can be achieved by examining the impact of different soil management methods on possible increases in soil organic matter (SOM). These are long-term processes, so their effects are best monitored in long-term field experiments [3,4,5]. By providing a continuous and holistic perspective, these experiments expand our knowledge by revealing trends that may elude short-term research. The long-term effects of these practices have the potential to enhance or change the harmonious balance between agricultural productivity and a sustainable soil environment. Therefore, in addition to analyzing the possibility of increasing the carbon content in the soil, it is important to trace the impact of long-term fertilization practices on the properties and fractionation of the SOM. In particular, the formation of organic compounds resistant to mineralization contributes significantly to the sequestration of carbon dioxide and the mitigation of global climate change [6,7,8,9], as well as increases soil resistance to degradation [10,11].
SOM is a complex mixture of particles from plants, animals, and microorganisms with different degrees of transformation, composition, availability, and environmental activity. Many years of research have indicated that, due to its heterogeneity, to recognize the role of SOM in the environment, it is necessary to separate it into components of different properties and behaviors [12,13]. The oldest classic alkali extraction method [14] allows for the separating of humic substances (HS) into humic acids (HA), fulvic acids (FA), and the humin fraction (HUM), which is the most resistant to decay. More than 200 years have passed since the first chemical extraction of HS, but the structure and fractionation of SOM are still debated among the scientific community and, to this day, there is no consensus on which method should be used [15,16,17,18,19]. Currently, instead of chemical fractionation, physical separation methods based on size and/or density are being proposed [20,21]. Another approach is the determination of carbon stabilization by different soil components, including a biochemically protected C pool, a silt and clay-protected C pool, a microaggregate-protected C pool, and an unprotected C pool [22]. Undoubtedly, each SOM fractionation has limitations, but different procedures can certainly provide useful information [18,23]. It seems that different methods should be used independently of each other to best explore and deepen the understanding of SOM properties and transformations.
Diverse cultivation systems contribute to differences in the quality and quantity of organic nutrients, influencing microbial activity and the formation of humic substances. The use of fertilizers, especially over a longer period, can affect the chemical composition of SOM and the distribution of its different fractions. In the long-term field experiments conducted so far, changes in the organic C content have mainly been analyzed [24,25,26,27,28,29,30]. The contents of free, occluded, and mineral-associated organic C have been investigated less frequently [31], and the same is true of the proportion of macro- and microaggregates [32], soil enzymatic activity [33], soil aggregate stability, and soil organic carbon sequestration [7], as well as heavy and light C fractions [34]. There is very little research on the impact of fertilization on the properties of HUM [35], which is the most stable SOM fraction. There are also relatively few advanced spectroscopic studies on the structure and chemical properties of modified SOM as a result of many years of fertilization [36].
The application of modern spectroscopic methods is of great importance, as they provide a lot of valuable information on aquatic and terrestrial organic matter [12,37]. UV-Vis spectroscopy is useful for assessing differences in the composition and concentration of various organic fractions [38]. Fluorescence spectroscopy makes it possible to trace the structural changes in individual SOM fractions [39,40,41].
A frequently used tool to study the composition and structure of SOM is nuclear magnetic resonance (NMR), which provides information on the molecular structure of organic matter in soil [12]. Thermal degradation methods (e.g., pyrolysis, thermochemolysis), combined with mass spectrometry such as Pyrolysis-Gas Chromatography/Mass Spectrometry (Py-GC/MS) [42,43], Pyrolysis-Field Ionization Mass Spectrometry (Py-FIMS), and others, are powerful analytical techniques used in the study of SOM, which result in the quantitative analysis of specific organic compounds or classes of compounds in soil samples. They provide information on the chemical composition and structure of particular components of the SOM and their stability.
In this work, to determine the effects of various fertilizations used over 100 years on the properties of SOM and its fraction that is most resistant to decomposition, the following spectroscopic techniques were used: UV-Vis, fluorescence spectroscopy, and thermochemolysis (TC) -GC/MS. The objectives of the study were to (i) disclose the effect of soil management with mineral and organic fertilizer and legume cropping on the chemical and structural characteristics of the SOM and to (ii) find out which management strategy has the most beneficial effect on the proportions of the stable fractions of the SOM.

2. Material and Methods

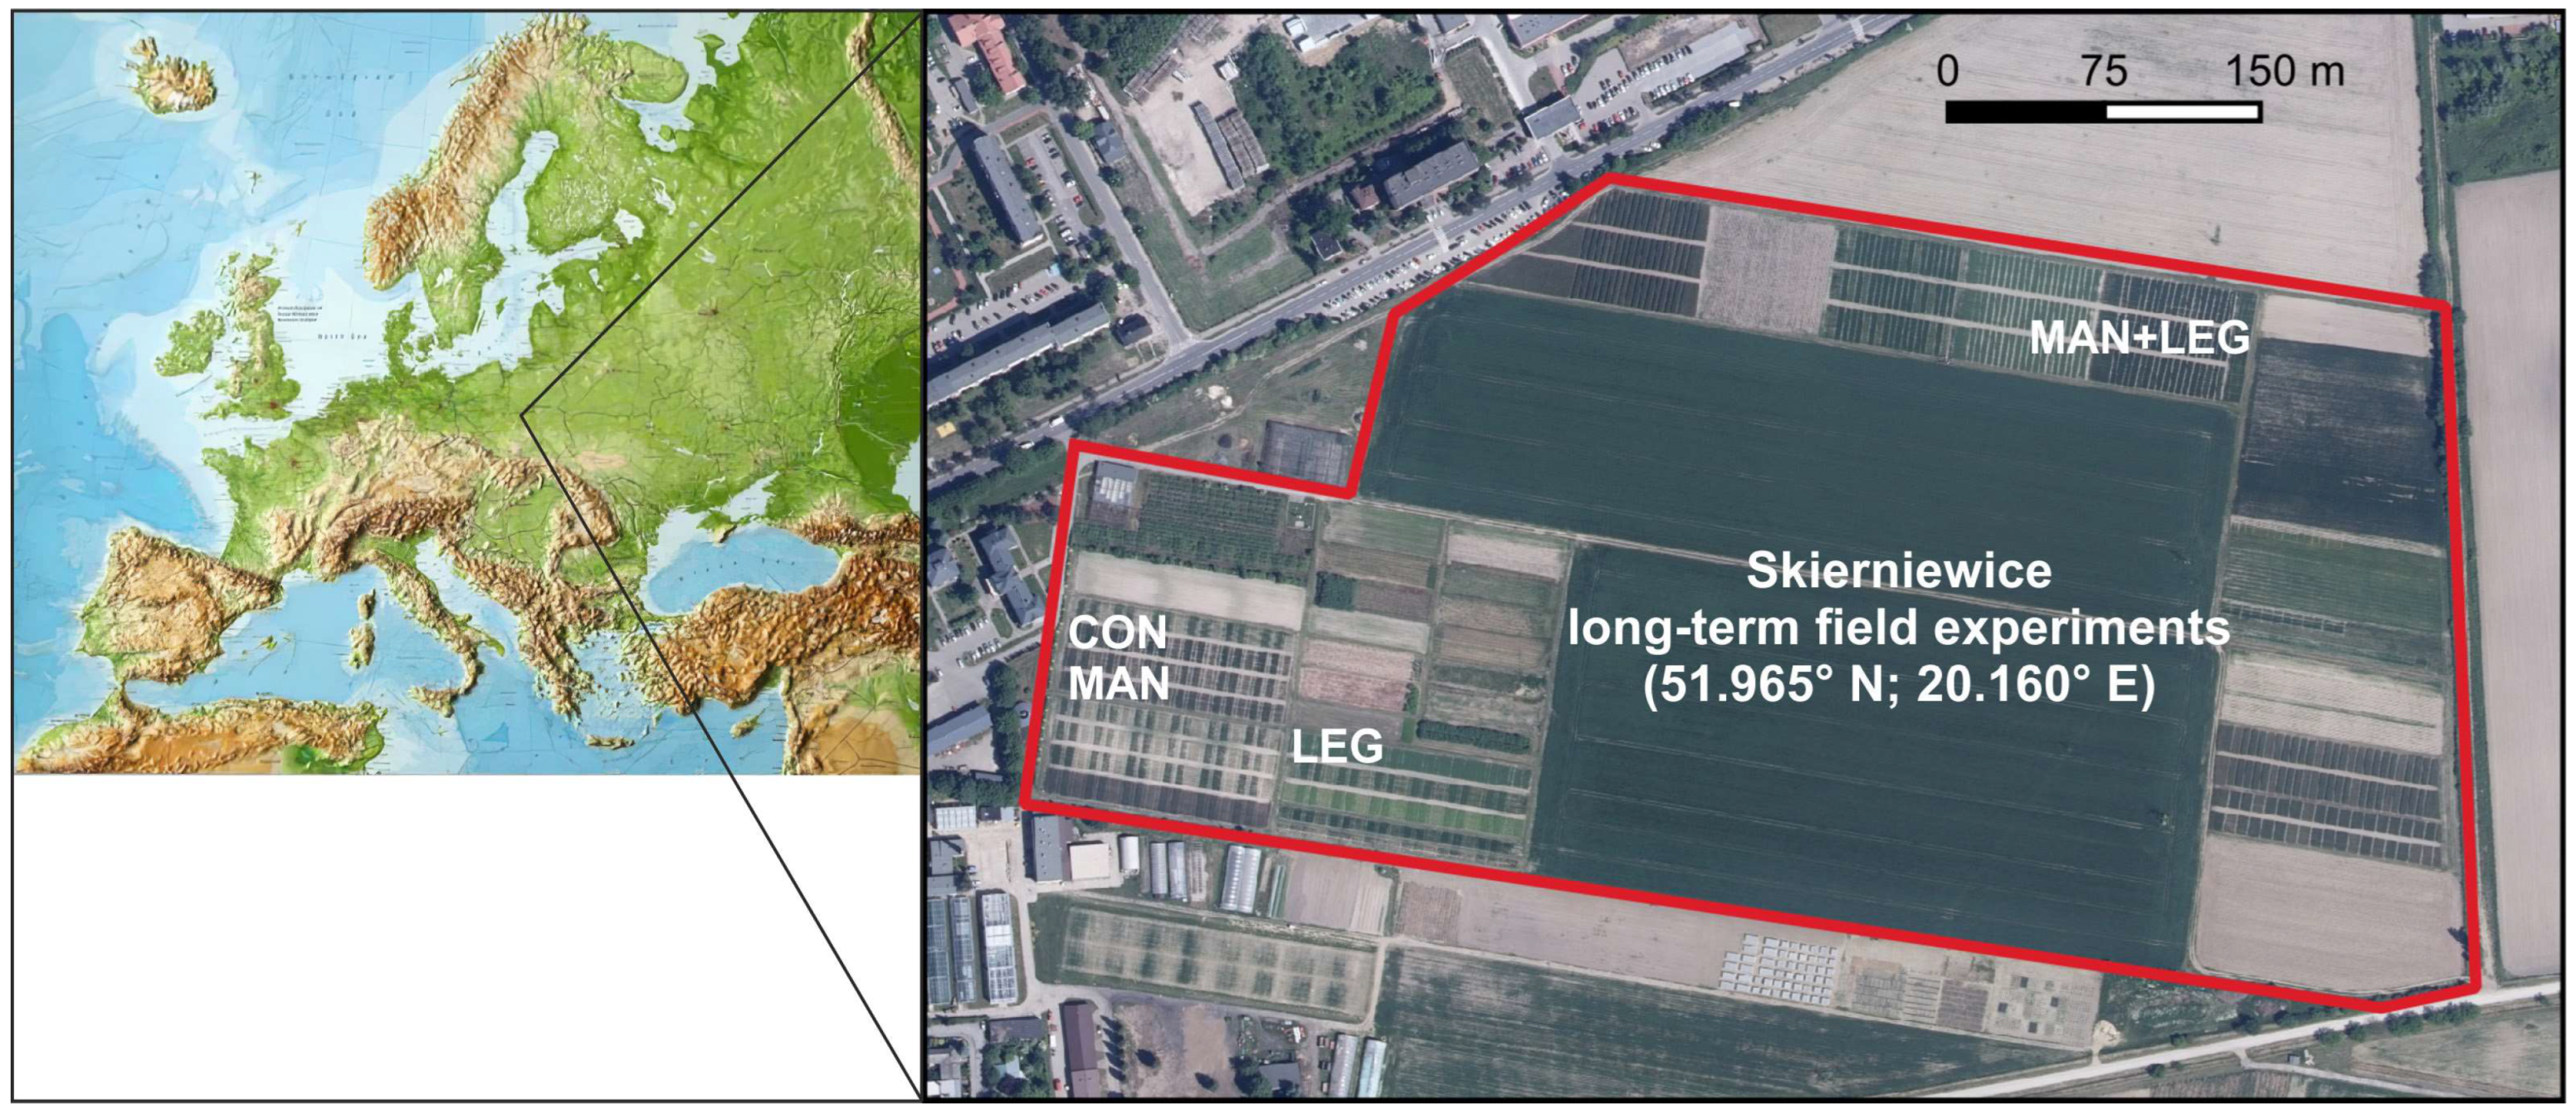
2.1. Long-Term Field Experiment

The experiment was established in 1921 in Skierniewice (central Poland, 51.965° N, 20.160° E) at the Experimental Station of the Institute of Agriculture, Warsaw University of Life Sciences.
The experiment included the following treatments: control (CON), manure (MAN), legumes (LEG), and legumes with manure (MAN + LEG). CON included arbitrary crop rotation, without manure and without legumes. MAN included arbitrary crop rotation without legumes, but with farmyard manure applied every four years at a rate of 30 t ha−1 since 1992. LEG included arbitrary crop rotation with legumes (Trifolium pratense L.), but without farmyard manure. Cereals prevailed in arbitrary rotations (60–80%); the remaining crops grown in these crop rotations were potatoes or industrial plants. MAN + LEG included 5-year crop rotation (potato, spring barley, red clover, winter wheat, and rye). Manure was applied at dose of 30 t ha−1 every 5th year to potato. All plots were fertilized with NPK, and every four years with Ca (1.6 t h−1). From 1924 to 1975, the NPK fertilization doses were 30 kg N ha−1, 13 kg P ha−1, and 26 kg K ha−1. Since 1976, fertilization doses have been increased to 90 kg N ha−1, 26 kg P ha−1, and 91 kg K ha−1. The experimental layout was a completely randomized plot design. Each of the three replicate plots per treatment had a size of 4 × 9 m. Detailed information on the chemical and physicochemical properties of the soil in the long-term fertilization experiments can be found in the works by Mercik [44] and Mercik and Stępień [45].
The location of the experiment and the layout of plots are presented in Figure 1. Soil samples from A horizon were collected in different crop rotation systems using a three-block design during the 2022 mid-growing season when winter triticale was grown in plots of variant LEG, and spring barley in the others. For analyses, samples were taken from 10 points in each block plot and averaged by mixing.

2.2. Soil Characteristics

The soil in which the experiment was carried out was classified as Luvisol derived from sandy loam [46]. According to the Köppen–Geiger climate classification [47], the area of soils studied has a warm temperate climate (Cfb). The average annual temperature is 9.3 °C and the annual rainfall is 600 mm. The basic properties of the soil are compiled in Table 1. The samples were collected in 2022, air-dried, ground, and passed through a stainless steel 2 mm sieve. The soil pH was measured potentiometrically in a 1:2.5 suspension of soil and 1 M KCl. CaCO3 content was measured by the CO2 volume method using the Scheibler apparatus. Plant-available elements were measured with Mehlich 3 method [48]. Particle size distribution was analyzed by the sieve and hydrometric method [49], following a pretreatment that involved the removal of organic matter and chemical dispersion with sodium hexametaphosphate. Soil acidity (Hh) was determined in 1 M KCl, and exchangeable base cations were extracted by 1 M NH4Ac and measured by atomic emission spectroscopy (K+, Na+, and Ca2+) and atomic absorption spectroscopy (Mg2+). Cation exchange capacity (CEC) was calculated as a sum of Hh and exchangeable base cations.
The treatments did not affect the basic properties of the soil, except for the SOM content, sorption properties, and plant-available nutrients. In the case of the latter, some differences were observed, but all soils were rich in nutrients. Small differences in the remaining basic properties resulted from soil variability. For this reason, these properties are not discussed in the results, but are presented in Table 1 and included in this section.

2.3. The Content of C and N

Total carbon (TC) and total nitrogen (TN) were determined by dry combustion (Vario Macro Cube elementar analyzer, Elementar Analysensysteme GmbH, Langenselbold, Germany). Total organic carbon (TOC) was determined after digestion with 10% HCl by dry combustion, analogously to TC.

2.4. Fractional Analysis of SOM

A fractional analysis of SOM was performed according to the method recommended by the International Humic Substances Society [50]. Low-molecular compounds, the so-called fulvic fraction (FF), were extracted with 0.05 M H2SO4. The dry soil sample, after being passed through a 2 mm sieve, was treated with 0.05 M H2SO4 in order to obtain a final concentration of 10 mL of liquid per g of sample. After shaking the suspension, the mixture was left overnight, and the supernatant was separated from the residue by centrifugation. This step was repeated three times until the decalcitation was over. The volume of the supernatant was equalized, and the content of TOC was analyzed (FF). Then, the extraction of HA and FA with 0.1 M NaOH from the residue was proceeded with according to the same concentration ratio (10 mL liquid per g sample) until the supernatant was almost colorless. The supernatant was separated from the residue by centrifugation, the volume of the supernatant was equalized, and the content of TOC was analyzed (HA + FA). The defined volume of extract with HA and FA was acidified, and precipitated HA was dissolved using hot 0.02 M NaOH. The volume of dissolved HA was equalized, and the content of TOC was analyzed (HA). The content of FA was calculated according to the following formula: FA = (HA + FA) − HA. All determinations were performed using Enviro TOC + N 147 (Elementar; Langenselbold, Germany). The content of HUM was calculated from the difference between the TOC of the dry sample and the sum of fractions (FF + HA + FA).

2.5. Isolation of HUM

The isolation of HUM was described in our previous publication [51]. Briefly, HA and FA were extracted with NaOH, then the remaining material was digested with a 10% HF-HCl mixture to remove the mineral fraction. Finally, the material was neutralized and dialyzed against distilled water until the Cl− test was negative. Subsequently, the HUM fraction was freeze-dried.

2.6. TC-GC/MS Analysis of Bulk Soil and HUM

For thermochemolysis, about 100 mg of soil and HUM material were inserted into Pasteur pipettes (model ISO 7712, 150 mm, manufacturer DURAN WHEATON KIMBLE, Wertheim, Germany) with tips broken off. About 60 µL Tetramethyl ammonium hydroxide (TMAH) in water (25%) was added to the sample with a microsyringe. Afterwards, the pipette was connected to a second pipette filled with activated coarse charcoal and a small amount of glass wool at the tip. The entire system was flushed with a nitrogen stream and, 5 min after adding TMAH, the sample was heated to 220 °C for 6 min using a hot air gun. After allowing to cool for 5 min, the sample was scratched in a 4 mL vial and both pipettes were rinsed with 1.5 mL each of a mixture dichloromethane/methanol (4:1) in the vial. The vial was placed in an ultrasonic water bath at 35 °C and, after 5 min of ultrasonic treatment, the suspension was allowed to settle for 55 min. For GC-MS, 1 µL from the upper part of the solution was injected into a Thermo Fisher Trace 1300 (Thermo-Fisher Scientific, Waltham, MA, USA) equipped with a 60 m BP5 column (0.25 mm i.d., 0.25 µm coating) at an injector temperature of 300 °C. The carrier gas helium 5.0 was set up with a constant flow of 1 mL min−1. Following split injection up to 45 s (splitless), the split ratio was 1:100 from 45 s up to 90 s and 1:5 from 90 s onward. The temperature program was 5 min at 100 °C, with a subsequent heating rate of 5 K min−1 to 280 °C with a total measurement time of 120 min. The GC was connected to a Thermo Fisher DFS magnetic sector MS. The conditions for mass spectrometric detection in the electron impact mode were 4.7 kV accelerating voltage, 70 eV electron energy, 1.2 kV multiplier voltage, m/z 48–600 mass range, 0.5 s (mass decade)-1 scan rate, and 0.6 s interscan time. Peaks were assigned by comparing spectra with the NIST2017 database using Thermo Xcalibur version 2.2. According to the outcomes of the library searches, the molecules were assigned to three important compound classes of soil organic matter (carbohydrates, lignins, and lipids) for which the proportions of peak areas in the chromatograms were calculated.

2.7. UV-Vis Analysis of HUM

UV–Vis spectra were measured using a Jasco V-770 UV–VIS–NIR spectrophotometer (Jasco-Global, Tokyo, Japan). Absorbance measurements were carried out in the range of 220 to 700 nm at a constant 0.01 mg L−1 concentration of C in HUM solution in DMSO + 6% (v/v) H2SO4 (98% mass). The length of the optical path was 1 cm. Before analysis, HUM solutions were pre-filtered through a syringe filter with a pore size of 0.45 µm to obtain high sample homogeneity. Spectra were recorded at room temperature (25 °C). Based on the absorption spectra obtained, molar absorption coefficients were calculated: ε280, ε660, and mutual absorbance ratios at a specific wavelength: E465:E665, E280:E665, E280:E365, and ΔlogK.

2.8. Fluorescence Spectroscopy of HUM

Fluorescence spectra were recorded on a Hitachi F-7000 spectrophotometer (Hitachi, Tokyo, Japan). Synchronously scanned fluorescence (SSF) spectra were obtained by measuring the fluorescence intensity while simultaneously scanning both excitation and emission wavelengths and maintaining a constant wavelength difference between them: Δλ = λex − λem = 20 nm. The excitation and emission slits of the monochromators were 5 and 10 nm, respectively, and the scanning speed was 240 nm min−1. Three-dimensional fluorescence spectra, analyzed in the form of an excitation–emission matrix (EEM), were scanned at emission wavelengths from 250 to 600 nm by varying the excitation wavelengths from 200 to 550 nm. The width of the slits for the excitation and emission bands was 10 nm and the scanning speed was 1200 nm−1.
Spectral recording was performed at room temperature at a constant 0.01 mg·cm−3 concentration of C in HUM solution in DMSO + 6% (v/v) H2SO4 (98% mass). Before analysis, the HUM solutions were filtered through a syringe filter with a pore size of 0.45 µm. Measurements were carried out at a constant temperature of 25 °C.

2.9. Graphical and Statistical Methods

Statistical analysis was performed by analysis of variance and the Fisher procedure, p  <  0.05, using Statistica Software (version 13, StatSoft Inc., Tulsa, OK, USA, 2011). The results obtained from UV-Vis and fluorescence measurements were processed in MS Excel 2010 and then modified by CorelDRAW Graphics Suite 2021 for Windows Corporate. The EEM spectra were then processed to a higher resolution in QUANTUM GIS v. 3.10 using TIN interpolation. The spectra in individual rasters were smoothed in the SAGA GIS program. The compliance of the actual results with the estimation results was determined to be 99%.

3. Results and Discussion

3.1. The Content of Carbon and Nitrogen and Sorption Properties

Long-term field experiments (LTFEs), often defined as agricultural field experiments with a minimum duration of 20 years, are agricultural studies that provide valuable data [3,4]. Organic fertilization is a common practice in both arable soil and grassland management [52,53,54], which may contribute to the sequestration of C and the mitigation of climate change [26,55,56].
As expected, a 100-year period of organic fertilization resulted in an increase in SOM content in all treatments (Table 2), which is analogous to other long-term experiments [4,25,33,34,43,57]. The results of chemical analyses from 1961 to 1994, as presented by Mercik et al. [58], showed a systematic increase in TOC determined with C-MAT 5500 apparatus (Ströhlein Instruments, Kaarst, Germany) from 0.42% to 0.47% on the CON variant and from 0.53% to 0.74% on the MAN + LEG variant. The results presented by Mercik et al. [59] indicated that the TOC and total N contents increased with the increase in manure rates, but the C:N ratio remained similar. The TOC content increased the most, more than 60%, under the influence of manure fertilization together with the use of a legume (Trifolium pratense L.). A slightly lower increase, by 47%, occurred under the influence of fertilization with manure alone, while the use of legume alone increased TOC by more than 30%. These changes were accompanied by an increase in TN, so the TOC/TN ratio did not change. Changes in sorption capacity were also visible, the value of which increased the most in objects fertilized with manure.

3.2. Fractional Composition of SOM

The impact of long-term fertilization on the dynamics of organic C and total N in soil has been the subject of many studies [26,57], while changes in the composition of HS have rarely been studied [60]. Mi et al. [35] found that, as a result of 4 years of cattle manure application, the share of HA and HUM significantly increased. Our results did not confirm this; in contrast, in the object fertilized with manure, we found a significant reduction in the share of HA, as well as the HA/FA ratio (Table 3). It is also noteworthy that, in the MAN, there was a significant increase in the HUM share compared to LEG and MAN + LEG. Furthermore, despite the lack of significant differences in TOC between fertilized objects (Table 2), the quantity of HUM (g kg−1) increased significantly as a result of manure fertilization (Table 3).

3.3. TC-GC/MS Analysis of Bulk Soil and HUM

Thermochemolysis and gas chromatography/mass spectrometry showed that HUM was enriched in carbohydrates in almost all pairs of soil and HUM (Table 4). For lignins and lipids, there was no consistent trend in differences between soil and HUM. Soil management was reflected by enrichments in carbohydrates and lignins in bulk soil and HUM samples from the treatments MAN, LEG, and MAN + LEG relative to CON. The only exception was the HUM from MAN + LEG, which had the smallest proportion of lignins.
Lipids were particularly enriched in the bulk soil and HUM from CON treatment (Table 4). This relative enrichment of lipids in the bulk soil samples agrees with the larger proportions of lipids in the unfertilized treatment of the “Eternal Rye Cultivation” experiment at Halle/Germany, observed by pyrolysis—[JJ1] field ionization mass spectrometry [61]. The same agreement is true for the enrichment of lignins in treatments with manure. In another long-term experiment in Germany, the “Static Experiment” at Bad Lauchstädt, the manure treated-soil was enriched in lignin dimers, but that treatment also had larger proportions of lipids than the unfertilized soil [62]. This indicates that relatively undecomposed lignin, probably from straw which had been used as bedding material, enters the soil with manure application, causing lignin enrichments. The fate of lipids is not so easy to explain. Their relative increase in unfertilized soil (Halle) [61] or CON (Skierniewice, see Table 4) indicates strong associations with soil minerals, making these lipids more resistant to microbial decomposition than other, non-bound compound classes. This explanation is supported by the proportions of lipid in the CON and MAN pairs of HUM samples relative to the corresponding bulk soil samples (Table 4), and by the quantitatively highest concentrations of extracted lipids in clay-sized fractions of soil [63]. However, that study also reported higher concentrations of fatty acids in farmyard manure treatment relative to NPK in most particle-size fractions and across the entire range of C-chain lengths. Accordingly, lipids constantly enter the SOM with plant residues and remnants of microbial cell walls, explaining their greater abundance under soil management, which tends to increase the SOM level. Our results confirmed that some portion of lipids become strongly bound to soil minerals, especially in the HUM (Table 4), explaining their relatively higher abundance in CON, which tends to deplete the SOM.
The relatively large proportion of carbohydrates in the HUM (Table 4) is consistent with the summarized evidence for carbohydrate enrichments in clay-size fractions [64]. However, plant-derived carbohydrates can also be enriched in specific light fractions that are isolated from soil in sand fractions, confirming our observation of tissue fragments in some of the HUM, supported by the largest proportion of carbohydrate in the HUM under MAN + LEG treatment (Table 4).

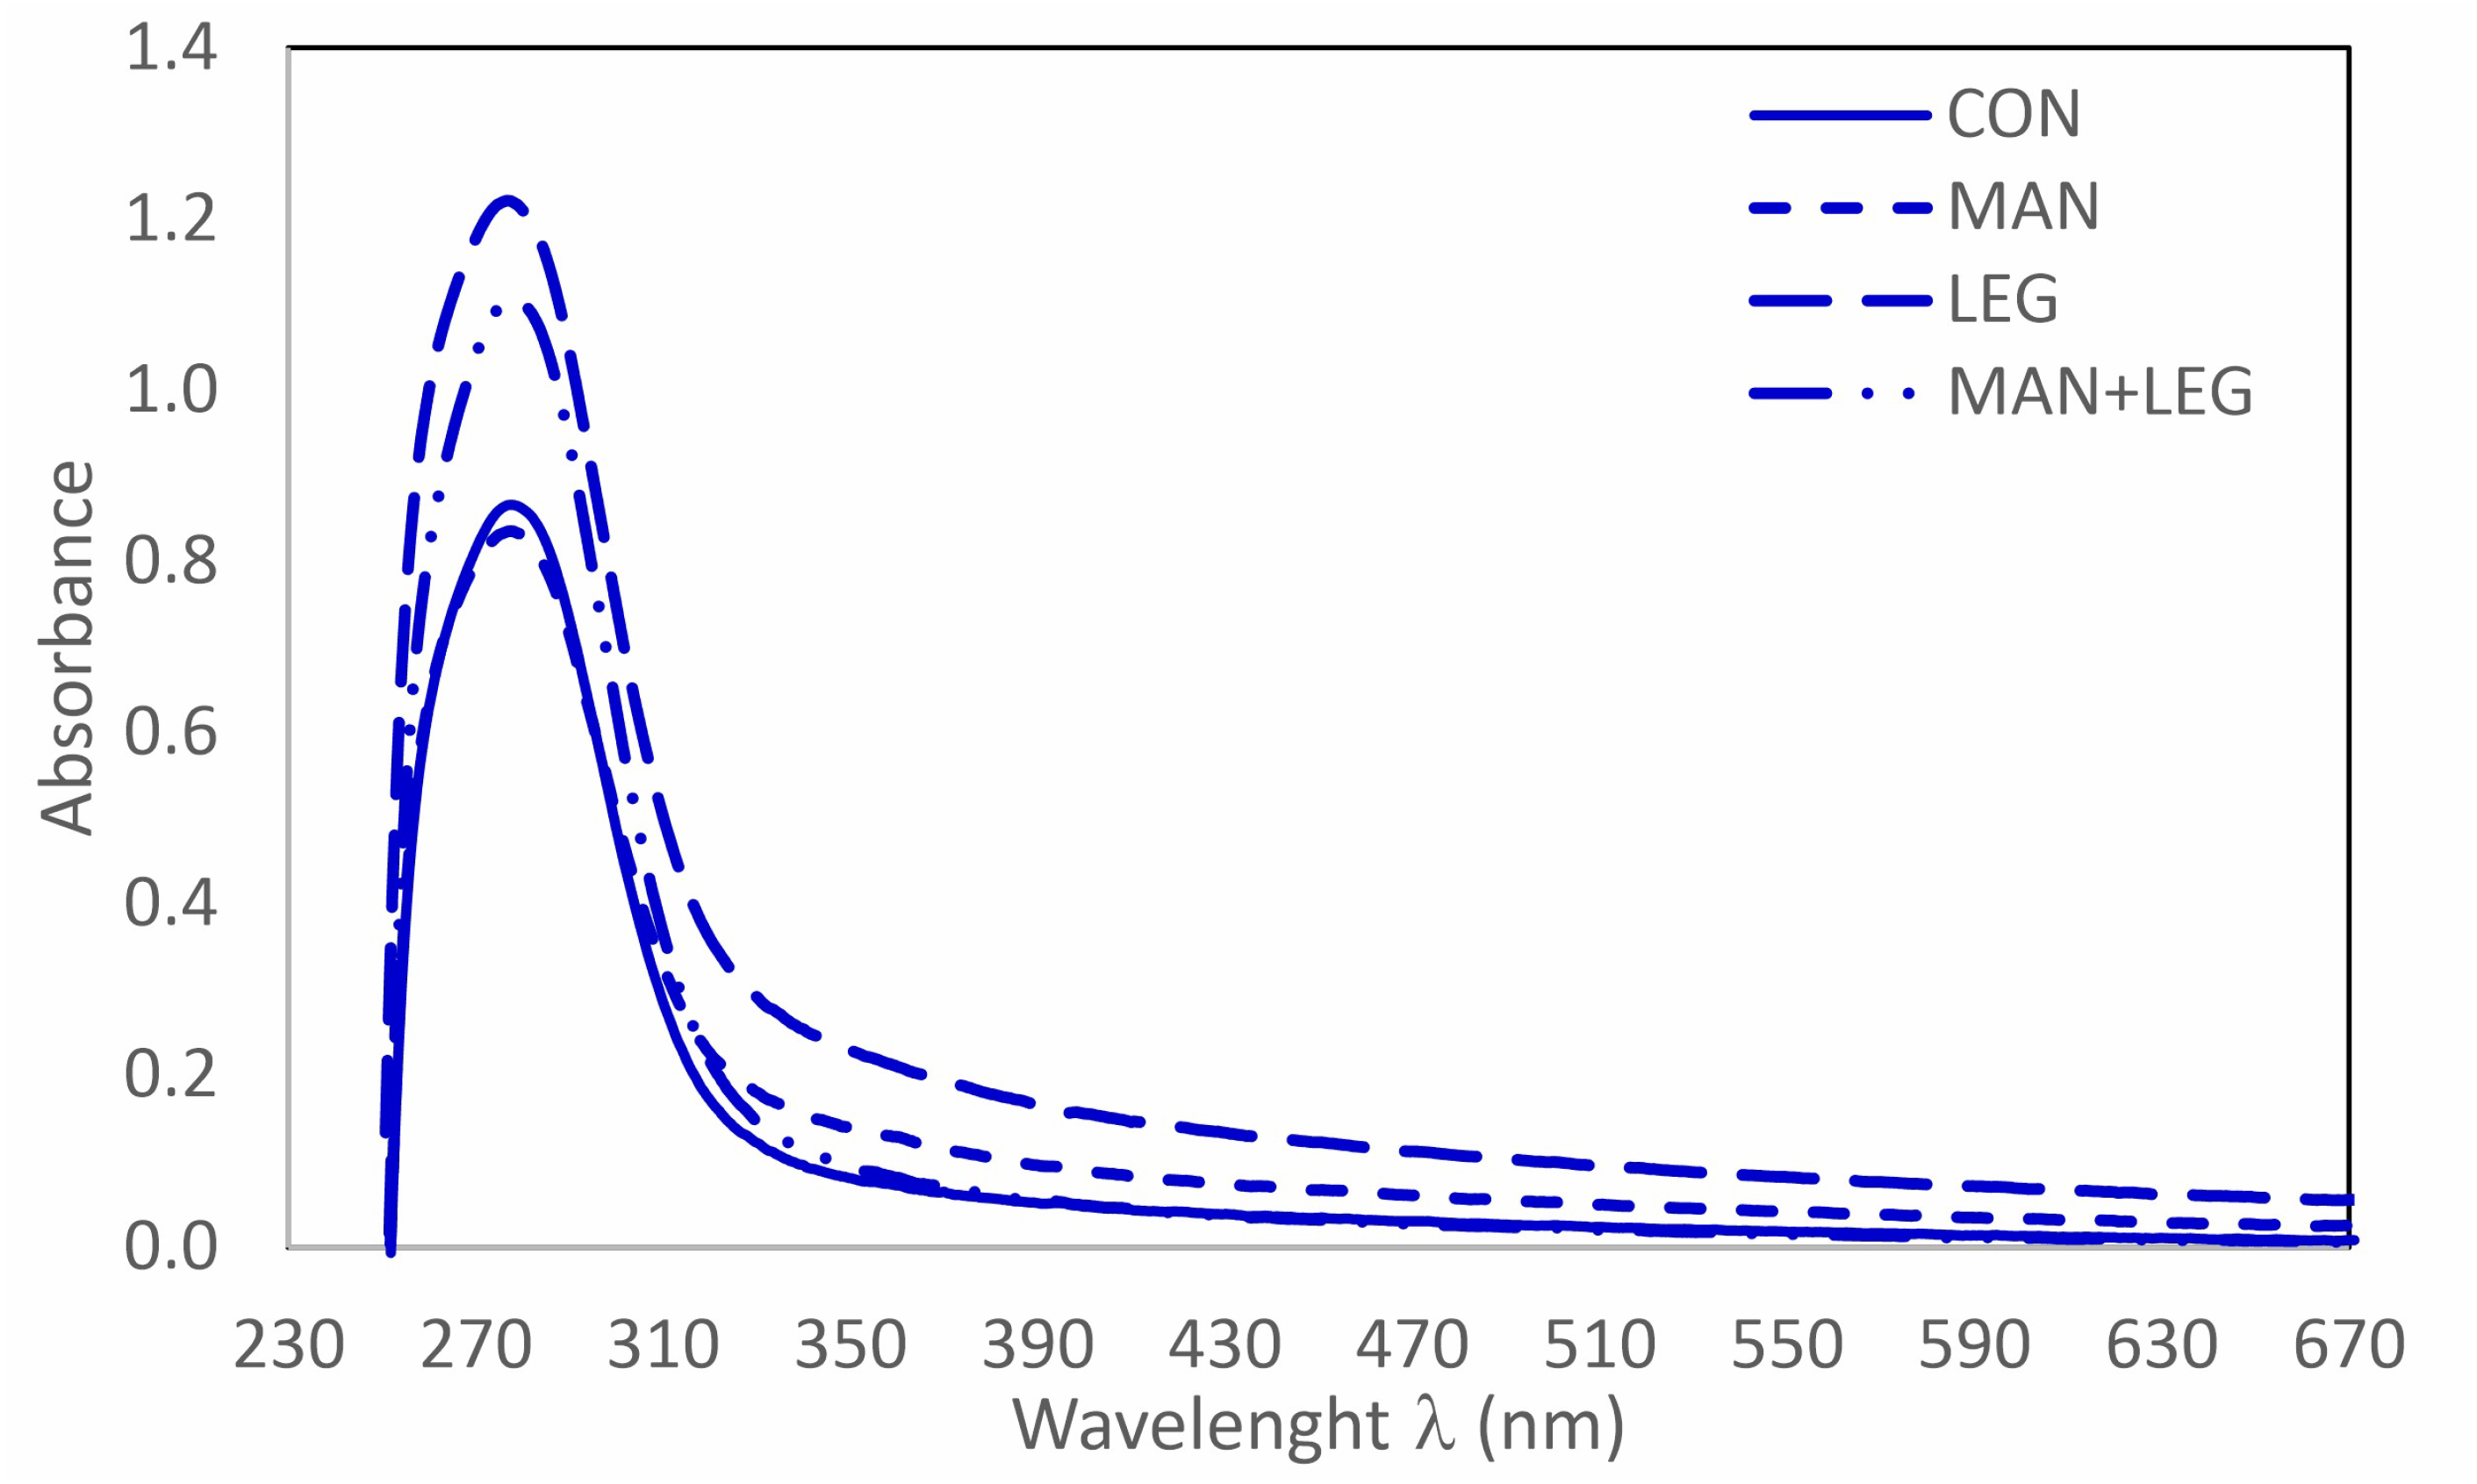
3.4. UV-Vis Analysis of HUM

UV-Vis spectral curves provide information about the presence of characteristic chromophore groups in the structure of humic substances, and the size of their molecules can also be used to obtain information about the progress/intensity of the humification process. The HUM absorption spectra obtained are distinguished by the presence of a specific band in the region of 245–310 nm with a maximum at a wavelength of 280 nm (Figure 2).
Differences in the intensity of the maximum result from the different properties of the HUM themselves, which, in turn, are determined by the properties and method of fertilizing the soil. The use of LEG and MAN + LEG clearly increased the absorbance value at this maximum. However, fertilization with MAN alone did not affect the absorbance value at λ = 280 nm with respect to CON, indicating that legume application was the cause of increased UV-Vis absorbance. It is believed that the main chromophores absorbed in the UV region are aromatic rings with various degrees and types of substitution, including mono and/or polysubstituted phenols and/or various aromatic acids, as well as aliphatic chains [38,65,66]. The high intensity of this maximum for HUM from soils with legume applied may indicate a more intense substitution in the aromatic ring [67], which was confirmed by the higher values of ε280 (Table 5). Clearly, lower values of this coefficient may be caused by mixing into the surface layers of new material that is rich in carbohydrates or groups with protein origin and low in aromatic content.
The complex structure of HUM makes their spectra in the visible range featureless and, therefore, their visible absorbance is more difficult to explain. Some authors suggest that it may be related mainly to extended conjugation in aliphatic and/or polyaromatic structures, as well as to the presence of inter- or intramolecular donor–acceptor complexes [37]. Significant differences in the absorption spectra of the HUM analyzed in the visible region were reflected in the values of the ε665 coefficient (Table 5). The obtained tendency of changes in the value of ε665 (LEG > MAN > CON ≥ MAN + LEG) may be related to the presence of various conjugations in aromatic and/or aliphatic structures.
Absorption coefficients, determined at a specific wavelength, are used to assess the degree of humification and to assess the aliphatic or aromatic nature of a humic substance. The best described coefficient is E465:E665 (ratio of intensity at 465 nm to intensity at 665 nm). The range of values of this coefficient (2.05 to 4.03) indicate the high molecular weight and highly condensed aromatic structure of HUM, as well as the presence of highly humified ingredients. The slightly lower value of this indicator for HUMs isolated from the LEG variant indicates a relatively higher degree of humification and a higher molecular weight, suggesting the advantage of cyclic structures over aliphatic ones.
The value of the E280:E665 coefficient reflects the quantitative ratio of compounds resistant to lignin-type humification to highly humified organic substances. The clearly lower values of this coefficient for HUM isolated from the MAN and LEG variants indicate their relatively greater degree of humification. This is also confirmed by the values of the E280:E365 and ΔlogK coefficients.

3.5. Fluorescence Analysis of HUM

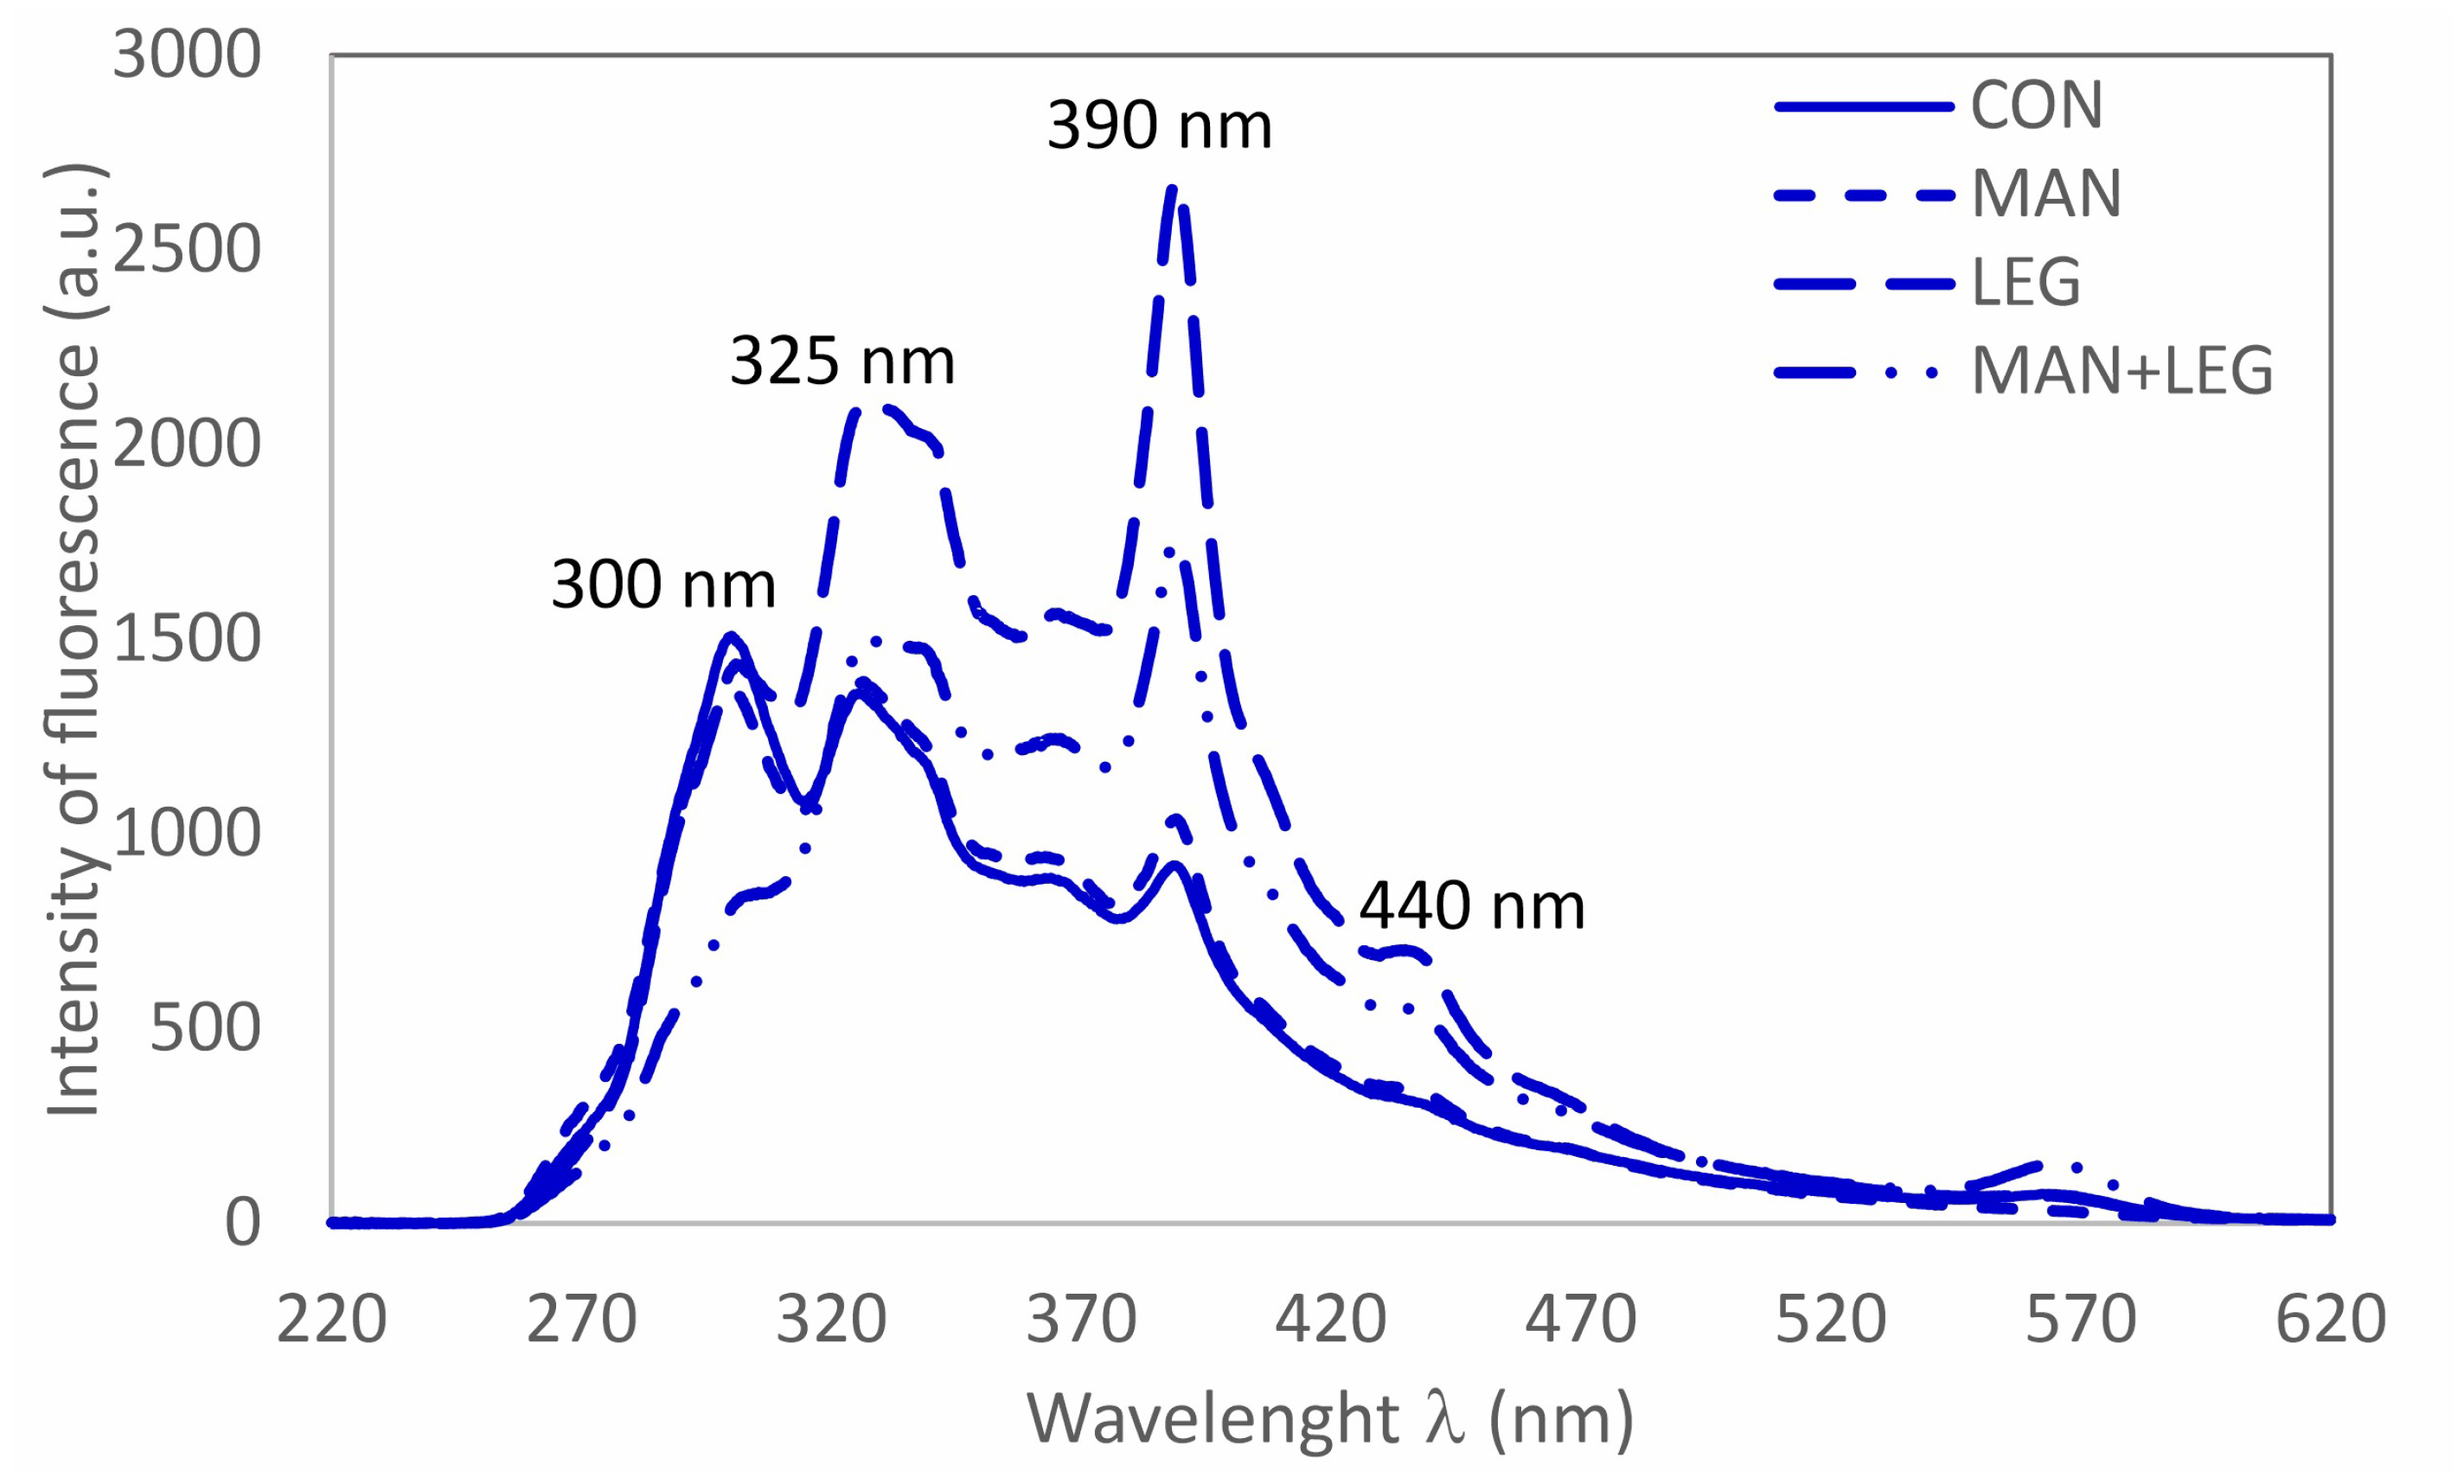
3.5.1. Synchronous Scan Fluorescence Spectra (SSF)
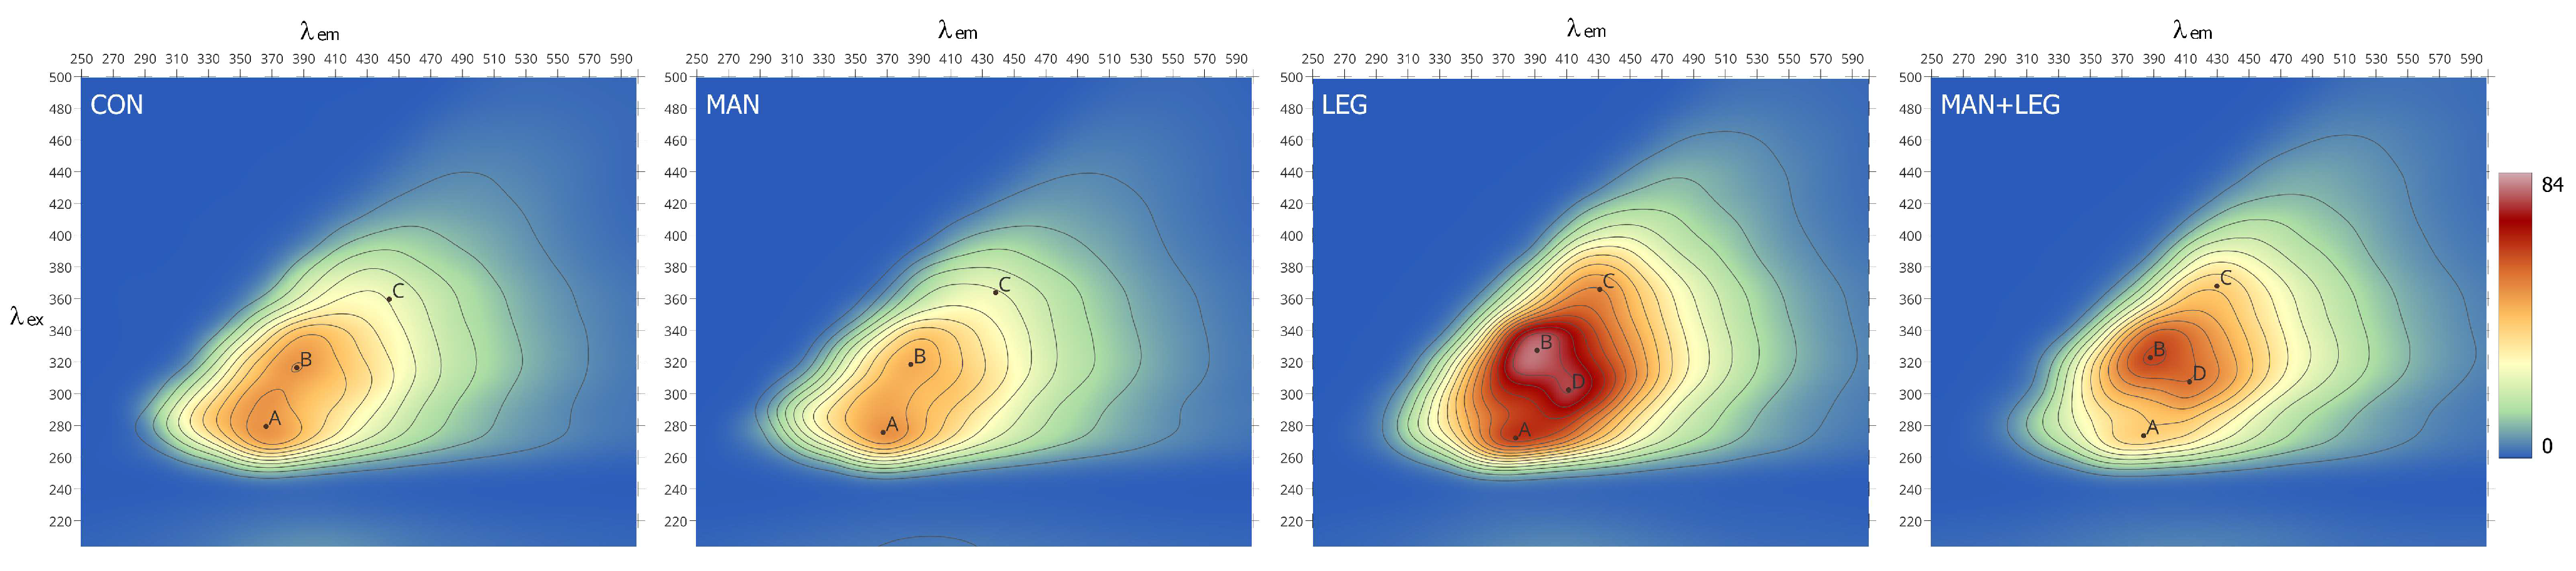
In the case of complex heterogeneous compounds, such as HUM, the synchronous scanning method can selectively increase the intensity of specific fluorescence peaks and improve the resolution of the obtained spectra [68]. The analyzed SSF spectra differ from those obtained for other organic matter fractions (HA, FA, and DOM) of various origins, and indicated a greater variety of specific maxima in the region of 270–470 nm (Figure 3). Additionally, it does not indicate a maximum in the long-wave part of the spectrum, which is characteristic, primarily, of the terrestrial HA fraction [69]. It is believed that the occurrence of a maximum at a wavelength of 450–600 nm is characteristic of various electron-withdrawing substituents such as carbonyl groups, especially carboxyl groups [70,71]. The decrease in fluorescence intensity in this region may indicate the degradation of high molecular weight HA components and the formation of smaller fractions. Additionally, the presence of substituents containing carbonyl, hydroxyl, alkoxy, and amino groups causes a change in fluorescence in the region of longer wavelengths [72].
The occurrence of maximum fluorescence in the wavelength range of 340–370 nm is primarily attributed to structures similar to those present in FA, and these are named the fulvic-like band (FLF). In turn, the maximum at 280–300 nm may be related to the presence of proteins and/or amino acids present in the HUM molecule, which is named the protein-like band (PLF). According to many authors [73,74,75,76], tyrosine- and tryptophan-type amino acids constitute the majority of fluorophores responsible for the fluorescence signal in this region.
The nature of the fertilization used had a significant impact on the polymerization and maturity of the HM, which is reflected in the coefficients calculated from the SSF spectra (Table 6). Among the various possible indices, the percentage of each component responsible for the occurrence of a characteristic band was calculated as the area under the curve characteristic of a given region of the spectrum (total fluorescence intensity). HUM for the LEG and MAN + LEG variants was characterized by a higher share of fulvic-like (%FLF) and humic-like (%HLF) fractions, while the percentage of protein fractions (%PLF) was much lower. This indicates a greater degree of humification of the HUM of LEG and MAN + LEG compared to the others. This is also confirmed by their lower values of the ratio of fluorescence intensity at 325 and 390 nm (wavelengths corresponding to simple fluorophores and more strongly coupled and condensed aromatic nuclei, respectively), used as a potential measure of the degree of humification.

3.5.2. EEM Spectra

Three-dimensional Fl spectra provide a complete representation of the fluorescent features of samples in the form of an excitation–emission matrix (EEM).
The analyzed EEM spectra are similar and are characterized by the presence of a double broad maximum of fluorescence (A and B in Figure 4), identified by a pair of excitation and emission wavelengths (λexem): 270–280/360–390 and 315–330/380–390 nm. Its occurrence is attributed to the presence of simple structural components with high molecular heterogeneity and a low degree of aromatic polycondensation [80]. In the case of LEG and MAN + LEG, a maximum of D stood out in this area (λexem = 300–310/405–415 nm), suggesting the presence of more complex structures, such as conjugated quinones and/or phenols with an increased degree of polycondensation [39,81]. Furthermore, a weak C maximum was identified in the area λexem = 355–370/425–455 nm (Figure 4). Its occurrence can be attributed to the presence of an extended, linearly condensed network of aromatic rings and other systems of unsaturated bonds, capable of a high degree of conjugation in high molecular weight and well-humidified units [80]. Table 7 shows the location of the characteristic fluorescence maxima and their intensity (IFl). Their highest values were demonstrated by HUM from LEG and MAN + LEG samples (except MAN + LEG in area A), while the remaining HUM showed lower values or their absence in area D.
Based on the EEM spectra, the characteristic coefficients commonly used to interpret the spectra were calculated (Table 6). High HIX values are associated with a greater degree of aromaticity in the structure, which indicates the strong humification of the SOM [67,77,78]. The addition of legumes promotes the humification of HUM, as shown by the values of the HIX, f380/f430, and IFl325:IFl390 ratio. The results obtained do not completely coincide with the conclusions drawn from the UV-Vis analysis for MAN + LEG. However, due to the very complex structure of humic substances, the analysis of UV-Vis absorption does not fully meet the criterion of measurement selectivity and specificity, and some indicators calculated to assess the degree of humification may provide divergent information on HS [82].

4. Summary and Conclusions

The research carried out confirmed that appropriate cultivation can significantly increase C resources in the soil, contributing to the mitigation of climate change. This is particularly effective when using legumes supported by fertilization with manure. The use of such fertilization for 100 years may increase TOC by 67%, while the use of legumes alone during such a period may increase TOC by 36%.
Manure supported by legume fertilization (MAN + LEG), which leads to the greatest increase in SOM content, results in a significant increase in the proportion of HA, while only manure fertilization (MAN) increased the HUM content. Both CON and MAN fertilization contributed to a greater abundance of lipids in HUM. However, a high proportion of lipids, which constantly enter the soil with plant residues and remnants of microbial cell walls, was also observed in the CON variant, whereas the soil was depleted in SOM. This can be explained by the fact that lipids strongly bind to soil minerals, contributing to their relatively greater abundance in the HUM.
Long-term different soil management strategies not only altered TOC, but also, surprisingly, the chemical composition of HUM, which is considered to be particularly stable and a long-term sink of atmospheric carbon. Compared to bulk soil, HUM indicated a relatively high proportion of carbohydrates, which is consistent with summarized evidence for carbohydrate enrichment in clay-sized fractions. However, plant-derived carbohydrates can also be enriched in specific light fractions, which confirms our observation of tissue fragments in some of the HUM. The highest proportion of carbohydrate in HUM was found in the soil after MAN + LEG treatment.
The application of legumes (LEG and MAN + LEG) was reflected in the most visible changes in the UV-Vis and fluorescent properties of HUM. They pointed to a greater degree of HUM humification created under the influence of this kind of management and suggested the presence of more complex structures. The obtained results show that fluorescence spectroscopy can be successfully used as a sensitive technique to characterize changes in structures resulting from different soil management strategies; however, further work is necessary for a better understanding of the processes related to SOM transformation.

Author Contributions

Conceptualization: J.W., L.M., P.L. and E.H.; methodology: L.M., P.L., A.K. and E.J.; software: M.P.; formal analysis: L.M. and P.L. writing—original draft preparation: J.W., L.M. and P.L.; writing—review and editing, J.W., L.M., P.L., E.H., E.J., M.P. and A.K. All authors have read and agreed to the published version of the manuscript.

Funding

This work was supported by the EJP SOIL program (NCBR project EJPSOIL/I/78/SOMPACS/2022), the European Social Fund (ESF) and the Ministry of Education, Science and Culture of Mecklenburg-Western Pomerania, within the scope of project WETSCAPES (ESF/14-BM-A55-4790029/16-64160025).

Data Availability Statement

Data are available on request from the authors. The data is not publicly available due to the ongoing project, which will be completed in 2025.

Acknowledgments

The authors would like to thank Wojciech Stępień and Łukasz Uzarowicz for providing access to the facilities of the Experimental Station named after Marian Górski in Skierniewice of the Institute of Agriculture, Warsaw University of Life Sciences SGGW, as well as Pawel Szacki and Przemysław Chłopek for their help in collecting soil samples.

Conflicts of Interest

The authors declare that they have no known competing financial interests or personal relationships that could have appeared to influence the work reported in this paper.

References

  1. Papadis, E.; Tsatsaronis, G. Challenges in the decarbonization of the energy sector. Energy 2020, 205, 118025. [Google Scholar] [CrossRef]
  2. Lal, R. Soil carbon sequestration impacts on global climate change and food security. Science 2004, 304, 1623–1627. [Google Scholar] [CrossRef] [PubMed]
  3. Jenkinson, D.S.; Bradbury, N.J.; Coleman, K. How the Rothamsted Classical Experiments have been used to develop and test models for the turnover of carbon and nitrogen in soil. In Long-Term Experiments in Agricultural and Ecological Sciences; Johnston, A.E., Leigh, R.A., Eds.; CABI International: Wallingford, UK, 1994; pp. 117–138. [Google Scholar]
  4. Johnston, A.E.; Poultion, P.R. The importance of long-term experiments in agriculture: Their management to ensure continued crop production and soil fertility; the Rothamsted experience. Eur. J. Soil Sci. 2018, 69, 113–125. [Google Scholar] [CrossRef] [PubMed]
  5. MacDonald, A.J. (Ed.) Rothamsted Long-Term Experiments: Guide to the Classical and Other Long-Term Experiments, Datasets and Sample Archive. Rothamsted Research. 2018. Available online: http://www.era.rothamsted.ac.uk/eradoc/book/248 (accessed on 20 December 2023).
  6. Bhattacharyya, S.S.; Ros, G.H.; Furtak, K.; Iqbal, H.M.N.; Parra-Saldívar, R. Soil carbon sequestration—An interplay between soil microbial community and soil organic matter dynamics. Sci. Total Environ. 2022, 815, 152928. [Google Scholar] [CrossRef] [PubMed]
  7. Liu, W.-X.; Wei, Y.-X.; Li, R.-C.; Chen, Z.; Wang, H.-D.; Virk, A.L.; Lal, R.; Zhao, X.; Zhang, H.-L. Improving soil aggregates stability and soil organic carbon sequestration by no-till and legume-based crop rotations in the North China Plain. Sci. Total Environ. 2022, 847, 157518. [Google Scholar] [CrossRef] [PubMed]
  8. Pham, D.M.; Katayama, A. Humin as an External Electron Mediator for Microbial Pentachlorophenol Dechlorination: Exploration of Redox Active Structures Influenced by Isolation Methods. Int. J. Environ. Res. Public Health 2018, 15, 2753. [Google Scholar] [CrossRef] [PubMed]
  9. Spaccini, R.; Piccolo, A.; Conte, P.; Haberhauer, G.; Gerzabek, M.H. Increased soil organic carbon sequestration through hydrophobic protection by humic substances. Soil Biol. Biochem. 2002, 34, 1839–1851. [Google Scholar] [CrossRef]
  10. Lal, R. Restoring Soil Quality to Mitigate Soil Degradation. Sustainability 2015, 7, 5875–5895. [Google Scholar] [CrossRef]
  11. Obalum, S.E.; Chibuike, G.U.; Peth, S.; Ouyang, Y. Soil organic matter as sole indicator of soil degradation. Environ. Monit. Assess. 2017, 18, 176. [Google Scholar] [CrossRef]
  12. Hayes, M.H.B.; Swift, R.S. Chapter One—Vindication of humic substances as a key component of organic matter in soil and water. In Advances in Agronomy; Sparks, D.L., Ed.; Elsevier: Amsterdam, The Netherlands, 2020; pp. 1–37. [Google Scholar] [CrossRef]
  13. Wiesmeier, M.; Urbanski, L.; Hobley, E.; Lang, B.; von Lützow, M.; Marin-Spiotta, E.; van Wesemael, B.; Rabot, E.; Ließ, M.; Garcia-Franco, N.; et al. Soil organic carbon storage as a key function of soils—A review of drivers and indicators at various scales. Geoderma 2019, 333, 149–162. [Google Scholar] [CrossRef]
  14. IHSS. 2010. Available online: https://humic-substances.org/what-are-humic-substances-2/ (accessed on 10 December 2023).
  15. Gerke, J. Concepts and Misconceptions of Humic Substances as the Stable Part of Soil Organic Matter: A Review. Agronomy 2018, 8, 76. [Google Scholar] [CrossRef]
  16. Janzen, H. The Future of Humic Substances Research: Preface to a Debate. J. Environ. Qual. 2019, 48, 205–206. [Google Scholar] [CrossRef] [PubMed]
  17. Lehmann, J.; Kleber, M. The contentious nature of soil organic matter. Nature 2015, 528, 60–68. [Google Scholar] [CrossRef]
  18. Olk, D.C.; Bloom, P.R.; De Nobili, M.; Chen, Y.; McKnight, D.M.; Wells, M.J.M.; Weber, J. Using Humic Fractions to Understand Natural Organic Matter Processes in Soil and Water: Selected Studies and Applications. J. Environ. Qual. 2019, 48, 1633–1643. [Google Scholar] [CrossRef]
  19. Schnitzer, M.; Monreal, C.M. Chapter Three—Quo Vadis Soil Organic Matter Research? A Biological Link to the Chemistry of Humification. Adv. Agron. 2011, 113, 143–217. [Google Scholar] [CrossRef]
  20. Cambardella, C.A.; Elliott, E.T. Particulate Soil Organic-Matter Changes across a Grassland Cultivation Sequence. Soil Sci. Soc. Am. J. 1992, 56, 777–783. [Google Scholar] [CrossRef]
  21. Lavallee, J.M.; Soong, J.L.; Cotrufo, M.F. Conceptualizing soil organic matter into particulate and mineral-associated forms to address global change in the 21st century. Glob. Change Biol. 2020, 26, 261–273. [Google Scholar] [CrossRef]
  22. Six, J.; Conant, R.T.; Paul, E.; Paustin, K. Stabilization mechanisms of soil organic matter: Implications for C saturation of soils. Plant Soil 2002, 241, 155–176. [Google Scholar] [CrossRef]
  23. Zaccone, C.; Plaza, C.; Ciavatta, C.; Miano, T.M.; Shotyk, W. Advances in the determination of humification degree in peat since Achard (1786): Applications in geochemical and paleoenvironmental studies. Earth-Sci. Rev. 2018, 185, 163–178. [Google Scholar] [CrossRef]
  24. Cong, R.H.; Xu, M.G.; Wang, X.B.; Zhang, W.J.; Yang, X.Y.; Huang, S.M.; Wang, B.R. An analysis of soil carbon dynamics in long-term soil fertility trials in China. Nutr. Cycl. Agroecosyst. 2012, 93, 201–213. [Google Scholar] [CrossRef]
  25. Goyal, S.; Mishra, M.M.; Hooda, I.S.; Singh, R. Organic matter-microbial biomass relationships in field experiments under tropical conditions: Effects of inorganic fertilization and organic amendments. Soil Biol. Biochem. 1992, 24, 1081–1084. [Google Scholar] [CrossRef]
  26. Li, Z.; Liu, M.; Wu, X.; Han, F.; Zhang, T. Effects of long-term chemical fertilization and organic amendments on dynamics of soil organic C and total N in paddy soil derived from barren land in subtropical China. Soil Tillage Res. 2010, 106, 268–274. [Google Scholar] [CrossRef]
  27. Huang, Q.-H.; Li, D.-M.; Liu, K.-L.; Yu, X.-C.; Ye, H.-C.; Hu, H.-W.; Xu, X.-L.; Wang, S.-L.; Zhou, L.-L.; Duan, Y.-L.; et al. Effects of Long-Term Organic Amendments on Soil Organic Carbon in a Paddy Field: A Case Study on Red Soil. J. Integr. Agric. 2014, 13, 570–576. [Google Scholar] [CrossRef]
  28. Luo, G.; Li, L.; Friman, V.-P.; Guo, J.; Guo, S.; Shen, Q.; Ling, N. Organic amendments increase crop yields by improving microbe-mediated soil functioning of agroecosystems: A meta-analysis. Soil Biol. Biochem. 2018, 124, 105–115. [Google Scholar] [CrossRef]
  29. Tian, K.; Zhao, Y.; Xu, X.; Hai, N.; Huang, B.; Deng, W. Effects of long-term fertilization and residue management on soil organic carbon changes in paddy soils of China: A meta-analysis. Agric. Ecosyst. Environ. 2015, 204, 40–50. [Google Scholar] [CrossRef]
  30. Zhang, W.; Xu, M.; Wang, B.; Wang, X. Soil organic carbon, total nitrogen and grain yields under long-term fertilizations in the upland red soil of southern China. Nutr. Cycl. Agroecosyst. 2009, 84, 59–69. [Google Scholar] [CrossRef]
  31. Huang, Q.R.; Hu, F.; Huang, S.; Li, H.X.; Yuan, Y.H.; Pan, G.X.; Zhang, W.J. Effect of long-term fertilization on organic carbon and nitrogen in a subtropical paddy soil. Pedosphere 2009, 19, 727–734. [Google Scholar] [CrossRef]
  32. Huang, S.; Peng, X.; Huang, Q.; Zhang, W. Soil aggregation and organic carbon fractions affected by long-term fertilization in a red soil of subtropical China. Geoderma 2010, 154, 364–369. [Google Scholar] [CrossRef]
  33. Masto, R.E.; Chhonkar, P.K.; Singh, D.; Patra, A.K. Changes in soil biological and biochemical characteristics in a long-term field trial on a sub-tropical inceptisol. Soil Biol. Biochem. 2006, 38, 1577–1582. [Google Scholar] [CrossRef]
  34. Gong, W.; Yan, X.; Wang, J.; Hu, T.; Gong, Y. Long-term manure and fertilizer effects on soil organic matter fractions and microbes under a wheat-maize cropping system in northern China. Geoderma 2009, 149, 318–324. [Google Scholar] [CrossRef]
  35. Mi, W.; Sun, Y.; Gao, Q.; Liu, M.; Wu, L. Changes in humus carbon fractions in paddy soil given different organic amendments and mineral fertilizers. Soil Tillage Res. 2019, 195, 104421. [Google Scholar] [CrossRef]
  36. Zhang, J.; Wang, J.; An, T.; Wei, D.; Chi, F.; Zhou, B. Effects of long-term fertilization on soil humic acid composition and structure in Black Soil. PLoS ONE 2017, 12, e0186918. [Google Scholar] [CrossRef] [PubMed]
  37. Kumada, K. Chemistry of Soil Organic Matter; Elsevier: Amsterdam, The Netherlands, 1987; p. 241. [Google Scholar]
  38. Chen, J.; Gu, B.; LeBoeuf, E.J.; Pan, H.; Dai, S. Spectroscopic characterization of the structural and functional properties of natural organic matter fractions. Chemosphere 2002, 48, 59–68. [Google Scholar] [CrossRef] [PubMed]
  39. D’Orazio, V.; Miano, T. Fluorescence properties of humic acid interaction products with s-triazine and bipyridilium herbicides and their Cu complexes: A multivariate approach. J. Soils Sediments 2018, 18, 1347–1354. [Google Scholar] [CrossRef]
  40. Řezáčová, V.; Gryndler, M. Fluorescence Spectroscopy: A tool to characterize humic substances in soil colonized by microorganisms? Folia Microbiol. 2006, 51, 215–221. [Google Scholar] [CrossRef] [PubMed]
  41. Senesi, N.; Loffredo, E.; D’Orazio, V.; Brunetti, G.; Miano, T.M.; La Cava, P. Adsorption of pesticides by humic acids from organic amendments and soils. In Humic Substances and Chemical Contaminants; Clapp, C.E., Hayes, M.H.B., Senesi, N., Bloom, P.R., Jardine, P.M., Eds.; SSSA: Madison, WI, USA, 2001; pp. 129–154. [Google Scholar] [CrossRef]
  42. Ferreira, F.P.; Buurman, P.; Macias-Vazquez, I.F.; Otero, X.L.; Boluda, R. Pyrolysis-Gas Chromatography/Mass Spectrometry of Soil Organic Matter Extracted from a Brazilian Mangrove and Spanish Salt Marshes. Soil Sci. Soc. Am. J. 2013, 73, 841–851. [Google Scholar] [CrossRef]
  43. Zhou, P.; Pana, G.X.; Spaccini, R.; Picco, A. Molecular changes in particulate organic matter (POM) in a typical Chinese paddy soil under different long-term fertilizer treatments. Eur. J. Soil Sci. 2010, 61, 231–242. [Google Scholar] [CrossRef]
  44. Mercik, S. Long-term agricultural experiments in Eastern Europe! Long-term continuous experiments in Poland, Bulgaria, Czech Republic and Slovakia. In Long-Term Experiments in Agricultural and Ecological Sciences; Johnston, A.E., Leigh, R.A., Eds.; CABI International: Wallingford, UK, 1994; pp. 211–219. [Google Scholar]
  45. Mercik, S.; Stępien, W. The most important soil properties and yields of plants in 80 years of static fertilizing experiments in Skierniewice. Fragm. Agron. 2005, 22, 189–201. [Google Scholar]
  46. WRB. World Reference Base for Soil Resources. International Soil Classification System for Naming Soils and Creating Legends for Soil Maps, 4th ed.; IUSS Working Group, International Union of Soil Sciences (IUSS): Vienna, Austria, 2022; Volume 4, ISBN 9798986245119. [Google Scholar]
  47. Kottek, M.; Grieser, J.; Beck, C.; Rudolf, B.; Rubel, F. World map of the Köppen-Geiger climate classification updated. Meteorol. Z. 2006, 15, 259–263. [Google Scholar] [CrossRef] [PubMed]
  48. Mehlich, A. Mehlich 3 soil test extractant. A modification o the Mehlich 2 extractant. Commun. Soil Sci. Plant Anal. 1984, 15, 1409–1416. [Google Scholar] [CrossRef]
  49. Pansu, M.; Gautheyrou, J. Handbook of Soil Analysis Mineralogical, Organic and Inorganic Methods; Springer: Berlin/Heidelberg, Germany; New York, NY, USA, 2006; p. 995. [Google Scholar]
  50. Swift, R.S. Organic matter characterization. In Methods of Soil Analysis: Part 3; Sparks, E., Ed.; SSSA Book Series; SSSA: Madison, WI, USA, 1996; Volume 5, pp. 1011–1069. [Google Scholar]
  51. Weber, J.; Jamroz, E.; Kocowicz, A.; Dębicka, M.; Bekier, J.; Ćwieląg-Piasecka, I.; Ukalska-Jaruga, A.; Mielnik, L.; Bejger, R.; Jerzykiewicz, M. Optimized isolation method of humin fraction from mineral soil material. Environ. Geochem. Health 2022, 44, 1289–1298. [Google Scholar] [CrossRef] [PubMed]
  52. van Eekeren, N.; de Boer, H.; Bloem, J.; Schouten, T.; Rutgers, M.; de Goede, R.; Brussaard, L. Soil biological quality of grassland fertilized with adjusted cattle manure slurries in comparison with organic and inorganic fertilizers. Biol. Fertil. Soils 2009, 45, 595–608. [Google Scholar] [CrossRef]
  53. Rayne, N.; Aula, L. Livestock Manure and the Impacts on Soil Health: A Review. Soil Syst. 2020, 4, 64. [Google Scholar] [CrossRef]
  54. Brummelhol, A.; Kuka, K. The Effects of Manure Application and Herbivore Excreta on Plant and Soil Properties of Temperate Grasslands—A Review. Agronomy 2023, 13, 3010. [Google Scholar] [CrossRef]
  55. Duchene, O.; Vian, J.-F.; Celette, F. Intercropping with legume for agroecological cropping systems: Complementarity and facilitation processes and the importance of soil microorganisms. A review. Agric. Ecosyst. Environ. 2017, 240, 148–161. [Google Scholar] [CrossRef]
  56. Veloso, M.G.; Cecagno, D.; Bayer, C. Legume cover crops under no-tillage favor organomineral association in microaggregates and soil C accumulation. Soil Tillage Res. 2019, 190, 139–146. [Google Scholar] [CrossRef]
  57. Wang, H.; Xu, J.; Liu, X.; Zhang, D.; Li, L.; Sheng, L. Effects of long-term application of organic fertilizer on improving organic matter content and retarding acidity in red soil from China. Soil Tillage Res. 2019, 195, 104382. [Google Scholar] [CrossRef]
  58. Mercik, S.; Stepien, W.; Figat, E. Dynamika zmian zawartości węgla i azotu w glebie oraz losy N z nawozów mineralnych i organicznych w statycznych doświadczeniach nawozowych. Zesz. Probl. Postępów Nauk. Rol. 1995, 421, 277–283. [Google Scholar]
  59. Mercik, S.; Rumpel, J.; Stepień, W. Zawartość oraz dynamika rozkładu organicznych związków węgla i azotu w zależności od wieloletniego nawożenia mineralnego i organicznego. Zesz. Probl. Postępów Nauk. Rol. 1999, 467, 9–167. [Google Scholar]
  60. Sharaf, A.; Wu, J.; Fan, W.; Hu, J.; Oppoku-Kwanowaa, Y.; El-Rahim, M.A.; Moussa, A.A. Changes in Soil Humic Acid Composition after Nine Years of Repeated Application of Organic Wastes in Black Soil: A Study Using Solid-State FT-IR and (13C-NMR). Anal. Pol. J. Environ. Stud. 2021, 30, 5211–5223. [Google Scholar] [CrossRef]
  61. Schmidt, L.; Warnstorff, K.; Dörfel, H.; Leinweber, P.; Lange, H.; Merbach, W. The influence of fertilization and rotation on soil organic matter and plant yields in the long-term Eternal Rye trial in Halle (Saale), Germany. J. Plant Nutr. Soil Sci. 2000, 163, 639–648. [Google Scholar] [CrossRef]
  62. Leinweber, P.; Jandl, G.; Eckhardt, K.-U.; Schlichting, A.; Hofmann, D.; Schulten, H.-R. Analytical pyrolysis and soft-ionization mass spectrometry. In Biophysico-Chemical Processes Involving Natural Nonliving Organic Matter in Environmental Systems; Senesi, N., Xing, B., Huang, P.M., Eds.; John Wiley & Sons, Inc.: New York, NY, USA, 2009; pp. 539–588. [Google Scholar]
  63. Jandl, G.; Leinweber, P.; Schulten, H.-R.; Eusterhues, K. The concentrations of fatty acids in organo-mineral particle-size fractions of a Chernozem. Eur. J. Soil Sci. 2004, 55, 459–469. [Google Scholar] [CrossRef]
  64. Schulten, H.R.; Leinweber, P. New insights in organic mineral particles: Composition, properties and models of molecular structure. Biol. Fertil. Soils 2000, 30, 399–432. [Google Scholar] [CrossRef]
  65. Korshin, G.V.; Li, C.-W.; Benjamin, M.M. Monitoring the properties of natural organic matter through UV spectroscopy: A consistent theory. Water Res. 1997, 31, 1787–1795. [Google Scholar] [CrossRef]
  66. Enev, V.; Doskočil, L.; Kubíková, L.; Klučáková, M. The medium-term effect of natural compost on the spectroscopic properties of humic acids of Czech soils. J. Agric. Sci. 2018, 156, 877–887. [Google Scholar] [CrossRef]
  67. Fuentes, M.; Gonzalez-Gaitano, G.; Garcia-Mina, J.M. The usefulness of UV-visible and fluorescence spectroscopies to study the chemical nature of humic substances from soils and composts. Org. Geochem. 2006, 37, 1949–1959. [Google Scholar] [CrossRef]
  68. Senesi, N.; d’Orazio, V. Fluorescence spectroscopy. In Encyclopedia of Soils in the Environment; Hillel, D., Ed.; Academic Press: Amsterdam, The Netherlands, 2005; pp. 35–52. [Google Scholar]
  69. Hur, J.; Lee, D.-H.; Shin, H.-S. Comparison of the structural, spectroscopic, and phenanthrene binding characteristics of humic acids from soils and lake sediments. Org. Geochem. 2009, 40, 1091–1099. [Google Scholar] [CrossRef]
  70. Miano, T.M.; Senesi, N. Synchronous excitation fluorescence spectroscopy applied to soil humic substances chemistry. Sci. Total Environ. 1992, 117–118, 41–51. [Google Scholar] [CrossRef]
  71. Mobed, J.J.; Hemmingsen, S.L.; Autry, J.L.; McGown, L.B. Fluorescence characterization of IHSS humic substances: Total luminescence spectra with absorbance correction. Environ. Sci. Technol. 1996, 30, 3061–3065. [Google Scholar] [CrossRef]
  72. Kwiatkowska-Malina, J. Analysis of humic substances structure in soils after brown coal application with use of 3-D fluorescence spectroscopy. Inż. I Ochr. Sr. 2011, 14, 197–208, (In Polish with English Summary). [Google Scholar]
  73. Coble, P.G.; Del Castillo, C.E.; Avril, B. Distribution and optical properties of CDOM in the Arabian Sea during the 1995 Southwest Monsoon. Deep-Sea Res. Part II Top. Stud. Oceanogr. 1998, 45, 2195–2223. [Google Scholar] [CrossRef]
  74. Baker, A.; Genty, D. Fluorescence wavelength and intensity variations of cave waters. J. Hydrol. 1999, 217, 19–34. [Google Scholar] [CrossRef]
  75. Reynolds, D.M. Rapid and direct determination of tryptophan in water using synchronous fluorescence, spectroscopy. Water Res. 2003, 37, 3055–3060. [Google Scholar] [CrossRef] [PubMed]
  76. Mayer, L.M.; Schick, L.L.; Skorko, K.; Boss, E. Photodissolution of particulate organic matter from sediment. Limnol. Oceanogr. 2006, 51, 1064–1071. [Google Scholar] [CrossRef]
  77. Zsolnay, A.; Baigar, E.; Jimenez, M.; Steinveg, B.; Saccomandi, F. Differentiating with fluorescence spectroscopy the source of dissolved organic matter in soils subjected to drying. Chemosphere 1999, 38, 45–50. [Google Scholar] [CrossRef] [PubMed]
  78. Huguet, A.; Vacher, L.; Relexans, S.; Saubusse, S.; Froidefond, J.M.; Parlanti, E. Properties of fluorescent dissolved organic matter in the Gironde Estuary. Org. Geochem. 2009, 40, 706–719. [Google Scholar] [CrossRef]
  79. McKnight, D.M.; Boyer, E.W.; Westerhoff, P.K.; Doran, P.T.; Kulbe, T.; Andersen, D.T. Spectrofluorometric characterization of dissolved organic matter for indication of precursor organic material and aromaticity. Limnol. Oceanogr. 2001, 46, 38–48. [Google Scholar] [CrossRef]
  80. Plaza, C.; Brunetti, G.; Senesi, N.; Polo, A. Fluorescence characterization of metal ion–humic acid interactions in soils amended with composted municipal solid wastes. Anal. Bioanal. Chem. 2006, 386, 2133–2140. [Google Scholar] [CrossRef]
  81. Senesi, N.; Miano, T.M.; Provenzano, M.R.; Brunetti, G. Characterization, differentiation and classification of humic substances by fluorescence spectroscopy. Soil Sci. 1991, 152, 259–271. [Google Scholar] [CrossRef]
  82. Chen, H.; Zheng, B.; Song, Y.; Qin, Y. Correlation between molecular absorption spectral slope ratios and fluorescence humification indices in characterizing CDOM. Aquat. Sci. 2011, 73, 103–112. [Google Scholar] [CrossRef]
Figure 1. Location and layout of plots of the Skierniewice long-term field experiment.
Agronomy 14 00837 g001
Figure 2. UV-Vis spectra of studied HUM.
Agronomy 14 00837 g002
Figure 3. Synchronous scan fluorescence spectra of HUM.
Agronomy 14 00837 g003
Figure 4. EEM fluorescence spectra of HUM.
Agronomy 14 00837 g004
Table 1. Basic properties of the investigated soil (mean value ± SD).
TreatmentpH
(KCl)
CaCO3
g kg−1
Mehlich 3SandSiltClay
PKMg
(mg kg−1)%
CON7.07 ± 0.01 a9.90 ± 2.4 a149 ± 4.2 a116 ± 3.9 a45 ± 9.6 a76.3 ± 1.2 a18.0 ± 1.0 a5.7 ± 0.6 a
MAN6.79 ± 0.43 a9.20 ± 1.2 a175 ± 6.8 b153 ± 9.3 b67 ± 2.6 b76.7 ± 0.6 a17.0 ± 0.0 a6.3 ± 0.6 ab
LEG6.95 ± 0.03 a8.47 ± 3.7 a157 ± 19.4 ab130 ± 4.5 a67 ± 7.4 b75.3 ± 2.1 a17.0 ± 1.0 a7.7 ± 1.2 b
MAN + LEG6.79 ± 0.03 a7.83 ± 1.2 a149 ± 8.6 a198 13.5 c35 ± 3.4 a75.7 ± 0.6 a18.0 ± 0.0 a6.3 ± 0.6 ab
a,b,c Different letters indicate statistically significant differences (n = 3) according to analysis of variance and the Fisher procedure (p  <  0.05) performed among treatments in each variant separately.
Table 2. Content of TOC and TN and sorption properties (mean value ± SD).
TreatmentTOCTNTOC/TNCa++Mg++K+Na+H+CEC
g kg−1cmol(+) kg−1
CON5.48 ± 1.0 a0.46 ± 0.1 a12.1 ± 1.0 a3.38 ± 0.09 a0.25 ± 0.05 a0.20 ± 0.01 a0.02 ± 0.00 a0.08 ± 0.0 ab3.92 ± 0.06 a
MAN8.12 ± 0.4 bc0.78 ± 0.1 b10.5 ± 1.5 a5.40 ± 0.77 b0.38 ± 0.01 b0.33 ± 0.03 c0.02 ± 0.01 a0.11 ± 0.01 c6.23 ± 0.79 c
LEG7.24 ± 0.5 b0.62 ± 0.2 ab12.5 ± 3.8 a3.60 ± 0.17 a0.42 ± 0.03 b0.24 ± 0.01 b0.01 ± 0.01 a0.07 ± 0.00 a4.35 ± 0.16 ab
MAN + LEG9.21 ± 1.2 c0.81 ± 0.1 b11.4 ± 0.8 a4.08 ± 0.45 a0.23 ± 0.03 a0.41 ± 0.03 d0.02 ± 0.00 a0.09 ± 0.02 bc4.83 ± 0.49 b
TOC—total organic carbon; TN—total nitrogen; CEC—cation exchangeable capacity; TOC/TN was calculated based on values from individual replications and, because of that, is not exactly equal to ratio calculated based on the means of TOC and TN; a,b,c,d Different letters indicate statistically significant differences (n = 3) according to analysis of variance and the Fisher procedure (p  <  0.05) performed among treatments in each variant separately.
Table 3. Fractions of SOM (mean value ± SD).
TreatmentFFHAFAHUMHA/FAHUM
C % in TOCg kg−1
CON15.3 ± 1.7 b53.4 ± 5.1 b7.0 ± 1.8 a24.3 ± 2.6 bc8.1 ± 2.5 b1.32 ± 0.19 a
MAN12.6 ± 0.3 a43.5 ± 2.2 a15.6 ± 2.9 b28.2 ± 1.1 c2.9 ± 0.6 a2.30 ± 0.21 b
LEG13.2 ± 0.2 ab56.6 ± 1.4 b10.1 ± 3.9 ab20.0 ± 2.6 ab6.1 ± 2.0 ab1.51 ± 0.25 a
MAN + LEG12.4 ± 1.7 a60.1 ± 5.0 b11.3 ± 5.2 ab16.2 ± 3.0 a6.4 ± 3.7 ab1.49 ± 0.30 a
FF—low-molecular compounds; HA—humic acids; FA—fulvic acids; HUM—humin. a,b,c Different letters indicate statistically significant differences (n = 3) according to analysis of variance and the Fisher procedure (p  <  0.05).
Table 4. Proportions (% of total peak area in chromatograms) of carbohydrates, lignin building blocks (abbreviated as lignins), and lipids in bulk soil and HUM from treatments of the long-term field experiment.
TreatmentBulk SoilHUM
CarbohydratesLigninsLipidsCarbohydratesLigninsLipids
CON27.816.639.935.815.243.2
MAN33.623.424.638.217.437.5
LEG33.019.930.537.326.524.5
MAN + LEG34.019.038.746.314.432.5
Table 5. UV-Vis coefficients of studied HUM.
TreatmentsE280:E365E280:E665E465:E665ΔlogKε280ε665
CON12.99102.643.640.5586.150.84
MAN6.9232.982.440.4383.012.52
LEG6.0221.832.050.35120.995.54
MAN + LEG14.93152.664.010.63110.200.72
Table 6. Selected fluorescence coefficients calculated from SSF and EEM spectra.
TreatmentsSSF SpectraEEM Spectra
%PLF%FLF%HLFIFl325:IFl390HIXf380/f430f450/f500
CON21.643.78.11.340.831.281.83
MAN20.145.18.21.490.941.401.73
LEG13.052.29.30.791.221.172.04
MAN + LEG10.250.310.60.851.451.141.88
HIX—ratio of fluorescence intensity in the λem ∈ (400 ÷ 470) nm region to fluorescence intensity in the λem∈(320 ÷ 360) nm region of the emission spectra at λex = 254 nm [77]; BIX—calculated from the emission spectra at λex = 310 nm, as the intensity quotient fluorescence at λem = 380 nm and λem = 430 nm, respectively [78]; f450/f500—calculated from the emission spectra at λex = 370 nm, as the fluorescence ratio at λem = 450 nm and λem = 500 nm, respectively [79].
Table 7. Location of characteristic fluorescence maxima and their intensity.
TreatmentsABCD
λexemIFlλexemIFlλexemIFLλexemIFl
CON278/37050.0318/38745.0365/43725.0------
MAN280/36549.8319/38549.0360/45024.5------
LEG277/37963.6326/39079.8366/43050.6306/41275.8
MAN + LEG275/38439.2324/38860.8369/42938.9308/41354.5
Disclaimer/Publisher’s Note: The statements, opinions and data contained in all publications are solely those of the individual author(s) and contributor(s) and not of MDPI and/or the editor(s). MDPI and/or the editor(s) disclaim responsibility for any injury to people or property resulting from any ideas, methods, instructions or products referred to in the content.

