Article

Prediction Models of Growth Characteristics and Yield for Chinese Winter Wheat Based on Machine Learning

1
State Key Laboratory of Eco-Hydraulics in Northwest Arid Region of China, Xi’an University of Technology, Xi’an 710048, China
2
Institute of Water Resources and Hydroelectric Engineering, Xi’an University of Technology, Xi’an 710048, China
3
School of Science, Xi’an University of Technology, Xi’an 710054, China
*
Author to whom correspondence should be addressed.
Agronomy 2024, 14(4), 839; https://doi.org/10.3390/agronomy14040839
Submission received: 6 March 2024 / Revised: 28 March 2024 / Accepted: 13 April 2024 / Published: 17 April 2024
(This article belongs to the Section Precision and Digital Agriculture)

Abstract

:
In order to eliminate the limitations of traditional winter wheat yield prediction methods, the prediction models based on machine learning are used to improve the accuracy of winter wheat yield prediction. In this study, by collecting a large amount of domestic literature about wheat growth characteristics, the irrigation amount, fertilization amount, soil nutrient status, planting density, maximum leaf area index (LAImax), maximum aboveground dry matter accumulation (Dmax) and yield (Y) were chosen to develop the learning models. Using the data of the irrigation amount, fertilization amount, soil nutrient status and planting density as the training set, the regression prediction models (Gaussian process regression mode, linear regression model, regression tree mode and support vector machine model) were used to train and learn the data of the LAImax, Dmax and Y, respectively. The results show that the Gaussian regression model has the best precision compared to the other models. The coefficients of determination (R2) of the learning results of the Gaussian regression model for the LAImax, Dmax and Y are 0.9, 0.93 and 0.86, and the root mean square error (RMSE) is 0.57, 1125.1 and 640.41. Based on the data of the irrigation amount, nitrogen application amount, potassium application amount, phosphorus application amount, organic matter content, total nitrogen content, alkali-hydrolyzable nitrogen content, available phosphorus content, available potassium content and planting density, the method proposed in this paper can reliably predict the LAImax, the Dmax and Y of winter wheat. The results also have certain reference significance for the yield prediction of other crops.

1. Introduction

Crop yield prediction has emerged as a focal point in agricultural research [1], which is affected by meteorological conditions, soil moisture and fertilizer usage [2,3]. Currently, many studies propose methods for predicting crop yield to enhance the forecasting accuracy. The main techniques employed for crop yield prediction include the statistical forecasting methods and the crop growth models. The statistical approaches include multiple linear regression models [4,5], factor analysis linear regression methods [6] and gray prediction models. They are used to obtain the simple functional relationships between the yields and the influencing factors of water and fertilizer [7,8,9]. But these methods usually ignore the environmental and meteorological factors and are thus hard to use widely. In order to consider the effect of photosynthesis, water and fertilizer dynamics and the dry matter distribution on yields, crop growth models are developed, such as AquaCrop [10], DSSAT-CERES-Wheat [11], etc. However, a large number of parameters in the crop growth models need numerous experimental studies to determine them. With the continuous advancement of computer technology, machine learning methods—such as artificial neural networks—have emerged in recent years. The machine learning method can find the relationship between the target variable and its influencing factors from a large amount of data. Therefore, a simple and accurate yield prediction method can be developed based on machine learning and the agricultural data.
Machine learning can directly learn relevant information from input data and estimate yield by establishing an empirical relationship between yield drivers and historical yield records. It has the advantage of not relying on crop parameters and has been used for crop yield prediction. Khanal et al. [12] used linear regression and five machine learning algorithms (random forest, neural network, support vector machine, Gradient Boosting Model and Cubist) to predict corn yield and compared their performance. Leng et al. [13] used the traditional linear regression models and random forest models to predict changes in corn yield in the United States from 1980 to 2010. Zhou et al. [14] explored the potential of nine climate variables, three remote sensing-derived indicators and three machine learning methods (random forest, support vector machine and Least absolute Shrinkage and Selection Operator) in predicting wheat yield based on data from 1582 counties in three wheat growing areas in China from 2002 to 2010. This research showed that the machine learning models had good performances on crop yield prediction in most cases compared to linear regression models.
The major sources of the training set in the machine learning model are the agricultural meteorological and remote sensing data. Based on analyzing the key meteorological factors of sugarcane yield, Shi et al. [15] used the mean values of meteorological data in the entire growth period as the inputs of the machine learning model to develop the sugarcane yield prediction model. Liu et al. [16] used the long time-series data of 47 meteorological factors and 3 spatial factors as the training set and proposed the winter wheat yield prediction model by combining it with the random forest method. Meanwhile, the spectral information obtained from remote sensing satellites or unmanned aerial vehicles can better reflect the growth status of crops, which provides the possibility for large-scale crop yield prediction [17]. Yan et al. [18] analyzed the multispectral remote sensing data of unmanned aerial vehicles and selected five commonly applied vegetation indices as the training set for machine learning to develop the alfalfa yield prediction model. Sun et al. [19] combined the satellite remote sensing data with convolutional neural networks and back-propagation neural networks for the county-level yield prediction of winter wheat. Machine learning models have been widely applied to develop yield prediction methods for different crops. Based on the different spectral preprocessing methods, Ma et al. [20] proposed the estimation model of the leaf area index by the cotton canopy spectral reflectance of unmanned aerial vehicles. Zhou [21] used remote sensing data and machine learning regression models to construct crop yield prediction models for wheat and rice and evaluated the proposed prediction models. But there are still two problems that limit the application of the proposed models. One is the forecasting precision of meteorological data and the preprocessing precision of spectral data [22]. The other one is that the satellite remote sensing data make it hard to reflect the irrigation and fertilization conditions, which means the prediction methods based on the machine learning models cannot be used to decide irrigation and fertilization schedules.
The main goal of this paper is to develop an early prediction method of the leaf area index, the dry matter mass and yield for winter wheat based on the machine learning models, irrigation and fertilization amount, soil quality indicators and planting density. Moreover, the water and nitrogen coupling functions are developed for optimizing the water and nitrogen management in farmland by using the predicted results of the machine learning models. The proposed method can be used to predict yields and provide the irrigation and fertilization schedules simply and accurately from the conditions of the local soil quality and farmland management.

2. Data Sources and Research Methods

2.1. Data Sources

The wheat growth characteristics data in this study including the leaf area index, the dry matter mass and yield were collected from 57 domestic and international studies published from 1996 to 2021. This literature covered 20 locations across the country, excluding Hong Kong, Macao and Taiwan. The meteorological data were sourced exclusively from the China Meteorological Data Network. During the collection of crop growth data, the following principles were adhered to [4]:
(1) Direct Data Acquisition. The data were not only directly obtained in the text of the original literature but were also extracted from the curve graphs in the literature by the GetData Graph Digitizer tool.
(2) Universal Cultivation Technology. Priority was given to the crop growth data obtained under universal cultivation technology, specifically conditions involving fertilization and irrigation. Data from new technology management practices that were not widely adopted were excluded.
(3) Sample Size Considerations: In each region, more than three sets of data samples should be collected. In certain areas with limited research, only one to two sets of data samples were available.
Figure 1 shows the distribution map of the wheat planting areas in the collected literature, primarily concentrated in East China, Central China and Northwest China. The soil texture of these planting regions mainly consisted of loam with consistent fertility. The different varieties of winter wheat were sown with a concentration from early October to mid-November and harvested from June to July in the subsequent year. In most experimental plots, urea (nitrogen fertilizer), K2O (potassium fertilizer) and P2O5 (phosphate fertilizer) served as the foundational fertilizers. Table 1 shows the details on the number of samples and data sources employed for each growth indicator.

2.2. Research Methods

Machine learning is a multidisciplinary field that involves probability theory, statistics, algorithm complexity and other disciplines. Machine learning automatically processes the relationship between input variables and output variables, mining implicit patterns from example samples to ‘learn’ the structural description of this data [78]. Common machine learning algorithms include Gaussian regression, multiple linear regression, BP neural networks, random forests, support vector machines and regression trees.
By consulting a substantial amount of domestic literature on wheat growth characteristics, we collected data on various factors, such as the irrigation amount, fertilizer content (including nitrogen, phosphorus and potassium), soil quality at the experimental site (including organic matter, total nitrogen, alkali-hydrolyzable nitrogen, available phosphorus and available potassium), planting density, maximum leaf area index (LAImax), maximum aboveground dry matter mass (Dmax) and yield (Y). The training set consisted of data on the irrigation amount, fertilizer content, soil quality and planting density. The maximum values of the leaf area index, the aboveground dry matter mass and yield are the response variables. Machine learning techniques were employed to establish relationships between each response variable and the training set. Moreover, MATLAB’s Regression Learner toolbox offers a range of regression models that can automatically train one or more models. By training these models using the training set data and response variables, we obtained the relevant regression prediction models. The specific machine learning parameters are detailed in Table 2. The cross-validation method was used to estimate the predictive accuracy of the final model trained using the full dataset. If k folds were chosen, the training data would be divided into k disjoint sets or folds. For each fold, the out-of-fold observations were used to train the learning model, and the in-fold data were used to assess the model performances and calculate the average test errors over all the folds. This method requires multiple fits but makes efficient use of all the data, so it works well for small datasets.

2.3. Regression Models in Machine Learning

(1) Gaussian regression model
The Gaussian process regression method is a type of Bayesian optimization technique that performs well in addressing regression problems involving small samples, high dimensionality and nonlinearity [79]. In regression tasks, the goal is to establish a mapping relationship between the input and output. By leveraging this mapping, we can predict the new output quantity corresponding to a new input. A Gaussian process can be defined to describe the distribution of a function. The characteristics of the Gaussian process are determined by its mean function (m(x)) and covariance function (k (x, x1)):
m ( x ) = E f ( x )
k ( x , x 1 ) = E ( f ( x ) m ( x ) ) ( f ( x 1 ) m ( x 1 ) )
where x and x1 are the random variables.
GP is defined as:
f ( x ) ~ G P m ( x ) , f ( x , x 1 )
Its mean function usually makes it equal to 0. Considering that the observation target value y contains noise, the general model for establishing the Gaussian process regression problem is:
y = f ( x ) + ε
where x is the n-dimensional random vector, f is the function value, y is the observations contaminated by noise and ε is the independent white Gaussian noise. ε is conformed to the Gaussian distribution, with a mean value of 0 and a variance of σ2, which can be recorded as:
σ ~ N ( 0 , σ 2 )
The prior distribution of the observed value y can be obtained as:
y ~ N ( 0 , k ( x , x 1 ) + σ n 2 I )
Then, the joint prior distribution of the observed value y and the predicted value f is:
y f ~ N 0 , K ( X , X ) + σ 2 I K ( X , X ) K ( X , X ) K ( X , X )
where K ( X , X ) is the test point x self-covariance matrix, and K (X, X) is the covariance matrix of the training points and K (X, X ) = K ( X , X) is the covariance matrix between the test point x and the training set point x.
From this, we can calculate the posterior distribution of the predicted value f as:
f | X , y , x ~ N ( μ , )
μ = K ( x , X ) K ( X , X ) + σ 2 I 1 y
= K ( X , x ) K ( x , X ) ( K ( X , X ) + σ 2 I ) 1 K ( X , x )
where μ is the mean value of the predicted value f* corresponding to the test point x , and is the covariance of the predicted value f* corresponding to the test point x .
(2) Linear regression model
The multiple linear regression model is an equation that describes how the dependent variable y depends on the independent variables x1, x2, …, xm and the error term. The general form of the regression equation is:
y = β 0 + β 1 x 1 + + β m x m + ε
where y is the dependent variable, x1, x2, …, xm are the independent variables and β0, β1, β2, …, βm are the regression coefficients.
Substituting the observation data into the regression equation, the following structural formula is obtained:
y 1 = β 0 + β 1 x 11 + + β m x 1 m + ε 1 y N = β 0 + β 1 x N 1 + + β m x N m + ε N
where ε1, …, εN are N random variables that are independent of each other and obey the same normal distribution N (0, σ).
If Y = y 1 y N , X = 1 1 x 11 x N 1 x 1 m x N m , β = β 0 β m , and ε = ε 1 ε N ,
We get the matrix equation:
Y = X β + ε
Assume β0’, β1’, …, βm’ are the least square estimates of parameters β0, β1, β2, …, βm, respectively; then, the observed value of y can be expressed as:
y k = β 0 + β 1 x k 1 + + β m x k m + e k
where e k is the estimated value of the error (k = 1, 2, …, N).
(3) Regression tree model
The regression tree is a non-parametric model that relies on a tree structure algorithm. When provided with a set of training data, it employs a top–down, divide-and-conquer learning strategy to iteratively split the data into non-overlapping subsets. Once the division process is complete, the mean value of the data samples within each subset serves as the output, allowing us to create a prediction model. The mathematical representation of a regression tree is as follows:
f ( x ) = m = 1 M c m I ( x R m )
where M is the number of subsets in the regression tree model, cm is the corresponding mean of the data samples in each subset and Rm is each divided subset. I ( x R m ) is an indicative function. The value is 1 when x R m ; otherwise, it is 0.
Given a training dataset, it contains N samples (xi, yi), where i = 1, 2, …, N, and each sample has p inputs xi and one output yi. The establishment process of the regression tree model is mainly to find a variable x(j) and a split point s among all the input variables, so the set can be divided into two subsets, and the training error after division is minimal. The process of finding the variable x(j) and the dividing point s is:
min j , s min c 1 x i R 1 ( j , s ) ( y i c 1 ) 2 + min c 2 x i R 2 ( j , s ) ( y i c 2 ) 2
where R1(j, s) is the data samples in subset 1 generated during the partitioning process, R2(j, s) is the data sample in subset 2, c1 is the corresponding mean of the data samples in subset 1 and c2 is the corresponding mean of the data samples in subset 2.
The above division process is repeated until the termination condition is reached, and the establishment of the regression tree model is completed. The termination condition is generally that the number of data samples contained in each subset is less than a certain number.
(4) Support vector machine regression model
The support vector machine (SVM) is a popular machine learning method used for both classification and regression tasks. This algorithm relies on statistical theory, the Vapnik–Chervonenkis dimension (VC dimension) theory and the principle of structural risk minimization. The SVM aims to strike a balance between model complexity and learning capability by seeking an optimal solution based on limited samples. The goal is to achieve the best possible generalization performance. For handling nonlinear and inseparable problems, the SVM employs a kernel function to map data from a low-dimensional space to a high-dimensional space. This transformation facilitates high-dimensional separability.
The basis of the support vector machine is to find the optimal separation hyperplane under linear separability conditions. First, a sample set is given
S = ( x i , y i ) ; i = 1 , , n , x R d , y + 1 , 1
where xi is the data, and yi is the category to which the data belong.
The original problem of the support vector machine can be expressed as:
y i ( ω x i + b ) 1 ξ i ; min ( 1 2 ω 2 ) + C i = 1 n ξ i
where i = 1, …, n. ω is the weight vector; b is the bias vector; ξ is the relaxation factor (ξ ≥ 0); and C is the penalty factor (C > 0), and this parameter can be adjusted to achieve a balance between algorithm complexity and classification accuracy.
The optimal solution to the original problem is obtained by finding the extreme points of the Lagrange function. Referring to the Lagrange multiplier algorithm, the above original problem is transformed into a dual form, expressed as:
max Q ( α ) = 1 2 i , j = 1 n α i α j y i y j ( x i x j ) + i , j = 1 n α i
i , j = 1 n α i y i = 0 0 α C ; i = 1 , , n
where α is the Lagrange multiplier.
For nonlinear inseparable samples, the support vector machine maps the sample (xi, yi) into the high-dimensional feature space guided by the kernel function K (xi, yi) and the nonlinear mapping and implements the inner product operation in the feature space. Therefore, the formula can be expressed as:
max Q ( α ) = 1 2 i , j = 1 n α i α j y i y j K ( x i x j ) + i , j = 1 n α i
i , j = 1 n α i y i = 0 0 α C ; i = 1 , , n

2.4. Data Analysis

The collected data were processed in Excel 2021 and drawn in Origin 2022. We deduced the model parameters with MATLAB 2021 and used the R2, root mean square error (RMSE) and relative error (Re) as the feature evaluation indicators for the error analysis.
The root mean square error (RMSE), relative error (Re) and coefficient of determination (R2) were used for the statistical analyses to investigate the simulation accuracy and applicability of the approximate analytical solutions. The specific expressions are as follows:
R 2 = 1 i = 1 n ( y i Y i ) 2 i = 1 n ( Y i Y ¯ i ) 2
R M S E = 1 n i = 1 n ( y i Y i ) 2
R e = ( Y i y i ) 2 Y i 2 × 100 %
where Y ¯ i is the average of the true values, yi is the predictive value, Yi is the actual value and n is the total number of test samples.

3. Results and Analysis

3.1. Comparison of Predictive Regression Models

The collected training data were used to build the machine learning models by using MATLAB R2020a Regression Learner toolbox for the corresponding maximum leaf area index, maximum dry matter mass and yield, respectively. The learning results from each regression model are shown in Figure 2. It can be seen from Figure 2 that the Gaussian process regression model achieved the highest learning accuracy for the three growth indicators in the four machine regression models. For the maximum leaf area index, the determination coefficients (R2) of the Gaussian regression model, linear regression model, regression tree model and support vector machine regression model were 0.90, 0.79, 0.79 and 0.77, respectively. The root mean square errors (RMSEs) were 0.57, 0.83, 0.83 and 0.86 cm2/cm2, respectively. For the maximum dry matter mass, the determination coefficients (R2) of the four models were 0.93, 0.81, 0.79 and 0.81, respectively. The corresponding RMSE values were 1125.1, 1818.9, 1886.8 and 1823.2 kg/hm2, respectively. For yield, the determination coefficients (R2) of the four models were 0.86, 0.57, 0.71 and 0.78, respectively. The RMSE values were 640.41, 1118.6, 925.91 and 807.97 kg/hm2, respectively.
By the comprehensive comparison of the four regression models, the learning accuracy of the linear regression, regression tree and support vector machine was lower than the Gaussian process regression. Therefore, the Gaussian regression model was recommended as the machine learning model to predict the winter wheat yield.

3.2. Validation of Predictive Regression Models

To validate the learning accuracy of the Gaussian regression model, we selected the experimental data from the studies conducted by Wang et al. [53], Zhao et al. [72] and Qin et al. [80]. The data included the irrigation amount, nitrogen application, potassium application, phosphorus application, organic matter content and total water usage. Moreover, the relevant data such as the nitrogen content, alkaline-hydrolyzable nitrogen content, available phosphorus content, available potassium content and planting density were used as new datasets and input into the Gaussian regression model that had completed its learning phase. The predicted values of the maximum leaf area index, the maximum dry matter mass and yield were used to compare the measured values to discuss the availability of the learning models.
The experiment conducted by Wang et al. [53] took place at the Shandong Practice Base of China Agricultural University, situated in Suo Town, Hengtai County, Shandong Province. The planting model followed the local typical winter wheat–summer corn rotation. In the experimental plot, the soil’s organic matter content at a depth of 0–20 cm was 1.39%. Additionally, the total nitrogen content was 0.93 g/kg, alkali-hydrolyzable nitrogen content was 48 mg/kg, available phosphorus content was 38 mg/kg and available potassium content was 86 mg/kg. The phosphorus application amount was 375 kg/hm2, and the potassium application amount was 128.25 kg/hm2. The experimental site of Zhao et al. [72] was located at the Manas Experimental Station of the Xinjiang Academy of Agricultural Sciences. The planting mode was the long-term continuous cropping of winter wheat. The experimental soil was loam, with an organic matter content of 2.56%, alkali-hydrolyzable nitrogen content of 54.5 mg/kg, available phosphorus content of 9.65 mg/kg and available potassium content of 113 mg/kg, at the depth of 0–20 cm. In the whole growth period, the phosphorus application amount was 26.2 kg/hm2. Additionally, the potassium application amount was 101.3 kg/hm2, and the planting density was 4.1 million plants per hectare. The experiment of Qin et al. [80] was carried out at the Fengqiu National Experimental Station of Agricultural Ecology, Chinese Academy of Sciences, located in Pandian Town, Fengqiu County, Henan Province (114°24′ E, 35°00′ N). The main soil texture in this area was light fluvo-aquic soil developed from the sediments of the Yellow River. At the experimental soil depth of 0–20 cm, the soil organic matter content was 1.02%, the total nitrogen content was 0.57 g/kg, the alkali-hydrolyzable nitrogen content was 45.7 mg/kg, the available phosphorus content was 5.75 mg/kg and the available potassium content was 120 mg/kg. In the whole growth period, the phosphorus application rate was 80 kg/hm2, the potassium application rate was 200 kg/hm2 and the planting density was 225 kg/hm2. The irrigation and nitrogen application amount in the three experimental sites are shown in Table 3. Based on the proposed Gaussian regression model of machine learning, the predicted values of the maximum leaf area index, the maximum dry matter mass and yield were calculated. As shown in Table 3, the errors between the predicted and measured values were analyzed.
Table 3 shows that the test treatments corresponding to the maximum values of each indicator all involved the highest nitrogen application amount. However, it cannot imply that these treatments represent the optimal irrigation and nitrogen application levels. To refine our understanding and determine the optimal amounts of irrigation and fertilization, we further narrowed down the water and nitrogen application amount intervals based on information from each literature source. Moreover, the refined irrigation and nitrogen amounts were input into the learning model to calculate the maximum leaf area index, the maximum dry matter mass and yield. The relationships between the growth index and water–nitrogen levels in the three experimental areas were analyzed by the calculated results. Figure 3 shows the predicted values of the maximum leaf area index, the maximum dry matter mass and yield by the Gaussian regression model and refined water–nitrogen levels.
Figure 3a indicates that the irrigation interval for the maximum predicted value of the leaf area index was between 450 mm and 550 mm, and the nitrogen application interval ranged from 550 kg/hm2 to 650 kg/hm2. Notably, the experiments conducted by Wang et al. [53] demonstrated that the optimal value of the maximum leaf area index occurred in the treatment with an irrigation volume of 473 mm and a nitrogen application rate of 300 kg/hm2. Remarkably, the irrigation volume of 473 mm was in the predicted optimal irrigation interval of 450 mm to 550 mm. However, the nitrogen application rate of 300 kg/hm2 exhibited a slight deviation from the predicted range of 550 kg/hm2 to 650 kg/hm2. Because the maximum leaf area index was observed in the treatment with the highest nitrogen application amount (300 kg/hm2), this discrepancy was caused by the limited number of water–fertilizer coupling treatments in the experiment.
In Figure 3b, the irrigation interval and nitrogen application interval for the maximum predicted value of dry matter mass are from 600 mm to 700 mm and 250 kg/hm2 to 350 kg/hm2, respectively. The experimental results by Zhao et al. [72] were in agreement with the intervals of irrigation and nitrogen application. The optimal value of the maximum dry matter mass was observed in a treatment with the irrigation volume of 700.23 mm and the nitrogen application rate of 270 kg/hm2. The closer the predicted maximum dry matter mass value is to the optimal water and nitrogen interval, the higher the prediction accuracy. In this case, the prediction accuracy for the combination of 700.23 mm irrigation and 270 kg/hm2 nitrogen reached 0.72%, while the combination of 713.16 mm irrigation and 270 kg/hm2 nitrogen achieved an accuracy of 0.64%.
In Figure 3c, the irrigation interval of the predicted maximum yield value is between 400 mm and 600 mm, while the nitrogen application interval is from 210 kg/hm2 to 300 kg/hm2. Notably, the experimental results by Qin et al. [80] demonstrated that the optimal value for maximum yield occurred in the treatment with an irrigation volume of 576.1 mm and a nitrogen application rate of 270 kg/hm2. It precisely matched the predicted optimal water and fertilizer intervals. The Gaussian regression model of machine learning had high accuracy in predicting wheat yield within this optimal water and fertilizer range. Moreover, the deviation in the prediction accuracy for the 642.92 mm irrigation level is attributed to the actual experiment’s conditions. There was less rainfall during that wheat growth season, and a significant amount of precipitation occurred during the grain filling period. The early-stage irrigation was more substantial, but water scarcity during the critical growth period of the winter wheat led to physiological damage. Therefore, the increasing irrigation did not effectively recover yields but resulted in reduced crop productivity.

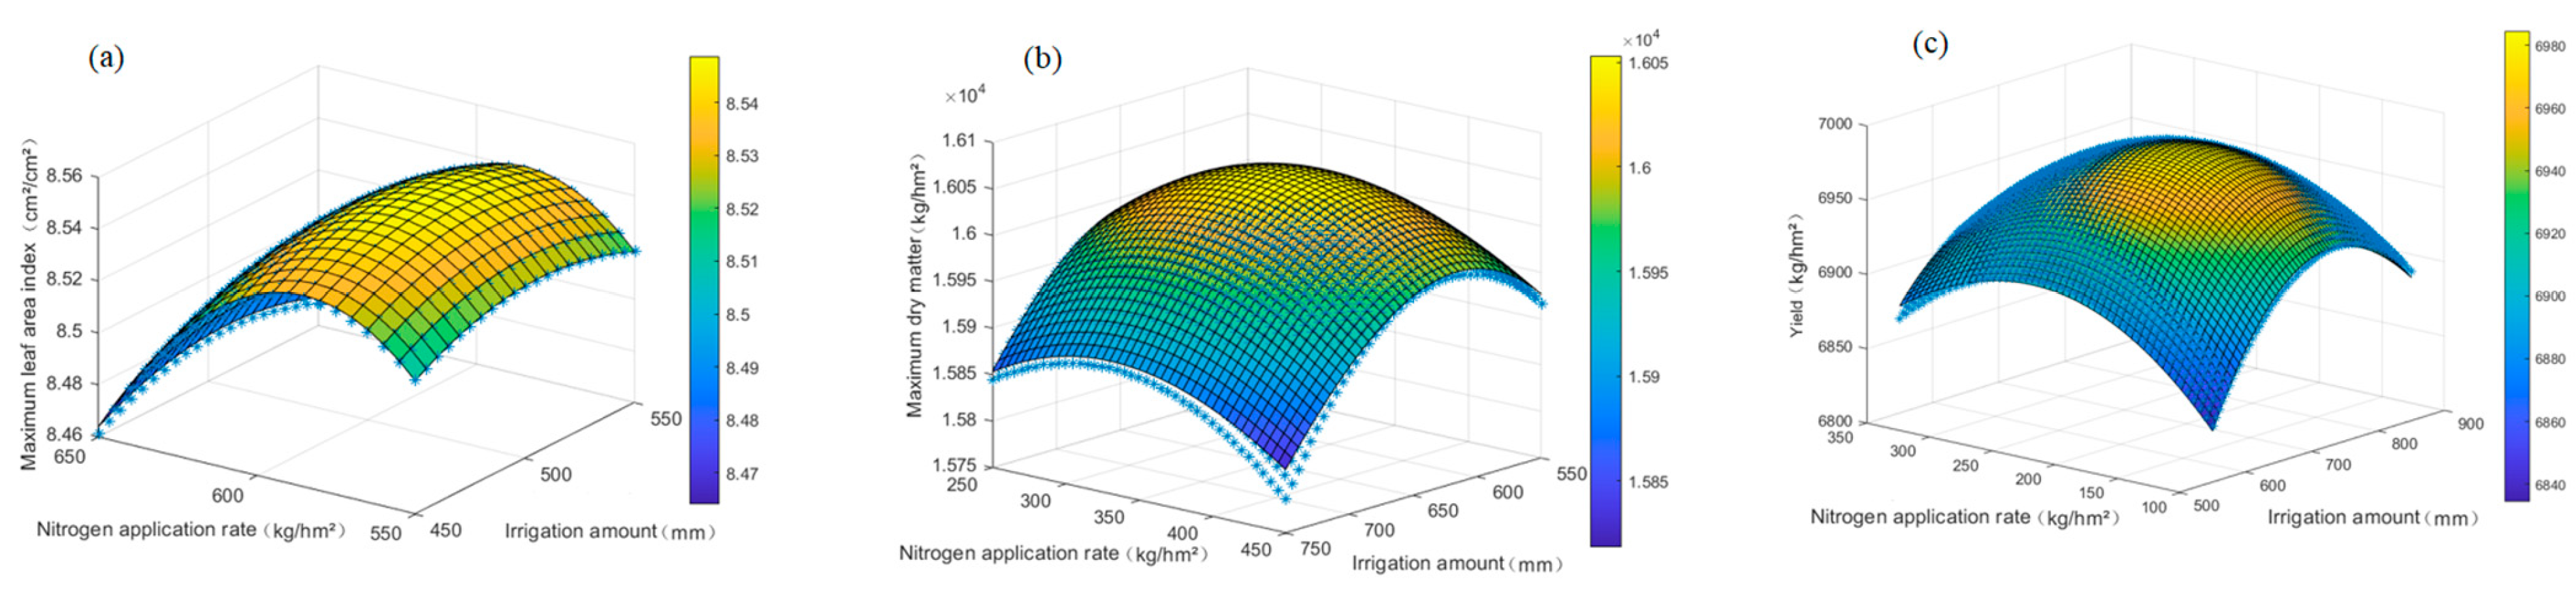
3.3. Construction of Water and Fertilizer Coupling Function

These experimental results are from Wang et al. [53] in Hengtai County, Shandong Province. The soil of the experimental farmland contained 1.39% organic matter content, 0.93 g/kg total nitrogen content, 48 mg/kg alkali-hydrolyzable nitrogen content, 38 mg/kg available phosphorus content and 86 mg/kg available potassium content. Under the winter wheat–summer corn rotation planting mode, the optimal value of the maximum leaf area index was in the irrigation interval of 450 mm to 550 mm and the nitrogen application interval of 550 kg/hm2 to 650 kg/hm2. Based on the maximum leaf area index prediction data obtained by machine learning as shown in Figure 3, we used a quadratic polynomial to develop a model of the water–nitrogen coupling function of the maximum leaf area index in the optimal water and nitrogen range.
L A I m = 1.653 + 4.467 × 10 3 W a + 1.974 × 10 2 N r 4.396 × 10 6 W a 2 2.737 × 10 9 W a N r 1.685 × 10 5 N r 2
where LAIm is the maximum leaf area index predicted value, cm2/cm2; Wa is the irrigation amount, mm; and Nr is the nitrogen application amount, kg/hm2.
Figure 4a shows the predicted value and fitting value of the maximum leaf area index in the optimal water and nitrogen interval. The R2 of the fitting result was 0.9993 and the RMSE was 0.0006572 cm2/cm2. By d L A I m d W a = 0 , and d L A I m d N r = 0 , the optimal irrigation amount and nitrogen application amount for the maximum leaf area index can be calculated, which are 500 mm and 600 kg/hm2, respectively. Based on Equation (26), the corresponding optimal maximum leaf area index is 9.1091 cm2/cm2.
Zhao et al. [72] conducted experiments in the Manas region of Xinjiang, where the soil characteristics include 2.56% organic matter content, 54.5 mg/kg alkali-hydrolyzable nitrogen content, 9.65 mg/kg available phosphorus content and 113 mg/kg available potassium content. These experiments were carried out within a long-term continuous cropping winter wheat planting mode. Remarkably, the optimal value for the maximum dry matter mass agreed precisely with the predicted optimal irrigation interval of 600 mm to 700 mm and the nitrogen application interval of 250 kg/hm2 to 350 kg/hm2. According to the maximum dry matter prediction data obtained by machine learning as shown in Figure 3, the quadratic polynomial of the water–nitrogen coupling function for the maximum dry matter mass in the optimal water and nitrogen range was fitted as follows.
D m = 9426 + 16.86 W a + 6.51 N r 1.264 × 10 2 W a 2 1.779 × 10 3 W a N r 6.899 × 10 3 N r 2
where Dm is the predicted maximum dry matter mass, kg/hm2; Wa is the irrigation amount, mm; and Nr is the nitrogen application amount, kg/hm2.
Figure 4b shows the predicted value and fitting value of the maximum dry matter mass in the optimal water and nitrogen interval. The R2 of the fitting result was 0.9924 and the RMSE was 2.853 kg/hm2. By letting d D m d W a = 0 , and d D m d N r = 0 , the optimal irrigation amount and nitrogen application amount for the maximum dry matter mass can be calculated, which are 600 mm and 350 kg/hm2, respectively. Based on Equation (27), the corresponding optimal maximum dry matter mass is 15,772 kg/hm2.
The experiments by Qin et al. [80] showed that the soil organic matter content in Fengqiu County, Henan Province, was 1.02%, the total nitrogen content was 0.57 g/kg, the alkali-hydrolyzable nitrogen content was 45.7 mg/kg, the available phosphorus content was 5.75 mg/kg and the available potassium content was 120 mg/kg. Under the planting density of 225 kg/hm2, the irrigation interval and nitrogen application interval for an optimal yield of winter wheat were 400~600 mm and 210~300 kg/hm2, respectively. According to the yield prediction data obtained by machine learning in Figure 3, the quadratic polynomial was used to fit the water and nitrogen coupling function of winter wheat yield as follows:
Y = 2159 + 18.07 W a + 35.64 N r 1.351 × 10 2 W a 2 2.08 × 10 2 W a N r 5.023 × 10 2 N r 2
where Y is the production forecast value, kg/hm2; Wa is the irrigation amount, mm; and Nr is the nitrogen application amount, kg/hm2.
Figure 4c shows the predicted value and fitting value of yield in the optimal water and nitrogen interval. The R2 of the fitting result was 0.993 and the RMSE was 6.579 kg/hm2. By letting d Y d W a = 0 and d Y d N r = 0 , the optimal irrigation amount and nitrogen application amount for yield can be calculated, which are 480 mm and 240 kg/hm2, respectively. Based on Equation (28), the corresponding optimal yield is 6677 kg/hm2.

4. Discussion

Because the number of samples available for machine learning training was limited, the sample size of the verification dataset was not enough. Specifically, for predicting the maximum leaf area index of wheat, we lack verification samples that precisely match the optimal irrigation and nitrogen application levels. Consequently, we cannot directly compare the predicted optimal intervals with the verification data. However, the trend observed in the predicted maximum leaf area index agreed well with the trend observed in the measured maximum leaf area index. For yield prediction, we utilized experimental data by Qin et al. [80] during the period from 2011 to 2013 as the validation samples and obtained that the optimal yield was 6677 kg/hm2. To validate this prediction, we consulted the wheat yield data of Henan Province and Xinxiang City during the same period in the Statistical Yearbook as shown in Table 4. The comparison results indicated that the predicted optimal yield closely corresponded to the actual yield data.
The water and fertilizer requirements of the crop growth were varying during the different growth stages. Liu et al. [81] conducted a study on the effects of irrigation frequency and timing on wheat yield and key agronomic traits and found that the jointing stage and heading stage are critical periods for water demand in wheat. Similarly, Wu et al. [82] arrived at the same conclusion in their investigation of irrigation and nitrogen fertilization effects on spring wheat growth and yield in the Hexi Oasis of Gansu Province. However, the total amount of irrigation and fertilization throughout the entire growth period ignored the effects of water and fertilizer requirements on the crop growth in the different growth stages. Thus, the proposed regression models for the maximum leaf area index, the maximum dry matter mass and yield of winter wheat had inherent limitations. To enhance the prediction accuracy, future research should consider the irrigation and nitrogen application of each growth stage as the core variables in the training set.
Numerous factors influence the growth process and yield of winter wheat. In addition to irrigation and nitrogen application, the other critical factors include the planting density [83], plant physiological indicators [43], meteorological conditions [84] and sowing date [85]. Based on the Gaussian process regression transmission model and an unmanned aerial vehicle (UAV) hyperspectral image, Rabi [86] evaluated the growth status and yields of wheat by the leaf area index and canopy chlorophyll content. In this study, the machine learning prediction model used the irrigation and fertilization amount, soil quality indicators and planting density as variables to predict the growth indicators and yield. In future research, it would be beneficial to incorporate these factors as variables in the model.

5. Conclusions

The machine learning prediction method based on Gaussian process regression, linear regression, regression tree and the support vector machine model was used to predict the growth index and yield. The data of the LAImax, the Dmax and yield of wheat were trained and learned to construct the regression prediction model. In order to simplify the prediction, the water and fertilizer coupling functions were proposed. The main conclusions are as follows:
(1) From the accuracy of the prediction model, the Gaussian process regression model had the best prediction effects on the LAImax, the Dmax and yield. The determination coefficient R2 was greater than 0.9. The support vector machine regression model and the regression tree model had similar performances and better predicted results. The linear regression model had the worst learning effects for the training data.
(2) By selecting the two indicators of irrigation and nitrogen application, the values of the LAImax, the Dmax and yield of wheat simulated by the Gaussian regression model were predicted and compared with the measured values. The average relative errors between the predicted and measured values were 7.6%, 12.6% and 8.9%, respectively. The model can be used to guide farmland management, such as irrigation and nitrogen application, and provide the irrigation and fertilization schemes.
(3) Based on the machine learning models, a new idea for obtaining the water and fertilizer coupling functions was proposed for predicting the optimal LAImax, Dmax and yield of winter wheat, exploring the optimal irrigation and fertilization interval and formulating a reasonable irrigation and fertilization scheme.

Author Contributions

Conceptualization, L.S., M.D. and Q.W.; methodology, W.T. and P.L.; software, L.S., M.D. and P.L.; investigation, L.S.; writing—original draft preparation, F.L.; writing—review and editing, F.L.; visualization, F.L.; supervision, L.S. All authors have read and agreed to the published version of the manuscript.

Funding

This research was funded by the Major Science and Technology Projects in Xinjiang Uyghur Autonomous Region (2023A02002-4).

Data Availability Statement

The data are contained within this article.

Conflicts of Interest

The authors declare no conflicts of interest.

References

  1. Zhang, X.J.; Chen, Y.L.; Xiao, G. A review of crop yield prediction based on machine learning. Anhui Agric. Sci. Bull. 2021, 27, 117–119+134. [Google Scholar]
  2. Pei, Z.J.; Liu, J.; Shi, F.M.; Wang, S.; Lu, F.Y. Research process on the eEffect of climate change about the agricultural production of China. Heilongjiang Agric. Sci. 2017, 8, 112–118. [Google Scholar]
  3. Fang, J.Y. Global Ecology: Climate Change and Ecological Responses; Beijing Higher Education Press: Beijing, China, 2000. [Google Scholar]
  4. Su, L.J.; Liu, Y.H.; Wang, Q.J. Rice growth model in China based on growing degree days. Trans. Chin. Soc. Agric. Eng. 2020, 36, 162–174. [Google Scholar]
  5. Su, L.; Wen, T.; Tao, W.; Deng, M.; Yuan, S.; Zeng, S.; Wang, Q. Growth Indexes and Yield Prediction of Summer Maize in China Based on Supervised Machine Learning Method. Agronomy 2023, 13, 132. [Google Scholar] [CrossRef]
  6. Zhang, P.; Chen, Z.M.; Liu, C.W.; Wang, F.Z.; Jiang, H.D.; Gao, P. Method for the prediction of wheat yield components. Trans. Chin. Soc. Agric. Eng. 2020, 36, 78–87. [Google Scholar]
  7. Lin, S.; Deng, M.; Wei, K.; Wang, Q.; Su, L. A new regional cotton growth model based on reference crop evapotranspiration for predicting growth processes. Sci. Rep. 2023, 13, 7368. [Google Scholar] [CrossRef] [PubMed]
  8. Liu, Y.; Su, L.; Wang, Q.; Zhang, J.; Shan, Y.; Deng, M. Chapter Six–Comprehensive and quantitative analysis of growth characteristics of winter wheat in China based on growing degree days. In Advances in Agronomy; Sparks, D.L., Ed.; Academic Press: Cambridge, MA, USA, 2020; Volume 159, pp. 237–273. [Google Scholar]
  9. Wang, K.; Su, L.; Wang, Q. Cotton growth model under drip irrigation with film mulching: A case study of Xinjiang, China. Agron. J. 2021, 113, 2417–2436. [Google Scholar] [CrossRef]
  10. Zhou, Y.X.; Wang, Q.J.; Zhang, J.H.; Tan, S.; He, B. Simulation analysis of the impact of climate change on the yield of winter wheat in Shaanxi Province based on the AquaCrop model. Res. Soil Water Conserv. 2018, 25, 357–364. [Google Scholar]
  11. Yao, N.; Zhou, Y.G.; Song, L.B.; Liu, J.; Li, Y.; Wu, S.F.; Feng, H.; He, J.Q. Parameter estimation and verification of DSSAT-CERES-Wheat model for simulation of growth and development of winter wheat under water stresses at different growth stages. Trans. Chin. Soc. Agric. Eng. 2015, 31, 138–150. [Google Scholar]
  12. Khanal, S.; Fulton, J.; Klopfenstein, A.; Douridas, N.; Shearer, S. Integration of high resolution remotely sensed data and machine learning techniques for spatial prediction of soil properties and corn yield. Comput. Electron. Agric. 2018, 153, 213–225. [Google Scholar] [CrossRef]
  13. Leng, G.; Hall, J.W. Predicting spatial and temporal variability in crop yields: An inter-comparison of machine learning, regression and process-based models. Environ. Res. Lett. 2020, 15, 044027. [Google Scholar] [CrossRef] [PubMed]
  14. Zhou, W.; Liu, Y.; Ata-Ul-Karim, S.T.; Ge, Q.; Li, X.; Xiao, J. Integrating climate and satellite remote sensing data for predicting county-level wheat yield in China using machine learning methods. Int. J. Appl. Earth Obs. Geoinf. 2022, 111, 102861. [Google Scholar] [CrossRef]
  15. Shi, J.; Huang, W.; Fan, X.; Li, X.; Lu, Y.; Jiang, Z.; Wang, Z.; Luo, W.; Zhang, M. Yield Prediction Models in Guangxi Sugarcane Planting Regions Based on Machine Learning Methods. Smart Agric. 2023, 5, 82–92. [Google Scholar]
  16. Liu, J.M.; He, X.T.; Wang, P.X.; Huang, J.X. Early prediction of winter wheat yield with long time series meteorological data and random forest method. Trans. Chin. Soc. Agric. Eng. 2019, 35, 158–166. [Google Scholar]
  17. Li, L.; Wang, B.; Feng, P.; Wang, H.; He, Q.; Wang, Y.; Liu, D.L.; Li, Y.; He, J.; Feng, H.; et al. Crop yield forecasting and associated optimum lead time analysis based on multi-source environmental data across China. Agric. For. Meteorol. 2021, 308–309, 108558. [Google Scholar] [CrossRef]
  18. Yan, H.J.; Zhuo, Y.; Li, M.N.; Wang, Y.L.; Guo, H.; Wang, J.J.; Li, C.S.; Ding, F. Alfalfa yield prediction using machine learning and UAV multispectral remote sensing. Trans. Chin. Soc. Agric. Eng. 2022, 38, 64–71. [Google Scholar]
  19. Sun, S.J.; Wu, M.X.; Zhuang, L.W.; He, Y.B.; Li, X. Forecasting winter wheat yield at county level using CNN and BP neural networks. Trans. Chin. Soc. Agric. Eng. 2022, 38, 151–160. [Google Scholar]
  20. Ma, Y.R.; Lyu, X.; Yi, X.; Ma, L.L.; Qi, Y.Q.; Hou, T.Y.; Zhang, Z. Monitoring of cotton leaf area index using machine learning. Trans. Chin. Soc. Agric. Eng. 2021, 37, 152–162. [Google Scholar]
  21. Zhou, Q.; Ismaeel, A. Integration of maximum crop response with machine learning regression model to timely estimate crop yield. Geo-Spat. Inf. Sci. 2021, 24, 474–483. [Google Scholar] [CrossRef]
  22. Zhao, J.L.; Zhang, X.Y.; Li, Y. Hyperspectral Remote Sensing of Crop Information Based on Machine Learning Algorithm: State of the Art and Beyond. Chin. J. Agrometeorol. 2023, 44, 1057–1071. [Google Scholar]
  23. Teng, K.K. Effects of sowing quantity and additional quantity of nitrogen fertilizer on growth and development, yield and quality of wheat. J. Anhui Agric. 2012, 40, 11980–11983+12062. [Google Scholar]
  24. Cai, D.Y.; Zhou, L.L.; Gu, T.; Yan, H.J. Yield and nitrogen utilization of winter wheat under different nitrogen application frequencies with sprinkler Irrigation system. Agric. Mach. Newsp. 2018, 49, 278–286. [Google Scholar]
  25. Xue, B.; Li, X.; Yan, H.J. Effects of different irrigation and fertilization amount on winter wheat yield under center pivot irrigation system. Water Sav. Irrig. 2016, 8, 33–37. [Google Scholar]
  26. Chen, S.Y.; Zhang, X.Y.; Mao, R.Z.; Wang, Y.M.; Sun, H.Y. Effect of sowing date and rate on canopy intercepted photo-synthetically active radiation and yield of winter wheat. Chin. J. Eco-Agric. 2009, 17, 681–685. [Google Scholar] [CrossRef]
  27. Wang, Z.Y.; Bai, Y.H.; Wang, L.; Wang, H.; Cheng, M.F. Effects of nitrogen rates on grain yield and biological characteristies of winter wheat. Chin. Soil Fertil. 2011, 4, 22–25. [Google Scholar]
  28. Jiao, Y.-P.; Wang, F.-T.; Wu, J.; Li, Y.-X.; Tan, H.-B. Effects of drip irrigation and micro-sprinkler irrigation of hoses on growth and yield of winter wheat. J. Hebei Agric. Sci. 2017, 21, 17–22. [Google Scholar]
  29. Zhai, Y.L.; Wei, Y.H.; Zhang, H.L.; Chen, F. Effect of tillage and seeding methods on grain filling and yield of winter wheat. Agric. Res. Arid Areas 2017, 35, 211–216. [Google Scholar]
  30. Liu, L.P.; Hu, H.H.; Li, R.Q.; Li, H.L.; Chang, C.L.; Li, Y.M. Effects of spacing pattern and planting density on population quality and grain yield of a winter wheat cultivar Henong822. Acta Agric. Sin. 2008, 23, 125–131. [Google Scholar]
  31. Li, S.-J.; Chen, J.-K.; Chen, F.; Li, L.; Zhang, H.-L. Characteristics of growth and development of winter wheat under Zero-tillage in North China Plain. Acta Agron. Sin. 2008, 34, 290–296. [Google Scholar] [CrossRef]
  32. Wang, W.P.; Zhou, Y.F.; Li, Y.S.; Han, J.L. Studies on effects of irrigation systems in spring on winter wheat in eastem area of Hebei. Chin. Agric. Sci. Bull. 2005, 21, 336–339. [Google Scholar]
  33. Wu, Z.D.; Wang, Q.J. Effects of stage water shortage on water consumption and leaf area index of winter wheat. Trans. Chin. Soc. Agric. Eng. 2010, 26, 63–68. [Google Scholar] [CrossRef]
  34. Dong, W.-X.; Chen, S.-Y.; Hu, C.-S.; Yin, C.-M. The effect of minimum tillage and no-tillage on growth and yield of winter wheat. North China Agric. J. 2007, 2, 141–144. [Google Scholar]
  35. Liu, B.H.; Su, Y.H.; Wang, X.X.; Zhang, G.Z.; Chen, D.M.; Ma, Y.A.; Li, Y.M. Effects of planting density on the main agronomic traits and yield of winter wheat Hanmai No. 13. J. Hebei Agric. Sci. 2014, 18, 13–17. [Google Scholar]
  36. Lv, L.H.; Li, Q.; Dong, Z.Q.; Zhang, L.H.; Liang, S.B.; Jia, X.L.; Yao, H.P. Effects of different irrigation methods and amount on rootand canopy structure of winter wheat. J. Triticeae Crops 2014, 34, 1537–1544. [Google Scholar]
  37. Sun, H.Y.; Zhang, Y.Q.; Zhang, X.Y.; Mao, X.S.; Pei, D.; Gao, L.J. Effects of water stress on growth and development of winter wheat in the north China plains. North China Agric. J. 2003, 18, 23–26. [Google Scholar]
  38. Wang, S.J.; Kang, S.Z.; Li, T. Suitable water deficit mode for winter wheat basing objective of water saving as well as high yield and quality. Trans. Chin. Soc. Agric. Eng. 2015, 31, 111–118. [Google Scholar]
  39. Wu, Z.D.; Wang, Q.J. Field study on impacts of soil water-salt distribution and winter wheat yield by different saline water combination irrigations. Trans. Chin. Soc. Agric. Eng. 2007, 11, 71–76. [Google Scholar]
  40. Liu, W.D.; Chen, X.Y.; Yin, J.; Du, P.X. Effect of sowing date and planting density on population trait and grain yield of winter wheat cultivar Yumai 49-198. J. Triticeae Crops 2009, 29, 464–469. [Google Scholar]
  41. Miao, Y.F.; Li, Y.J.; Fu, G.Z.; Han, R.Y.; Ma, Q.H.; Shi, G.A. Study on the effect of different nitrogen and potassium ratio for winter wheat production increase. Tritical Crops 1998, 2, 40–43. [Google Scholar]
  42. Wu, J.Z.; Huang, M.; Li, Y.J.; Chen, M.C.; Yao, Y.Q.; Guo, D.Y.; Huang, H.X. Effects of different tillage systems on the photosynthesis funetions grain yield and WUE in winter wheat. Agric. Res. Arid Areas 2008, 26, 17–21. [Google Scholar]
  43. Xue, Z.W.; Dong, J.H.; Liu, G.T.; Guan, L.; Hou, J.H.; Yang, C.L. The effects of plant growth regulators on the factors of wheat output and output constituent. Agric. Technol. 2018, 38, 1–3. [Google Scholar]
  44. Sheng, K.; Zhang, L.; Guo, Y.; Zhao, J.; Yang, L.; Ma, H. Effects of row spacing on population quality and grain yield of winter wheat cultivar Xinmai-26. J. Henan Agric. Sci. 2015, 44, 26–30. [Google Scholar]
  45. Gao, Y.; Qiu, X.Q.; Gong, W.J.; Duan, A.-W.; Wang, J.L.; Meng, Z.J.; Sun, J.S. Effects of soil moisture before sowing on growth and yield of winter wheat. J. Irrig. Drain. 2012, 31, 17–20. [Google Scholar]
  46. Li, Y.J.; Hu, T.L.; Zhang, S.M.; Han, H.L.; Qi, X. Studies of the application techniques of nitrogen and potassium fertilizer in high yield and efficient winter wheat culture. J. Luoyang Agric. Coll. 1996, 4, 11–15. [Google Scholar]
  47. Liu, H.B.; Wang, L.; Wang, Y.F.; Xi, L. Prediction method of wheat yield in Henan Province based on PSO-SVR model. Jiangsu Agric. Sci. 2023, 51, 157–163. [Google Scholar]
  48. Cao, H.X.; Dong, Y.H.; Wang, X.Q.; Xu, J.F.; Gao, L.Z. Studies on dynanicsi mulation models of optimum leaf area Index of wheat under different melding levels. J. Triticeae Crops 2006, 26, 128–131+139. [Google Scholar]
  49. Zhang, J.H.; Liu, J.L.; Lv, F.; Li, H.X. Effect of nitrogen application on accumulation and transportation of matter and nitrogen in above-ground organs of wheat in Rice-wheat rotation area. J. Triticeae Crops 2009, 29, 892–896. [Google Scholar]
  50. Li, D.S.; Wen, M.X.; Cai, J.H.; Qu, C.X.; Chen, A.D. Effect of sowing date and the combination of planting ensity and nitrogen application on yield and dry matter accumulation of Zhenmai 10. J. Triticeae Crops 2015, 35, 1426–1432. [Google Scholar]
  51. Wei, G.F.; Liu, Y.g.; Jiang, W.; Zhang, H.S.; Lin, Q.; Zhao, C.X.; Zhang, Y.M. The impact of different drip irrigation on the dry material and yield of winter wheat. J. Irrig. Drain. 2013, 32, 67–70+99. [Google Scholar]
  52. Wang, C.Y.; Dai, X.L.; Shi, Y.H.; Cao, Q.; Men, H.W.; He, M.R. Effects of leaf area index on photosynthesis and yield of winter wheat after anthesis. Plant Nutr. Fertil. Sci. 2012, 18, 27–34. [Google Scholar]
  53. Wang, X.F.; Wu, W.L.; Pan, Z.Y.; Chen, S.F.; Liu, G.D.; Xia, X.F. Efflects of various water and nitrogen managem ents on grow th of winter wheat and water use efficiency. J. Agro-Environ. Sci. 2007, 26, 741–745. [Google Scholar]
  54. Shi, X.F.; Qiu, S.Y.; Shi, Z.L.; Xie, F.L.; Gao, W.; Song, L.H. Effect of sowing date and sowing amount on population traitsand yield of winter wheat cultivar Yaomai 16. J. Triticeae Crops 2017, 37, 357–365. [Google Scholar]
  55. Ding, J.J.; Li, L.; Wang, X.Y. The impact of water and fertilizer on winter wheat growth and yield. Soil Water Conserv. Sci. Technol. Shanxi 2014, 4, 12–14. [Google Scholar]
  56. Xue, L.Z.; Sun, M.; Gao, Z.Q.; Yan, R.A.; Lei, M.M.; Yang, Z.P. Effeets of sowing date and rate on soil water storage and dry weight accumulation and grain yield in land wheat. J. Shanxi Agric. Univ. (Nat. Sci. Ed.) 2017, 37, 547–552+556. [Google Scholar]
  57. Yang, J.J.; Cai, H.J.; Wang, J.; Wang, S.H. Effects of limited irrigation on physiological characteristics and WUE of winter wheat. J. Irrig. Drain. 2009, 28, 52–55. [Google Scholar]
  58. Shen, X.J.; Sun, J.S.; Liu, Z.G.; Zhang, J.P.; Liu, X.F. Effects of low irrigation limits on yield and grain quality of winter wheat. Trans. Chin. Soc. Agric. Eng. 2010, 26, 58–65. [Google Scholar]
  59. Qi, L.-H.; Dang, T.-H.; Chen, L. The water use characteristics of winter wheat and response to fertilization on dry-land of loess plateau. Res. Soil Water Conserv. 2009, 16, 105–109. [Google Scholar]
  60. Hu, H.W.; Cai, H.J.; Wang, X.Y.; Sun, Y.A.; Wang, Y.F. Effects of Supplementary Irrigation on Biomass, WUE and Yield of Winter Wheat under Different Nitrogen Fertilizer Conditions. J. Irrig. Drain. 2020, 39, 51–59. [Google Scholar]
  61. Lu, J.F.; Zhao, H.B.; Yang, J.; Qu, H.f.; Lei, B.H. Yield of winter wheat after anthesis in upland Effects of reduced nitrogen fertilizer combined with soil surface management on physiological characteristics and grain. Chin. Soil Fertil. 2018, 1, 16–22. [Google Scholar]
  62. Ma, Z.H.; Kou, C.L.; Kang, L.Y. Influence of phosphorus application in different soil depth on growthand yield of winter wheat under different water conditions. J. Henan Agric. Sci. 2016, 45, 49–55. [Google Scholar]
  63. Xu, Y.B.; Li, Y.M.; Yin, M.H.; Ren, Q.M.; Wang, X.Y.; Chen, Z.W. Effect of micro-sprinkler irrigation on growth, yield andwater use efficiency of winter wheat. Agric. Res. Arid Areas 2018, 36, 121–125. [Google Scholar]
  64. Shi, C.X.; Chen, T.; Feng, F.; Wang, C.J.; Lv, X.K.; Zhang, L.; Liao, Y.C.; Qin, X.L. Production of mixed planting winter wheat and soil water efficiency in Guanzhong Irrigation Zone. Agric. Res. Arid Areas 2017, 35, 29–37. [Google Scholar]
  65. Wu, R.; Li, Y.-N. Growth and nitrogen nutrition diagnosis of winter wheat under different water and nitrogen conditions. Water Sav. Irrig. 2017, 12, 27–32. [Google Scholar]
  66. Zhang, M.Z.; Niu, W.Q.; Lu, Z.G.; Wang, J.W.; Qiu, X.Q.; Li, Y. Effects of moistube irrigation on winter wheat’s yield and irrigation water use efficiency. J. Irrig. Drain. 2018, 37, 8–15. [Google Scholar]
  67. Hu, T.T.; Cui, X.L.; Li, M.Y.; Lu, J.S.; Luo, L.H.; Chen, S.M. Effect of different nitrogen fertilizer synergists, water and nitrogen amount on winter wheat yield. Agric. Mach. J. 2021, 52, 302–310. [Google Scholar]
  68. Jia, L.; Zhai, B.N.; Feng, M.L.; Wang, M.Y.; Qing, X.M.; Zhao, F.P.; Dang, S.M. Effects of different optimized water and fertilizer modeson the yield and growth of winter wheat. J. Northwest AF Univ. (Nat. Sci. Ed.) 2012, 40, 75–81. [Google Scholar]
  69. Yang, Y. Effects of Different Combinations of Water and Fertilizers on the Growth and Nutrient Uptake of Winter Wheat and Maize. Master’s Thesis, Northwest A&F University, Xianyang, China, 2016. [Google Scholar]
  70. Jia, L.; Zhai, B.N.; Hu, Z.P.; Li, X.Z.; Jia, H.X.; Liu, G.F. Effects of various water and fertilizer controlling measures on the yield and population dynamics of winter wheat. Chin. Agric. Sci. Bull. 2014, 30, 175–179. [Google Scholar]
  71. Sun, Q.-K.; Zhang, J.-X.; Zhao, L.-J.; Xue, L.-H.; Duan, L.-N. Water consumption and dry matter accumulation and distribution of winter wheat under different drip irrigation amount. Agric. Res. Arid Areas 2017, 35, 66–73. [Google Scholar]
  72. Zhao, L.J.; Xue, L.H.; Sun, O.K.; Zhang, J.X. Effect of different irrigation and nitrogen application on water consumption characteristics and the water and Nitrogen use efficiencies under drip irrigation in winter wheat. J. Triticeae Crops 2016, 36, 1050–1059. [Google Scholar]
  73. Zhang, N.; Zhang, Y.Q.; Tang, J.H.; Niu, H.S.; Xu, W.X.; Li, H.S.; Hao, W.W. Effect of drip irrigation layout on growth and yield of winter wheat. J. Triticeae Crops 2013, 33, 1197–1201. [Google Scholar]
  74. Xiao, J.; Jia, Z.L. Effects of water and fertilizer coupling on the northern Xinjiang winter wheat physiological growth and yield under drip Irrigation. J. Anhui Agric. 2014, 42, 8915–8918. [Google Scholar]
  75. Xue, L.H.; Zhao, L.J.; Chen, X.W.; Sun, S.R.; Zhang, H.Z.; Sai, L.H.; Lei, J.J.; Zhang, Y.Q. Effect of nitrogen application rate on photosynthetic characteristics, yield and nitrogen utilization efficiency of winter wheat under drip irrigation. Chin. Agric. Sci. Bull. 2018, 34, 11–16. [Google Scholar]
  76. Lei, J.J.; Zhang, Y.Q.; Liang, Y.C.; Sai, L.H.; Xue, L.H.; Zhang, H.Z.; Qiao, X.; Wang, C.; Chen, X.W. Effects of different nitrogen application rates on photosynthetic characteristics and yield of winter wheat under drip irrigation. Xinjiang Agric. Sci. 2015, 52, 1576–1582. [Google Scholar]
  77. Zhang, Y.Q.; Chen, X.W.; Sai, S.K.; Xue, L.H.; Lei, J.J. Effect of density on diurnal variation of photosynthesis of winter wheat under drip irrigation during grain filling stage under shading condition. Xinjiang Agric. Sci. 2017, 54, 2164–2173. [Google Scholar]
  78. McQueen, R.J.; Garner, S.R.; Nevill-Manning, C.G.; Witten, I.H. Applying machine learning to agricultural data. Comput. Electron. Agric. 1995, 12, 275–293. [Google Scholar] [CrossRef]
  79. Liu, H.L.; Liu, Q.Y.; Guo, Y.X. Research on collision detection of foot robot based on gaussian process regression. Modul. Mach. Tool Autom. Manuf. Tech. 2021, 9, 94–99. [Google Scholar]
  80. Qin, S.S.; Hou, Z.J.; Wu, Z.D.; Ma, D.H.; Huang, P. Effects of water and nitrogen coupling on nitrogen absorption and yield of winter wheat. J. Drain. Irrig. Mach. Eng. 2017, 35, 440–447. [Google Scholar]
  81. Liu, Q.F.; Ma, Y.G.; Chen, D.M.; Liu, B.H.; Su, Y.H.; Wang, X.X.; Liu, H.Y.; Zhang, Q.H.; He, W.Z. The number of irrigation and the period of irrigation is used for winter wheat Hangmai No. 13 output and the impact of the main agricultural traits. Agric. Sci. Technol. Commun. 2020, 8, 110–114. [Google Scholar]
  82. Wu, L.F.; Zhang, F.C.; Zhang, P.; Li, Z.J.; Zhou, H.Y. Effect of irrigation and nitrogen fertilizer on growth and yield of spring wheat in Hexi oasis of Gansu. J. Northwest AF Univ. (Nat. Sci. Ed.) 2011, 39, 55–63. [Google Scholar]
  83. Li, H. The impact of planting density on wheat output and onstituent factors under high fertilizer conditions. Farm Staff 2017, 19, 26–27+55. [Google Scholar]
  84. Xian, T.Z.; Zhao, D.Z.; Ren, H.P.; Yang, Y.W. Study on the impact of main weather factors on the production of wheat output in the central and western parts. Mod. Agric. Technol. 2011, 20, 297+304. [Google Scholar]
  85. Liu, F.L. Effect of Sowing Date and Planting Density on Grain Yield and Quality of Winter Wheat Pubing 151. Master’s Thesis, Northwest A&F University, Xianyang, China, 2016. [Google Scholar]
  86. Sahoo, R.N.; Gakhar, S.; Rejith, R.G.; Verrelst, J.; Ranjan, R.; Kondraju, T.; Meena, M.C.; Mukherjee, J.; Daas, A.; Kumar, S.; et al. Optimizing the Retrieval of Wheat Crop Traits from UAV-Borne Hyperspectral Image with Radiative Transfer Modelling Using Gaussian Process Regression. Remote Sens. 2023, 15, 5496. [Google Scholar] [CrossRef]
Figure 1. Geographical distribution of wheat data sources. The triangle annotations in the figure represent the main winter wheat producing regions in China.
Agronomy 14 00839 g001
Figure 2. Comparison between the predicted values of the machine learning models and the measured values: (a1a3) Gaussian process regression model; (b1b3) Linear regression model; (c1c3) Regression tree model; and (d1d3) Support vector machine model.
Agronomy 14 00839 g002
Figure 3. Predicted results of Gaussian process model by the refined water–nitrogen levels. (a) Leaf area index; (b) dry matter; and (c) yield.
Agronomy 14 00839 g003
Figure 4. Predicted results of water and fertilizer coupling function. (a) Leaf area index; (b) dry matter; and (c) yield.
Agronomy 14 00839 g004
Table 1. Sample size and data sources.
DistrictLeaf Area IndexDry Matter MassYield
Sample Size of Each CityData SourceSample Size of Each CityData SourceSample Size of Each CityData Source
Anhui12[23]12[23]18[23]
Beijing 9[24]11[24,25]
Hebei44[26,27,28,29,30,31,32,33,34,35]29[24,27,29,30,31,35]84[26,27,28,29,30,31,32,33,34,35,36,37,38,39]
Henan37[40,41,42,43,44,45]26[40,41,42]65[40,41,42,43,45,46,47]
Jiangsu3[48,49]26[50]30[49,50]
Shandong19[51,52]15[51,53]27[51,52,53]
Shanxi31[54,55]40[55,56]39[55,56]
Shaanxi41[57,58,59,60]33[27,58,59,61]127[57,58,59,60,61,62,63,64,65,66,67,68,69,70]
Xinjiang46[71,72,73,74,75,76,77]20[71,73,75,77]43[71,72,73,74,75,76,77]
Total233 210 444
Table 2. Machine learning parameters.
Learning ParametersInput Amount
Training setIrrigation amount (mm), nitrogen application amount (kg/hm2),
potassium application amount (kg/hm2), phosphorus application amount (kg/hm2), organic matter content (%), available phosphorus content (mg/kg),
alkaline hydrolysis nitrogen content (mg/kg), total nitrogen amount (g/kg), available potassium content (mg/kg), planting density (kg/hm2)
Response variableMaximum leaf area index (cm2/cm2), maximum dry matter mass (kg/hm2), yield (kg/hm2)
Number of datasets255 (maximum leaf area index), 210 (maximum dry matter mass), 444 (yield)
Cross validation fold10
Regression modelLinear regression model, regression tree, support vector machine, Gaussian regression model
Table 3. Comparison of growth characteristics indicators between predicted values by Gaussian process regression model and measured value.
Validation LiteraturePredictive IndicatorsIrrigation Amount (mm)Nitrogen Application Amount
(kg/hm2)
Measured ValuePredicted ValueRelative Error
(%)
[53]Maximum leaf area index47303.4473.89813.08
4731004.5534.4462.35
4732004.5855.19713.35
4733007.1786.06515.51
42804.2074.0423.92
4281005.0684.6069.12
4282005.3865.3490.35
4283006.4066.1913.36
[72]Maximum dry matter mass553013,466.514,82010.05
691.1013,25115,04013.5
708.5013,13115,05014.61
559.7518012,78115,73023.07
691.3218012,97815,84022.05
712.518014,434.515,8109.53
563.2627013,35615,93019.27
700.2327016,07715,9600.72
713.1627016,042.515,9400.64
[80]Yield502.661506318.458617.24
502.66190663664173.47
502.662307005.466545.01
502.662707146.266437.04
576.11506653.9584612.14
576.11907072.363709.35
576.12307185.265428.95
576.12707240.5646810.67
612.251506040.358013.96
612.251907007.1630310.05
612.252307060.164528.61
612.252706535.8863632.65
642.921505149573711.42
642.921905434.6621414.34
642.922305299.4634219.67
642.922705347.3624416.77
720.921505467.955160.8
Table 4. Wheat yield in Henan and Xinxiang from 2011 to 2013.
YearWheat Yield in Henan Province (kg/hm2)Wheat Yield in Xinxiang City (kg/hm2)
201360126791
201259506757
201158676703
Disclaimer/Publisher’s Note: The statements, opinions and data contained in all publications are solely those of the individual author(s) and contributor(s) and not of MDPI and/or the editor(s). MDPI and/or the editor(s) disclaim responsibility for any injury to people or property resulting from any ideas, methods, instructions or products referred to in the content.

