Article

The Musa Marker Database: A Comprehensive Genomic Resource for the Improvement of the Musaceae Family

1
Department of Genetics and Genome Biology, University of Leicester, Leicester LE1 7RH, UK
2
Institute of Fruit Tree Research, Guangdong Academy of Agricultural Sciences, Tianhe District, Guangzhou 510640, China
3
Department of Computer Science and Engineering, Maulana Abul Kalam Azad University of Technology, Kolkata 741249, India
*
Authors to whom correspondence should be addressed.
Agronomy 2024, 14(4), 838; https://doi.org/10.3390/agronomy14040838
Submission received: 27 December 2023 / Revised: 22 March 2024 / Accepted: 9 April 2024 / Published: 17 April 2024

Abstract

:
Molecular markers, including Simple Sequence Repeat (SSR), Single Nucleotide Polymorphism (SNP), and Intron Length Polymorphism (ILP), are widely utilized in crop improvement and population genetics studies. However, these marker resources remain insufficient for Musa species. In this study, we developed genome-wide SSR, SNP, and ILP markers from Musa and its sister species, creating a comprehensive molecular marker repository for the improvement of Musa species. This database contains 2,115,474 SSR, 63,588 SNP, and 91,547 ILP markers developed from thirteen Musa species and two of its relative species. We found that 77% of the SSR loci are suitable for marker development; 38% of SNP markers originated from the genic region, and transition mutations (C↔T; A↔G) were more frequent than transversion. The database is freely accessible and follows a ‘three-tier architecture,’ organizing marker information in MySQL tables. It has a user-friendly interface, written in JavaScript, PHP, and HTML code. Users can employ flexible search parameters, including marker location in the chromosome, transferability, polymorphism, and functional annotation, among others. These distinctive features distinguish the Musa Marker Database (MMdb) from existing marker databases by offering a novel approach that is tailored to the precise needs of the Musa research community. Despite being an in silico method, searching for markers based on various attributes holds promise for Musa research. These markers serve various purposes, including germplasm characterization, gene discovery, population structure analysis, and QTL mapping.

1. Introduction

The Musaceae family stands as one of the most popular and widely recognized families for fruit crops. This family is composed of three genera (Musa, Musella, and Ensete) with about 91 known species, which are placed in the order Zingiberales. The family is native to the tropics of Africa and Asia [1]. Members of this family, such as bananas, play a significant role in the global economy and contribute to sustainable food security in tropical and sub-tropic regions worldwide. They serve as a primary food staple for millions of people, providing valuable nutrients, calories, fiber, fodder, and raw materials for various industries [2]. There are approximately 135 countries in tropical and sub-tropical regions that cultivate bananas. Among them, India, China, Indonesia, Brazil, Ecuador, the Philippines, Guatemala, Angola, and Tanzania stand out as the top banana producers and exporters. Together, these countries contribute about 80% of the world’s banana production and trade [2,3,4,5]. However, the banana industry faces notable challenges, including diseases, pests, and climate change. Traditional methods of plant protection and cultivation are insufficient to meet the demands of the banana industry [6,7]. The triploid nature of cultivated banana cultivars limits the application of conventional breeding techniques for varietal improvements. To address these ongoing challenges in the banana industry, researchers are exploring various opportunities to enhance crop production [6]. This involves collecting and characterizing wild and cultivated varieties, creating a large germplasm collection using both in vitro and ex vitro methods, developing genomic repositories through genome and transcriptome sequencing, and analyzing and sharing the data in the public domain [6,8]. These efforts aim to improve the resilience and productivity of this important crop.
The collection and characterization of germplasm within the Musaceae family are essential for varietal improvements. The banana research community is consistently engaged in this task, employing mostly phenotypic characteristics and traditional molecular markers such as RAPD and AFLP. Despite the continued use of these legacy markers, they possess several limitations, particularly in terms of reproducibility. Therefore, the comprehensive characterization of banana germplasm faces significant challenges. In addition to legacy molecular markers, SSR and SNP have been employed for banana germplasm characterization. However, there is a notable absence of ILP markers specific to this plant family. While most SSR markers for the Musaceae family have been developed from M. acuminata [9,10,11,12,13] with a few in M. balbisiana [14,15], it is crucial to expand the collection of molecular markers across all subspecies. Generating markers that cover the entire genome of this family would prove to be a valuable resource for the research community striving to enhance banana cultivars.
Molecular markers are widely used in modern agriculture for crop improvement programs. They have a wide range of applications in plant breeding, including germplasm characterization, parent selection, genetic diversity, population structure, and trait tagging. The easy accessibility of the genome sequence and molecular marker mining tools have revalorized genome-scale marker discovery and their subsequent utility. Among the different types of molecular markers, SSR, SNP, and ILP markers are frequently used in plant breeding due to their genomic abundance, easy assay techniques, and reproducibility.
The developments of genome-scale SSR, SNP, and ILP markers are straightforward, and they have become routine work for molecular breeders and bioinformaticians. Genome-wide molecular markers, especially SSR markers, have been developed for many of the sequenced plant genomes, but the molecular marker databases have been created for only a few of them. For example, the Cotton Microsatellite Database [16] was created to present 5484 microsatellite markers that were developed from nine major cotton microsatellite projects. The Kazusa Marker DataBase [17] was developed to provide linkage maps, physical maps, and information on ~68,000 SSR and ~1,400,000 SNP primers for 14 agronomical important crop species. This database provides forward and reverse primer sequences, as well as a unique primer ID linked with additional information about the primer. The NABIC marker database was developed based on 7250 markers from published articles on different crop plants [18]. Each marker in this database contains information about the marker name, gene definition, general marker information, and expressed sequence tag number. The Pigeon Pea Microsatellite Data Base (PIPEMicroDB) catalogs 123,387 instances of short tandem repeat information from the pigeon pea genome [19]. The Foxtail millet Marker Database (FmMDb) is an online searchable and downloadable database developed from Foxtail millet genome sequences. This database catalogs 21,315 genomic SSRs, 447 genic SSRs, and 96 ILP markers’ information [20]. The Chickpea Microsatellite Database (CicArMiSatDB http://cicarmisatdb.icrisat.org (accessed on 20 November 2022)) is a relational database created by mining Chickpea genomes, and it provides information on SSRs along with their features including genomic coordination, primer-pairs, annealing temperature, and SSR repeat motifs [21]. The PIP (Potential Intron Polymorphism) marker database, developed from the genome assembly of 59 plant species, does not include any markers from Musa and its sister species [22]. The ‘SSRome’ database represents 45.1 million microsatellite markers across all taxa including plants, metazoa, archaea, bacteria, viruses, fungi, and protozoa. Users can explore microsatellites from 6533 organisms including nuclear, mitochondrial, and chloroplast genomes [23]. All the makers in this database are classified as genic or non-genic. The pineapple genomics database (PGD) is a core online platform that integrates genomic, transcriptomic, and genetic marker (SSR, SNP, and ILP) data for pineapple [24]. The lily genomic database represents SSR and SNP markers for the lily species (http://www.genomicsres.org/lilidb/ (accessed on 12 December 2023) [25].
Until today, many online databases have been developed to store genomic data in an accessible platform. Among these, some focus on different types of molecular markers, some store only genomic sequence data, while others integrate both marker and sequence data. Most of the molecular marker databases deal with SSR markers as described in an earlier section of this article. Although some of the existing marker databases integrate molecular markers from Musa sp., among them SSRome [23], PMDBase [26], Banana Genome Hub [27], and BanSatDb [28] marker databases are notable. SSRome and PMDBase only integrate SSR marker data from the Musa acuminata genome; BGH and TropGENE store only Musa SNP markers. The BanSatDb database was created for Musa SSR markers, and it allows for the design of SSR markers from the three genomes of Musa species: M. acuminata, M. balbisiana, and M. itinerans. BanSatDb does not permit the search of primers from the M. schizocarpa genome. All the existing marker databases have many limitations and their major deficiency is: (i) lacking the classification of SSR loci as class I (>20 bp) or class II (≤20 bp); (ii) missing polymorphism and transferability information, which is a key attribute for selecting high therapeutic markers in in silico methods; (iii) lack of associated gene function information; and (iv) missing SSR motif information such as motif richness (as AT, GC, or AT/GC balance) or the motif is located in CDS or UTR. Overall, existing marker databases generally present a limited set of information for each marker, such as forward and reverse primer sequences, SSR types, primer annealing temperature, and PCR product size. Moreover, search parameters are often inflexible and narrow.
The objective of this study was to conduct genome-wide mining and characterization of molecular markers (SSR, SNP, and ILP) and to develop a user-friendly database encompassing thirteen Banana and two Ensete species. The database will feature chromosome-wise SSR, SNP, and ILP primers, e-PCR-based polymorphism, and cross-taxa transferability. Additionally, in addressing the limitations of existing marker databases, including Musa and other plant species, we aim to provide a more robust platform for marker selection and analysis prior to their use in future research projects such as genetic diversity assessment, genotype characterization, and population structure studies.

2. Materials and Methods

2.1. Data Collection and Processing

The whole genome sequences of 12 banana spices (Listed in Table S1) were downloaded from Musa Genome Hub (https://banana-genome-hub.southgreen.fr/node/50/925 (accessed on 26 July 2020)). A total of 25261 Banana GSS sequences were obtained from the NCBI database. EST sequences of Musa spp. were obtained from the EST Tool Kit and NCBI databases. All EST sequences were merged into a single fasta file and then the “est_trimmer.pl” tool (http://pgrc.ipk-gatersleben.de/misa/download/est_trimmer.pl (accessed on 26 July 2020)) was used to remove low-quality sequences, poly A/T, and low-complexity regions at the 5’ and 3′ ends. The resulting sequences were then assembled to remove redundant sequences using CD-Hit [29] with default parameters and the non-redundant sequences were used for subsequent analysis.

2.2. Marker Development

SSR markers: The microsatellite (SSR) markers were developed using a pipeline called 3GTMAT (https://github.com/mkbcit/3GMAT (accessed on 26 July 2020)), with a minimum of 12 nt long SSR loci. SSR loci were characterized based on (i) the length of repeat motifs (Class I > 20 bp, Class II ≤ 20 bp) and (ii) the nucleotide composition of repeat motifs (AT-rich, GC-rich, and AT-GC balance). The E-PCR strategy was applied to assess the in silico transferability and polymorphism analysis of the developed SSR markers.
SNP markers: The EST sequences were mapped on the Musa acuminata genome using Bowtie2 [30] with default parameters, and then samtools [31] was used to extract SNP and Indels. A Perl script was used to extract flanking sequences of 400 bp in length, including 200 bp upstream and 200 bp downstream of the SNP locus. SNP primer pairs were designed using Primer3 [32] with default parameters. The Functional annotation and gene association of the developed SNP markers were estimated using Blast2Go [33] analysis.
ILP markers: Intron information was extracted from the gff3 file of the annotated Musa genomes. Then, a Perl script was used to retrieve intron flanking regions along with the 100 bp on each side of the targeted introns. Subsequently, intron lengths ranging from 100 to 3000 bp were extracted for primer design. Primer3 [32] software with default parameters was used to design the primers. The e-PCR method was used for the in silico transferability assessment of the ILP markers.

2.3. User Interface and Database Construction

The MMdb is a web-based interactive, searchable, downloadable, and relational database server, developed using MySQL 5.0 (www.mysql.com), and it has three tiers: a client-tier, middle-tier, and database tier. All the developed markers with their features have been stored in a MySQL database, which is accessed through PHP and Apache. The user-friendly web interface was designed using HTML5, Bootstrap4, CSS3, JavaScript, and jQuery.

3. Result

3.1. Genome-Wide Marker Developments

We conducted a genome-wide analysis to identify, distribute, and classify simple sequence repeats (SSRs) using 15 whole genome assemblies: thirteen from Musa spp. and two from Ensete spp., as detailed in Table S1. In total, we identified 2,761,190 SSRs, encompassing various types of desirable repeat motifs ranging from mono- to hexanucleotide repeats in the 15 datasets (see Table S1). The SSR densities exhibited variations across the tested genomes, with a range of 1425 to 5718 base pairs per SSR. An average SSR was found at every 3085 base pairs in the genome. Class II SSRs (motif length less than or equal to 20 base pairs) were more prevalent than Class I SSRs (motif length greater than 20 base pairs) in all Musa species. Among the tested genomes, AT-rich SSR motifs were dominant in comparison to other types of SSR motifs, including GC-rich and AT/GC-balanced motifs. All the identified SSRs were utilized for SSR marker development, resulting in 2,115,474 SSR loci successfully developed as SSR markers, representing 77% of the total SSRs. The remaining SSRs failed to develop markers, possibly due to the absence of perfect genome fragments, low-quality base representation, or insufficient flanking regions to generate primer sequences (Table 1).
We systematically characterized all the SSR markers based on their transferability, genomic location, polymorphism, locus type, and the distribution of repeat type, repeat richness, and repeat length among genomic regions. The results are presented in Figure 1a. The findings reveal that 80% of the SSRs are located in intergenic regions. Furthermore, we distributed Class I and Class II SSRs between these two regions, genic and intergenic. However, we did not observe any significant preference for the distribution of Class I and Class II SSR types among these locations in both regions. Class II-type SSRs were more frequent than Class I-type SSRs in both regions (Figure 1a–c). Single-locus markers were found to be prevalent among both Musa and Ensete species. Based on the e-polymerase chain reaction (e-PCR) results, a significant number of polymorphic markers were identified, indicating their potential utility for further applications (Figure 1d–f).
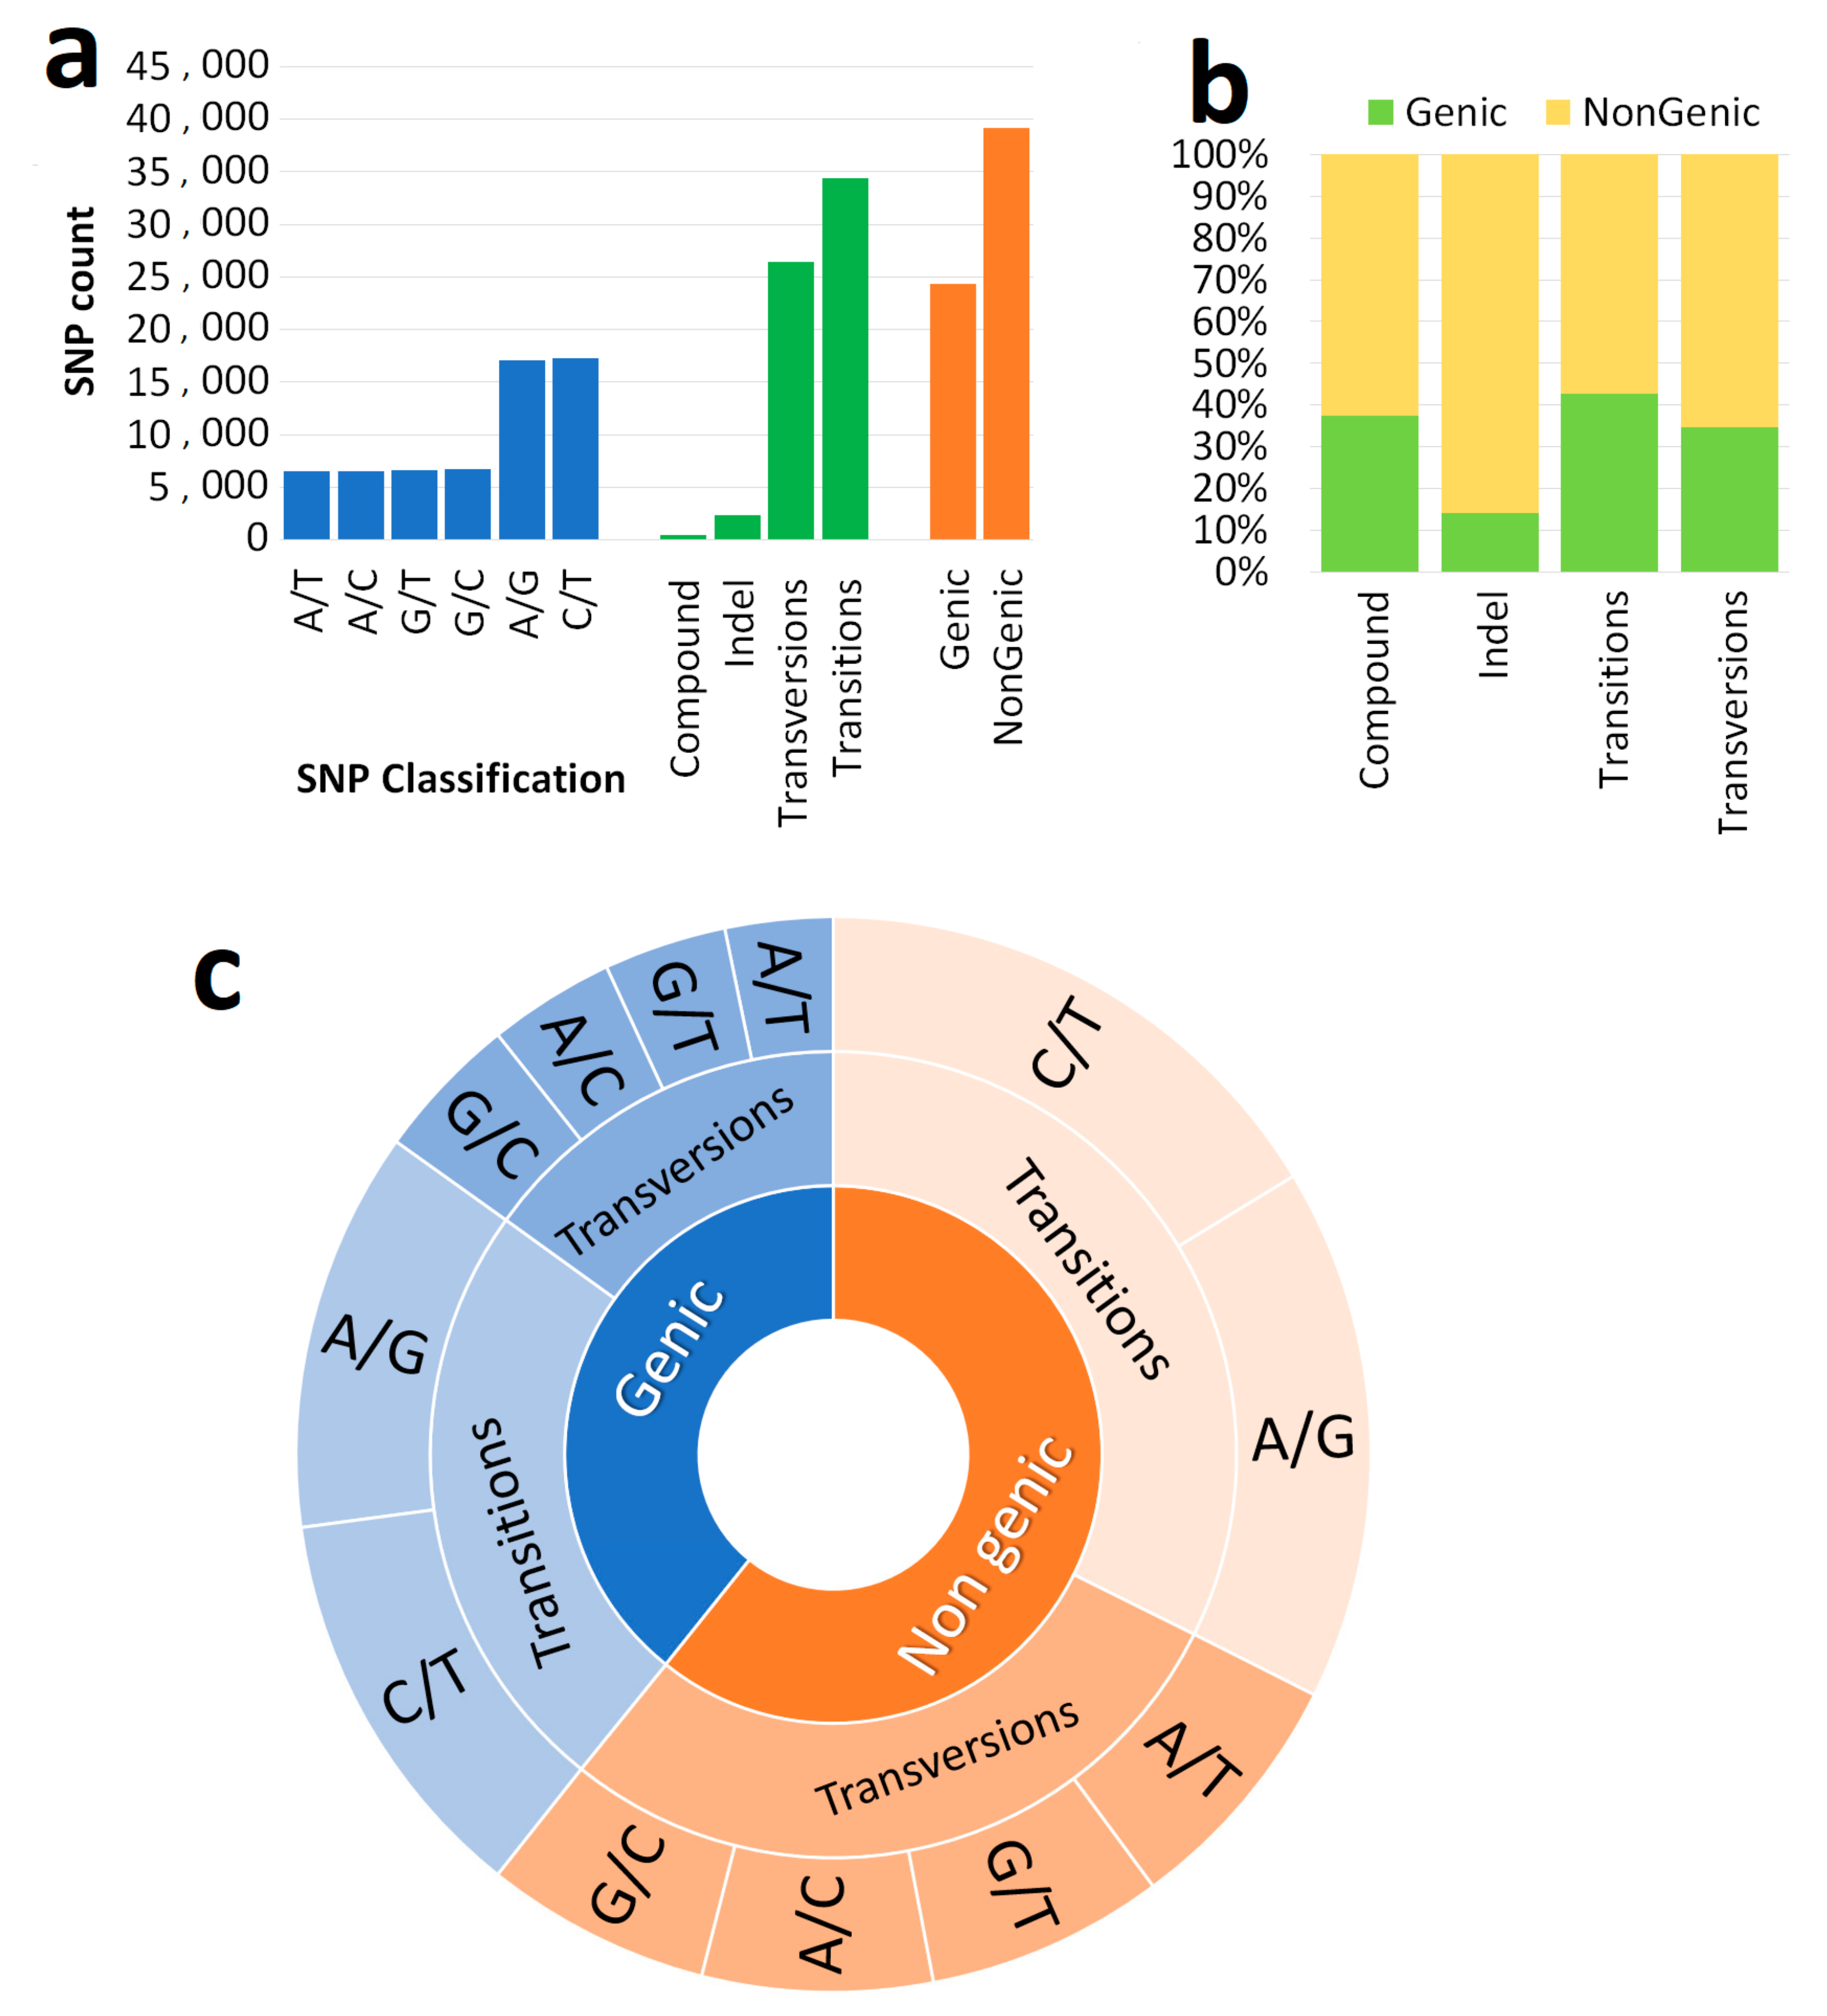
In this study, SNP markers were developed and characterized based on sequences obtained from the public domain. The results are presented in Figure 2 and Supplementary Table S2. A total of 63,588 SNP markers were developed in this study, with 24,375 of them located in the genic regions. Transition mutations (C↔T; A↔G) were found to be dominant in both regions, although their frequency was not significantly higher than that of transversion mutations. Indels are more abundant in the non-genic regions than in the genic regions.
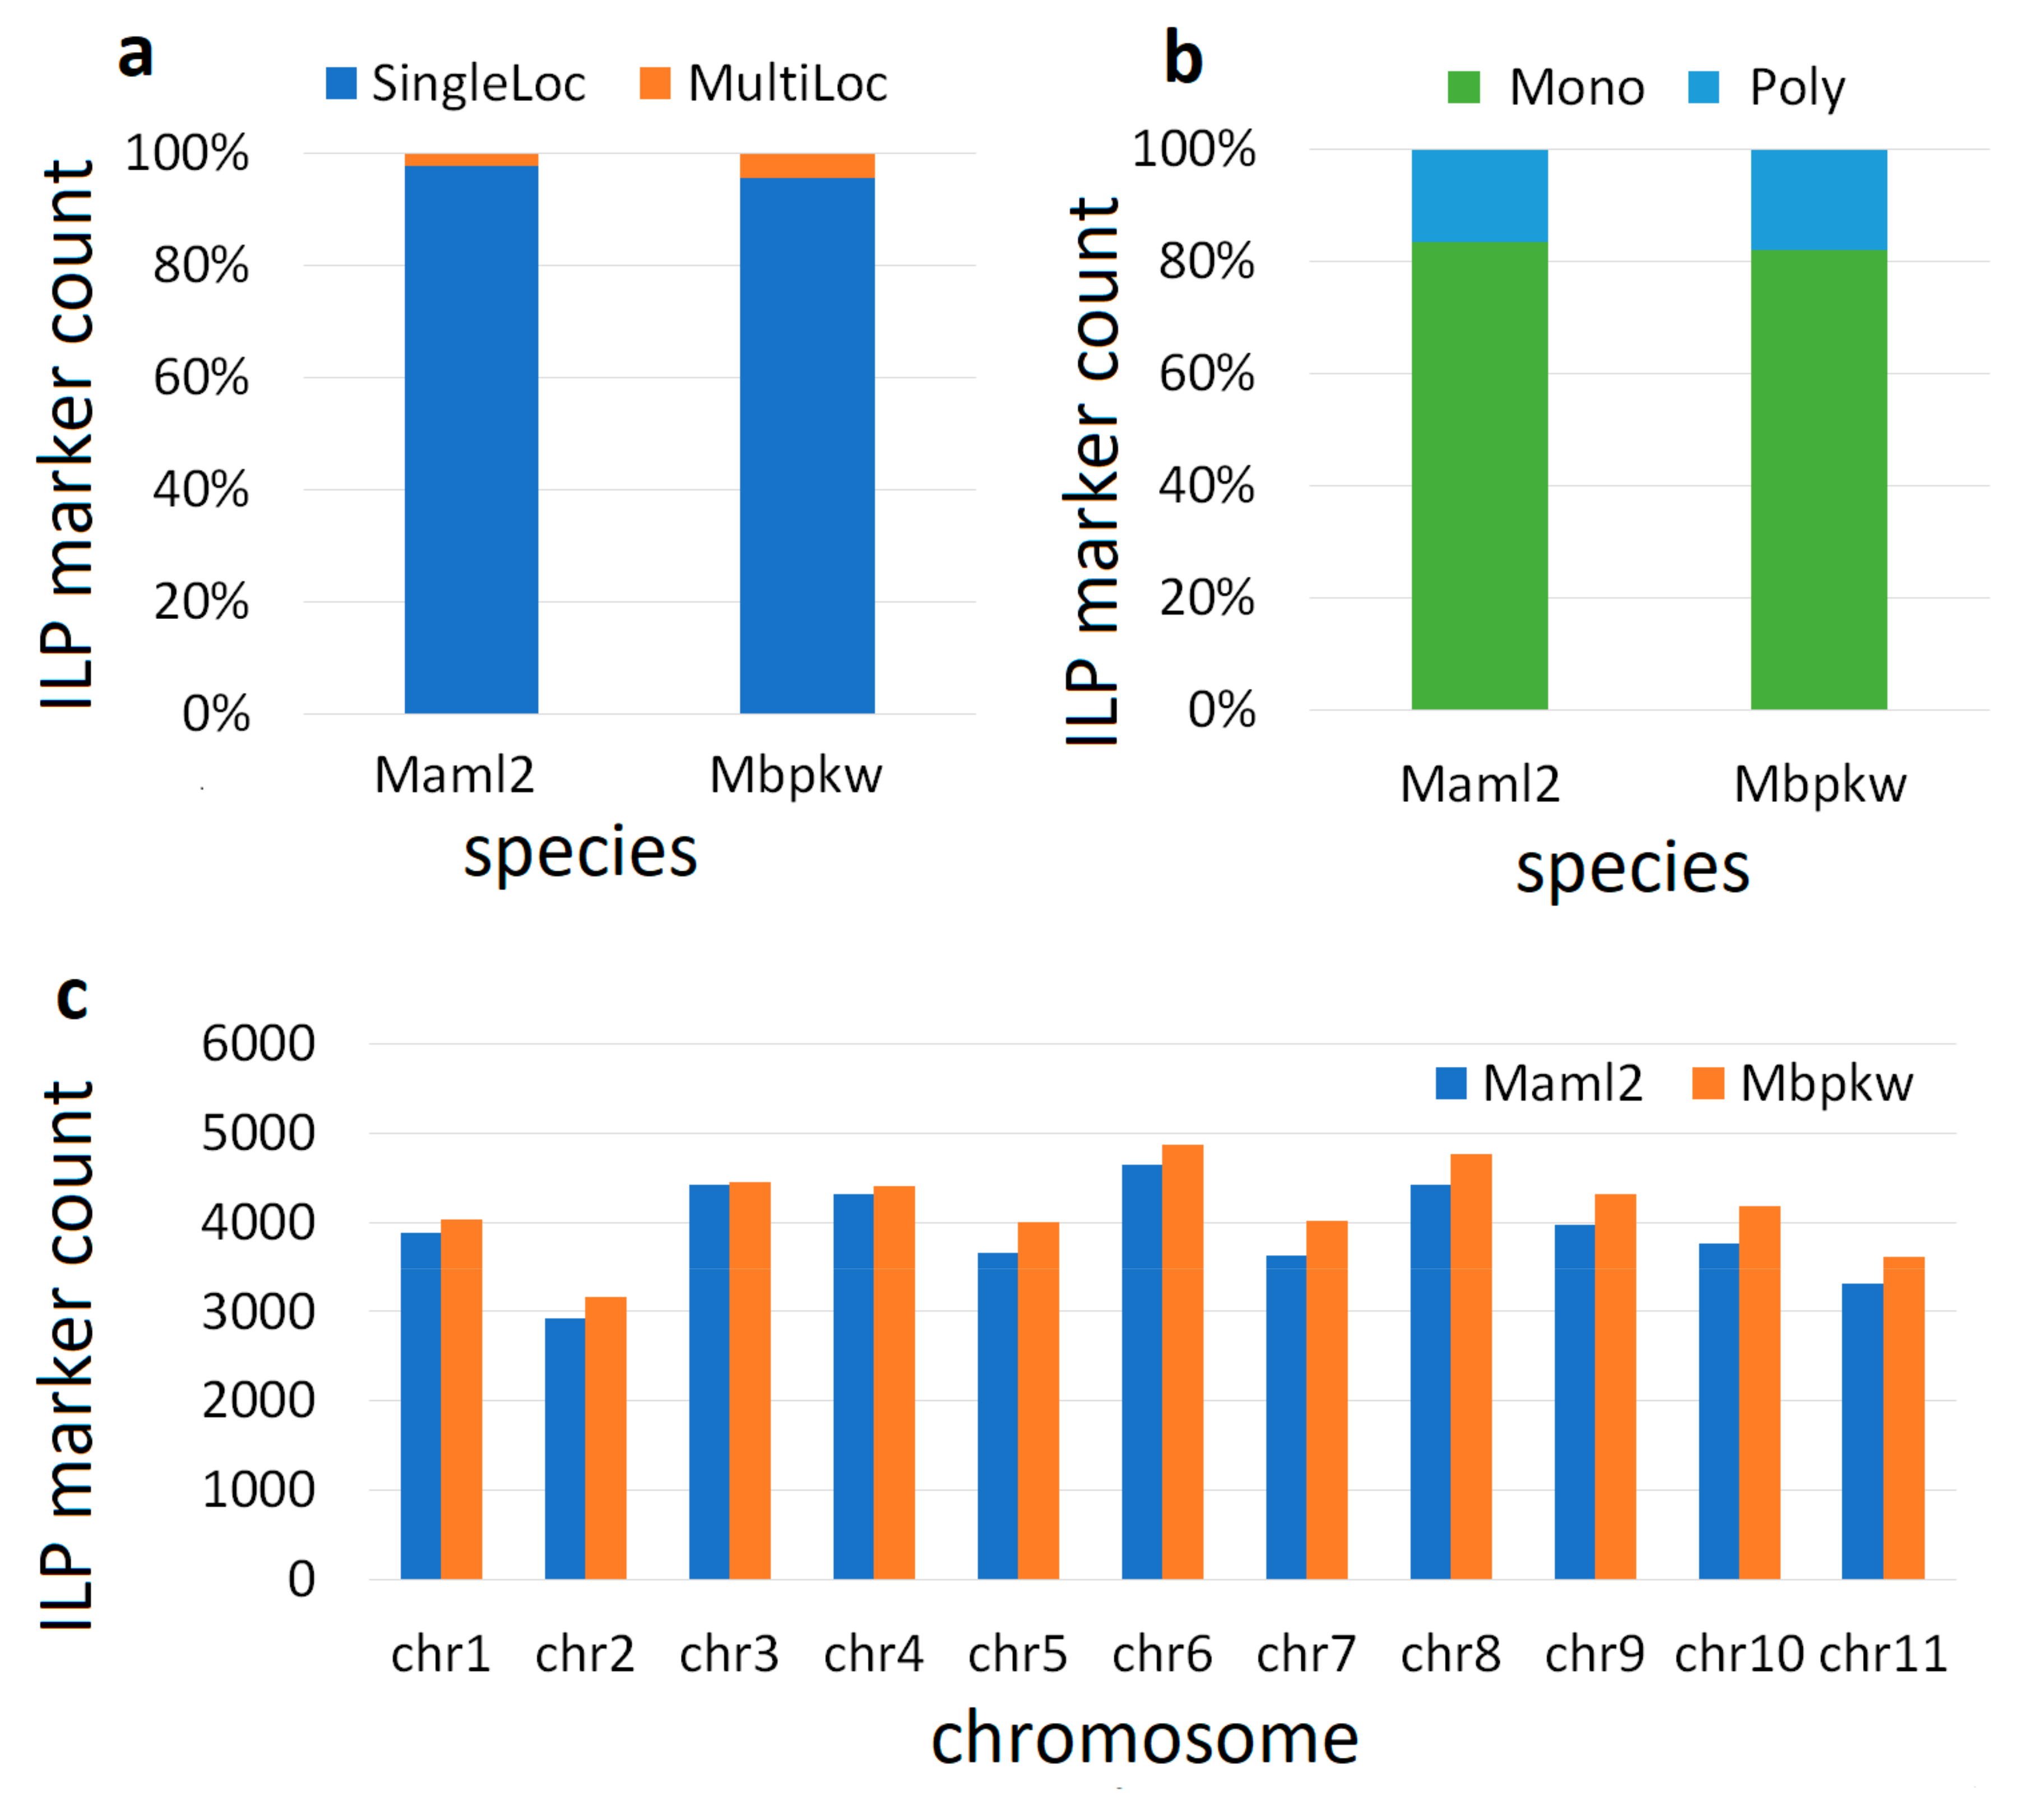
A total of 91,547 ILP markers were developed from the genomes of Maml2 and Mbpkw. The percentage of single and multi-locus markers significantly varied in both genomes (Maml2 and Mbpkw). The results reveal that single-locus ILP markers constitute more than 98% of both genomes, while multi-locus markers are less common. The majority of the ILP markers show monomorphism, accounting for approximately 82% of the total number (Figure 3a–c). The chromosomal level distributions of ILP markers in both genomes do not exhibit any significant differences.

3.2. Interface and Search Criteria

The MMdb is a comprehensive and user-friendly resource that enables exploration, searching, downloading, and comparison of molecular markers such as SSR, SNP, and ILP across 12 Musa species. It features an interactive web interface accessible via a top navigation bar, enabling users to easily access various sections and tools.
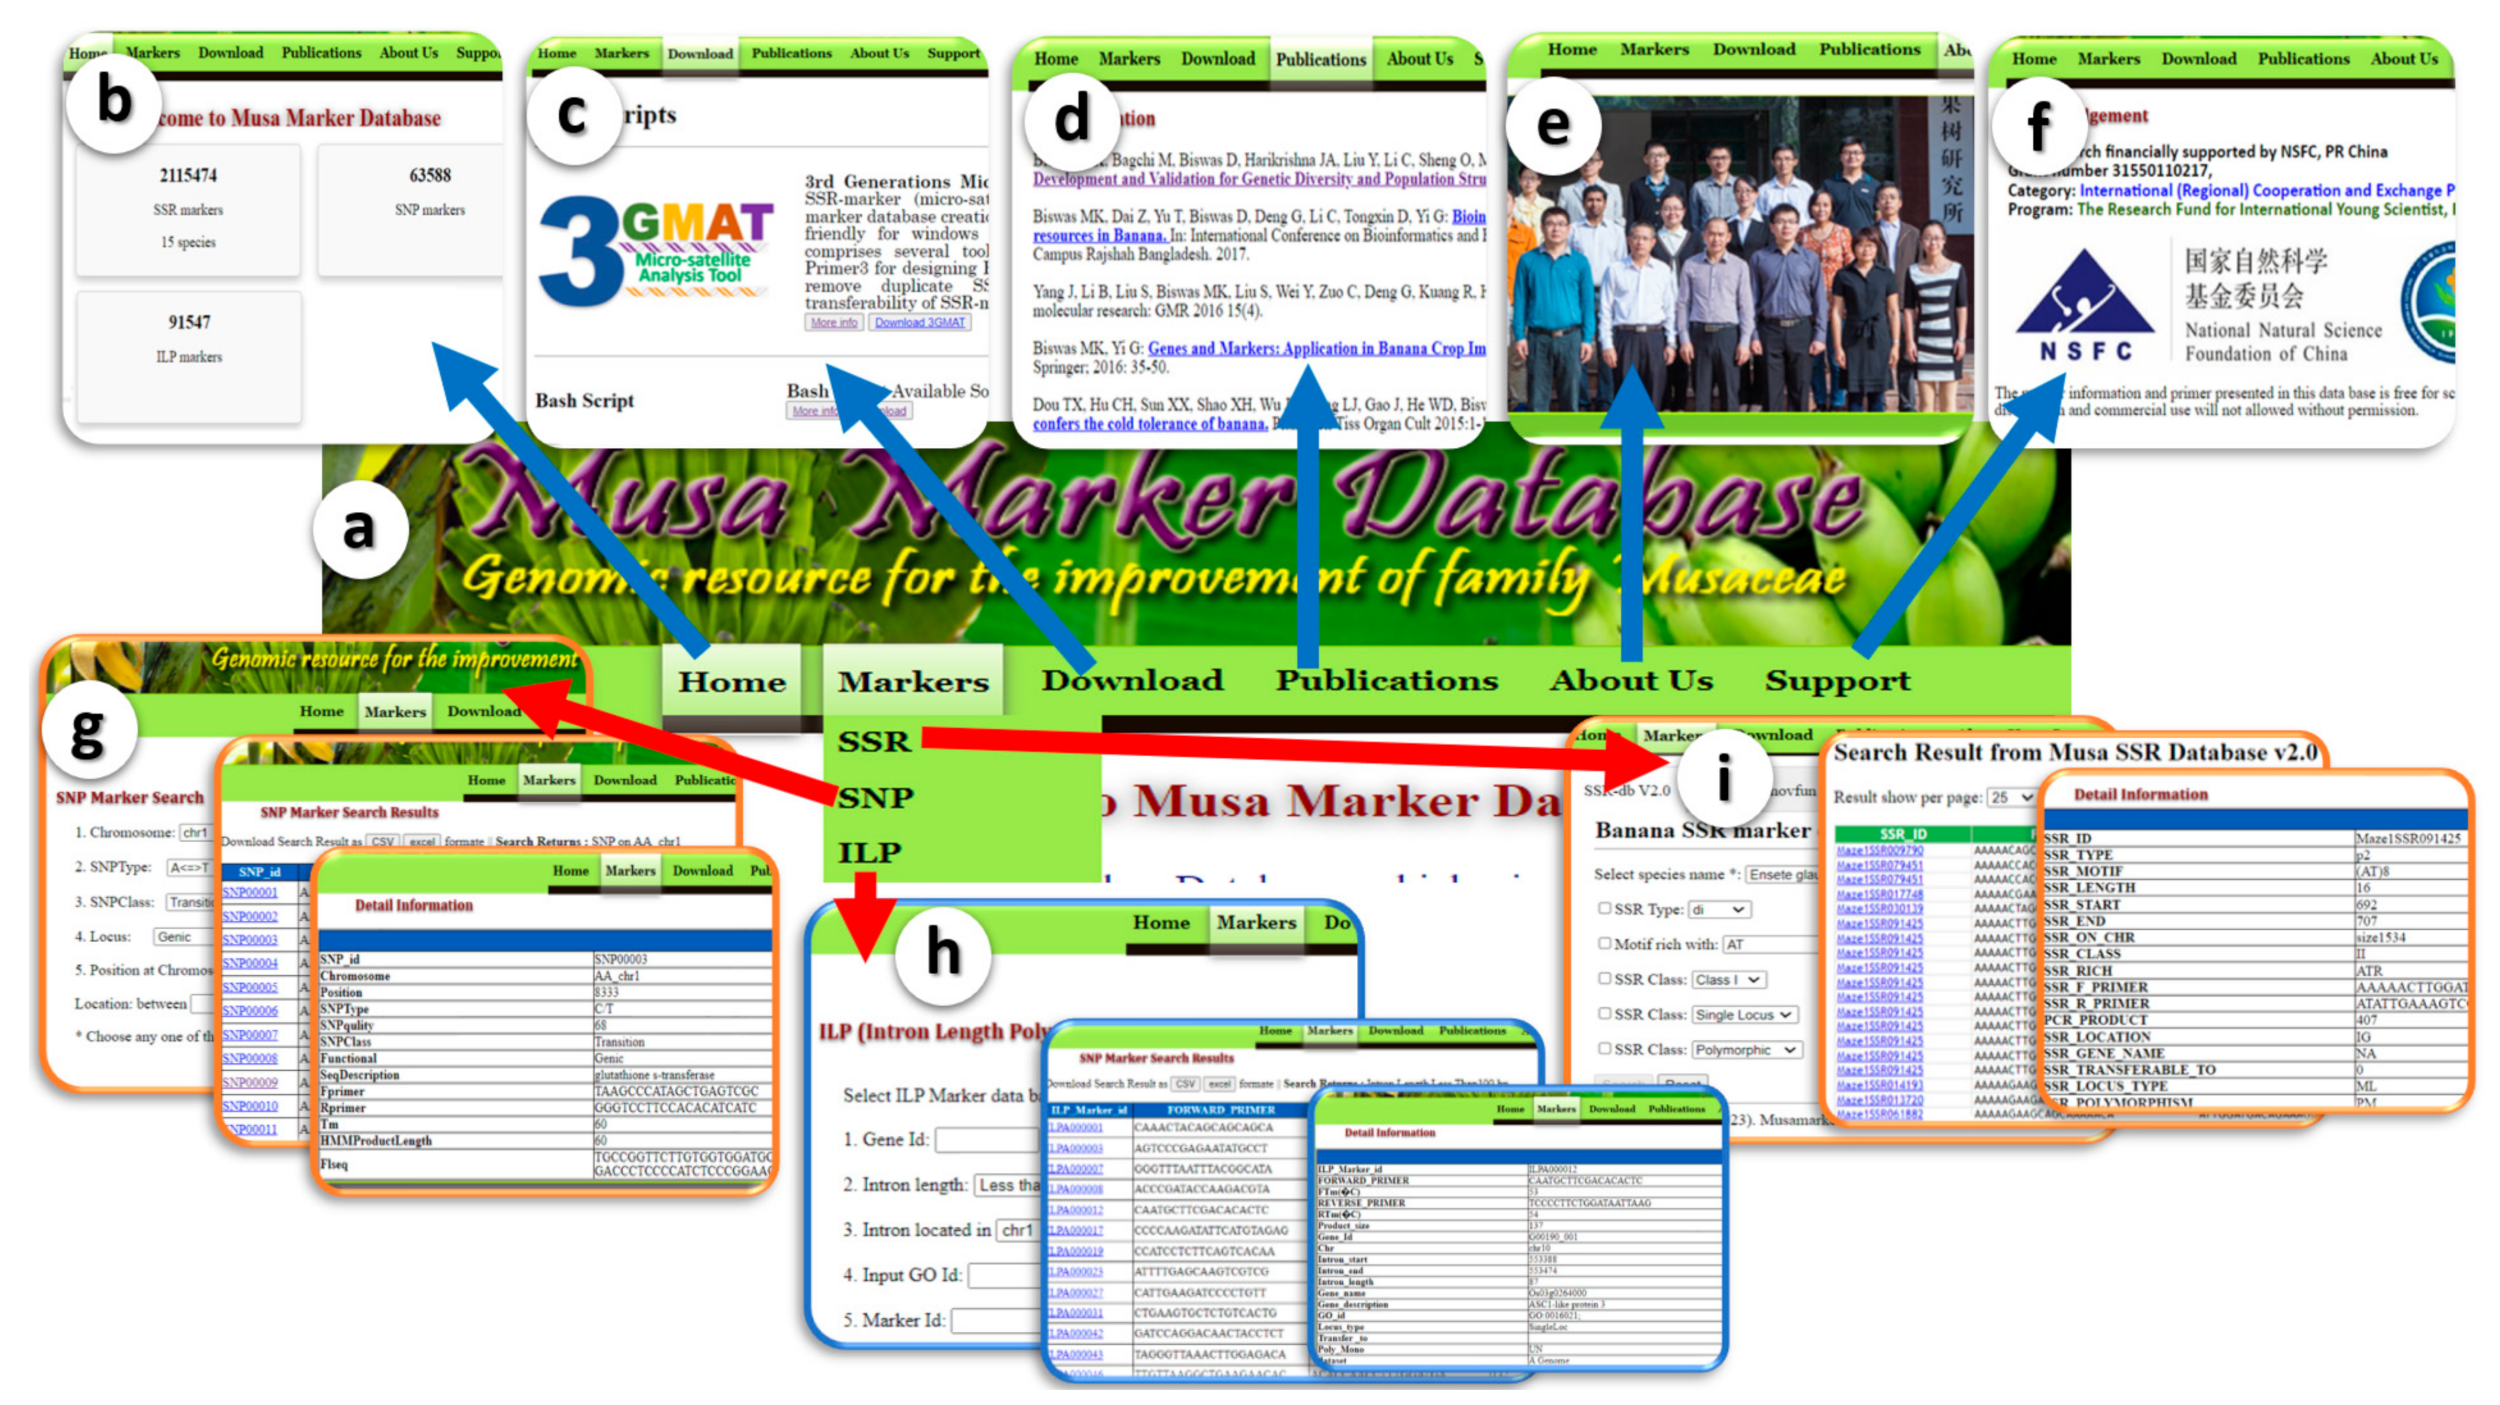
The “Home” page presents an overview of the MMdb and its potential use in banana breeding (Figure 4). The “Marker” menu lists three different marker search interfaces for SSR, SNP, and ILP primers and their information. The “Download” page comprises a list and links to downloadable data, while the “Publication” page lists research articles published by our research group. The “About” page represents information about the group members involved in building this database, while the “Support” page describes the financial support information for this project.
The SSR search interface features three tabbed menus: GW-SSR (Genome-Wide SSR Marker), Novel Functional SSR Marker Search (NFS), and SSR-db v1.0. In the “GW-SSR” tab, there are five different search criteria that users can employ either individually or in various combinations. The “NFS” search page enables users to explore SSR markers from the Functional SSR marker sets developed by Biswas et al. (2020) [34]. This search interface comprises eight individual search criteria, as illustrated in Figure 4. The third tab, SSR-db V1.0, contains SSR markers published by Biswas et al. (2015) [13]. It offers two distinct search criteria: a basic search with fourteen individual search parameters and an advanced search with seven parameters. Users can select these parameters in various combinations, empowering them to obtain more specific and tailored results.
The SNP search page features five distinct search criteria, each operating independently based on the specific characteristics of the SNP. It returns specific types of SNP information and presents each search result in a tabulated format. Each entry in the table is linked to detailed information for the associated SNP data.
The ILP search page includes five independent search criteria, aiding users in selecting the best search results from the database. Each search yields results in a tabulated format, with each data entry linked to additional details for each ILP marker.

3.3. Unique Feature of MMdb Compared with Other Existing Marker Databases

There are currently three marker databases for Musa, including the SSRome, TropGENE Database, and BanSatDb Database. A comprehensive overview of their comparative features is provided in Table S3, offering a detailed analysis and insights into the distinct attributes of each database. However, BGH and TropGENE only store Musa SNP markers, while BanSatDb presents SSR markers with very limited data and search parameters. For example, BanSatDb only includes markers from three Musa species (M. acuminata, M. balbisiana, and M. itinerans). In contrast, the MMdb offers several unique features compared to other existing Musa Marker Databases. The MMdb characterizes and classifies each marker based on various parameters, such as SSR motif size, type, location in the genome (genic, non-genic, CDS, and UTR), nucleotide base composition, chromosome position, transferability to other Musa species, and in silico prediction of PCR polymorphism. Moreover, the MMdb contains a much larger number of markers and provides up-to-date marker information for sequenced Musa species. It also offers comprehensive and user-friendly tools for exploring, downloading, and comparing various molecular markers across multiple Musa species.

3.4. Utility and Future Directions

The MMdb is a valuable resource for banana researchers and breeders. It allows users easy access to a large collection of molecular markers, including SSRs, SNPs, and ILPs, along with detailed characterization and classification information. This database can aid in marker-assisted selection, genetic diversity analysis, banana germplasm management, and genome mapping studies in Musa species. Additionally, the in silico transferability and polymorphism feature of the MMdb saves time and resources. This feature allows researchers to select the best marker set without requiring wet lab experiments.
In the future, the database could be extended to include more Musa species and additional marker types. The incorporation of functional annotation data and gene expression information could also enhance its usefulness in molecular breeding applications. Additionally, regular updates and improvements to the database interface and search features could improve user experience and make it an even more valuable tool for the Musa research community.

4. Discussion

Molecular markers play a crucial role in modern plant breeding by allowing breeders to identify and track desirable traits, evaluate genetic diversity [35,36], and develop more targeted breeding programs. These markers can speed up the breeding process by helping to select plants that are more likely to possess desirable traits, as well as aiding in the understanding of the genetic basis of complex traits and the development of molecular breeding strategies to improve these traits. Molecular markers are particularly useful in crops with long breeding cycles or complex traits that are difficult to measure directly. The availability of whole genome sequences has enabled the development of various types of molecular markers and the creation of molecular marker databases to maximize their utility [37]. In this study, a novel molecular marker database was developed from the whole genome sequences, EST, and GSS sequences of 13 Musa species. SSR, SNP, and ILP markers were mined and characterized for optimal marker data quality, resulting in the creation of a searchable Musa Marker Database that is freely accessible from the following link (www.genomicsres.org/mmdb/ accessed on 26 December 2023).
In terms of SSR analysis, our study identified a substantial number of SSRs, amounting to 2,761,190, with variable densities in the tested genomes. The prevalence of Class II SSRs (shorter than 20 bp), characterized by shorter motifs, was consistent with the previous findings in plants [37,38,39]. Furthermore, the dominance of AT-rich SSR motifs aligns with similar observations in Musa and other plant species [40,41,42]. The high percentage of successfully developed SSR markers (77%) suggests the potential for efficient marker development in these genomes. This outcome is in line with previous research demonstrating the utility of SSR markers for genetic mapping and breeding applications.
Our study’s exploration of SNP markers in genic and non-genic regions also adds to the growing body of knowledge regarding polymorphism in plant genomes. The higher occurrence of transition mutations (C↔T; A↔G) over transversions observed in both regions corresponds with studies in various plant species [43,44]. Additionally, the prevalence of Indels in non-genic regions resonates with previous reports of the non-coding regions being more prone to structural variations [45]. These findings underscore the importance of considering both genic and non-genic markers for genetic diversity and trait association studies.
Introns, noncoding regions within genes, are transcribed but subsequently spliced out during RNA processing [46]. The variability in the number and length of introns among species highlights their vital role in gene regulation. Throughout evolutionary processes, genes can gain or lose introns, contributing to genomic diversity [46,47]. Intron-based genomic variation can be used for molecular marker development. In the past decade, several studies on plant species have highlighted the utility of Intron Length Polymorphism (ILP) markers as valuable tools in molecular genetics, similar to other markers like SSRs and SNPs [48,49]. However, ILP markers offer distinct advantages, being locus-specific, co-dominant, and facilitating the accurate detection of heterozygosity. By specifically detecting polymorphisms within genic regions, ILP markers capture functionally relevant genetic variation, aiding in the identification and selection of desirable traits for crop improvement and germplasm conservation in plant breeding research [49]. To date, ILP markers have not been available for Musa species. Here, we report genome-wide ILP markers from two banana species. Our results show that the dominance of single-locus ILP markers and their high monomorphism rate (82%) are consistent with studies in other plant species [50]. However, the fact that multi-locus ILP markers are less common raises questions about their potential applications, which may differ from those of single-locus markers. Further research may be needed to explore the specific utility of multi-locus ILP markers in these genomes. It is important to note that the chromosomal distribution of ILP markers showed no significant differences between the genomes of Maml2 and Mbpkw, indicating that the genomic context does not strongly influence the distribution of these markers. This finding contrasts with some studies that have reported uneven distributions of markers across chromosomes [40,50], suggesting the need for further investigation into the underlying factors governing marker distribution.
There are three databases (SSRome, TropGENE, and BanSatDb) containing molecular markers from Musa species [23,28]. However, these databases have significant limitations, such as outdated information, inflexibility in data search criteria, and overall they are less user-friendly. They prove time consuming for data retrieval and lack crucial details, such as primer redundancy, transferability, and polymorphism information for other Musa or non-Musa species. Furthermore, there is no unique identifier for designed primers, potentially impacting reproducibility in downstream marker applications by different researchers. In contrast, the MMdb addresses these limitations, offering a user-friendly interface specifically designed to assist researchers, making it a potential model database for other plant species. The current version of the database contains six times more SSR marker data than the BanSatDb database [28]. The MMdb has a flexible five-search criteria that can use single or indifferent combinations, which leads to the user picking the best primary pairs for their research interest, this facility is absent in the BanSatDb database as well as many other SSR marker databases [25,51].
Although ILP markers have demonstrated their usefulness in plant breeding and genetics, there have been few studies aimed at developing genome-wide ILP markers and databases. One notable example is the PIP marker database, developed by Young et al. in [22], comprising 57,658 ILP markers derived from 59 plant species. However, it is noteworthy that this database does not include markers from Musa species, and presently, PIP is not accessible online, rendering data retrieval impossible. In contrast, the Foxtail millet Marker Database (FmMDb) has cataloged 96 ILP markers for the Foxtail millet genome sequences [20]. Currently, the MMdb is the largest ILP marker repository among molecular marker databases. Its ILP marker search page enables users to easily locate and download ILP markers using various flexible search criteria, representing a significant advancement over other existing marker databases.

5. Conclusions

In conclusion, the Musa Marker Database (MMdb) is a user-friendly and inclusive genomic resource for the Musaceae research community, that offers its uses to explore, download, and compare 2,115,474 SSR, 63,588 SNP, and 91,547 ILP markers from thirteen Musa species and two Ensete spp. The unique features of this database such as marker transferability, ePCR validation, and polymorphism information of each marker make it stand out from other existing marker databases. The current version of the MMdb contains a larger number of markers and up-to-date data for Musa species. This resource can be used to study genetic diversity and germplasm characterization, develop MAS strategies, perform GWAS, and compare markers across different Musa species. The database can be accessed via this link www.genomicsres.org/mmdb/ accessed on 26 December 2023.

Supplementary Materials

The following supporting information can be downloaded at: https://www.mdpi.com/article/10.3390/agronomy14040838/s1, Table S1. Summary of data and SSR mining of Musa species. Table S2. Summary of the SNP Mining and Characterization. Table S3. Comparison of the MMdb with other related databases.

Author Contributions

The work presented here was carried out in collaboration among all authors. M.K.B. was involved in SSR, SNP, and ILP analysis and database development and drafted the manuscript; D.B. wrote and managed the server to host the database; G.D. participated in SSR data analysis and revised the MS; M.K.B. and G.Y. conceived and designed the experiments. All authors have read and approved the final manuscript.

Funding

This work was financially supported by the Natural Science Foundation of China (32261160375) and supported by the earmarked fund for CARS (CARS-31).

Data Availability Statement

The original contributions presented in the study are included in the article/Supplementary Material, further inquiries can be directed to the corresponding author.

Acknowledgments

The authors express gratitude to the NSFC for awarding the International Young Scientist grant, enabling Manosh Biswas to initiate this research.

Conflicts of Interest

The authors declare no conflicts of interest.

References

  1. Christenhusz, M.J.; Byng, J.W. The number of known plants species in the world and its annual increase. Phytotaxa 2016, 261, 201–217. [Google Scholar] [CrossRef]
  2. Bebber, D.P. The long road to a sustainable banana trade. Plants People Planet 2023, 5, 662–671. [Google Scholar] [CrossRef]
  3. Maseko, K.H.; Regnier, T.; Meiring, B.; Wokadala, O.C.; Anyasi, T.A. Musa species variation, production, and the application of its processed flour: A review. Sci. Hortic. 2024, 325, 112688. [Google Scholar] [CrossRef]
  4. Vézina, A. Banana-producing countries. In INIBAP—International Network for the Improvement of Banana and Plantain; Springer: Berlin/Heidelberg, Germany, 2020; p. 19. [Google Scholar]
  5. Singh, B.; Singh, J.P.; Kaur, A.; Singh, N. Bioactive compounds in banana and their associated health benefits—A review. Food Chem. 2016, 206, 1–11. [Google Scholar] [CrossRef] [PubMed]
  6. Koul, B.S.; Jadhav, P.R.; Alex, S. Genetic Improvement of Banana. In Genetic Engineering of Crop Plants for Food and Health Security: Volume 1; Springer: Berlin/Heidelberg, Germany, 2024; pp. 305–329. [Google Scholar]
  7. Bakry, F.; Carreel, F.; Jenny, C.; Horry, J. Genetic improvement of banana. In Breeding Plantation Tree Crops: Tropical Species; Springer: Berlin/Heidelberg, Germany, 2009; pp. 3–50. [Google Scholar]
  8. Droc, G.; Martin, G.; Guignon, V.; Summo, M.; Sempéré, G.; Durant, E.; Soriano, A.; Baurens, F.; Cenci, A.; Breton, C. The banana genome hub: A community database for genomics in the Musaceae. Hortic. Res. 2022, 9, uhac221. [Google Scholar] [CrossRef] [PubMed]
  9. Crouch, J.H.; Crouch, H.K.; Ortiz, R.; Jarret, R.L. Microsatellite markers for molecular breeding of Musa. InfoMusa 1997, 6, 5–6. [Google Scholar]
  10. Kaemmer, D.; Fischer, D.; Jarret, R.L.; Baurens, F.; Grapin, A.; Dambier, D.; Noyer, J.; Lanaud, C.; Kahl, G.; Lagoda, P. Molecular breeding in the genus Musa: A strong case for STMS marker technology. Euphytica 1997, 96, 49–63. [Google Scholar] [CrossRef]
  11. Creste, S.; Benatti, T.R.; Orsi, M.R.; Risterucci, A.; Figueira, A. Isolation and characterization of microsatellite loci from a commercial cultivar of Musa acuminata. Mol. Ecol. Notes 2006, 6, 303–306. [Google Scholar] [CrossRef]
  12. Miller, R.N.; Passos, M.A.; Menezes, N.N.; Souza, M.T.; do Carmo Costa, M.M.; Rennó Azevedo, V.C.; Amorim, E.P.; Pappas, G.J.; Ciampi, A.Y. Characterization of novel microsatellite markers in Musa acuminata subsp. burmannicoides, var. Calcutta 4. BMC Res. Notes 2010, 3, 1–6. [Google Scholar] [CrossRef] [PubMed]
  13. Biswas, M.K.; Liu, Y.; Li, C.; Sheng, O.; Mayer, C.; Yi, G. Genome-wide computational analysis of Musa microsatellites: Classification, cross-taxon transferability, functional annotation, association with transposons & miRNAs, and genetic marker potential. PLoS ONE 2015, 10, e0131312. [Google Scholar]
  14. Ravishankar, K.V.; Raghavendra, K.P.; Athani, V.; Rekha, A.; Sudeepa, K.; Bhavya, D.; Srinivas, V.; Ananad, L. Development and characterisation of microsatellite markers for wild banana (Musa balbisiana). J. Hortic. Sci. Biotechnol. 2013, 88, 605–609. [Google Scholar] [CrossRef]
  15. Buhariwalla, H.K.; Jarret, R.L.; Jayashree, B.; Crouch, J.H.; Ortiz, R. Isolation and characterization of microsatellite markers from Musa balbisiana. Mol. Ecol. Notes 2005, 5, 327–330. [Google Scholar] [CrossRef]
  16. Blenda, A.; Scheffler, J.; Scheffler, B.; Palmer, M.; Lacape, J.; Yu, J.Z.; Jesudurai, C.; Jung, S.; Muthukumar, S.; Yellambalase, P. CMD: A cotton microsatellite database resource for Gossypium genomics. BMC Genom. 2006, 7, 132. [Google Scholar] [CrossRef] [PubMed]
  17. Shirasawa, K.; Isobe, S.; Tabata, S.; Hirakawa, H. Kazusa Marker DataBase: A database for genomics, genetics, and molecular breeding in plants. Breed Sci. 2014, 64, 264–271. [Google Scholar] [CrossRef]
  18. Kim, C.; Seol, Y.; Lee, D.; Jeong, I.; Yoon, U.; Lee, G.; Hahn, J.; Park, D. NABIC marker database: A molecular markers information network of agricultural crops. Bioinformation 2013, 9, 887. [Google Scholar] [CrossRef] [PubMed]
  19. Sarika; Arora, V.; Iquebal, M.A.; Rai, A.; Kumar, D. PIPEMicroDB: Microsatellite database and primer generation tool for pigeonpea genome. Database 2013, 2013, bas054. [Google Scholar] [CrossRef] [PubMed]
  20. Muthamilarasan, M.; Misra, G.; Prasad, M. FmMDb: A versatile database of foxtail millet markers for millets and bioenergy grasses research. PLoS ONE 2013, 8, e71418. [Google Scholar]
  21. Doddamani, D.; Katta, M.A.; Khan, A.W.; Agarwal, G.; Shah, T.M.; Varshney, R.K. CicArMiSatDB: The chickpea microsatellite database. BMC Bioinform. 2014, 15, 212. [Google Scholar] [CrossRef] [PubMed]
  22. Yang, L.; Jin, G.; Zhao, X.; Zheng, Y.; Xu, Z.; Wu, W. PIP: A database of potential intron polymorphism markers. Bioinformatics 2007, 23, 2174–2177. [Google Scholar] [CrossRef] [PubMed]
  23. Mokhtar, M.M.; Atia, M.A.M. SSRome: An integrated database and pipelines for exploring microsatellites in all organisms. Nucleic Acids Res. 2019, 47, D244–D252. [Google Scholar] [CrossRef] [PubMed]
  24. Xu, H.; Yu, Q.; Shi, Y.; Hua, X.; Tang, H.; Yang, L.; Ming, R.; Zhang, J. PGD: Pineapple genomics database. Hortic. Res. 2018, 5, 66. [Google Scholar] [CrossRef] [PubMed]
  25. Biswas, M.K.; Natarajan, S.; Biswas, D.; Howlader, J.; Park, J.-I.; Nou, I.-S. Lily Database: A Comprehensive Genomic Resource for the Liliaceae Family. Horticulturae 2024, 10, 23. [Google Scholar] [CrossRef]
  26. Yu, J.; Dossa, K.; Wang, L.; Zhang, Y.; Wei, X.; Liao, B.; Zhang, X. PMDBase: A database for studying microsatellite DNA and marker development in plants. Nucleic Acids Res. 2017, 45, D1046–D1053. [Google Scholar] [CrossRef] [PubMed]
  27. Droc, G.; Lariviere, D.; Guignon, V.; Yahiaoui, N.; This, D.; Garsmeur, O.; Dereeper, A.; Hamelin, C.; Argout, X.; Dufayard, J. The banana genome hub. Database 2013, 2013, bat035. [Google Scholar] [CrossRef] [PubMed]
  28. Arora, V.; Kapoor, N.; Fatma, S.; Jaiswal, S.; Iquebal, M.A.; Rai, A.; Kumar, D. BanSatDB, a whole-genome-based database of putative and experimentally validated microsatellite markers of three Musa species. Crop J. 2018, 6, 642–650. [Google Scholar] [CrossRef]
  29. Fu, L.; Niu, B.; Zhu, Z.; Wu, S.; Li, W. CD-HIT: Accelerated for clustering the next-generation sequencing data. Bioinformatics 2012, 28, 3150–3152. [Google Scholar] [CrossRef]
  30. Langmead, B.; Salzberg, S.L. Fast gapped-read alignment with Bowtie 2. Nat. Methods 2012, 9, 357–359. [Google Scholar] [CrossRef] [PubMed]
  31. Li, H.; Handsaker, B.; Wysoker, A.; Fennell, T.; Ruan, J.; Homer, N.; Marth, G.; Abecasis, G.; Durbin, R. 1000 Genome Project Data Processing Subgroup The sequence alignment/map format and SAMtools. Bioinformatics 2009, 25, 2078–2079. [Google Scholar] [CrossRef] [PubMed]
  32. Untergasser, A.; Cutcutache, I.; Koressaar, T.; Ye, J.; Faircloth, B.C.; Remm, M.; Rozen, S.G. Primer3—New capabilities and interfaces. Nucleic Acids Res. 2012, 40, e115. [Google Scholar] [CrossRef] [PubMed]
  33. Conesa, A.; Götz, S.; García-Gómez, J.M.; Terol, J.; Talón, M.; Robles, M. Blast2GO: A universal tool for annotation, visualization and analysis in functional genomics research. Bioinformatics 2005, 21, 3674–3676. [Google Scholar] [CrossRef] [PubMed]
  34. Biswas, M.K.; Nath, U.K.; Howlader, J.; Bagchi, M.; Natarajan, S.; Kayum, M.A.; Kim, H.; Park, J.; Kang, J.; Nou, I. Exploration and exploitation of novel SSR markers for candidate transcription factor genes in Lilium species. Genes 2018, 9, 97. [Google Scholar] [CrossRef] [PubMed]
  35. Salgotra, R.K.; Chauhan, B.S. Genetic diversity, conservation, and utilization of plant genetic resources. Genes 2023, 14, 174. [Google Scholar] [CrossRef] [PubMed]
  36. Dida, G. Molecular Markers in Breeding of Crops: Recent Progress and Advancements. J. Microbiol. Biotechnol. 2022, 7. [Google Scholar] [CrossRef]
  37. Savadi, S.; Muralidhara, B.M.; Venkataravanappa, V.; Adiga, J.D. Genome-wide survey and characterization of microsatellites in cashew and design of a web-based microsatellite database: CMDB. Front. Plant Sci. 2023, 14, 1242025. [Google Scholar] [CrossRef]
  38. Singh, J.; Sharma, A.; Sharma, V.; Gaikwad, P.N.; Sidhu, G.S.; Kaur, G.; Kaur, N.; Jindal, T.; Chhuneja, P.; Rattanpal, H.S. Comprehensive genome-wide identification and transferability of chromosome-specific highly variable microsatellite markers from citrus species. Sci. Rep. 2023, 13, 10919. [Google Scholar] [CrossRef] [PubMed]
  39. Biswas, M.K.; Darbar, J.N.; Borrell, J.S.; Bagchi, M.; Biswas, D.; Nuraga, G.W.; Demissew, S.; Wilkin, P.; Schwarzacher, T.; Heslop-Harrison, J.S. The landscape of microsatellites in the enset (Ensete ventricosum) genome and web-based marker resource development. Sci. Rep. 2020, 10, 15312. [Google Scholar] [CrossRef] [PubMed]
  40. Zhang, Z.; Min, X.; Wang, Z.; Wang, Y.; Liu, Z.; Liu, W. Genome-wide development and utilization of novel intron-length polymorphic (ILP) markers in Medicago sativa. Mol. Breed. 2017, 37, 87. [Google Scholar] [CrossRef]
  41. Zhang, J.; Liu, T.; Rui, F. Development of EST-SSR markers derived from transcriptome of Saccharina japonica and their application in genetic diversity analysis. J. Appl. Phycol. 2018, 30, 2101–2109. [Google Scholar] [CrossRef]
  42. Liu, S.; An, Y.; Li, F.; Li, S.; Liu, L.; Zhou, Q.; Zhao, S.; Wei, C. Genome-wide identification of simple sequence repeats and development of polymorphic SSR markers for genetic studies in tea plant (Camellia sinensis). Mol. Breed 2018, 38, 59. [Google Scholar] [CrossRef]
  43. Liu, Q.; Chang, S.; Hartman, G.L.; Domier, L.L. Assembly and annotation of a draft genome sequence for Glycine latifolia, a perennial wild relative of soybean. Plant J. 2018, 95, 71–85. [Google Scholar] [CrossRef]
  44. Kaur, B.; Mavi, G.S.; Gill, M.S.; Saini, D.K. Utilization of KASP technology for wheat improvement. Cereal Res. Commun. 2020, 48, 409–421. [Google Scholar] [CrossRef]
  45. Li, B.; Zhang, N.; Wang, Y.; George, A.W.; Reverter, A.; Li, Y. Genomic prediction of breeding values using a subset of SNPs identified by three machine learning methods. Front. Genet. 2018, 9, 237. [Google Scholar] [CrossRef] [PubMed]
  46. Berget, S.M.; Moore, C.; Sharp, P.A. Spliced segments at the 5′ terminus of adenovirus 2 late mRNA. Proc. Natl. Acad. Sci. USA 1977, 74, 3171–3175. [Google Scholar] [CrossRef] [PubMed]
  47. Jeffares, D.C.; Mourier, T.; Penny, D. The biology of intron gain and loss. Trends Genet. 2006, 22, 16–22. [Google Scholar] [CrossRef] [PubMed]
  48. Li, J.; Yang, Y.; Sun, X.; Liu, R.; Xia, W.; Shi, P.; Zhou, L.; Wang, Y.; Wu, Y.; Lei, X. Development of Intron Polymorphism Markers and Their Association with Fatty Acid Component Variation in Oil Palm. Front. Plant Sci. 2022, 13, 885418. [Google Scholar] [CrossRef] [PubMed]
  49. Sharma, H.; Bhandawat, A.; Rahim, M.S.; Kumar, P.; Choudhoury, M.P.; Roy, J. Novel intron length polymorphic (ILP) markers from starch biosynthesis genes reveal genetic relationships in Indian wheat varieties and related species. Mol. Biol. Rep. 2020, 47, 3485–3500. [Google Scholar] [CrossRef]
  50. Wang, X.; Zhao, X.; Zhu, J.; Wu, W. Genome-wide investigation of intron length polymorphisms and their potential as molecular markers in rice (Oryza sativa L.). DNA Res. 2005, 12, 417–427. [Google Scholar] [CrossRef] [PubMed]
  51. Duhan, N.; Kaur, S.; Kaundal, R. ranchSATdb: A Genome-Wide Simple Sequence Repeat (SSR) Markers Database of Livestock Species for Mutant Germplasm Characterization and Improving Farm Animal Health. Genes 2023, 14, 1481. [Google Scholar] [CrossRef] [PubMed]
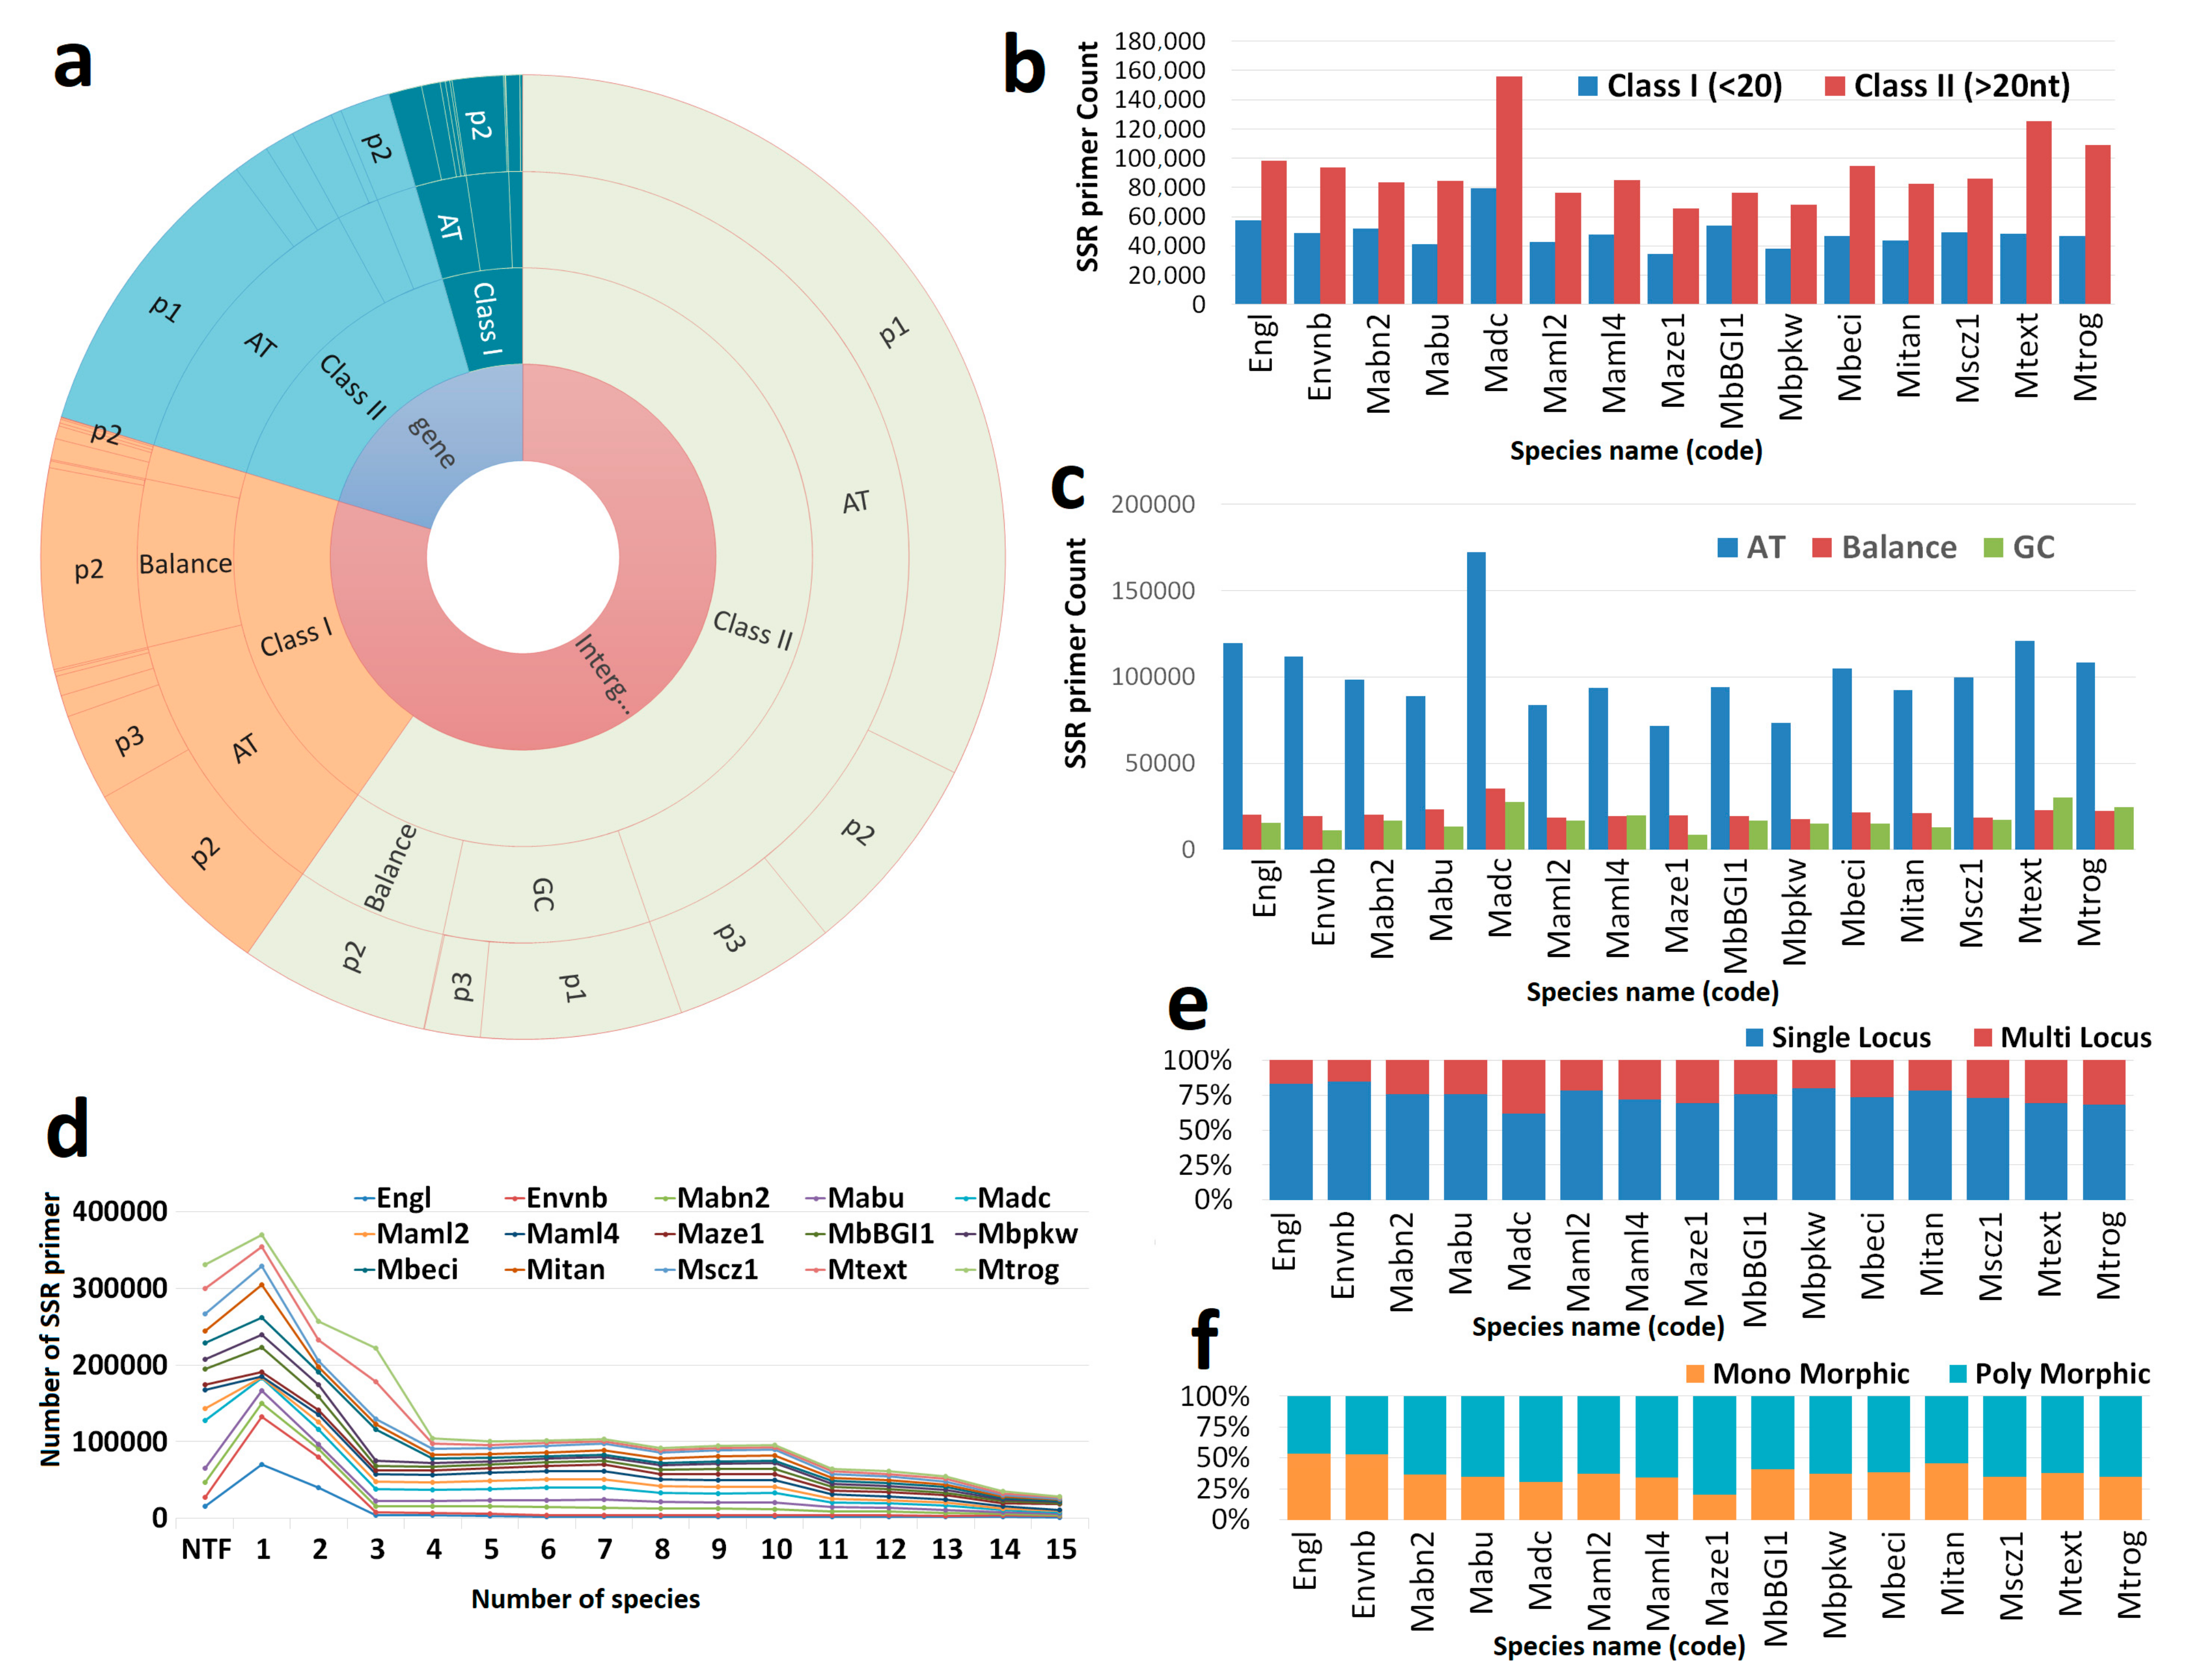
Figure 1. SSR marker development and characterization: (a) shows the distribution of Simple Sequence Repeats (SSRs) in different gene locations, divided into categories like Class I and Class II. We have further categorized these SSRs based on their richness (AT, Balanced, and GC) and displayed the specific motifs (mono to hexa) associated with them; (b) depicts the distribution of Class I and Class II SSR markers among Musa and Ensete species; (c) demonstrates the distribution of motif richness within SSR markers among Musa and Ensete species; (d) offers a comparative analysis of SSR marker transferability among different species; (e) illustrates the distribution of single-locus and multi-locus SSR markers among Musa and Ensete species; and (f) presents the distribution of polymorphic and monomorphic SSR markers among Musa and Ensete species.
Agronomy 14 00838 g001
Figure 2. SNP maker mining and characterization. (a) distribution of different class of SNP, (b) distribution of SNP in genetic and non-genic regions, and (c) distribution of SNP types, classed among the genic and non-genic regions.
Agronomy 14 00838 g002
Figure 3. ILP marker development and characterization: (a) comparative distribution of single-locus and multi-locus ILP markers in two banana species; (b) distribution of polymorphic and monomorphic ILP markers in two banana species; and (c) chromosome-level distribution of ILP markers.
Agronomy 14 00838 g003
Figure 4. A comprehensive snapshot of the Musa Marker Database (MMdb) user interface, showcasing key functionalities: (a) main menu with links to various sections, (b) homepage overview, (c) download page, (d) publications, (e) research group members, (f) funding sources, (g) SNP marker search interface with results and details, (h) detailed ILP search page, and (i) SSR marker search interface with results and details (www.genomicsres.org/mmdb/ accessed on 26 December 2023).
Agronomy 14 00838 g004
Table 1. Summary of Genome-wide SSR Mining, Marker Development, and Characterizations in Musa and Ensete Species.
List of the Genome Genome CodeTotal
Number of SSR
Primer Design
(Count)
%
Musa acuminata banksiiMabn2183,911135,18774
Musa acuminata Dwarf_CavendishMadc267,698235,21188
Musa acuminata burmannicaMabu141,919125,94689
Musa acuminata malaccensis V2Maml2147,255118,83481
Musa acuminata malaccensis V4Maml4185,328132,72172
Musa acuminata zebrinaMaze1111,705100,18290
Musa balbisiana BGI11MbBGI1320,858130,37741
Musa balbisiana pkwMbpkw131,403106,30281
Musa beccariiMbeci181,767141,46678
Musa itineransMitan151,683126,10783
Musa schizocarpaMscz1178,889135,55676
Musa textilisMtext215,660173,84081
Musa troglodytarumMtrog197,524155,70179
Ensete glaucumEngl181,817155,50886
Ensete ventricosum BedadetiEnvnb163,773142,53687
Total 2,761,1902,115,47477
Disclaimer/Publisher’s Note: The statements, opinions and data contained in all publications are solely those of the individual author(s) and contributor(s) and not of MDPI and/or the editor(s). MDPI and/or the editor(s) disclaim responsibility for any injury to people or property resulting from any ideas, methods, instructions or products referred to in the content.