Article

An Optimized Protocol for Comprehensive Evaluations of Salt Tolerance in Crop Germplasm Accessions: A Case Study of Tomato (Solanum lycopersicum L.)

1
College of Horticulture, Nanjing Agricultural University, Nanjing 210095, China
2
Key Laboratory of Biology and Germplasm Enhancement of Horticultural Crops in East China, Ministry of Agriculture and Rural Affairs, Nanjing 210095, China
3
Department of Agronomy and Horticulture, Jiangsu Vocational College of Agriculture and Forestry, Jurong City 212400, China
*
Authors to whom correspondence should be addressed.
Agronomy 2024, 14(4), 842; https://doi.org/10.3390/agronomy14040842
Submission received: 19 March 2024 / Revised: 2 April 2024 / Accepted: 15 April 2024 / Published: 17 April 2024

Abstract

:
The comprehensive evaluation of crop germplasm serves to scientifically and objectively assess the quality of different genetic accessions against certain standards. Here, we propose an optimized approach to enhance the result’s stability when assessing salt tolerance in crop germplasm. This protocol was applied to a case study involving 249 tomato genotypes, systematically refining the processes involved in constructing an evaluation index system, data preprocessing, statistical method selection, and weight calculation. The optimization process reduced the system variance of salt tolerance evaluation results and achieved an 85.42% concordance with a classical approach, across a tomato population covering 241 genotypes, suggesting the improved stability and high accuracy of the optimized protocol. Moreover, an 83.82% consistency rate between pre- and post-optimization results also suggested the high accuracy of the optimized protocol. The enhanced stability was further confirmed by a secondary validation on a subpopulation (covering 39 genotypes), which demonstrated a consistency rate of 83.87% between the two populations. The study identified 8.43% of the evaluated germplasm as salt-tolerant accessions, providing valuable parental materials for breeding programs. The findings underscore the potential of our protocol for the precise identification of stress-resistant germplasm, contributing to the development of stress-tolerant crop varieties.

1. Introduction

Soil salinization is a global issue that affects agriculture and the environment [1]. Statistics indicate that approximately 7% of the Earth’s surface soils are currently salt-affected, with the area of saline-alkali land increasing by 10% annually [2,3]. Developing salt-tolerant crops and managing saline soils are critical strategies for utilizing saline lands and mitigating the damage caused by salinity [4,5]. In response to the escalating severity of global soil salinization, the breeding and application of salt-tolerant crops are garnering growing attention worldwide [6,7]. To meet this challenge, conducting precise and scientific comprehensive evaluations of plant germplasm for salt tolerance, followed by the selection and creation of salt-tolerant germplasm accessions, is a pivotal research endeavor.
Multi-Index Comprehensive Evaluation (MICE) provides a holistic and integrated assessment of a subject according to specific objectives, and is divided into objective and subjective evaluations [8,9]. Within the objective evaluation methods, statistical dimensionality reduction methods (SDRMs) are further subdivided into principal component analysis (PCA) and factor analysis (FA) methods [6,10,11,12]. They allocate index weights based on eigenvalue and variance contribution, condensing multiple variables into fewer composite indicators. The simplicity and comparability of composite indicators have led to their broad application across diverse research fields [9]. As a result, SDRMs have become some of the most popular methods in the evaluation of salt tolerance [11,13]. However, the existing comprehensive evaluation methods still confront challenges of result instability stemming from parameter changes, sample adjustments, or local value shifts within parameters [11,12]. Comprehensive evaluation is a systematic and intricate task that involves establishing an evaluation index system, data preprocessing, determining indicator weights, and analyzing results [14,15]. The proper management of these steps is crucial to ensuring the reliability and stability of the comprehensive evaluation outcomes, particularly in assessments of salt tolerance.
Tomato (Solanum lycopersicum L.), a member of the Solanaceae family, is widely treasured for its strong adaptability, high yield, rich nutrition, and unique flavor, making it one of the most popular vegetables globally [16,17]. In 2022, the global tomato areas harvested reached 4.92 million hectares, with a total production of 186.12 million tons and a gross production value of 130.81 billion US dollars [17]. Additionally, tomatoes serve as a model plant for studying economically important traits, such as fruit development and flavor quality [18,19]. Nonetheless, as a moderately salt-sensitive crop, common tomato varieties typically exhibit limited salt tolerance [20,21]. Rising soil salinity levels have led to significant tomato yield losses, amounting to billions of dollars annually. In recent years, with the widespread adoption of tray seedling technology, many countries and regions have transitioned to transplanting seedlings for tomato production, significantly reducing salt stress during the germination stage [22]. Consequently, the seedling stage has become the primary phase affected by salt stress. Under salt stress, tomato plant growth, root development, and yield are all compromised [21,23]. Therefore, identifying salt-tolerant tomato germplasm and generating new germplasm—especially those tolerant at the seedling stage—is of paramount importance for improving tomato yield and quality. Research has illustrated that differences in genetic background, experimental conditions, treatment methods, and growth stages of tomatoes, coupled with the complexity of salt tolerance mechanisms, often lead to diverse salt tolerance evaluation methods and evaluation index systems—a phenomenon widely observed in research on salt tolerance and other stress resistance in various crops [1,20,24,25,26]. This variability results in two predominant issues: (1) the challenge of directly comparing comprehensive evaluation results across different studies; and (2) the poor stability of evaluation results for the same material within different studies. Thus, developing an objective, accurate, and stable salt tolerance evaluation system that accommodates these myriad factors is a meritorious research pursuit.
In this study, we optimized the key steps in the comprehensive evaluation process for salt tolerance using 249 tomato genotypes based on SDRMs, aiming to improve the stability of the evaluation outcomes while preserving high accuracy. The study’s results were further validated with a subpopulation comprising 39 genotypes. Finally, salt tolerance disparities among tomato subgroup were discussed. These results are crucial for expediting the process of the precise identification of salt tolerance in crop germplasm and for the development of new salt-tolerant germplasm.

2. Materials and Methods

2.1. Plant Materials

A total of 249 tomato genotypes, including wild tomatoes and cultivars, were selected as materials for this study. Of these, 6 genotypes were categorized as wild tomatoes, 33 as landraces, 99 as cherry tomatoes, 17 as heirlooms, 65 as fresh market tomatoes, and 29 as processed tomatoes. Landraces refer to the Latin American cultivars, while cherry tomatoes are often referred to as S. lycopersicumcerasiforme’. Heirlooms (sometimes referred to as vintage accessions) represent early tomato selections. Fresh market and processed germplasm represent contemporary accessions (i.e., modern accessions). All tomato germplasm accessions were provided by the Laboratory of Vegetable Physiology and Ecology, Nanjing Agricultural University (Nanjing City, China). The passport details of these genotypes are presented in Supplementary Table S1.

2.2. Material Cultivation and Treatment

Tomato seeds were sown in 72-hole cavity trays filled with a substrate blend (grass charcoal, vermiculite, and perlite; volume ratio = 2:1:1). The average daytime temperature was maintained at 27 ± 2 °C, and the average nighttime temperature at 16 ± 2 °C. Upon the emergence of the third true leaf, uniformly sized, healthy seedlings were selected for root washing before being transplanted into 32-hole trays containing quartz sand. The seedlings were housed in containers measuring 54 cm × 28 cm × 6 cm, each holding 1.5 L of Hoagland’s solution (pH 6.5 ± 0.1, EC 1.3–1.4 mS·cm−1), which was refreshed thrice weekly.
At the 5–6th true leaf stage, uniformly sized, healthy seedlings were selected for the experiments. Each tomato genotype was divided into control and saline-treated groups, continuing to grow in quartz sand with designated nutrient solutions in 32-hole trays. Controls were watered with a salt-free solution, while the treatments received a 200 mM sodium chloride (NaCl, Guangdong Guanghua Sci-Tech Co., Ltd., Shantou city, China) solution (pH 6.4 ± 0.1, EC 22.7 mS·cm−1), whose doses were determined based on prior research and preliminary experiments conducted in our laboratory [23,27]. There were three replicates, each with eight seedlings, arranged in a randomized block design, and nutrient solutions were renewed every three days.

2.3. Measurement Items and Methods

2.3.1. Morphological Indices and Biomass Measurement

Leaf number (LN) was recorded, plant height (PH), leaf length and width (LL and LW) were measured with a ruler, and stem diameter (D) with Vernier calipers. Plants were washed, blotted to remove surface water, and weighed to determine the fresh weight of the roots (RF), shoots (SF), and the entire plant (FF). After wilting at 105 °C for 30 min and drying at 75 °C for 72 h, the dry weights of the shoots (SD), roots (RD), and total plant (FD) were recorded. Data were averaged from three replicates with two plants each.

2.3.2. Chlorophyll (Chl) and Chl a Fluorescence (Fv/Fm) Determination

The mean Chl estimate of leaves (SPAD) was measured with a Minolta Chl Meter SPAD-502 (Minolta, Osaka, Japan). The method proposed by Chen et al. [28] was used to quantify Chl a fluorescence (Fv/Fm). Fv/Fm measurements were conducted using a pulse amplitude modulation (Imaging-PAM) Chl fluorescence instrument (Heinz Walz GmbH, Effeltrich, Nürnberg, Germany).

2.3.3. Determination of Index of Salinity Damage (IS) and Salt Tolerance Coefficient (STC)

The classification of tomato salt damage levels is shown in Table S2 and Figure S1. The IS was calculated as the sum of (damage level value × the corresponding number of plants at that damage level) divided by (total number of plants × the highest damage level value). The performance of all genotypes for the aforementioned traits, except the IS, under salt stress, was compared with their performance under control conditions to obtain the percent change in performance due to salt stress. The percent change was defined as the STC, which was used for subsequent analysis [6].

2.4. Optimization of Comprehensive Evaluation Analysis for Salt Tolerance of Crop Germplasm

2.4.1. Optimization of the Evaluation Index System Construction Process

An evaluation index system is established by determining evaluation index attributes and choosing appropriate evaluation indicators.
(1)
Identification of Evaluation Indicators. Based on the attributes and range of the STCs for each indicator, evaluation indicators are identified. These indicators are further categorized into positive and negative indicators. Positive indicators directly reflect the plant’s salt tolerance, with higher values signifying stronger tolerance. Conversely, negative indicators inversely reflect salt tolerance. The STCs of evaluation indicators typically range from 0 to 1. Except for evaluation indicators, other indicators are generally classified as descriptive indicators.
(2)
Filtering of Irrelevant Variables. The presence of irrelevant variables can affect the accuracy of salt tolerance identification. Thus, identifying and filtering out irrelevant variables is crucial. Using analysis of variance (ANOVA) within K-means clustering analysis, all evaluation indicators are tested, and those with significant value less than 0.05 are utilized for subsequent comprehensive evaluations of salt tolerance.

2.4.2. Data Preprocessing and Selection of SDRM

Data homogenization and dimensionless processing are critical before comprehensive evaluations [9,29]. A positive treatment for the negative indexes was performed before PCA or FA [30]. By applying the reverse membership function, negative evaluation indicators are normalized [31]. In this study, relative values serve as the STCs, eliminating the need for dimensionless processing and simplifying the preprocessing as different parameters do not have magnitude or unit disparities. PCA or FA, as commonly used SDRMs, transform individual indicators into composite indicators [8]. PCA is preferred for dimensionality reduction, while FA is required if the interpretation of obtained principal components is unclear [15].

2.4.3. Optimization of the Weight Calculation Process

To compare the differences in comprehensive scores from different weight calculation methods, two weighting methods are utilized [6,32]. Method 1: The weights of each composite indicator are based on the variance contribution rate of the indicator. After standardizing composite indicators using the membership function method, comprehensive scores for all germplasm materials are calculated by combining their respective weights. Method 2: The weights are based on the eigenvalues of the composite indicators. Comprehensive scores are obtained by multiplying the square root of the arithmetic mean of the eigenvalues with their respective indicator values, and then the weights of the composite indicators. The sum of the products for each indicator yields the comprehensive score.

2.5. Stability of Comprehensive Evaluations Result

The stability of comprehensive evaluation results is defined by the variance of fluctuations (σs2) due to changes in the indicator system, sample adjustments, or local numerical variations. A higher σs2 indicates greater volatility and reduced stability of the evaluation results. The weight matrix for each indicator is denoted as W = (w1, w2, …, wn), while WT is its transpose. The covariance matrix between indicators is represented by Σ. The σs2 of the comprehensive evaluation results is calculated as σs2 = WTΣW [14,33].

2.6. Concordance of Comprehensive Evaluations Result

A correlation analysis and side sameness analysis for concordance were conducted for the comparison regarding the concordance between the newly proposed approach and the classical DR-PCA approach, traditionally used for assessing salt tolerance, as described by Sun et al. [30]. The side sameness (S) was computed as S = (X + Y)/(0.4 M), where, “X” and “Y” represent the number of tomato genotypes that both the optimized protocol and the DR-PCA approach have in common within the top and bottom 20% for salt tolerance, respectively. “M” signifies the total count of tomato genotypes analyzed. The value of “S” varies from 0 to 1, with higher values indicating greater concordance between the two approaches [30].

2.7. Data Statistics and Analysis

Data were organized using Microsoft Excel 2019 (Redmond, WA, USA), and plots were created with Origin 2021 (Northampton, MA, USA). Descriptive analysis, correlation analysis, PCA, and FA of different traits in tomato genotypes were conducted using IBM SPSS 20 (Chicago, IL, USA). The range, maximum, minimum, mean, standard deviation, and coefficient of variation were calculated. Duncan’s multiple comparison test was employed to determine the significance of differences. A standardization of the STCs or the comprehensive scores was performed, followed by systematic clustering analysis using Origin 2021 software. A hierarchical clustering analysis of salt tolerance was carried out using either the complete linkage or the average linkage method.

3. Results

3.1. Analysis of Morphological Differences and Salt Tolerance Traits in Tomato Germplasm

3.1.1. Salt-Induced Morphological Differences

Salinity tolerance is the genotypic capability of a plant to sustain growth under saline conditions over time. With 19 days of exposure to salt stress, diverse morphological responses were observed among different tomato accessions. All tomato varieties exhibited a reduction in PH, with variations in leaf color and overall plant vigor. Typically, salt-tolerant plants exhibited fade in upper or lower leaves, with some even showing darkening in the upper leaves (Figure S1B,C). In contrast, salt-sensitive genotypes were stunted, with either new leaves becoming pale/bleached or old leaves turning yellow/shedding. Highly sensitive genotypes displayed severe growth arrest, overall yellowing, and even withering or death (Figure S1D–F).

3.1.2. Salt Tolerance Trait Analysis

The descriptive statistical analysis of the IS and the STCs of other parameters revealed that all parameters approximated a normal distribution (Figure S2). The variation ranges for parameters such as PHR, FFR, SFR, RFR, FDR, SDR, and RDR, as well as IS were between 0.0–1.0. However, the ranges for parameters such as SPADR, DSRR, FSRR, and FDWR extended beyond the 0.0–1.0 range (Table 1). The mean values of all STCs were less than 1.0, indicating that salt stress had a significant inhibitory effect on them, particularly on PH and biomass. The reduction in shoot biomass was more pronounced than that in roots, as evidenced by the STCs for the shoot-to-root ratio being below 1.0.

3.2. Optimization of the Comprehensive Evaluation Process

3.2.1. Analysis of the Construction of the Evaluation Index System

Pursuant to the optimization strategy outlined in Section 2.4.1, we screened traits and identified evaluation indicators, including PHR, SFR, RFR, FFR, SDR, RDR, FDR, and IS, as detailed in Table 1. Setting the cluster number at five, an ANOVA was employed to assess the eight aforementioned indicators. The results revealed that the significance level for all indices was below 0.01 (Table S3), indicating their highly significant contribution to the classification. Consequently, these eight variables were deemed suitable for the subsequent comprehensive evaluation of salt tolerance.

3.2.2. Analysis of Data Preprocessing and Dimensionality Reduction Method Selection

Correlation analysis indicated a highly significant correlation among the eight assessment indicators, with the IS exhibiting a highly significant negative correlation with the other STCs (Figure S3A). Following the inversion of the IS values, we obtained the reversed IS. Subsequently, we conducted a PCA using both the STCs and the reversed IS. The first three principal components accounted for 89.22% of the total variance, suggesting they effectively encapsulated most of the original data (Table 2). The component matrix demonstrated clear definitions for the three components, endorsing the direct application of this PCA in subsequent comprehensive evaluations (Table 2).

3.2.3. Analysis of Index Weight Calculation

We applied two distinct weighting methods—one based on the variance contribution rate and the other on eigenvalues—to calculate comprehensive scores for the 241 tomato germplasm accessions, confirming their relation (Materials and Methods, Section 2.4.3). The analyses showed a robust linear correlation between the two sets of scores (R2 = 0.992, Figure S4), indicating that both methods yield consistent comprehensive evaluations. Each individual indicator showed a significant positive correlation with the comprehensive scores, illustrating that these scores were reliable reflections of plant phenotypes and salt tolerance under stress (Figure S3B). Both methods consistently identified NX52 (NT175) as the highest and NX212 (NT638) as the lowest in terms of comprehensive scores (Table S4). Consequently, for the following evaluation process, we exclusively employed Method 1 (Materials and Methods, Section 2.4.3) for calculating the index weights to derive the comprehensive score.

3.3. Stability and Accuracy Analysis of Comprehensive Evaluation Results of the Optimized Protocol

3.3.1. Stability and Concordance Analysis of Comprehensive Evaluation Results

The validity of a comprehensive evaluation is gauged by the stability of its result and its accuracy in reflecting the actual state of the subject. The σs2 was used to measure the result’s stability, with higher values indicating less stability. The post-optimization results indicated a reduction in system variance (from 0.0969 to 0.0165), suggesting the improved stability of the evaluation results after optimization (Table S5). The accuracy of the optimized protocol was assessed by the comparison regarding the concordance between the optimized approach and the classical approaches (DR-PCA) traditionally used for assessing salt tolerance. A notable correlation was observed between the post-optimization results and those obtained through the classical DR-PCA approach, showcasing a correlation coefficient of up to 0.963 (Figure S5). The analysis of side sameness further demonstrated that the concordance in evaluation results between the two approaches achieved an impressive rate of 85.42% (Figure S5). These findings underscored the credibility of the evaluation results yielded by the newly proposed approach.

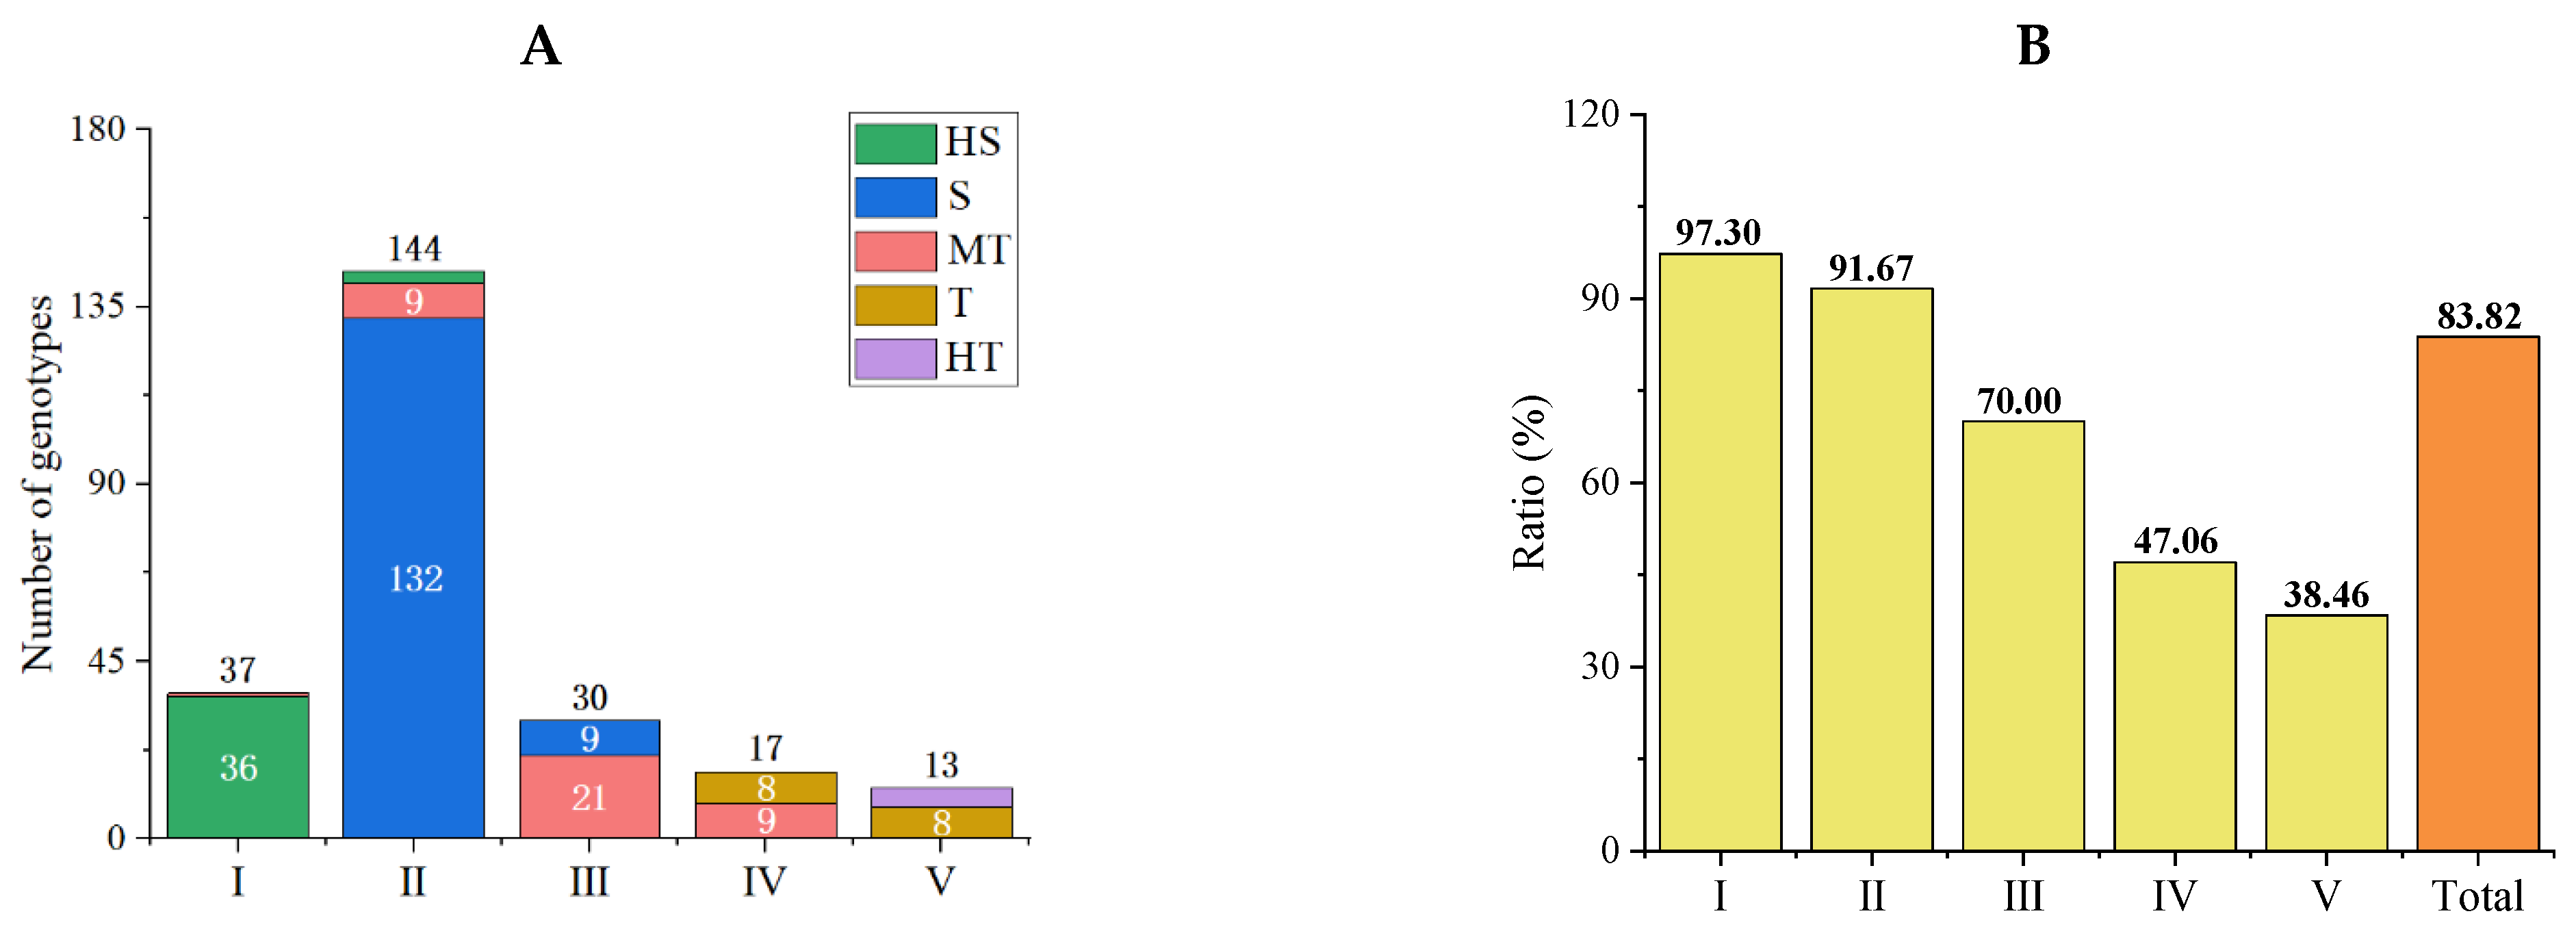
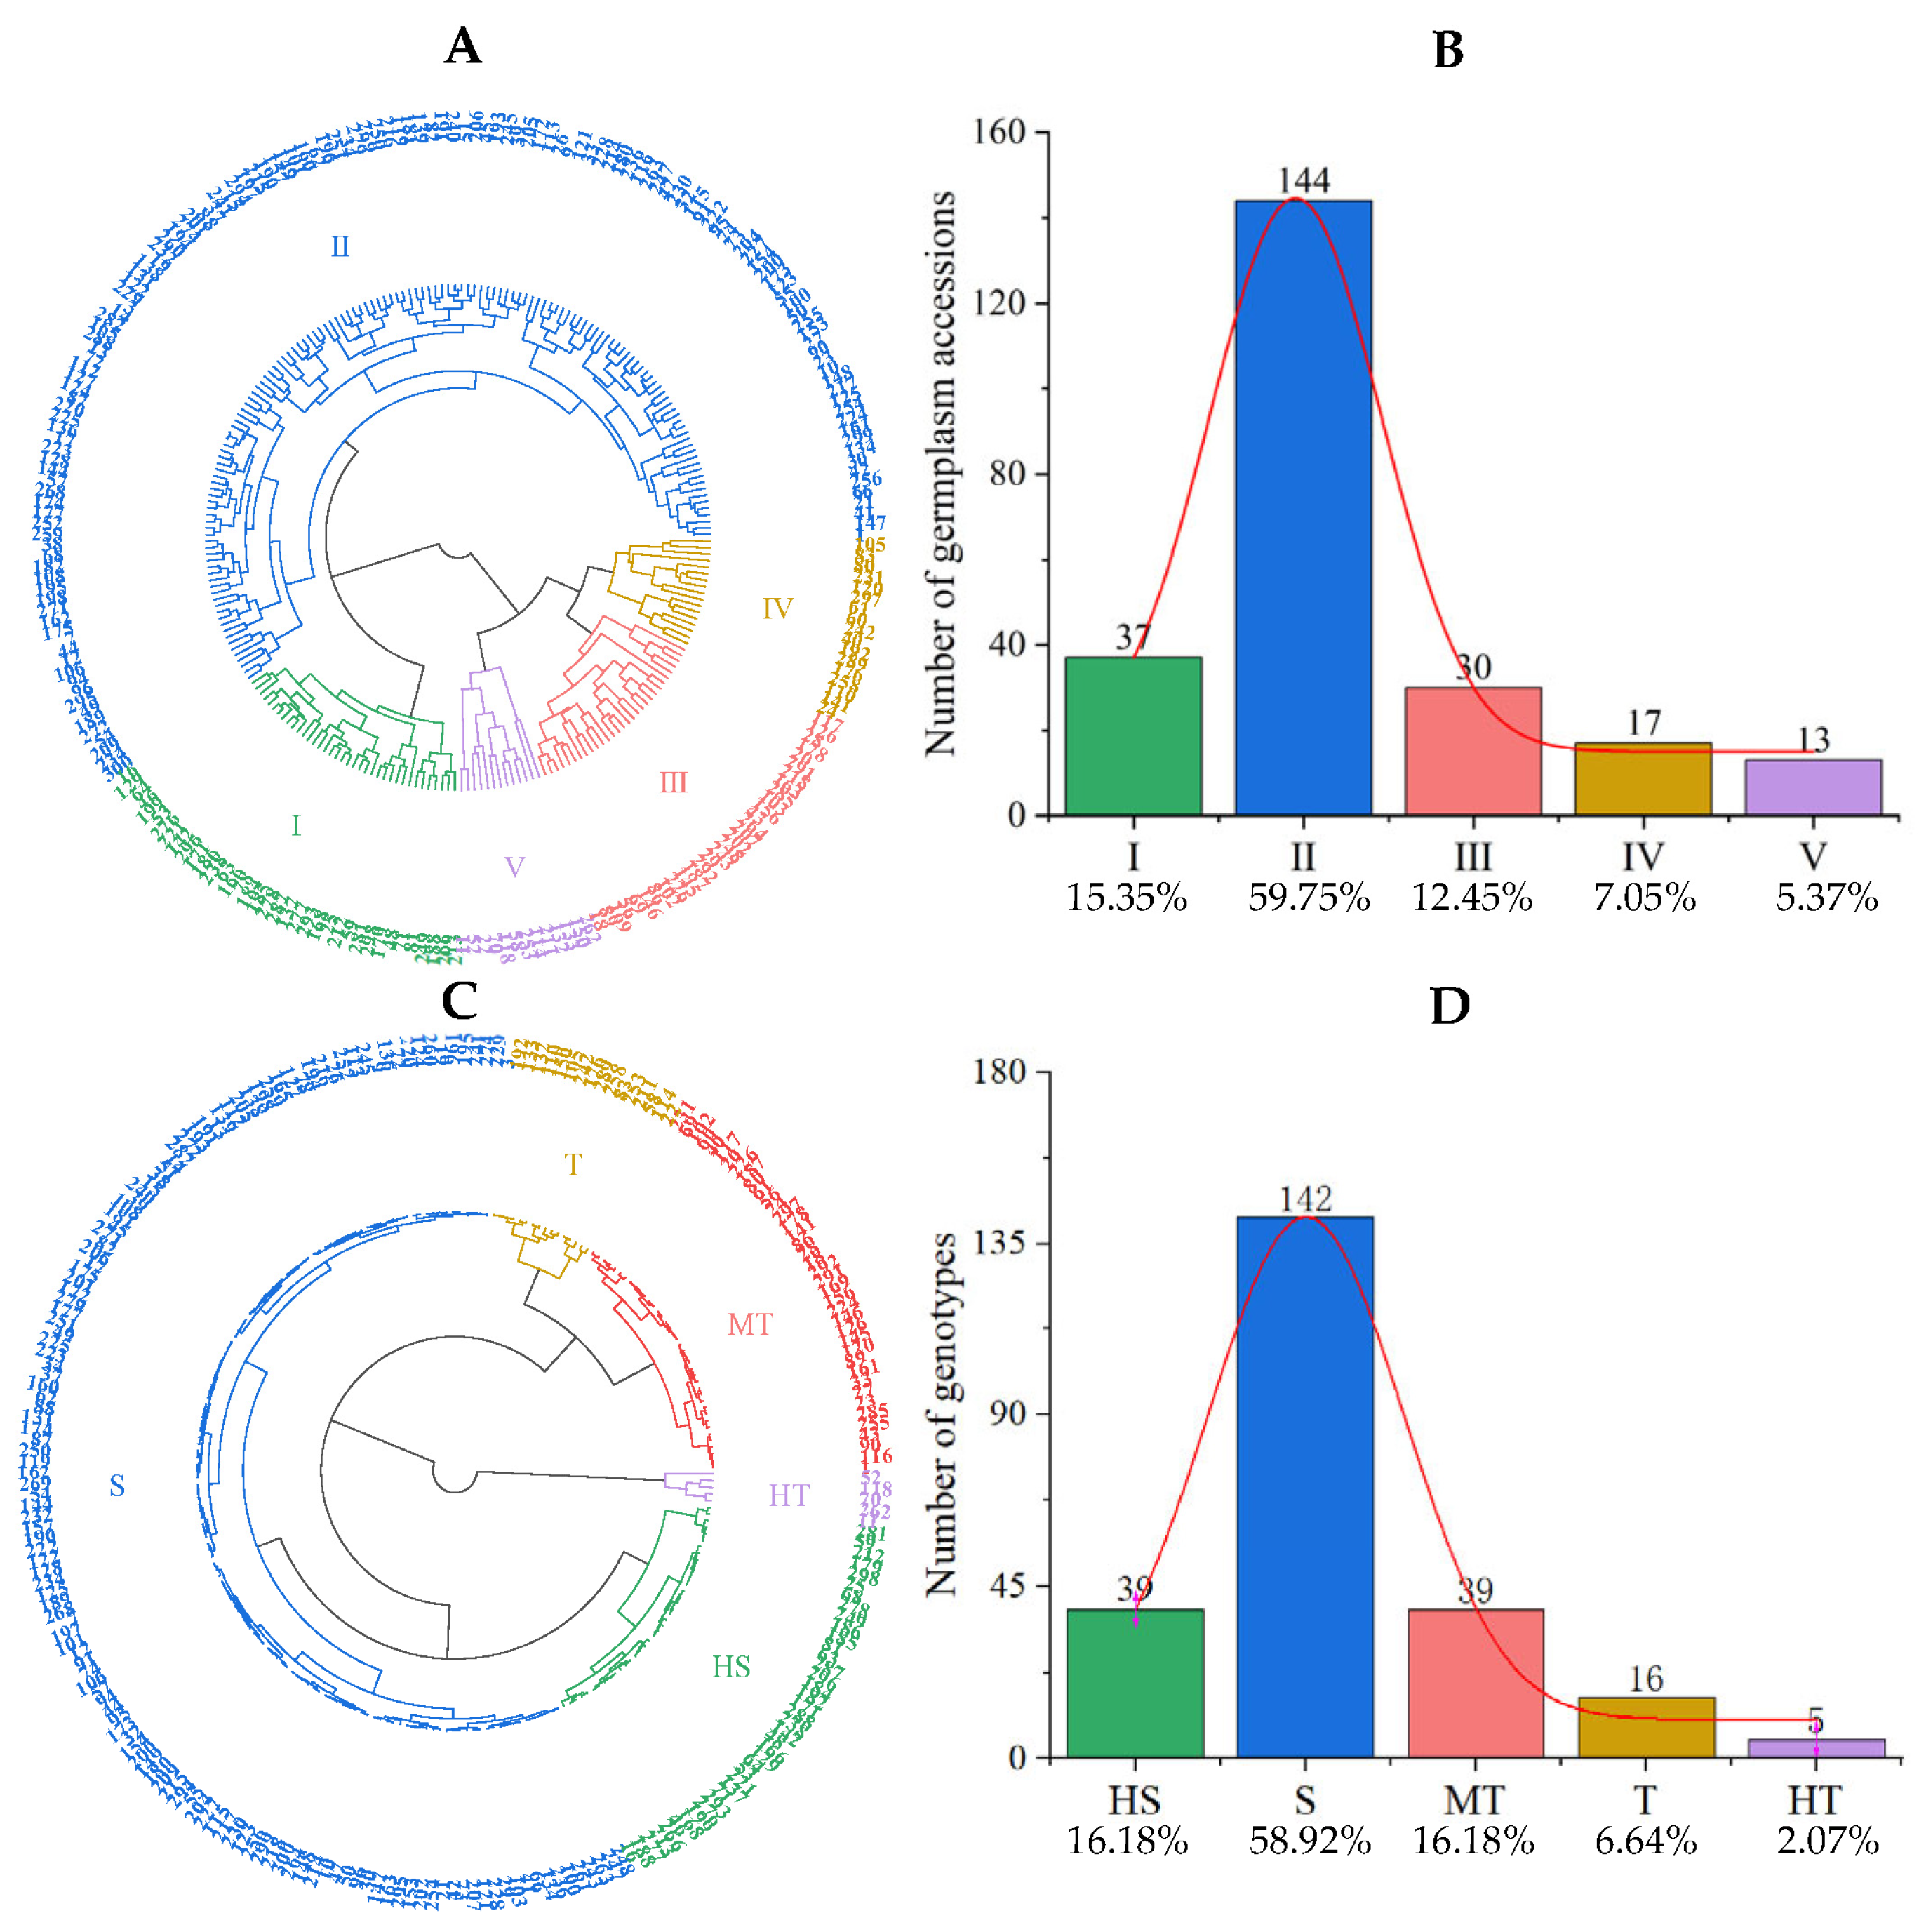
3.3.2. Qualitative Clustering Analysis of Salt Tolerance Traits in Tomato Germplasm

To elucidate the range of salt tolerance within the tomato germplasm, we conducted a qualitative cluster analysis on 241 tomato genotypes. Using the complete linkage method with Euclidean distance as the genetic distance, we based our analysis on the eight evaluative indicators selected. The analysis distributed the tomato population into five distinct clusters, with cluster II encompassing the largest proportion, 59.75% of the population (Figure 1A,B).
The analysis of salt tolerance traits in the five clusters revealed that clusters I and II had lower STCs and higher IS values, pointing to weaker salt tolerance. Conversely, clusters III, IV, and V exhibited higher STCs and lower IS values, indicating stronger salt resistance (Table 3). Notably, genotypes in clusters I and II constituted 75.10% of the total, corroborating the general tendency for moderate salt sensitivity within tomato germplasm. This patterning of salt tolerance serves as a benchmark for the quality of comprehensive evaluation results later adjudged in the study.

3.3.3. Accuracy Analysis of Comprehensive Evaluation Results of the Optimized Protocol

Clustering analysis, predicated on the comprehensive scores obtained from the optimized protocol, employed the average linkage method with Euclidean distance (Figure 1C,D). This process classified the 241 tomato accessions into five categories: highly sensitive (39 samples), sensitive (142 samples), moderately tolerant (39 samples), tolerant (16 samples), and highly tolerant (5 samples). The distribution pattern of the germplasm indicated a high degree of congruence with the results from the previously established quantitative clustering protocol (Figure 1B,D).
For a further validation of the optimized protocol, we matched members identified by it to the clusters ascertained through the qualitative clustering analysis. An 83.82% consistency rate was observed in the clustering results. Specifically, 97.30% of the high-sensitivity materials were mapped to cluster I, and 91.67% of the sensitivity materials to cluster II (Figure 2). Moreover, all high-tolerance materials were found within clusters IV and V, with 70.00% of the moderate-tolerance germplasm located in cluster III.

3.4. Secondary Validation of the Optimized Protocol’s Result Stability

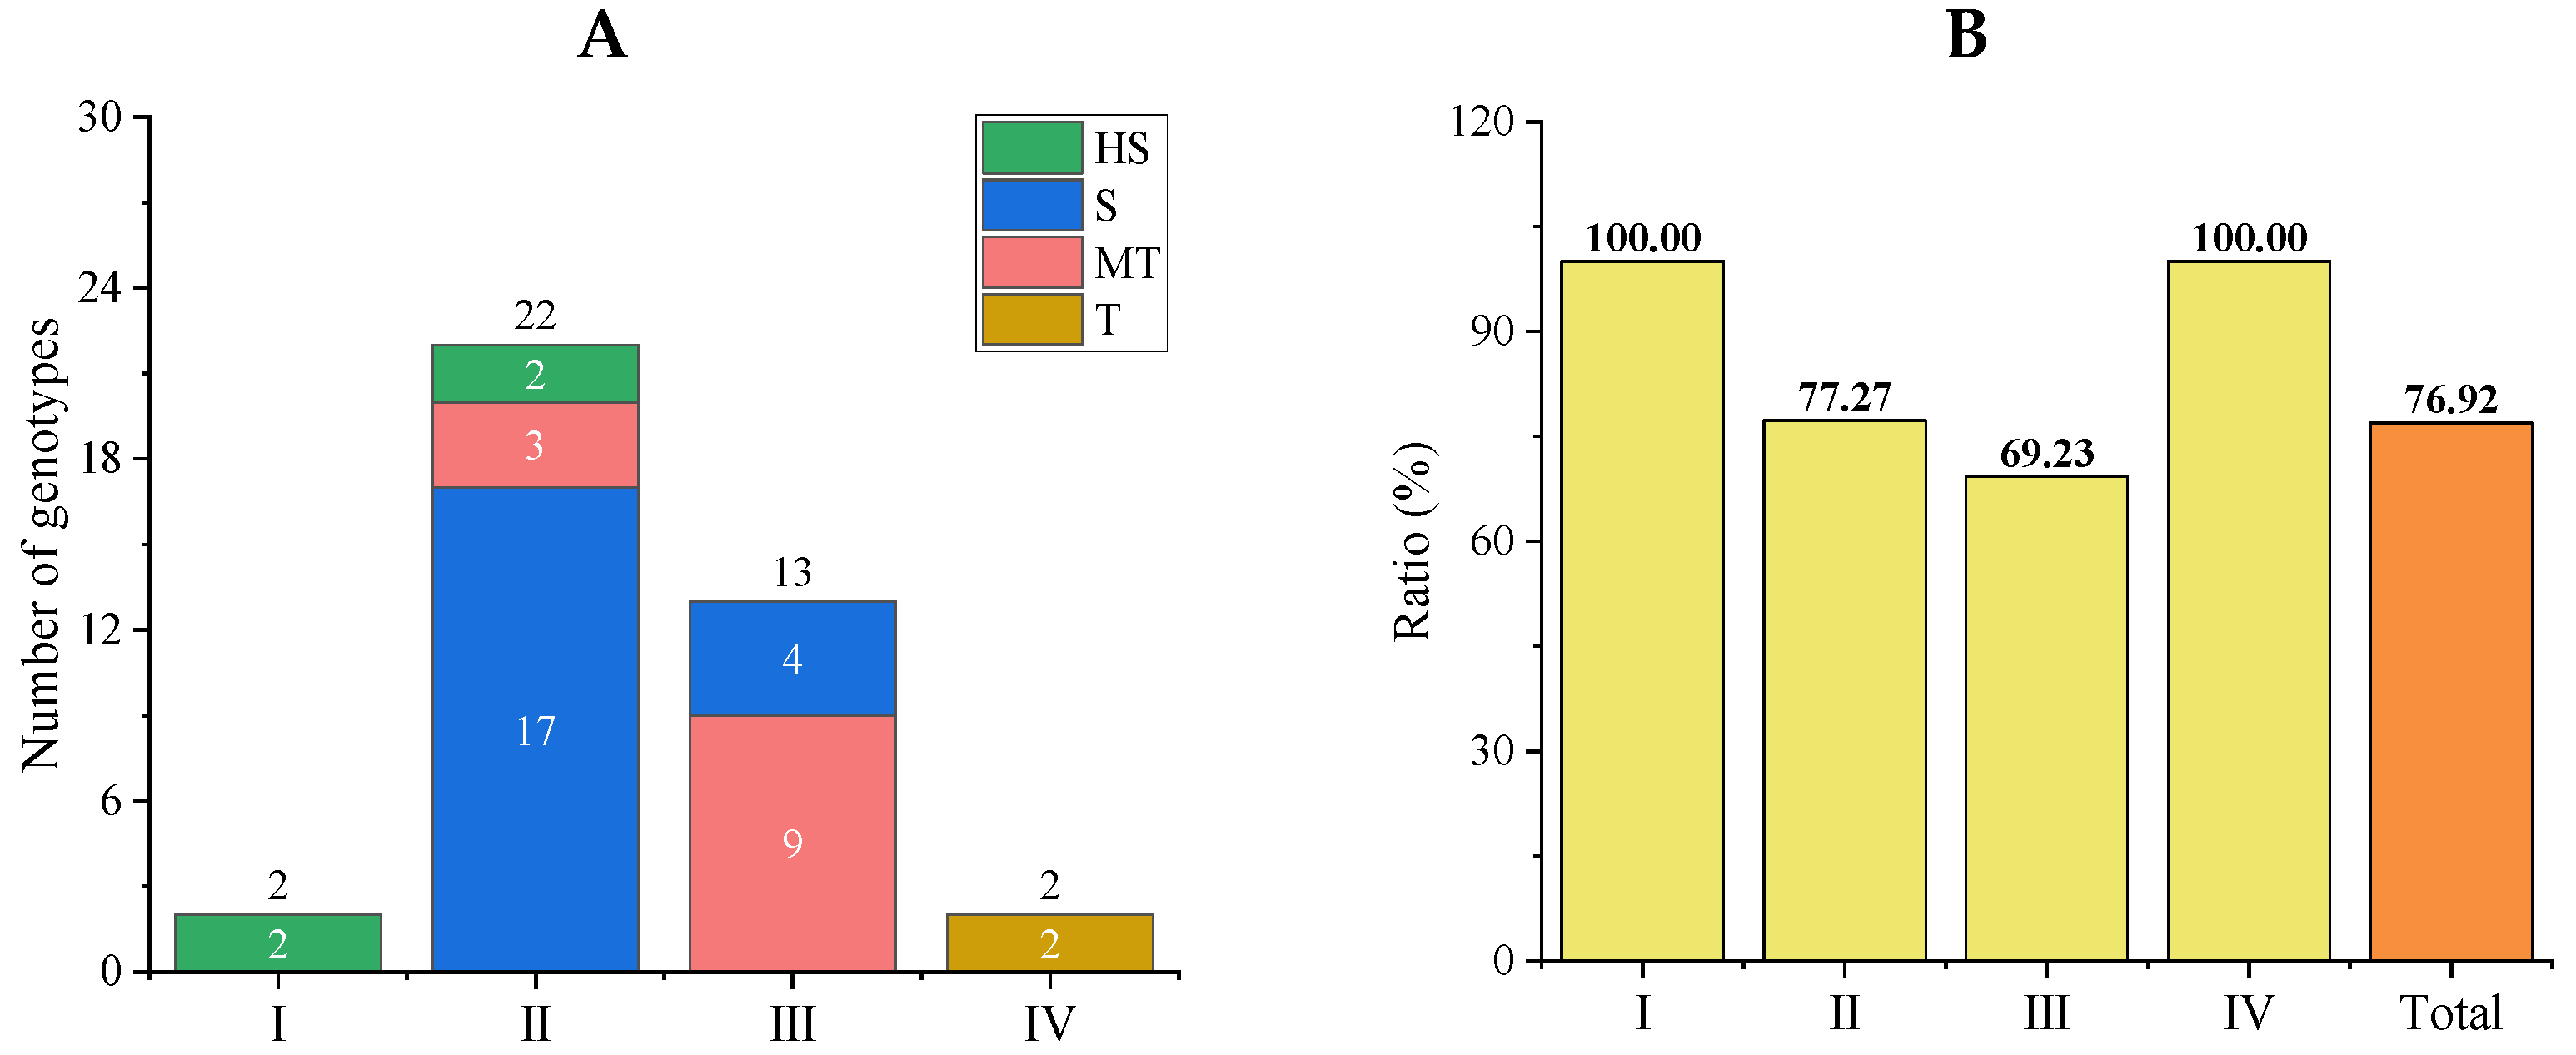
3.4.1. Comprehensive Evaluations of Salt Tolerance in a Tomato Subpopulation

We sampled 31 germplasm accessions from the original cohort and integrated them with 8 new accessions to form a new population for evaluation (39 germplasm materials in total). The original 31 accessions were randomly distributed across four salt tolerance categories derived from the initial population study: 3 highly sensitive, 15 sensitive, 10 moderately tolerant, and 3 tolerant. Accordingly, during the subsequent clustering analysis, four clusters were maintained. Out of 14 traits inspected, 10 evaluative indicators were analyzed in an ANOVA within K-means clustering analysis, which identified 6 indicators with significance levels under 0.05, qualifying them for the comprehensive evaluation (Table S6). Based on the six chosen evaluative indicators and the complete linkage method, we conducted a qualitative assessment of the 39 tomato germplasm accessions. This process stratified the population into four clusters, with member distributions depicted in Figure 3A.
Correlation analysis affirmed the significant interrelations among the six indicators (Figure S6). A PCA was performed post normalization, extracting the first three principal components which cumulatively explained 89.05% of the variance, thus encapsulating the bulk of the original dataset (Table S7). However, the component matrix indicated substantial information overlap among the principal components, leading to ambiguous interpretations. To clarify, a FA was executed. Suitability for FA was confirmed using the KMO (Kaiser–Meyer–Olkin) test and Bartlett’s test of sphericity, with KMO at 0.68 and the Bartlett significance value at 0.00 (Table S8). Therefore, FA using the maximum likelihood method was performed, and the rotated component matrix exhibited distinct principal components with the least overlap, allowing for subsequent comprehensive evaluations (Table S7). Utilizing the comprehensive scores, the new population was divided into four categories: 4 highly sensitive, 21 sensitive, 12 moderately tolerant, and 2 tolerant (Figure 3B).

3.4.2. Stability Analysis of Comprehensive Evaluation Results of the New Population

The distribution alignment between clusters derived from comprehensive scores using the optimized protocol and those based on six evaluative indicators suggested an analysis of consistency. This comparison revealed an 76.92% overall consistency in clustering (Figure 4A,B). Furthermore, to gauge the optimized protocol’s stability in identifying salt tolerance amidst varying evaluation indices, we juxtaposed the comprehensive evaluation results from the new and initial populations. This comparison showcased an 83.87% consistency in identification across the populations, affirming the robustness of the evaluation results obtained by the optimized protocol (Figure 4C,D).

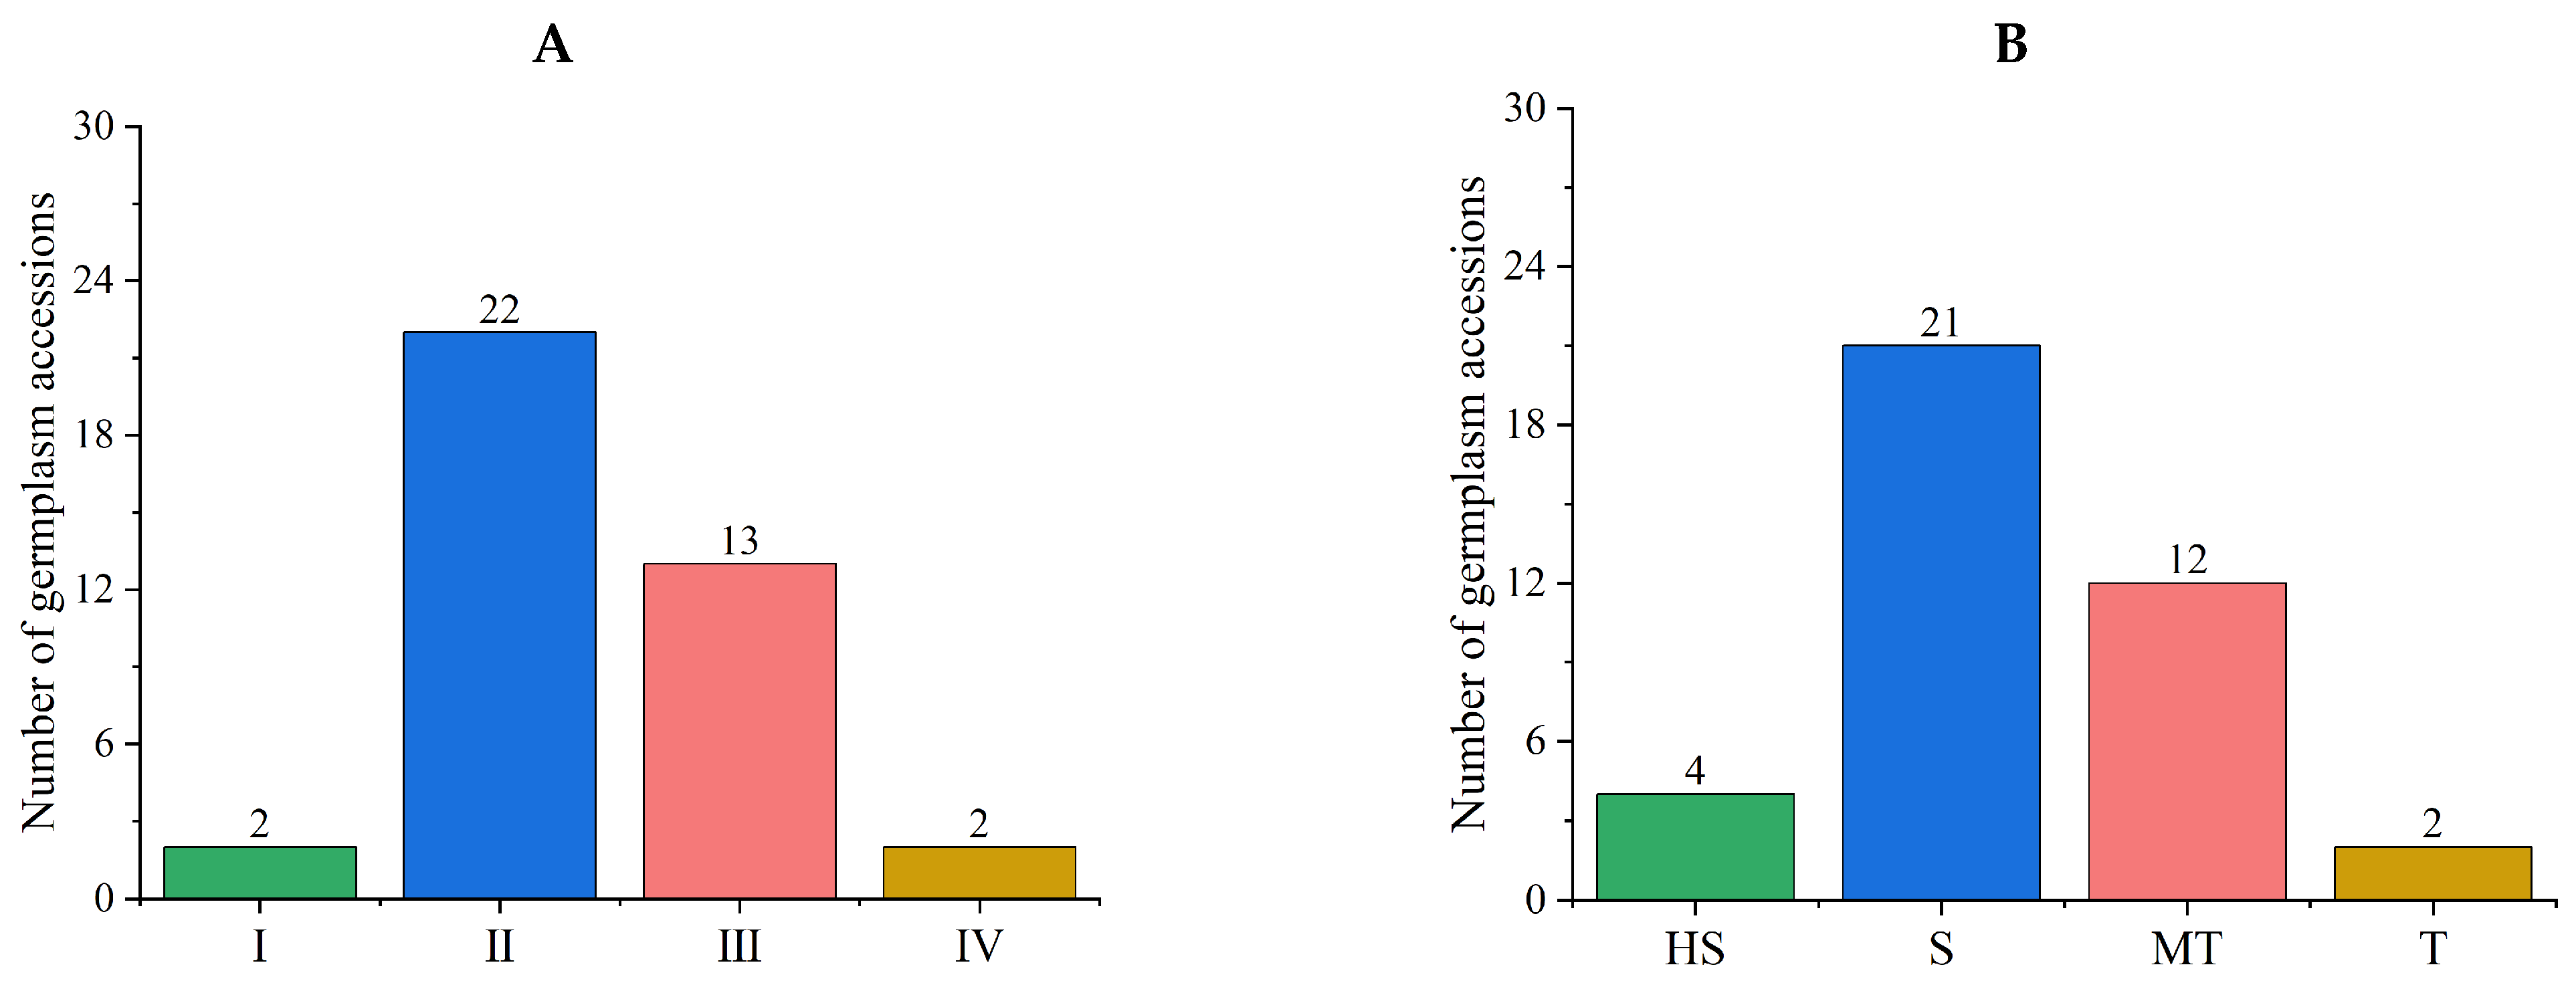
3.5. Salt Tolerance Analysis in Subpopulations of the Initial Population

Investigating salt tolerance variance among subpopulations, the initial tomato population was subdivided into subgroups based on germplasm background characteristics (Figure 5). The population was segmented into determinate (87 genotypes), indeterminate (133 genotypes), and semi-determinate (21 genotypes) categories. The determinate group exhibited significantly weaker salt tolerance than the semi-determinate group. Further subdivision based on genetic differentiation and breeding history highlighted that wild tomato subpopulations had markedly higher salt tolerance than others. This population was further divided into six subgroups based on genetic differentiation and breeding history [34,35]. The results highlighted that wild tomato subpopulations had markedly higher salt tolerance than others, with processed tomatoes displaying the lowest average salt tolerance scores—indicative of comparatively lower salt resistance. When categorized by fruit size, no significant disparities in salt tolerance were discerned across the small, medium, and large fruit subpopulations.

4. Discussion

4.1. Evaluation of the Salt Tolerance of the Optimized Protocol and Analysis of Its Stability and Accuracy

Due to the simplicity and comparability of composite indices, MICE techniques have been widely applied across diverse research fields [9]. In the context of salt tolerance, such comprehensive evaluations offer an effective approach for assessing individual responses within a germplasm population. Integral to the reliability of these evaluations is the construction of the evaluation index system, which significantly impacts the results’ accuracy and stability [14,36]. Although prior studies have identified various early-stage traits of tomato as potential indicators of salt tolerance [12,20], the indiscriminate integration of these traits into evaluation systems can compromise the assessment’s precision and stability [37]. To this end, this study systematically optimized the comprehensive evaluation process, developing a protocol that enhanced the assessment’s stability and accuracy when applied to tomato germplasm salt tolerance.
In this paper, we analyzed the system variance and concordance between the results of the optimized protocol and the classical PCA method, and found an increase in stability and a high concordance of 85.42% (Table S5, Figure S5). Since both the proposed method and the classic PCA method are statistical dimensionality reduction techniques, they inherently lose some of the original information during the reduction process to extract a few principal components, which may lead to biases in the final evaluation results [30]. However, the qualitative clustering of all traits can avoid the aforementioned issue of information loss, thereby yielding more accurate identification outcomes. Consequently, in subsequent analyses, the results of qualitative clustering were used to compare with those of the optimized protocol to evaluate the validity of the optimized approach.
The application of the optimized protocol to two tomato populations yielded accuracy ranges from 76.92% to 83.82% in evaluation results (Figure 2 and Figure 4). Changes in the evaluation index system are one of the main factors affecting the stability of evaluation results [36]. Therefore, in this paper, consistency levels as high as 83.87% between different evaluation index systems further validated the protocol (Figure 4). The systematic procedures of this optimized evaluation may offer guidance for identifying crop germplasm resistance under varying stress conditions (Figure S7). Nonetheless, MICE encompasses a spectrum of methodologies, and selection should align with specific research needs [9,38].

4.2. Salt Tolerance Disparities among Tomato Subgroups

The seedling stage is crucial for evaluating crop salt tolerance, particularly for tomatoes, which are highly sensitive during this phase [21]. Our optimized evaluation protocol identified 16 tolerant and 5 highly tolerant accessions among 249 tomato germplasm accessions, comprising 8.43% of the sampled germplasm (Figure 1D). These selections are promising candidates for constructing genetically salt-tolerant tomato populations and for quantitative trait loci exploration related to salt tolerance.
Earlier studies indicated that determinate tomatoes can be better suited to drought condition than indeterminate types [21]. However, currently, the relationship between tomato growth habits and salt tolerance has been less explored. The results in this study indicate that determinate tomatoes possess the least salt tolerance, significantly lower than semi-determinate types, although no significant difference was found with indeterminate types (Figure 5). Such variations may result from the erosion of salt tolerance features through intensive selective breeding process [39,40,41]. As ancestors of cultivated tomatoes, cherry tomatoes exhibit stronger salt tolerance than larger fruited varieties (represented by modern tomatoes) [39]. In this study, the proportion of determinate varieties among modern tomatoes (including both processed and fresh-market tomatoes) was significantly higher (67.8%) compared to semi-determinate types (9.5%), whereas in cherry tomatoes, the proportions of the two subgroups were reversed, at 20.7% and 80.9%, respectively (Table S9). Moreover, this study also demonstrated that processed tomatoes, which are typical of modern improved varieties, have significantly weaker salt tolerance than cherry tomatoes (Figure 5), likely due to selective breeding for commercial traits (such as increased firmness and yield, square fruit shape, and uniform ripening) at the expense of abiotic stress resilience.
This study also underscores the superior salt tolerance of wild tomato populations over other groups, corroborating earlier findings [23,42]. As wild ancestors of cultivated tomatoes, the strain of Solanum pimpinellifolium ‘LA2093’ has been previously reported as a salt-tolerant germplasm [43], consistent with the results of this research. In this study, the strain ‘LA2093’ (NX58) was identified as salt-tolerant, exhibiting resilience to salt stress. However, the strains ‘LA1598’ (NX52) and ‘LA1589’ (NX96) were classified, respectively, as highly salt-tolerant and salt-sensitive, revealing significant variance in salt tolerance capabilities among the three strains. These findings highlight the diversity in salt tolerance and mechanisms between different individuals within the same species [23,39].

5. Conclusions

In summary, this study proposes an optimized protocol for the MICE of salt tolerance, successfully applied to the analysis of 249 tomato germplasm accessions, yielding stable and accurate comprehensive evaluation results, as evidenced by the reduced system variance and high consistency rate observed between pre- and post-optimization results. The protocol not only facilitates salt tolerance identification in crops but also serves as a robust reference for assessing other abiotic stress resistances. The salt-tolerant accessions identified herein are valuable for fundamental salt tolerance research and future breeding efforts aimed at developing salt-tolerant tomato varieties. This work contributes to the advancement of germplasm evaluation techniques and underscores the importance of precision breeding for sustainable agriculture in the face of soil salinity challenges. Concurrently, efforts are underway to utilize those phenotypic data for association mapping and the allele mining of candidate genes/loci via resequencing technology.

Supplementary Materials

The following supporting information can be downloaded at: https://www.mdpi.com/article/10.3390/agronomy14040842/s1. Figure S1: Phenotypes of tomato germplasm accessions exhibiting different degrees of salt damage; Figure S2: Distribution of salt tolerance coefficients and index of salinity damage (IS); Figure S3: Correlation analysis of salt tolerance traits in tomato initial germplasm; Figure S4: Correlation analysis of comprehensive scores derived from two different weighting methods; Figure S5: Concordance analysis of comprehensive evaluation results between the newly proposed approach and the classical DR-PCA approach; Figure S6: Correlation analysis of salt tolerance traits in new tomato population; Figure S7: Framework for the comprehensive evaluation of salt tolerance in crop germplasm utilized in this study; Table S1: Background information of 249 tomato genotypes used in this study; Table S2: Salt damage levels in tomato seedlings post salt treatment; Table S3: Results of ANOVA tests for eight evaluative indicators; Table S4: Comprehensive scores of 241 tomato germplasm accessions using two different weighting methods; Table S5: Stability assessment for the evaluation results of the optimized protocol; Table S6: Results of ANOVA tests for ten evaluative indicators; Table S7: Component matrix; Table S8: KMO (Kaiser–Meyer–Olkin) measurement and Bartlett’s test of sphericity; Table S9: Distribution of tomatoes with different genetic backgrounds across three growth habit groups.

Author Contributions

Z.C. performed the experiments, analyzed the data, and wrote the manuscript. X.L. and X.P. collected the phenotypic data and revised the manuscript. R.Z., F.J., E.H. and Z.W. designed the experiments and gave valuable comments on the manuscript. All authors have read and agreed to the published version of the manuscript.

Funding

This research was funded by the National Natural Science Foundation of China (Grant No. U1903106; Grant No. 32072581), a project funded by the Priority Academic Program Development of Jiangsu Higher Education Institutions, and the earmarked fund for CARS (Grant No. CARS-23).

Data Availability Statement

The data presented in this study are available.

Acknowledgments

We are grateful to the editors and all anonymous reviewers for their constructive comments on this manuscript.

Conflicts of Interest

The authors declare that they have no known competing financial interests or personal relationships that could have appeared to influence the work reported in this paper.

References

  1. van Zelm, E.; Zhang, Y.X.; Testerink, C. Salt tolerance mechanisms of plants. Annu. Rev. Plant Biol. 2020, 71, 403–433. [Google Scholar] [CrossRef] [PubMed]
  2. Bakirov, A.; Zhang, Y.; Zhang, Q.; Seitahmetovna, S.A.; Yu, X.J.; Shi, Y.J.; Xu, Y.; Wang, K.; Qin, M.F.; Xu, A.X.; et al. Screening of salt tolerance traits and the salt tolerance evaluation method in Brassica napus at the seed germination stage. Ital. J. Agron. 2022, 17, 2011. [Google Scholar] [CrossRef]
  3. Hopmans, J.W.; Qureshi, A.S.; Kisekka, I.; Munns, R.; Grattan, S.R.; Rengasamy, P.; Ben-Gal, A.; Assouline, S.; Javaux, M.; Minhas, P.S.; et al. Critical knowledge gaps and research priorities in global soil salinity. Adv. Agron. 2021, 169, 1–191. [Google Scholar] [CrossRef]
  4. Zorb, C.; Geilfus, C.M.; Dietz, K.J. Salinity and crop yield. Plant Biol. 2019, 21, 31–38. [Google Scholar] [CrossRef] [PubMed]
  5. Ashraf, M.Y.; Awan, A.R.; Mahmood, K. Rehabilitation of saline ecosystems through cultivation of salt tolerant plants. Pak. J. Bot. 2012, 44, 69–75. [Google Scholar] [CrossRef]
  6. Yu, R.; Wang, G.; Yu, X.; Li, L.; Li, C.; Song, Y.; Xu, Z.; Zhang, J.; Guan, C. Assessing alfalfa (Medicago sativa L.) tolerance to salinity at seedling stage and screening of the salinity tolerance traits. Plant Biol. 2021, 23, 664–674. [Google Scholar] [CrossRef] [PubMed]
  7. Wu, H.; Guo, J.R.; Wang, C.F.; Li, K.L.; Zhang, X.W.; Yang, Z.; Li, M.; Wang, B. An effective screening method and a reliable screening trait for salt tolerance of Brassica napus at the germination stage. Front. Plant Sci. 2019, 10, 530. [Google Scholar] [CrossRef] [PubMed]
  8. Xu, J.P.; Li, Z.M.; Shen, W.J.; Lev, B. Multi-attribute comprehensive evaluation of individual research output based on published research papers. Knowl. Based Syst. 2013, 43, 135–142. [Google Scholar] [CrossRef]
  9. Qiu, D.; Liu, T.Y. Multi-indicator comprehensive evaluation: Reflection on methodology. Data Sci. Financ. Econ. 2021, 1, 298–312. [Google Scholar] [CrossRef]
  10. Liu, C.J.; Gong, X.W.; Wang, H.L.; Dang, K.; Deng, X.P.; Feng, B.L. Low-nitrogen tolerance comprehensive evaluation and physiological response to nitrogen stress in broomcorn millet (Panicum miliaceum L.) seedling. Plant Physiol. Biochem. 2020, 151, 233–242. [Google Scholar] [CrossRef]
  11. Aslam, M.; Maqbool, M.A.; Zaman, Q.U.; Shahid, M.; Arslan Akhtar, M.; Rana, A.S. Comparison of different tolerance indices and PCA biplot analysis for assessment of salinity tolerance in lentil (Lens culinaris) genotypes. Int. J. Agric. Biol. 2017, 19, 470–478. [Google Scholar] [CrossRef]
  12. Raza, M.A.; Saeed, A.; Munir, H.; Ziaf, K.; Shakeel, A.; Saeed, N.; Munawar, A.; Rehman, F. Screening of tomato genotypes for salinity tolerance based on early growth attributes and leaf inorganic osmolytes. Arch. Agron. 2017, 63, 501–512. [Google Scholar] [CrossRef]
  13. Ma, Q.; Wu, C.Y.; Liang, S.H.; Yuan, Y.H.; Liu, C.J.; Liu, J.J.; Feng, B.L. The alkali tolerance of broomcorn millet (Panicum miliaceum L.) at the germination and seedling stage: The case of 296 broomcorn millet genotypes. Front. Plant Sci. 2021, 12, 711429. [Google Scholar] [CrossRef] [PubMed]
  14. Li, X.Q.; Gao, X.H. Research on discriminability and stability of comprehensive evaluation results. Stat. Decis. 2022, 38, 16–21. [Google Scholar] [CrossRef]
  15. Li, Y.; Wang, J. A system of selecting multi-index comprehensive evaluation method. Acad. J. Appl. Math. Sci. 2018, 4, 95–97. Available online: http://arpgweb.com/?ic=journal&journal=17&info=aims (accessed on 29 March 2024).
  16. Guo, M.; Wang, X.S.; Guo, H.D.; Bai, S.Y.; Khan, A.; Wang, X.M.; Gao, Y.M.; Li, J.S. Tomato salt tolerance mechanisms and their potential applications for fighting salinity: A review. Front. Plant Sci. 2022, 13, 949541. [Google Scholar] [CrossRef] [PubMed]
  17. FAO. Crop Queries of Production Volume of Data [EB/OL]. Available online: https://www.fao.org/faostat/en/#data/QCLe (accessed on 29 March 2024).
  18. Su, X.; Wang, B.A.; Geng, X.L.; Du, Y.F.; Yang, Q.Q.; Liang, B.; Meng, G.; Gao, Q.; Yang, W.C.; Zhu, Y.F.; et al. A high-continuity and annotated tomato reference genome. BMC Genom. 2021, 22, 898. [Google Scholar] [CrossRef] [PubMed]
  19. Lu, Y.; Zhu, H. The regulation of nutrient and flavor metabolism in tomato fruit. Veg. Res. 2022, 2, 41–54. [Google Scholar] [CrossRef]
  20. Fatima, N.; Saeed, A.; Shakeel, A.; Awan, F.S. Evaluation of tomato germplasm for salinity tolerance at the seedling stage. SABRAO J. Breed Genet. 2022, 54, 1159–1170. [Google Scholar] [CrossRef]
  21. Kumar, P.A.; Reddy, N.N.; Jyothi Lakshmi, N. Screening tomato genotypes for salt tolerance. Int. J. Curr. Microbiol. Appl. Sci. 2017, 6, 1037–1049. [Google Scholar] [CrossRef]
  22. Du, X.W.; Si, L.Q.; Jin, X.; Li, P.F.; Yun, Z.H.; Gao, K.H. Classification of plug seedling quality by improved convolutional neural network with an attention mechanism. Front. Plant Sci. 2022, 13, 967706. [Google Scholar] [CrossRef] [PubMed]
  23. Rao, E.S.; Kadirvel, P.; Symonds, R.C.; Ebert, A.W. Relationship between survival and yield related traits in Solanum pimpinellifolium under salt stress. Euphytica 2013, 190, 215–228. [Google Scholar] [CrossRef]
  24. Rehman, F.; Saeed, A.; Yaseen, M.; Shakeel, A.; Ziaf, K.; Munir, H.; Tariq, S.A.; Raza, M.A.; Riaz, A. Genetic evaluation and characterization using cluster heat map to assess NaCl tolerance in tomato germplasm at the seedling stage. Chil. J. Agric. Res. 2019, 79, 56–65. [Google Scholar] [CrossRef]
  25. Nasrin, S.; Mannan, M.A.; Islam, M.M.; Khan, S.; Rahman, S.M.M. Evaluation of fifteen tomato germplasm for salt tolerance. Bangladesh Agric. J. 2022, 24, 43–54. [Google Scholar] [CrossRef]
  26. Moniruzzaman, M.; Islam, M.N.; Hossain, M.F.B.; Rashid, M.M.; Ahamed, K.U. Evaluation of tomato germplasm against salinity. Bull. Inst. Trop. Agric. Kyushu Univ. 2013, 36, 9–16. [Google Scholar] [CrossRef]
  27. Li, Y.K.; Jiang, F.L.; Niu, L.F.; Wang, G.; Yin, J.; Song, X.M.; Ottosen, C.; Rosenqvist, E.; Mittler, R.; Wu, Z.; et al. Synergistic regulation at physiological, transcriptional, and metabolic levels in tomato plants subjected to a combination of salt and heat stress. Plant J. 2024, 117, 1656–1675. [Google Scholar] [CrossRef] [PubMed]
  28. Chen, Z.; Shah Jahan, M.; Mao, P.P.; Wang, M.M.; Liu, X.Y.; Guo, S.R. Functional growth, photosynthesis and nutritional property analyses of lettuce grown under different temperature and light intensity. J. Hortic. Sci. Biotechnol. 2020, 96, 53–61. [Google Scholar] [CrossRef]
  29. Gao, X.H.; Li, X.Q. Comparative study of linear dimensionless methods in principal component analysis. Stat. Decis. 2020, 36, 35–36. [Google Scholar] [CrossRef]
  30. Sun, M.T.; Jiang, F.L.; Zhang, C.; Shen, M.; Wu, Z. A new comprehensive evaluation system for thermo-tolerance in tomato at different growth stage. J. Agric. Sci. Technol. B 2016, 6, 151–167. [Google Scholar] [CrossRef]
  31. Su, J.S.; Zhang, F.; Li, P.R.; Guan, Z.Y.; Fang, W.M.; Chen, F.D. Genetic variation and association mapping of waterlogging tolerance in chrysanthemum. Planta 2016, 244, 1241–1252. [Google Scholar] [CrossRef]
  32. Zhang, Z.Y.; Li, X.; Wang, Y.; Chang, W.; Gao, X.Q.; Fu, B.Z. Salt tolerance evaluation and salt tolerance index screening of 59 alfalfa germplasm materials at seedling stage. Acta Agrestia Sin. 2020, 28, 112–121. [Google Scholar] [CrossRef]
  33. Gao, X.H.; Li, X.Q. Comparison of comprehensive evaluation methods based on information extraction. Stat. Decis. 2020, 36, 27–31. [Google Scholar] [CrossRef]
  34. Sim, S.C.; Robbins, M.D.; Van Deynze, A.; Michel, A.P.; Francis, D.M. Population structure and genetic differentiation associated with breeding history and selection in tomato (Solanum lycopersicum L.). Heredity 2011, 106, 927–935. [Google Scholar] [CrossRef] [PubMed]
  35. Sim, S.C.; Van Deynze, A.; Stoffel, K.; Douches, D.S.; Zarka, D.; Ganal, M.W.; Chetelat, R.T.; Hutton, S.F.; Scott, J.W.; Gardner, R.G.; et al. High-density SNP genotyping of tomato (Solanum lycopersicum L.) reveals patterns of genetic variation due to breeding. PLoS ONE 2012, 7, e45520. [Google Scholar] [CrossRef]
  36. Li, B. Problems existing in application of multi-index comprehensive evaluation method and countermeasures. J. Shenyang Inst. Eng. 2010, 6, 349–351. [Google Scholar] [CrossRef]
  37. Zhao, M.H.; Bai, Y.M.; Meng, L.B.; Sun, T.T.; Wang, D.Q.; Jing, C.Y.; Lv, W.H. Evaluation of salt tolerance of diploid potato and screening of salt tolerance indices. Chin. J. Ecol. 2022, 41, 610–617. [Google Scholar] [CrossRef]
  38. Bauer, C. Multi-method evaluation: Leveraging multiple methods to answer what you were looking for. In Proceedings of the 2020 Conference on Human Information Interaction and Retrieval, Vancouver, BC, Canada, 14–18 March 2020; pp. 472–474. [Google Scholar] [CrossRef]
  39. Wang, Z.; Hong, Y.C.; Zhu, G.G.; Li, Y.M.; Niu, Q.F.; Yao, J.J.; Hua, K.; Bai, J.J.; Zhu, Y.F.; Shi, H.Z.; et al. Loss of salt tolerance during tomato domestication conferred by variation in a Na+/K+ transporter. EMBO J. 2020, 39, e103256. [Google Scholar] [CrossRef] [PubMed]
  40. Ye, C.H.; Guan, X.; Wang, X.; Kong, D.L.; Yu, S.J.; Wang, Z.Q.; Yu, Y.D.; Chao, Z.F.; Liu, X.; Huang, S.W.; et al. Natural variation in SlSOS2 promoter hinders salt resistance during tomato domestication. Hortic. Res. 2023, 10, 232–239. [Google Scholar] [CrossRef]
  41. Li, N.; He, Q.; Wang, J.; Wang, B.K.; Zhao, J.T.; Huang, S.Y.; Yang, T.; Tang, Y.P.; Yang, S.B.; Aisimutuola, P.; et al. Super-pangenome analyses highlight genomic diversity and structural variation across wild and cultivated tomato species. Nat. Genet. 2023, 55, 852–860. [Google Scholar] [CrossRef] [PubMed]
  42. Zaki, H.E.M.; Yokoi, S. A comparative in vitro study of salt tolerance in cultivated tomato and related wild species. Plant Biotechnol. 2016, 33, 361–372. [Google Scholar] [CrossRef] [PubMed]
  43. Li, H.L.; Zhou, R.; Jiang, F.L.; Wen, J.Q.; Liu, S.; Wu, Z. Evaluation of salt tolerance of introgression line population of Solanum pimpinellifolium LA2093 at seedling stage. Jiangsu J. Agric. Sci. 2022, 38, 1620–1626. [Google Scholar] [CrossRef]
Figure 1. Clustering and distribution of salt tolerance in tomato germplasm. (A,B) Qualitative clustering analysis based on eight evaluative indicators. (C,D) Optimized clustering analysis based on comprehensive scores. HS, high sensitivity; S, sensitivity; MT, moderate tolerance; T, tolerance; HT, high tolerance.
Agronomy 14 00842 g001
Figure 2. Similarity between optimized clusters and qualitative clusters. (A) Mapping results of the optimized clusters to the qualitative clusters, with the legend’s color indicating the level of salt tolerance. HS, high sensitivity; S, sensitivity; MT, moderate tolerance; T, tolerance; HT, high tolerance. (B) Consistency analysis of the optimized vs. qualitative clustering results.
Agronomy 14 00842 g002
Figure 3. Comparison of qualitative and optimized hierarchical clustering analysis. (A) Qualitative clusters based on six evaluative indicators. (B) Optimized hierarchical clusters based on comprehensive scores using the new population. HS, high sensitivity; S, sensitivity; MT, moderate tolerance; T, tolerance.
Agronomy 14 00842 g003
Figure 4. Comparative mapping and consistency analysis. (A) Mapping results of the optimized clusters to the qualitative clusters in the subpopulation. (C) Mapping results of the subpopulation’s clusters to the initial population. The respective legends indicate salt tolerance levels. (B,D) Consistency analysis comparing optimized clusters with qualitative clusters (B) and the new population with the initial population (D). HS, high sensitivity; S, sensitivity; MT, moderate tolerance; T, tolerance.
Agronomy 14 00842 g004aAgronomy 14 00842 g004b
Figure 5. Analysis of salt tolerance disparities among tomato subgroup in the initial population.
Agronomy 14 00842 g005
Table 1. Variation in phenotypic traits in the tomato germplasm population.
TraitRangeMean ± S.D.CV (%)SkewnessKurtosis
PHR0.25–0.870.41 ± 0.0922.061.544.36
FFR0.06–0.710.30 ± 0.1238.180.990.95
SFR0.05–0.720.29 ± 0.1239.621.051.27
RFR0.07–1.000.38 ± 0.1745.421.001.12
FDR0.15–1.040.39 ± 0.1538.901.382.50
SDR0.15–1.060.38 ± 0.1539.131.483.16
RDR0.10–1.080.46 ± 0.2144.621.000.64
IS0.24–0.970.66 ± 0.1625.16−0.36−0.29
SPADR0.55–1.450.98 ± 0.1212.460.131.48
DSRR0.36–2.140.88 ± 0.2528.301.123.18
FSRR0.30–2.380.84 ± 0.3238.241.322.50
FDWR0.21–1.280.78 ± 0.1518.80−0.221.31
Note: PH: plant height; FF: full fresh weight of seedling; SF: shoot fresh weight; RF: root fresh weight; FD: full dry weight of seedling; SD: shoot dry weight; RD: root dry weight; SPAD: mean chlorophyll estimate; DSR: dry weight ratio of shoot to root; FSR: fresh weight ratio of shoot to root; FDW: ratio of fresh weight to dry weight. PHR, FFR, SFR, RFR, FDR, SDR, RDR, SPADR, DSRR, FSRR, and FDWR represent the salt tolerance coefficient for the corresponding traits. IS: index of salinity damage; S.D.: standard deviation; CV: coefficient of variation.
Table 2. Contribution rate and loading matrix of principal component.
IndicatorPrincipal Component
123
Eigenvalue5.5390.9510.648
Contribution rate %69.23811.8838.095
Total contribution rate %69.23881.12189.216
FFR0.951−0.0280.089
FDR0.935−0.206−0.042
SFR0.919−0.0510.210
SDR0.914−0.2250.021
RDR0.860−0.049−0.360
RFR0.8130.113−0.413
PHR0.7390.1220.541
IS (reversed)0.3660.908−0.031
Note: FF: full fresh weight of seedling; FD: full dry weight of seedling; SF: shoot fresh weight; SD: shoot dry weight; RD: root dry weight; RF: root fresh weight; PH: plant height. FFR, FDR, SFR, SDR, RDR, RFR, and PHR represent the salt tolerance coefficient for the corresponding traits. IS: index of salinity damage. IS (reversed): the values of inversion of the IS.
Table 3. Difference analysis of salt tolerance traits of different groups.
GroupPHRFFRSFRRFRFDRSDRRDRIS
I034 e0.17 e0.16 d0.22 d0.24 e0.24 d0.27 e0.81 a
II0.40 d0.27 d0.26 c0.35 c0.35 d0.34 c0.42 d0.66 b
III0.47 c0.41 c0.40 b0.43 b0.51 c0.51 b0.56 c0.64 b
IV0.51 b0.46 b0.43 b0.65 a0.58 b0.55 b0.79 b0.58 b
V0.60 a0.57 a0.56 a0.70 a0.78 a0.77 a0.89 a0.46 a
Note: PH: plant height; FF: full fresh weight of seedling; SF: shoot fresh weight; RF: root fresh weight; FD: full dry weight of seedling; SD: shoot dry weight; RD: root dry weight. PHR, FFR, SFR, RFR, FDR, SDR, and RDR represent the salt tolerance coefficient for the corresponding traits. IS: index of salinity damage. Different lowercase letters indicated differences at the p < 0.05 level according to Duncan’s test.
Disclaimer/Publisher’s Note: The statements, opinions and data contained in all publications are solely those of the individual author(s) and contributor(s) and not of MDPI and/or the editor(s). MDPI and/or the editor(s) disclaim responsibility for any injury to people or property resulting from any ideas, methods, instructions or products referred to in the content.

