Article

Rice Counting and Localization in Unmanned Aerial Vehicle Imagery Using Enhanced Feature Fusion

1
College of Information and Intelligence, Hunan Agricultural University, Changsha 410128, China
2
Hunan Sureserve Technology Co., Ltd., Changsha 410000, China
*
Author to whom correspondence should be addressed.
Agronomy 2024, 14(4), 868; https://doi.org/10.3390/agronomy14040868
Submission received: 27 March 2024 / Revised: 17 April 2024 / Accepted: 18 April 2024 / Published: 21 April 2024
(This article belongs to the Special Issue The Applications of Deep Learning in Smart Agriculture)

Abstract

:
In rice cultivation and breeding, obtaining accurate information on the quantity and spatial distribution of rice plants is crucial. However, traditional field sampling methods can only provide rough estimates of the plant count and fail to capture precise plant locations. To address these problems, this paper proposes P2PNet-EFF for the counting and localization of rice plants. Firstly, through the introduction of the enhanced feature fusion (EFF), the model improves its ability to integrate deep semantic information while preserving shallow spatial details. This allows the model to holistically analyze the morphology of plants rather than focusing solely on their central points, substantially reducing errors caused by leaf overlap. Secondly, by integrating efficient multi-scale attention (EMA) into the backbone, the model enhances its feature extraction capabilities and suppresses interference from similar backgrounds. Finally, to evaluate the effectiveness of the P2PNet-EFF method, we introduce the URCAL dataset for rice counting and localization, gathered using UAV. This dataset consists of 365 high-resolution images and 173,352 point annotations. Experimental results on the URCAL demonstrate that the proposed method achieves a 34.87% reduction in MAE and a 28.19% reduction in RMSE compared to the original P2PNet while increasing R 2 by 3.03%. Furthermore, we conducted extensive experiments on three frequently used plant counting datasets. The results demonstrate the excellent performance of the proposed method.

1. Introduction

Rice is a vital food crop globally and serves as the primary staple for two-thirds of the world’s population [1]. Obtaining the number and precise locations of rice plants is crucial in rice cultivation and breeding, constituting a fundamental requirement for implementing precision agriculture [2,3,4]. Contrasting with small-scale cultivation, determining the location and number of rice plants in the field proves challenging. Traditional field sampling methods are labor-intensive and time-consuming and only provide approximate estimates of plant quantity without quantifying their distribution. Advancements in remote sensing technology have made it a vital tool for non-invasive monitoring and field crop management [5]. Satellite remote sensing provides crucial information on crop growth, yield, and soil quality. However, it has limitations such as high cost, low resolution, and insufficient timeliness, which prevent it from fully meeting the demands of precision agriculture [6]. Conversely, UAV low-altitude remote sensing (UAV-LARS) offers advantages such as lower cost, higher resolution, increased flexibility, and real-time performance and has seen extensive adoption in agricultural production in recent years [7]. Specifically, Qin et al. [8] employed UAVs to capture hyperspectral images of fields, enabling accurate estimation of nitrogen content in rice leaves. Similarly, Gallo et al. [9] employed the Yolo v7 algorithm for effective weed detection in images captured by UAVs. Additionally, Bao et al. [10] proposed the DDMA-YOLO model for the precise detection of tea leaf diseases in UAV images. These applications demonstrate the wide-ranging potential of UAV-LARS technology, enhancing field management efficiency, reducing labor intensity, and offering substantial technical backing for precision agriculture development.
Plant counting and localization have long been a focus of research, with numerous researchers making substantial advancements. The predominant methods include detection-based and regression-based methods. Detection-based methods for plant counting and localization primarily employ techniques from object detection. Madec et al. [11] utilized Faster R-CNN for wheat head counting. Xu et al. [12] initially employed Mask R-CNN to distinguish corn seedlings from the background, subsequently utilizing YOLOv5 to detect and count the segmented corn seedling leaves. Yu et al. [13] employed multiple receptive fields to capture different feature representations, effectively detecting and counting corn tassels in high spatiotemporal image sequences. Ye et al. [14] used bi-directional cascade and weight fusion decoding methods to optimize the extraction of high-level semantic and low-level spatial information. Ye et al. [15] also proposed FGLNet, effectively integrating global and local information through a weighted mechanism to enhance performance. Additionally, Yu et al. [16] introduced PodNet, implementing pod counting and localization through lightweight encoders and efficient decoders. While detection-based methods can provide additional information such as plant size, regression-based methods offer advantages in terms of convergence and inference speed [17].
Regression-based methods can be divided into density map-based methods and point regression-based methods. Density map-based methods first generate a density map of the plant distribution and then sum the density map to obtain the number of plants. Lu et al. [18] achieved corn tassel counting by modeling the local visual features of field images. Xiong et al. [19] reduced redundant calculations based on TasselNet, introducing TasselNetv2 for counting wheat spikes. Additionally, Lu et al. [20] proposed a lighter and faster version, TasselNetV2+, for plant counting based on TasselNetv2. Lu et al. [21] extended TasselNetv2 by introducing TasselNetV3, which used guided upsampling and background suppression for corn tassel counting and interpretable visualization. Peng et al. [22] proposed DeNet for density estimation after wheat tillering. Zheng et al. [23] proposed MLAENet for corn tassel counting, enhancing feature fusion through cascade dilated convolutions and a normalized attention mechanism. Bai et al. [24] improved rice counting accuracy by designing a plant attention mechanism and implementing positive and negative losses for generating high-quality density maps. Similarly, Huang et al. [25] introduced the optimal transport theory to count and locate cotton. Chen et al. [26] extracted and fused finer features based on object size distribution for accurate rice ear counting. Additionally, Li et al. [27] proposed RapeNet and RapeNet+, capable of detecting and counting rape flower clusters in the field. Although density map-based methods currently dominate the field of plant counting, some researchers have begun to explore point regression-based methods for determining plant locations. This approach directly generates predicted points, allowing not only the calculation of plant counts but also precise localization. Zhao et al. [28] proposed P2PNet-Soy for soybean seed counting and localization, effectively distinguishing foreground and background through feature fusion and attention mechanisms.
Although the aforementioned methods have demonstrated competitive performance, detection-based methods rely primarily on box-level annotation, leading to increased data annotation workload in dense plant counting scenarios. On the other hand, regression-based methods primarily rely on density maps and struggle to accurately determine plant locations. Therefore, we select the point-based regression method P2PNet [29] as the baseline to address the above limitations. However, when applied directly to rice counting, the performance of P2PNet is suboptimal. This is mainly due to its simpler backbone network’s inability to extract more effective features, and its simplistic feature fusion in the last two layers, which discards shallow texture and shape information in the rice image. Especially when rice enters the late tillering stage, overlapping leaves can easily cause visual errors, making plant counting and localization more difficult.
To address these problems, we proposed P2PNet-EFF based on P2PNet. Specifically, efficient multiscale attention (EMA) [30] is integrated after the four body layers of the backbone, which suppresses the similar background interference while enhancing the feature extraction capability of the backbone. Additionally, for the original simple down-sampling feature fusion of P2PNet, we innovatively propose enhanced feature fusion (EFF). EFF effectively integrates deep semantic information while preserving the shallow spatial detail structure. At the same time, the transformer encoder layers [31] in the EFF prompt the model to shift its focus from the center point of the plant to the morphology of the entire rice plant. It effectively mitigates misrecognition resulting from visual errors due to leaves overlap, further improving counting and localization accuracy. To validate the effectiveness of the proposed P2PNet-EFF, we conducted comprehensive experiments on the URCAL dataset and three widely used plant count datasets: MTC [18], RFRB [27], and DRPD [32]. In summary, the innovations of this paper mainly include the following:
  • With the proposed EFF module, the model achieves a more efficient fusion of multi-scale features and pays more attention to the overall morphology of the rice plant, which also drastically reduces the misrecognition caused by leaf overlap. As a result, P2PNet-EFF shows better performance in counting tasks with rice and other plants.
  • EMA is a hybrid attention mechanism that integrates spatial attention and channel attention. Our integration of EMA into the backbone helps to reduce the effect of complex background noise and makes the model more focused on the target region, resulting in an overall improvement in accuracy.
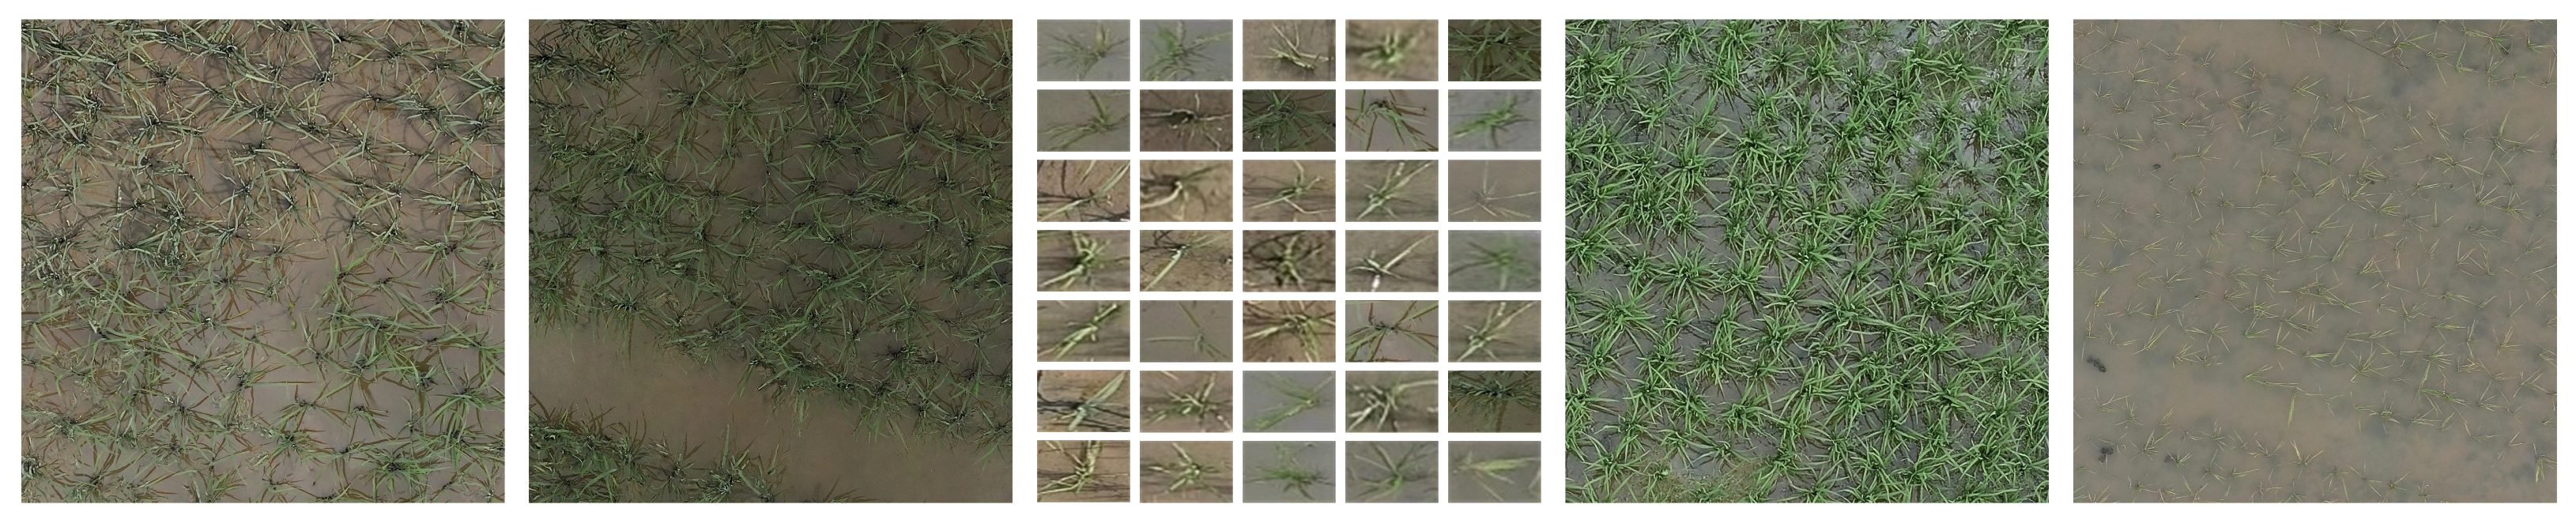
  • We introduce a novel dataset for rice plant counting and localization, consisting of 365 high-resolution images and 173,352 precise point annotations, covering two different growth stages of rice seedlings and tillers.

2. Materials and Methods

2.1. Data Collection

The study site, located at the experimental base of the Hunan Provincial Rice Research Institute, spans over 67,000 square meters. Geographically, it is situated at latitude 28°20′ N and longitude 113°08′ E, with an altitude of 32 m above sea level, experiencing a subtropical monsoon climate. Data collection occurred in May 2023, during the rice seedling and tillering stages, with data collected once every three days. These collections occurred between 9:00 a.m. and 11:00 a.m. under sunny or cloudy weather conditions, ensuring optimal lighting conditions. The temperature ranged from 25 °C to 35 °C, with wind speeds between 1 and 3. A Matrice 300 RTK drone equipped with a Zenmuse P1 was used for data collection, maintaining an altitude of 25 m and a flight speed of 3 m per second throughout the process. Each data collection session lasted approximately 30 min, capturing images in a vertical downward orientation with a resolution of 8192 × 5460 pixels. Figure 1 displays the location of the data acquisition, the equipment used, and a panoramic image of the completed acquisition in detail.

2.2. URCAL Dataset

To facilitate rice counting and localization, the collected images were cropped into 1600 × 1600 resolution images to construct the dataset. The dataset, named URCAL, consists of images of rice taken at different times during the seedling and tillering stages, as shown in Figure 2. In total, we collected 365 images and manually annotated the center of each rice plant using Labelme [33], employing a point annotation. The dataset contains a total of 173,352 annotated rice plants, with the number of rice plants per image ranging from 154 to 710. For model training and evaluation, the dataset was divided into a training set comprising 235 images and a test set comprising the remaining 130 images. The distribution of the number of rice plants in both the training and test sets is depicted in Figure 3. It is noteworthy that the dataset is challenging due to variations in environmental conditions during image capture, including differences in shooting times, lighting conditions, and nutrient supply, which result in significant variability in rice morphology.

2.3. Other Datasets

MTC Dataset: The MTC dataset was created for maize tassel counting tasks and consists of images collected from four experimental fields spanning the years 2010 to 2015. This dataset comprises 186 images in the training set and 175 images in the test set, each annotated with precise points.
RFRB Dataset: The RFRB dataset was designed for rape flower counting and was collected using UAV in Wuhan City, Hubei Province, China, from February to May 2021. It includes images covering various growth stages of rape flowers, such as the bud stage, initial flowering stage, full flowering stage, and withering stage. The dataset contains 90 images in the training set and 24 images in the test set, with the number of rape flower clusters in each image ranging from 8 to 686.
DRPD Dataset: The DRPD dataset was proposed for rice panicle detection and was collected in the Ningxia Hui Autonomous Region of China in 2021 and 2022. Data collection encompassed different stages of rice growth, including the heading stage, flowering stage, pre-grain filling stage, and mid-grain filling stage. This dataset comprises 200 training images and 220 test images, all with a resolution of 512 × 512 pixels, totaling 5372 annotations.

2.4. Methods

2.4.1. P2PNet

P2PNet was originally designed for crowd counting. Unlike previous methods predominantly relying on density maps, P2PNet is a point regression-based method capable of simultaneously determining the position and number of individuals within a given scene. P2PNet has demonstrated excellent performance in crowd counting datasets, motivating us to improve its suitability for the precise counting and localization of rice plants. The main components of P2PNet comprise a feature extractor, an FPN, a classification head, and a regression head. Specifically, in its backbone, P2PNet employs VGG16 [34] for feature extraction and fuses the features from the last two layers to obtain multi-scale features. Subsequently, the fused features are fed into the regression head and classification head, respectively. The regression head produces the target point coordinates, while the classification head produces the confidence score associated with each target point. Finally, by sorting the confidence scores of the target points and retaining those that exceed or equal a predefined threshold as prediction points, the number and location information of the crowd can be obtained.

2.4.2. The Overview of P2PNet-EFF

The architecture of P2PNet-EFF is depicted in Figure 4a, consisting of the feature extractor, the EFF module, the classification head, and the regression head. Firstly, to enhance the feature extraction capability, EMA modules are integrated after each of the four body layers of VGG16. This effectively mitigates the influence of background noise and significantly enhances the model’s ability to capture complex features. Secondly, the EFF module is introduced to replace simple downsampling feature fusion. Within the EFF module, feature maps from four EMA outputs, spanning from shallow to deep layers, are fused and combined with transformer encoder layers to enhance the model’s focus on the entire plant, facilitating the effective utilization of multi-scale feature information. Finally, the outputs from the EFF module are separately fed to the classification head and the regression head, producing prediction points and their corresponding confidence scores.
The set of predicted points output by the model is defined as Y ^ = { ( y ^ i , p ^ i ) | i { 1 , , M } } , comprising M predicted points, where each point is denoted by the coordinates y ^ and the corresponding confidence level p ^ . Similarly, the ground-truth point set is denoted as Y = { y j | j { 1 , , N } } , comprising N ground-truth points, where M >> N. When employing the Hungarian algorithm [35] for one-to-one matching between predicted and ground-truth points, a preliminary step involves constructing a cost matrix C of size M × N. This is achieved by calculating the L 2 distance between predicted and ground-truth points while considering the confidence score. Each element c i , j in this matrix denotes the cost of matching between the i-th predicted point and the j-th ground-truth point. Therefore, c i , j can be expressed as
c i , j = λ 1 y ^ i y j 2 p ^ i
where λ 1 is the weight of the L 2 distance. Then, the optimal one-to-one matching scheme is determined in the cost matrix C, aiming to minimize the total cost of all matching pairs.
Finally, the loss L between the matched predicted points and the ground-truth points is calculated, which can be expressed as
L = 1 N i = 1 N L c l s ( p ^ i ) + λ 2 i = 1 N L r e g ( y ^ i , y i )
where λ 2 is the weight of the regression loss. And L c l s represents the classification loss, which is the cross-entropy loss, while L r e g represents the regression loss, which is the MSE loss. It is important to note that p ^ i and y ^ i are both from the predicted points that were matched.

2.4.3. Enhanced Feature Fusion Module

In the P2PNet, the FPN module downsamples the output of body3 and combines it with the output of body4 to generate fused feature maps. However, this approach overlooks crucial information from the shallow layers, such as details like edges, shapes, and textures of the image. To address this problem, we propose enhanced feature fusion (EFF), detailed in Figure 4b. The EFF module utilizes the outputs of the four EMA modules in the backbone and fuses features progressively from shallow to deep. This fusion strategy not only retains information from the shallow layers but also ensures the richness of the deep features.
After generating the feature maps, we reshape them into a sequence of length H*W and convert the channel dimension into a feature sequence for input into the transformer encoder layer. The multi-head self-attention mechanism in the transformer encoder layer can focus on different aspects of the input sequence’s features and consider the global contextual information of the feature maps. This helps better capture dependencies in the image, further refining the fusion of features extracted by the backbone. Through this approach, our model can more effectively focus on the overall morphology of the plant and achieve superior multi-scale feature fusion, thereby improving counting and localization accuracy.

2.4.4. Efficient Multi-Scale Attention Module

The attention mechanism has found widespread application across diverse fields within computer vision. It is a method that emulates the human visual and cognitive system, facilitating model attention towards important aspects of input data. Attention mechanisms can be categorized into spatial, channel, and hybrid attention mechanisms. Spatial attention mechanisms enhance the spatial invariance of models [36]. By focusing on specific regions in the image, they help the model pay more attention to critical features. Meanwhile, channel attention mechanisms allocate different weights to channels of varying importance and enhance the feature responses of these channels accordingly [37]. Finally, hybrid attention mechanisms combine spatial attention with channel attention, considering both spatial positions and channel importance [38].
We choose to integrate EMA as a module within the feature extractor, enabling the model to incorporate spatial and channel information for enhanced capture of key features. EMA partitions the channel dimension into groups to ensure a uniform distribution of spatial semantic information across each feature group. The EMA module consists of three distinct branches: a 1 × 1 horizontal branch, a 1 × 1 vertical branch, and a 3 × 3 branch, as depicted in Figure 5. Initially, the EMA module divides the input feature map into G groups. Each group is then further divided into three parts, serving as input to the three distinct branches.
In the 1 × 1 horizontal branch, the feature map undergoes one-dimensional horizontal global pooling to integrate spatial information horizontally. Similarly, in the 1 × 1 vertical branch, one-dimensional vertical global pooling is applied to integrate spatial information vertically. The results of these two operations are concatenated, passed through a sigmoid activation function, and merged into a single branch. In the 3 × 3 branch, only a 3 × 3 convolutional kernel is used to capture multi-scale features. Finally, cross-space learning is conducted between the remaining two branches to facilitate comprehensive feature aggregation.

3. Experimental Results and Analyses

3.1. Experiment Setting and Evaluation Metrics

In this paper, we employed the P2PNet-EFF for plant counting and localization. Before experimentation, all images were uniformly scaled to ensure that the longest side did not exceed 2048 pixels. During training, each image was randomly scaled (ranging from 0.7 to 1.3) and horizontally flipped with a 50% probability. The learning rate was set to 0.0001, and the Adam optimizer [39] was used. In the transformer encoder layers, the number of multi-head attention mechanisms was fixed to four and employed a dropout ratio of 0.5. For the URCAL dataset, the number of encoders (N) was set to one, while for other datasets, N was set to six. The backbone was initialized with pre-trained weights provided by PyTorch. Since some datasets were originally used for object detection research, they were annotated with bounding boxes. We adopted the standard practice of using the center point of the bounding box as the training point annotation. The specific experimental runtime environment is detailed in Table 1.
To evaluate the counting effectiveness of the model, we employ metrics such as the mean absolute error (MAE), the root mean square error (RMSE), and the coefficient of determination ( R 2 ). These metrics can be formulated as follows:
M A E = 1 N i = 1 N | P i G i |
R M S E = 1 N i = 1 N P i G i 2
R 2 = 1 i = 1 N ( P i G i ) 2 i = 1 N ( P i G ¯ ) 2
Among them, P i and G i represent the predicted and ground-truth values of the i-th image, respectively, while N denotes the total number of images and G ¯ is the mean of ground-truth count.
The evaluation indicators for plant localization include precision, recall, and F1-measure, which are defined as:
P r e c i s i o n = T P T P + F P
R e c a l l = T P T P + F N
F 1 m e a s u r e = 2 × P r e c i s i o n × R e c a l l P r e c i s i o n + R e c a l l
Here, TP, FP, and FN represent true positives, false positives, and false negatives, respectively.

3.2. Comparison with Other Models

3.2.1. Experiments on URCAL Dataset

In the URCAL dataset, we conducted experiments on plant counting and localization, respectively. For plant counting, we comprehensively compared P2PNet-EFF with current mainstream crowd counting methods (including MCNN [40], CSRNet [41], P2PNet, and FIDTM [42]), along with the latest plant counting methods (Tasselnetv2+ and RPNet [43]), as depicted in Table 2. Our P2PNet-EFF showed significant advantages over P2PNet. It resulted in a 34.87% reduction in the MAE, a 28.19% reduction in the RMSE, and a 3.03% improvement in the R 2 . Moreover, our approach demonstrates similar improvements to the latest rice plant counting method, RPNet. Specifically, P2PNet-EFF achieved a 3.88% decrease in MAE, a 3.57% decrease in RMSE, and a 1.07% increase in R 2 . Meanwhile, we also compare P2PNet-EFF with other methods concerning the number of parameters and the time required to infer a single image. Although our method only increases the number of model parameters by 0.73M compared to P2PNet, the inference time increases by 0.06123 s. For plant localization, we compared our approach with FIDTM and P2PNet, and the results are presented in Table 3. Compared to P2PNet, our method demonstrates an increase in precision by 1.6%, recall by 3.6%, and F1-measure by 2.6%.
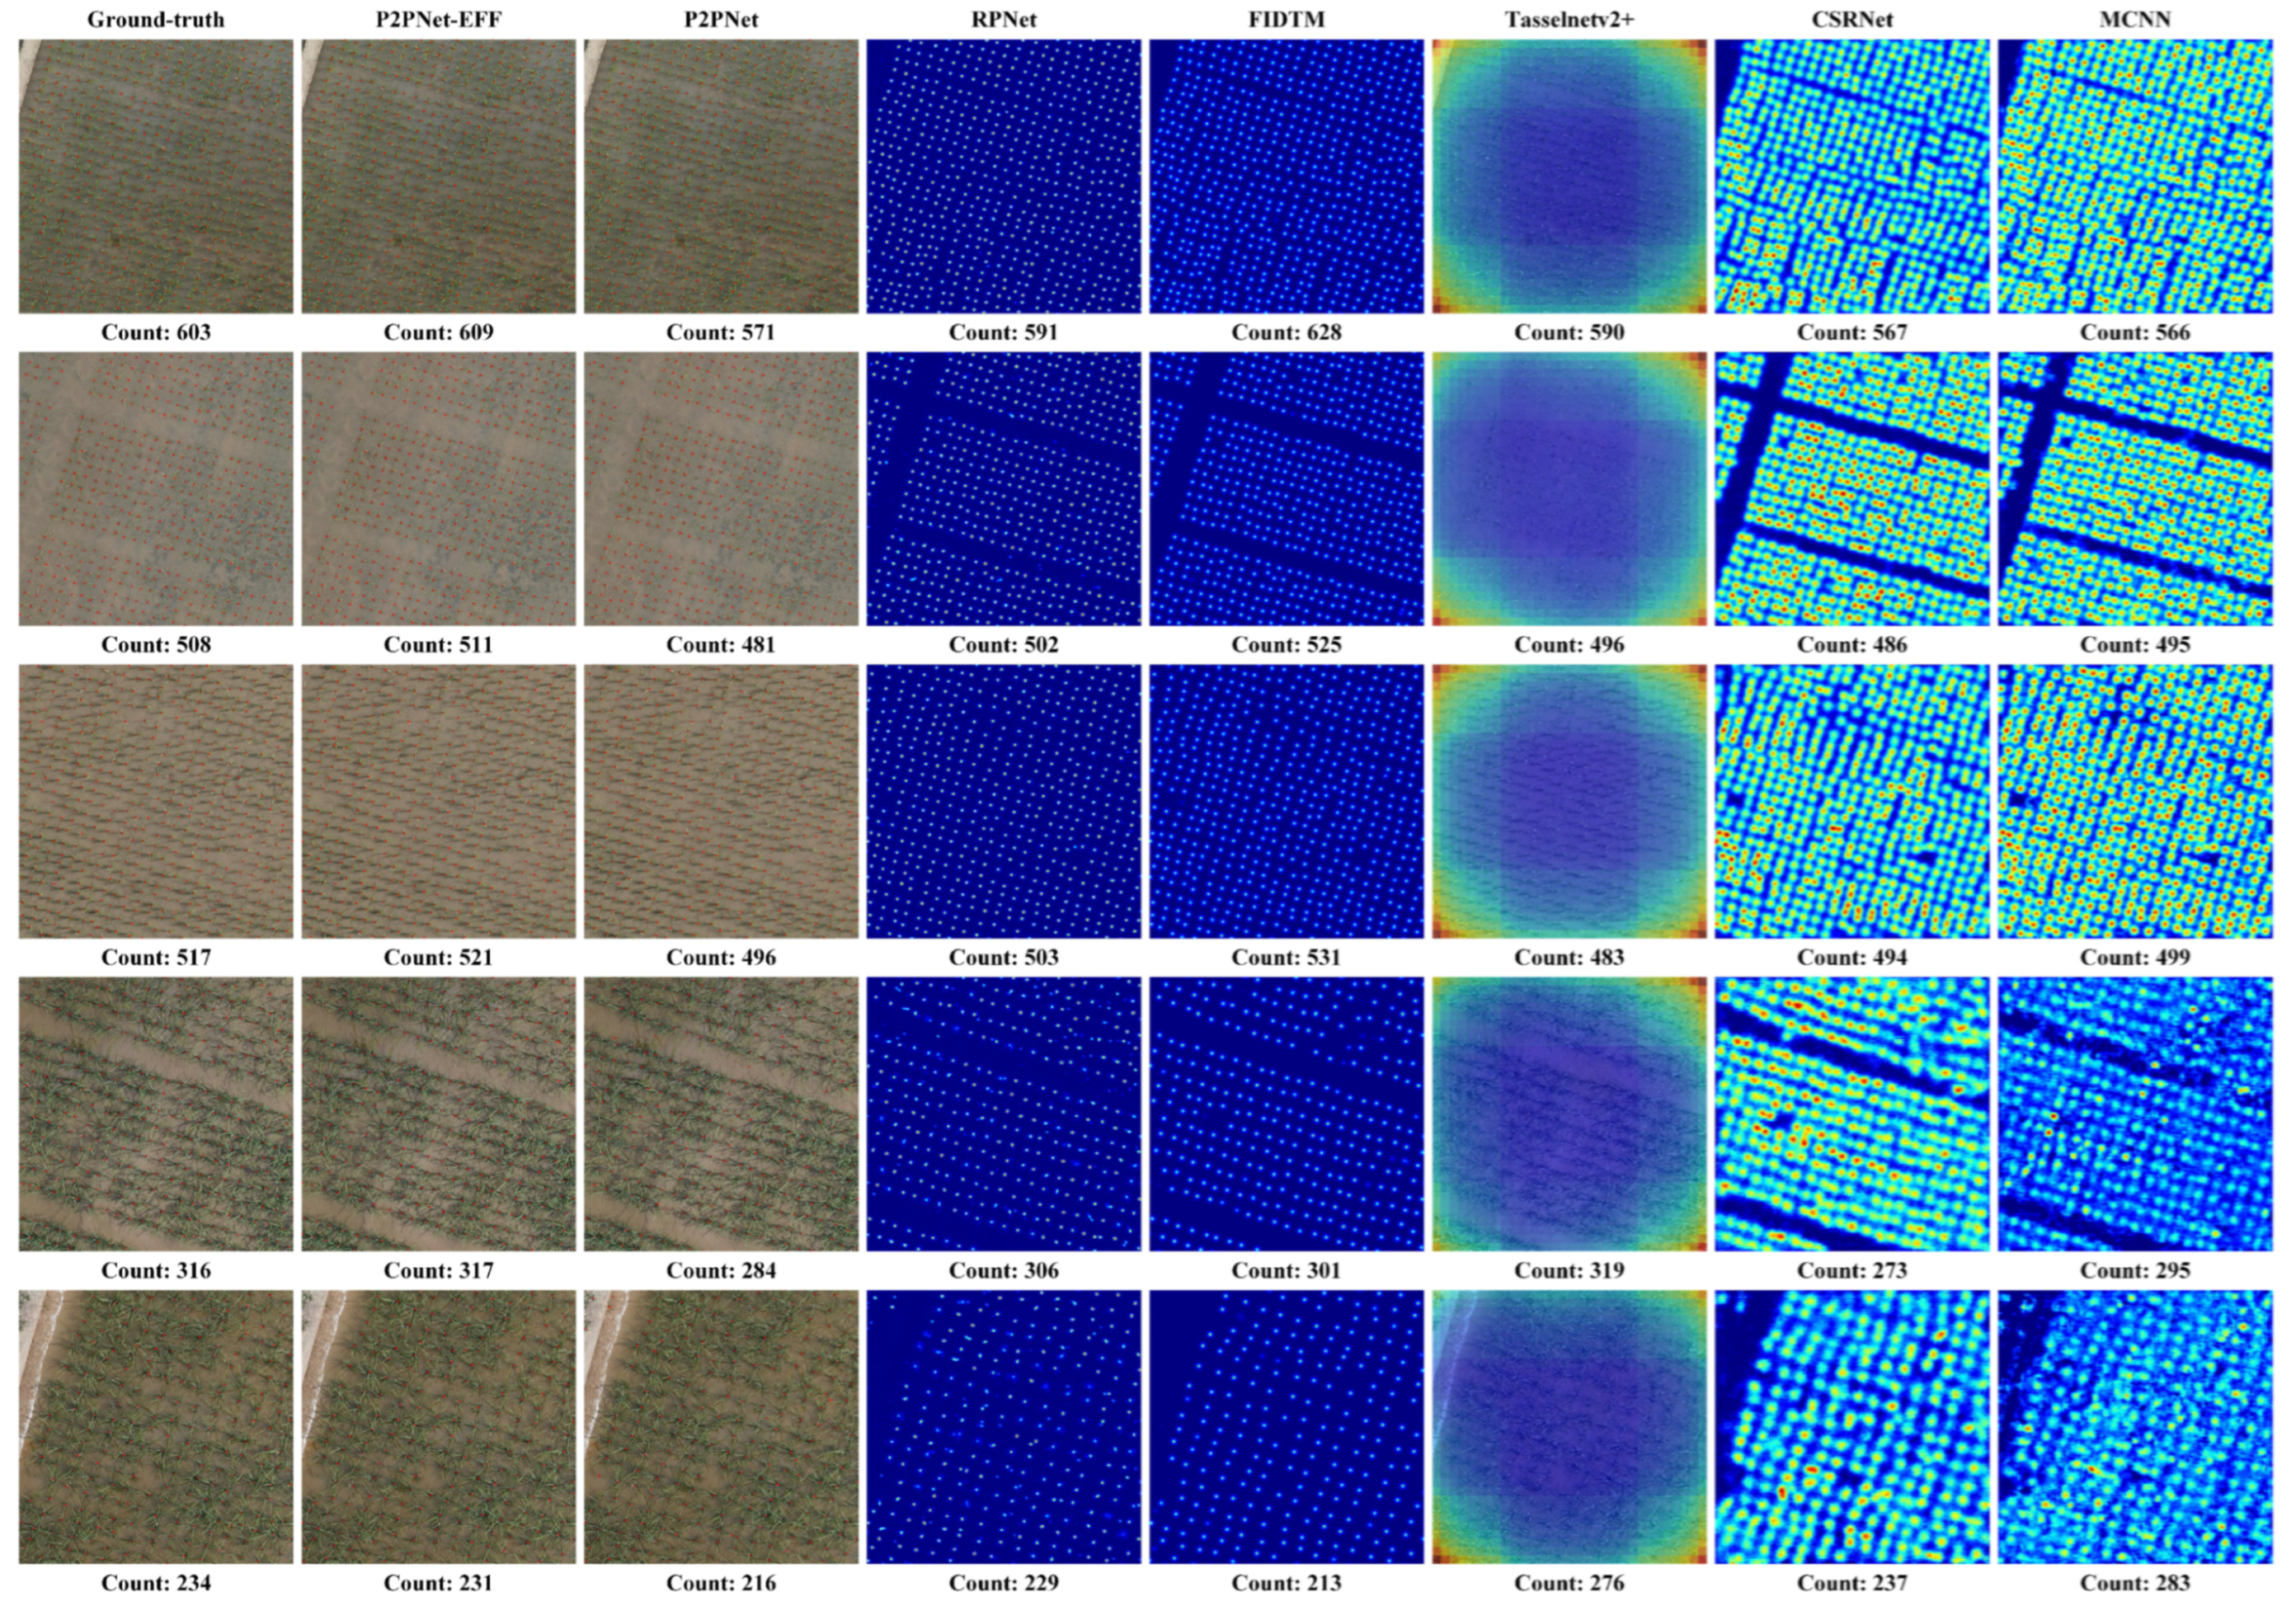
To further validate the effectiveness of our methods, we visualized all the above methods on the URCAL dataset, as depicted in Figure 6. The figure illustrates the visualized results of the ground truth and each method from left to right. Specifically, the second and third columns provide a comparative analysis between P2PNet-EFF and P2PNet, respectively. It is evident from the visualization that our method significantly reduces the number of missed and false recognitions, particularly noticeable in images of rice plants entering the late tillering stage. This improvement can be attributed to the improved feature extractor and enhanced fusion module of P2PNet-EFF, effectively addressing overlapping problems among rice leaves.
Furthermore, the images of rice at the late tillering stage, depicted in rows 4 and 5 of Figure 6, clearly show a significant decline in the quality of the density maps generated by the three density map-based methods, namely, RPNet, CSRNet, and MCNN, compared to the early stage of rice growth. This decline undoubtedly affects their counting accuracy. Meanwhile, despite the FIDTM method utilizing the Focal Inverse Distance Transform map to locate the plant position, its misrecognition rate remains relatively high compared to our method. This is further supported by the data in Table 3, which clearly demonstrate the significant advantage of our method in plant localization accuracy. In summary, our method not only demonstrates excellent counting accuracy but also provides plant location information effortlessly, thereby better fulfilling the practical requirements of precision agriculture.

3.2.2. Experiments on MTC Dataset

The experimental results on the MTC dataset are shown in Table 4. Our method achieves the lowest MAE and RMSE of 3.1 and 4.3 , respectively, outperforming other methods, while achieving the highest R 2 value of 0.9742 . Notably, compared to the P2PNet, our method shows a substantial reduction in MAE and RMSE of 62.20 % and 67.42 % , respectively, as well as a significant increase in R 2 of 29.58 % . This result demonstrates the superior performance of our method over the baseline in feature extraction and multi-scale feature fusion.
Moreover, we also compare the results of P2PNet and P2PNet-EFF on the MTC dataset using visualization methods, as shown in Figure 7. The Grad-CAM [44] heatmap clearly shows that compared to P2PNet, our method pays more attention to the entirety of corn tassels. This is due to our proposed EFF module, which can more finely fuse the multi-scale features. However, our method still faces challenges such as partially missed and false recognitions, primarily stemming from the diverse shapes of corn tassels and severe occlusion.
Table 4. Results of different methods on the MTC dataset.
MethodVenueMAERMSER2
Faster R–CNN [45]TPAMI 20167.910.10.8988
MCNN [40]CVPR 201617.921.90.3288
TasselNet [18]PLME 20176.69.90.8659
CSRNet [41]CVPR 20186.911.50.8221
BCNet [46]TCSVT 20195.29.20.8803
TasselNet V2 [19]PLME 20195.49.20.8923
CenterNet [47]ICCV 20194.66.70.9381
SFC2Net [48]PLPH 20205.09.40.8866
TasselNet V2+ [20]Front Plant Sci 20205.19.00.8880
RetinaNet [49]TPAMI 20205.89.00.9079
TasselNetV3-Seg [21]TGARS 20214.06.80.9396
P2PNet [29]ICCV 20218.213.20.7518
Yolov8-N [50]20234.15.90.9547
TasselLFANet [13]Front Plant Sci 20235.812.80.7797
Yolov8-UAV [51]IEEE Access 20233.65.0-
RPNet [43]Crop J 20233.15.0-
PlantBiCNet [14]EAAI 20243.14.90.9681
P2PNet-EFFThis paper3.14.30.9742

3.2.3. Experiments on RFRB Dataset

In the RFRB dataset, rape flowers grow densely and occlude with each other, which brings great challenges to many methods. The comparison results shown in Table 5 demonstrate the differences between our method and the state-of-the-art (SOTA) method. Compared with the P2PNet, our method achieves a 12.86 % and 14.05 % reduction in MAE and RMSE, respectively, while the R 2 increases by 0.90 % . It can be observed from Figure 8 that our method focuses more on dense areas of rape flowers and can better handle highly overlapping scenes, thus improving the counting accuracy.

3.2.4. Experiments on DRPD Dataset

The experimental results for the DRPD dataset are shown in Table 6. Compared to P2PNet, our method achieves a reduction of 10.53% and 8.33% in the MAE and RMSE, respectively, while R 2 improves by 0.94%. Although our method does not excel in all metrics, the disparity in R 2 compared to PlantBiCNet is merely 0.0022. Figure 9 illustrates the experimental results of P2PNet-EFF and P2PNet on the DRPD dataset. As depicted in the figure, the three rice panicle images exhibit overlapping panicles, and some are occluded by leaves, rendering the rice panicle counting task highly challenging. Despite not yet reaching the performance of the SOTA method, heatmap analysis indicates that our method, compared to P2PNet, is better able to focus on the target itself and effectively reduces interference from rice leaves on the results.

3.3. Ablation Experiment

To verify the effectiveness of P2PNet-EFF, extensive ablation experiments were conducted on the URCAL dataset, and the results are shown in Table 7. First, we directly applied P2PNet as the baseline for rice counting and localization, whose MAE, RMSE, and R 2 were 15.2, 18.8, and 0.9584, respectively. To explore the effect of the EMA module, we added the EMA module to the baseline and found that MAE and RMSE decreased by 1.5 and 0.7, respectively, while R 2 increased by 0.003.
We then removed the EMA module and evaluated the impact of the EFF(x1) module in isolation. In comparison to the baseline, the MAE and RMSE decreased by 3.8 and 2.7, respectively, while improving in R 2 by 0.0111. Subsequently, we utilized the backbone with EMA and incorporated EFF(no). As a result of this enhanced feature fusion approach, there was a notable decrease in MAE and RMSE by 4.4 and 4.3, respectively, accompanied by an increase in R 2 by 0.0167, indicating performance optimization.
Finally, we replaced EFF(no) with EFF(x1). Compared to the experimental results obtained using only EFF(no), the inclusion of transformer encoder layers led to a reduction in MAE and RMSE by 0.9 and 1.0, respectively, accompanied by an increase in R 2 by 0.0123. Additionally, we investigated the impact of varying the number of encoders (N) on the experimental results. According to the experimental results, the addition of six layers resulted in an increase in MAE and RMSE by 1.4 and 2.0, respectively, while R 2 decreased by 0.0037 compared to EFF(x1).
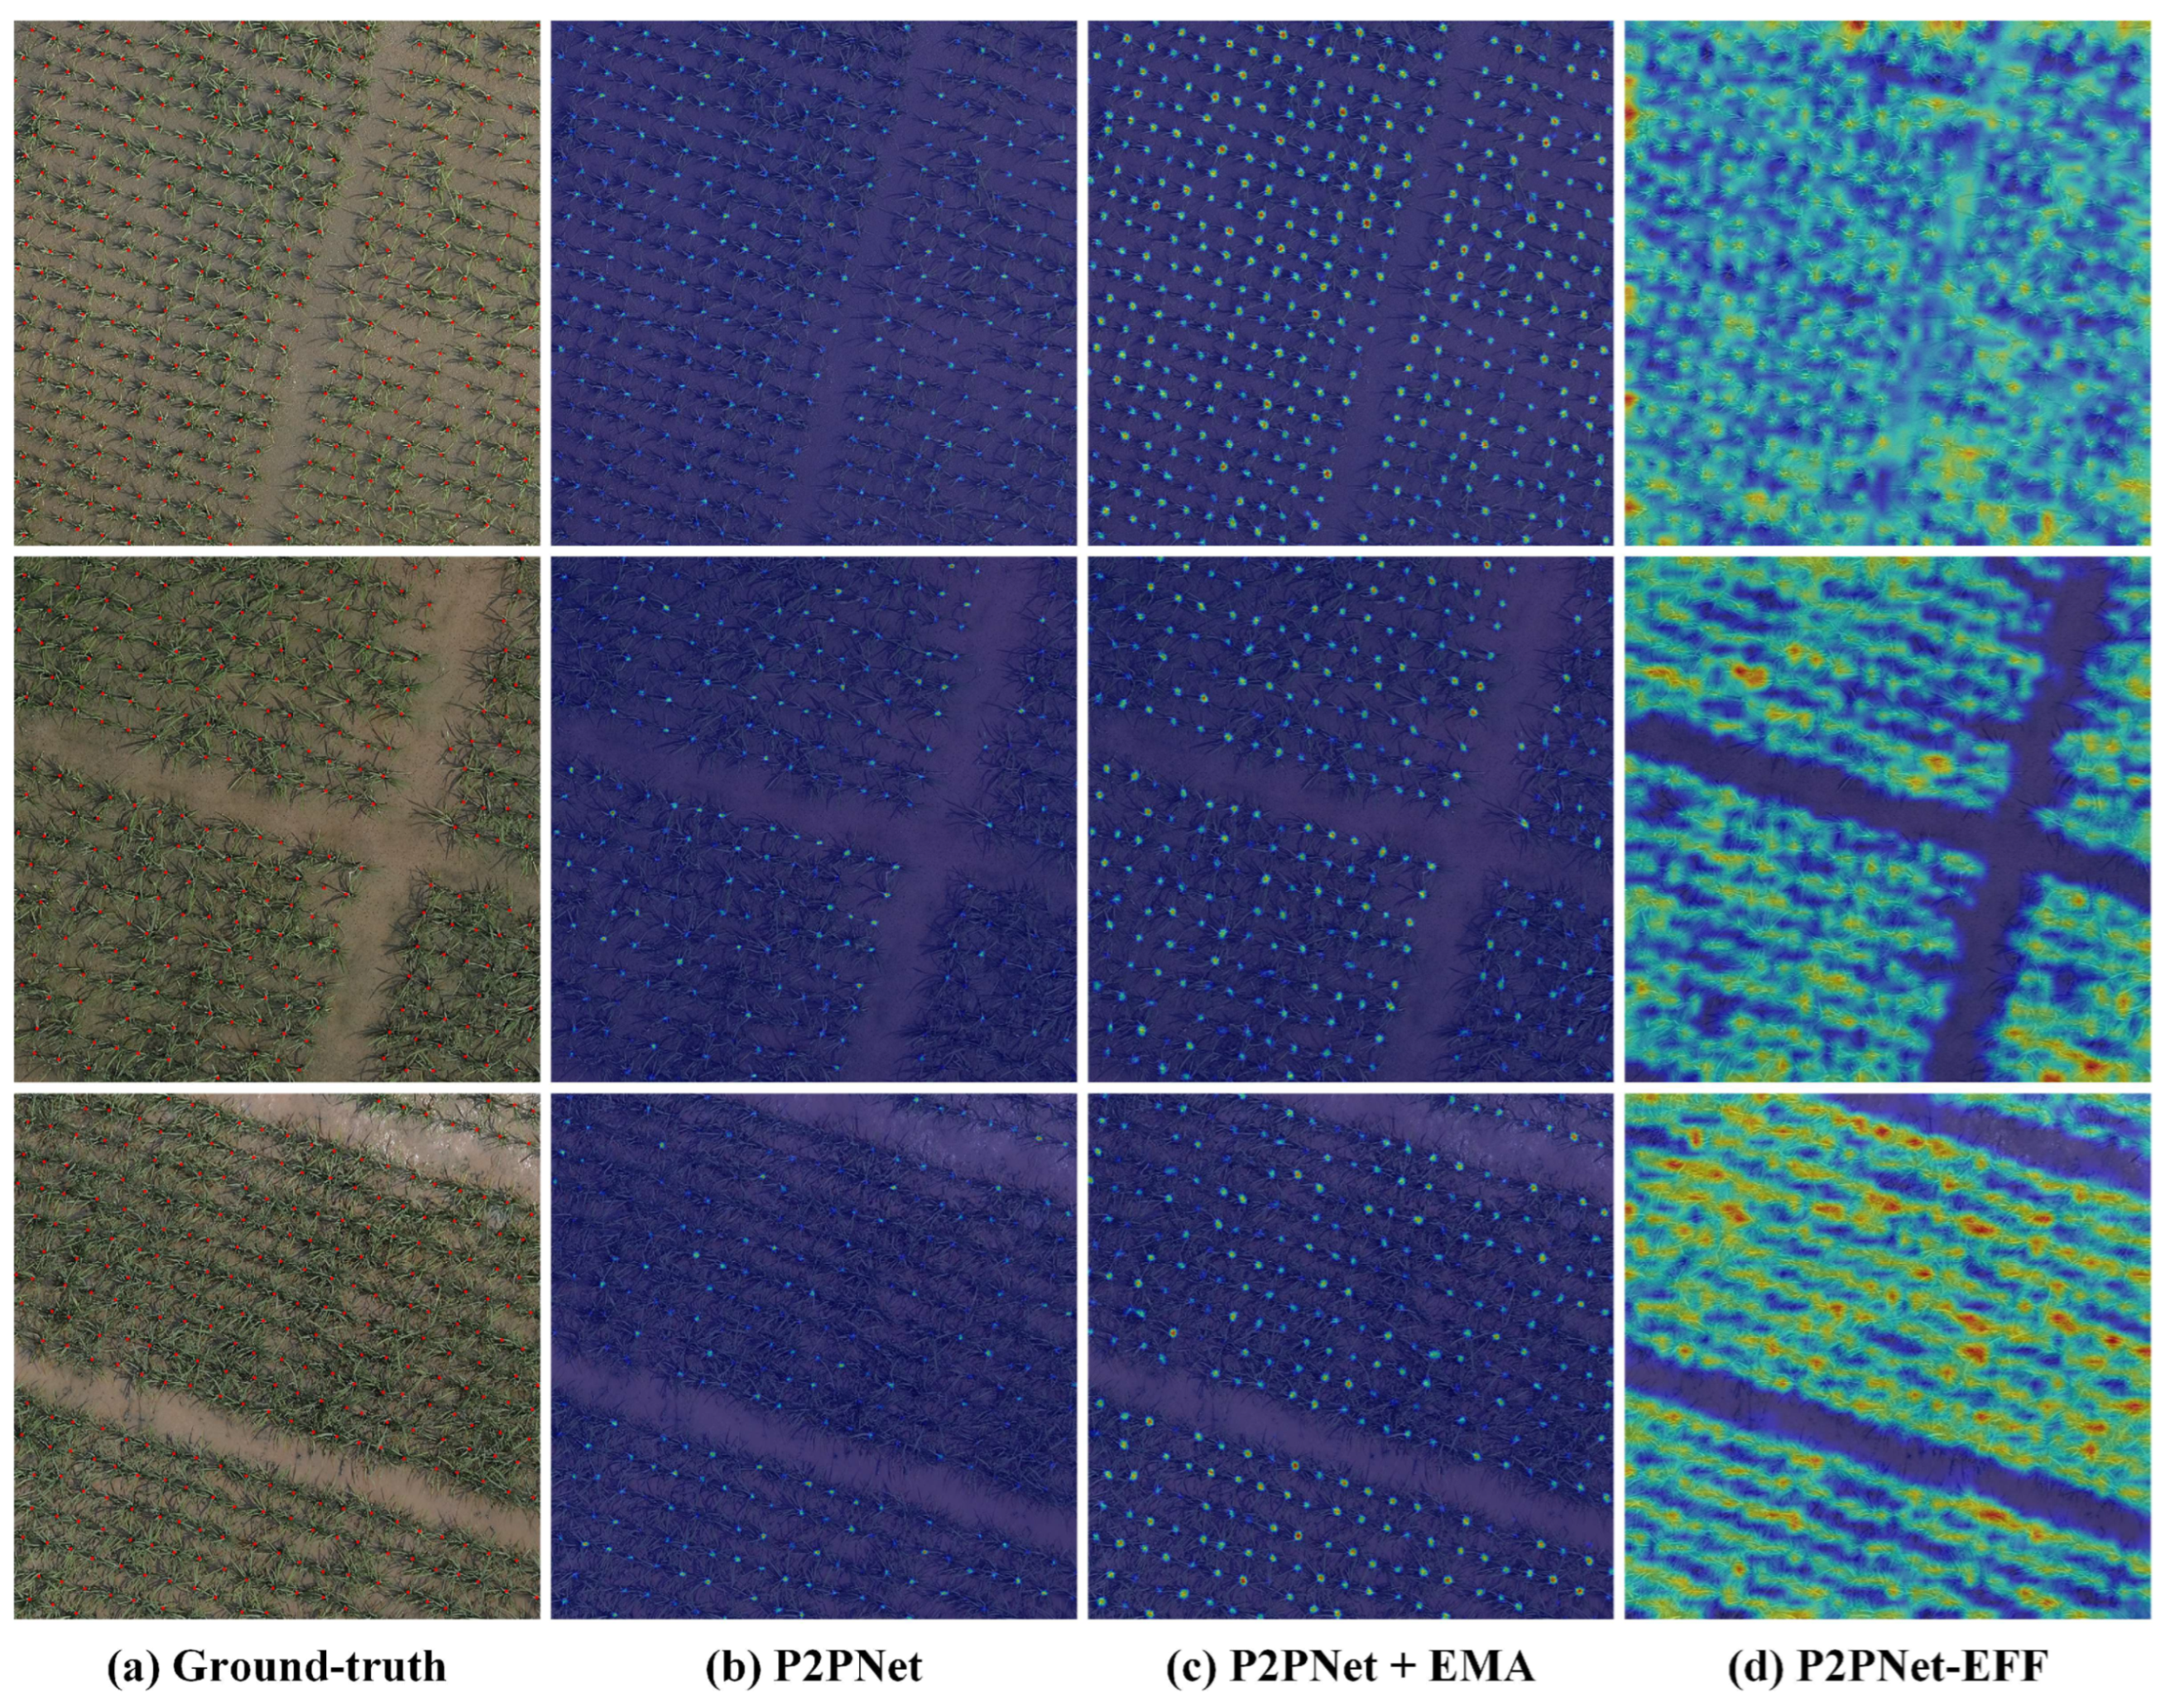
To provide further insight into the impact of different components on improving model performance, we combined the Grad-CAM heatmap for visualization and analysis, as shown in Figure 10. Compared to the baseline, the backbone exhibits improved feature extraction capability after integrating the EMA module. Specifically, Figure 10c illustrates that the model is more focused on the target, thereby alleviating the problem of missed recognition to some extent compared to the baseline. In contrast, Figure 10d presents the visualization results of our complete method. By leveraging the self-attention mechanism in the transformer encoder layer, the model can accurately focus on the rice plant itself rather than being confined to a central location. This enhanced focus on the rice plant enables the model to better handle occurrences of crossing and shading between rice leaves, thus improving counting and localization accuracy.

4. Discussion

Plant counting has been researched extensively. Most existing research employs density map-based methods [18,19,21,43,48] to predict the number of plants. These methods estimate the total count by summing the density maps predicted by the model. While density-based maps can approximate the number and distribution of plants, they lack the precision to pinpoint the coordinates of each plant. Accurate plant location information is essential and critical for precision agriculture. Therefore, we opted to utilize P2PNet, a point regression-based technique derived from crowd counting, for plant counting. P2PNet is advantageous as it can both count plants and accurately determine their locations. However, our application of P2PNet for plant counting exhibited suboptimal performance. This is primarily because the scenario of plant counting differs from the high-density, single-target morphology typical of crowd counting. Plant counting must address challenges such as mutual occlusion between plants and various morphologies (e.g., corn tassels, rice in the late tillering stage, etc.).
To tackle the aforementioned challenges, we propose the P2PNet-EFF model, an improvement of P2PNet, which aims to enhance the counting and localization accuracy of plants. On the URCAL dataset, P2PNet-EFF demonstrated significant improvements in counting accuracy over the original P2PNet model: it reduced the MAE by 34.87% and the MSE by 28.19% and improved the R 2 by 3.03%. For plant localization, the precision, recall, and F1-measure showed improvements of 1.6%, 3.6%, and 2.6%, respectively. Moreover, P2PNet-EFF also exhibited excellent performance on the MTC, RFRB, and DRPD datasets.
The performance improvements of P2PNet-EFF are mainly attributed to two key factors: firstly, the integration of the EMA attention mechanism into the P2PNet backbone, which significantly enhances the model’s focus on targets during feature extraction, thereby mitigating interference from similar background noise. Secondly, we introduced the EFF module, which better explores plant–plant relationships through a finer feature fusion strategy combined with a self-attention mechanism. This enables the model to concentrate more on the features of the plant itself rather than just the center of the overlapping region of the leaves, leading to more accurate performance in plant counting and localization.
Despite the success of our approach, several limitations necessitate further exploration and improvement. Firstly, the deep network structure and the finer feature fusion process of P2PNet-EFF result in a relatively high computational cost, leading to extended inference times. This could impact production efficiency, especially in scenarios requiring the efficient processing of a large number of images. Secondly, our current research primarily focuses on acquiring plant numbers and location information during the early stages of rice growth. However, other important aspects of the rice growth cycle, such as changes in plant size and the number of rice spikes at maturity, have not been studied in depth. This information is equally vital for a comprehensive understanding of crop growth and for optimizing agricultural management strategies.
In future research, we aim to address the aforementioned limitations and plan to make improvements in two main directions. Firstly, we will explore model lightweight techniques, such as channel pruning [52,53] and parameter quantization [54], to reduce computational costs and model size while maintaining accuracy. Secondly, we will broaden the scope of research to encompass rice plant segmentation and spike counting. Accurate plant segmentation facilitates the calculation of the tillering angle, providing a more effective method for monitoring rice growth conditions [55]. Additionally, by employing the P2PNet-EFF model to count rice spikes at maturity and integrating spike counts with thousand-grain weight (TGW), we anticipate more precise yield predictions. These initiatives will enable comprehensive monitoring of the entire rice growth cycle and promote the advancement of rice cultivation and breeding toward intelligence and precision.

5. Conclusions

This paper proposes the P2PNet-EFF based on P2PNet. By introducing the EFF module, this module effectively replaces the simple two-layer downsampling feature fusion method in P2PNet, thus achieving finer fusion. This improvement enables the model to pay more comprehensive attention to the overall morphology of the plants, significantly reducing counting and localization errors caused by leaf overlap. Additionally, by embedding EMA modules behind the four body layers of the backbone, the P2PNet-EFF not only effectively suppresses the interference caused by similar backgrounds but also significantly enhances the feature extraction capability.
To evaluate the effectiveness of P2PNet-EFF, we constructed a UAV-based rice plant counting and localization dataset, URCAL, and conducted extensive experiments. Specifically, the experimental results show that compared to the original P2PNet, P2PNet-EFF reduces the MAE and RMSE by 34.87% and 28.19%, respectively, and increases the R 2 by 3.03%. Furthermore, we also conducted experiments on three commonly used plant counting datasets, MTC, RFRB, and DRPD. The results demonstrate that P2PNet-EFF achieves significant performance improvements over P2PNet and also provides competitive results compared to recent SOTA methods. Meanwhile, we also performed ablation experiments in conjunction with Grad-CAM heatmaps. The experimental results clearly demonstrate the effectiveness of each proposed component.
Finally, we discussed the limitations of the P2PNet-EFF and proposed possible future research directions to further refine and optimize our method.

Author Contributions

Conceptualization, M.Y. and Y.S.; methodology, M.Y.; software, M.Y.; validation, M.Y., Y.S. and W.L.; formal analysis, M.Y., Y.S. and W.L.; investigation, M.Y.; resources, Y.S. and L.C.; data curation, M.Y.; writing—original draft preparation, M.Y.; writing—review and editing, M.Y., Y.S., W.L., H.Z., R.Z., L.C., Z.Q. and S.Y.; visualization, M.Y.; supervision, L.C., Y.S. and W.L.; project administration, Y.S.; funding acquisition, Y.S. All authors have read and agreed to the published version of the manuscript.

Funding

This research was supported by the following programs: Hunan Province Key RD Plan Project (2023NK2011), Changsha Science and Technology Major Project (kh2103001), and Scientific research project of Hunan Provincial Department of Education (22B0204).

Data Availability Statement

The data presented in this study can be obtained upon request from the corresponding author. Other datasets can be obtained from their original papers.

Conflicts of Interest

Author Li Chen is employed by the company Hunan Sureserve Technology Co., Ltd., Changsha 410000, China. The remaining authors declare that the research was conducted in the absence of any commercial or financial relationships that could be construed as a potential conflict of interest.

References

  1. Sen, S.; Chakraborty, R.; Kalita, P. Rice-not just a staple food: A comprehensive review on its phytochemicals and therapeutic potential. Trends Food Sci. Technol. 2020, 97, 265–285. [Google Scholar] [CrossRef]
  2. Counce, P.A.; Wells, B. Rice plant population density effect on early-season nitrogen requirement. J. Prod. Agric. 1990, 3, 390–393. [Google Scholar] [CrossRef]
  3. Baloch, A.; Soomro, A.; Javed, M.; Ahmed, M.; Bughio, H.; Bughio, M.; Mastoi, N. Optimum plant density for high yield in rice (Oryza sativa L.). Asian J. Plant Sci. 2002, 1, 25–27. [Google Scholar] [CrossRef]
  4. Chawade, A.; van Ham, J.; Blomquist, H.; Bagge, O.; Alexandersson, E.; Ortiz, R. High-throughput field-phenotyping tools for plant breeding and precision agriculture. Agronomy 2019, 9, 258. [Google Scholar] [CrossRef]
  5. Khanal, S.; Kc, K.; Fulton, J.P.; Shearer, S.; Ozkan, E. Remote sensing in agriculture—Accomplishments, limitations, and opportunities. Remote Sens. 2020, 12, 3783. [Google Scholar] [CrossRef]
  6. Mukherjee, A.; Misra, S.; Raghuwanshi, N.S. A survey of unmanned aerial sensing solutions in precision agriculture. J. Netw. Comput. Appl. 2019, 148, 102461. [Google Scholar] [CrossRef]
  7. Liu, J.; Xiang, J.; Jin, Y.; Liu, R.; Yan, J.; Wang, L. Boost precision agriculture with unmanned aerial vehicle remote sensing and edge intelligence: A survey. Remote Sens. 2021, 13, 4387. [Google Scholar] [CrossRef]
  8. Qin, Z.; Chang, Q.; Xie, B.; Shen, J. Rice leaf nitrogen content estimation based on hysperspectral imagery of UAV in Yellow River diversion irrigation district. Trans. Chin. Soc. Agric. Eng. 2016, 32, 77–85. [Google Scholar]
  9. Gallo, I.; Rehman, A.U.; Dehkordi, R.H.; Landro, N.; La Grassa, R.; Boschetti, M. Deep object detection of crop weeds: Performance of YOLOv7 on a real case dataset from UAV images. Remote Sens. 2023, 15, 539. [Google Scholar] [CrossRef]
  10. Bao, W.; Zhu, Z.; Hu, G.; Zhou, X.; Zhang, D.; Yang, X. UAV remote sensing detection of tea leaf blight based on DDMA-YOLO. Comput. Electron. Agric. 2023, 205, 107637. [Google Scholar] [CrossRef]
  11. Madec, S.; Jin, X.; Lu, H.; De Solan, B.; Liu, S.; Duyme, F.; Heritier, E.; Baret, F. Ear density estimation from high resolution RGB imagery using deep learning technique. Agric. For. Meteorol. 2019, 264, 225–234. [Google Scholar] [CrossRef]
  12. Xu, X.; Wang, L.; Shu, M.; Liang, X.; Ghafoor, A.Z.; Liu, Y.; Ma, Y.; Zhu, J. Detection and counting of maize leaves based on two-stage deep learning with UAV-based RGB image. Remote Sens. 2022, 14, 5388. [Google Scholar] [CrossRef]
  13. Yu, Z.; Ye, J.; Zhou, H. TasselLFANet: A novel lightweight multi-branch feature aggregation neural network for high-throughput image-based maize tassels detection and counting. Front. Plant Sci. 2023, 14, 1158940. [Google Scholar] [CrossRef] [PubMed]
  14. Ye, J.; Yu, Z.; Wang, Y.; Lu, D.; Zhou, H. PlantBiCNet: A new paradigm in plant science with bi-directional cascade neural network for detection and counting. Eng. Appl. Artif. Intell. 2024, 130, 107704. [Google Scholar] [CrossRef]
  15. Ye, J.; Yu, Z. Fusing Global and Local Information Network for Tassel Detection in UAV Imagery. IEEE J. Sel. Top. Appl. Earth Obs. Remote. Sens. 2024, 17, 4100–4108. [Google Scholar] [CrossRef]
  16. Yu, Z.; Wang, Y.; Ye, J. Accurate and fast implementation osoybean pod counting and localization from high-resolutioimage. Front. Plant Sci. 2024, 15, 1320109. [Google Scholar] [CrossRef] [PubMed]
  17. Zou, H.; Lu, H.; Li, Y.; Liu, L.; Cao, Z. Maize tassels detection: A benchmark of the state of the art. Plant Methods 2020, 16, 108. [Google Scholar] [CrossRef] [PubMed]
  18. Lu, H.; Cao, Z.; Xiao, Y.; Zhuang, B.; Shen, C. TasselNet: Counting maize tassels in the wild via local counts regression network. Plant Methods 2017, 13, 79. [Google Scholar] [CrossRef] [PubMed]
  19. Xiong, H.; Cao, Z.; Lu, H.; Madec, S.; Liu, L.; Shen, C. TasselNetv2: In-field counting of wheat spikes with context-augmented local regression networks. Plant Methods 2019, 15, 150. [Google Scholar] [CrossRef]
  20. Lu, H.; Cao, Z. TasselNetV2+: A fast implementation for high-throughput plant counting from high-resolution RGB imagery. Front. Plant Sci. 2020, 11, 541960. [Google Scholar] [CrossRef]
  21. Lu, H.; Liu, L.; Li, Y.N.; Zhao, X.M.; Wang, X.Q.; Cao, Z.G. TasselNetV3: Explainable plant counting with guided upsampling and background suppression. IEEE Trans. Geosci. Remote Sens. 2021, 60, 1–15. [Google Scholar] [CrossRef]
  22. Peng, J.; Rezaei, E.E.; Zhu, W.; Wang, D.; Li, H.; Yang, B.; Sun, Z. Plant Density Estimation Using UAV Imagery and Deep Learning. Remote Sens. 2022, 14, 5923. [Google Scholar] [CrossRef]
  23. Zheng, H.; Fan, X.; Bo, W.; Yang, X.; Tjahjadi, T.; Jin, S. A multiscale point-supervised network for counting maize tassels in the wild. Plant Phenomics 2023, 5, 100. [Google Scholar] [CrossRef] [PubMed]
  24. Bai, X.; Liu, P.; Cao, Z.; Lu, H.; Xiong, H.; Yang, A.; Cai, Z.; Wang, J.; Yao, J. Rice plant counting, locating, and sizing method based on high-throughput UAV RGB images. Plant Phenomics 2023, 5, 20. [Google Scholar] [CrossRef] [PubMed]
  25. Huang, Y.; Li, Y.; Liu, Y.; Zheng, D. In-field cotton counting and localization jointly based on density-guided optimal transport. Comput. Electron. Agric. 2023, 212, 108058. [Google Scholar] [CrossRef]
  26. Chen, Y.; Xin, R.; Jiang, H.; Liu, Y.; Zhang, X.; Yu, J. Refined feature fusion for in-field high-density and multi-scale rice panicle counting in UAV images. Comput. Electron. Agric. 2023, 211, 108032. [Google Scholar] [CrossRef]
  27. Li, J.; Wang, E.; Qiao, J.; Li, Y.; Li, L.; Yao, J.; Liao, G. Automatic rape flower cluster counting method based on low-cost labelling and UAV-RGB images. Plant Methods 2023, 19, 40. [Google Scholar] [CrossRef] [PubMed]
  28. Zhao, J.; Kaga, A.; Yamada, T.; Komatsu, K.; Hirata, K.; Kikuchi, A.; Hirafuji, M.; Ninomiya, S.; Guo, W. Improved field-based soybean seed counting and localization with feature level considered. Plant Phenomics 2023, 5, 26. [Google Scholar] [CrossRef] [PubMed]
  29. Song, Q.; Wang, C.; Jiang, Z.; Wang, Y.; Tai, Y.; Wang, C.; Li, J.; Huang, F.; Wu, Y. Rethinking counting and localization in crowds: A purely point-based framework. In Proceedings of the IEEE/CVF International Conference on Computer Vision, Montreal, QC, Canada, 10–17 October 2021; pp. 3365–3374. [Google Scholar]
  30. Ouyang, D.; He, S.; Zhang, G.; Luo, M.; Guo, H.; Zhan, J.; Huang, Z. Efficient multi-scale attention module with cross-spatial learning. In Proceedings of the ICASSP 2023-2023 IEEE International Conference on Acoustics, Speech and Signal Processing (ICASSP), Rhodes Island, Greece, 4–10 June 2023; pp. 1–5. [Google Scholar]
  31. Vaswani, A.; Shazeer, N.; Parmar, N.; Uszkoreit, J.; Jones, L.; Gomez, A.N.; Kaiser, Ł.; Polosukhin, I. Attention is all you need. Adv. Neural Inf. Process. Syst. 2017, 30, 5998–6008. [Google Scholar]
  32. Teng, Z.; Chen, J.; Wang, J.; Wu, S.; Chen, R.; Lin, Y.; Shen, L.; Jackson, R.; Zhou, J.; Yang, C. Panicle-cloud: An open and AI-powered cloud computing platform for quantifying rice panicles from drone-collected imagery to enable the classification of yield production in rice. Plant Phenomics 2023, 5, 105. [Google Scholar] [CrossRef]
  33. Russell, B.C.; Torralba, A.; Murphy, K.P.; Freeman, W.T. LabelMe: A database and web-based tool for image annotation. Int. J. Comput. Vis. 2008, 77, 157–173. [Google Scholar] [CrossRef]
  34. Simonyan, K.; Zisserman, A. Very deep convolutional networks for large-scale image recognition. In Proceedings of the 3rd International Conference on Learning Representations (ICLR 2015); Computational and Biological Learning Society, San Diego, CA, USA, 7–9 May 2015; Bengio, Y., LeCun, Y., Eds.; Oxford University: Oxford, UK, 2015. [Google Scholar]
  35. Kuhn, H.W. The Hungarian method for the assignment problem. Nav. Res. Logist. Q. 1955, 2, 83–97. [Google Scholar] [CrossRef]
  36. Jaderberg, M.; Simonyan, K.; Zisserman, A. Spatial transformer networks. Adv. Neural Inf. Process. Syst. 2015, 28, 2017–2025. [Google Scholar]
  37. Hu, J.; Shen, L.; Sun, G. Squeeze-and-excitation networks. IEEE Conf. Comput. Vis. Pattern Recognit. 2018, 42, 2011–2023. [Google Scholar]
  38. Woo, S.; Park, J.; Lee, J.Y.; Kweon, I.S. Cbam: Convolutional block attention module. In Proceedings of the European Conference on Computer Vision (ECCV), Munich, Germany, 8–14 September 2018; pp. 3–19. [Google Scholar]
  39. Kingma, D.P.; Ba, J. Adam: A method for stochastic optimization. arXiv 2014, arXiv:1412.6980. [Google Scholar]
  40. Zhang, Y.; Zhou, D.; Chen, S.; Gao, S.; Ma, Y. Single-image crowd counting via multi-column convolutional neural network. In Proceedings of the IEEE Conference on Computer Vision and Pattern Recognition, Las Vegas, NV, USA, 27–30 June 2016; pp. 589–597. [Google Scholar]
  41. Li, Y.; Zhang, X.; Chen, D. Csrnet: Dilated convolutional neural networks for understanding the highly congested scenes. In Proceedings of the IEEE Conference on Computer Vision and Pattern Recognition, Salt Lake City, UT, USA, 18–23 June 2018; pp. 1091–1100. [Google Scholar]
  42. Liang, D.; Xu, W.; Zhu, Y.; Zhou, Y. Focal inverse distance transform maps for crowd localization. IEEE Trans. Multimed. 2022, 25, 6040–6052. [Google Scholar] [CrossRef]
  43. Bai, X.; Gu, S.; Liu, P.; Yang, A.; Cai, Z.; Wang, J.; Yao, J. Rpnet: Rice plant counting after tillering stage based on plant attention and multiple supervision network. Crop. J. 2023, 11, 1586–1594. [Google Scholar] [CrossRef]
  44. Selvaraju, R.R.; Cogswell, M.; Das, A.; Vedantam, R.; Parikh, D.; Batra, D. Grad-cam: Visual explanations from deep networks via gradient-based localization. In Proceedings of the IEEE International Conference on Computer Vision, Venice, Italy, 22–29 October 2017; pp. 618–626. [Google Scholar]
  45. Ren, S.; He, K.; Girshick, R.; Sun, J. Faster R-CNN: Towards real-time object detection with region proposal networks. IEEE Trans. Pattern Anal. Mach. Intell. 2016, 39, 1137–1149. [Google Scholar] [CrossRef]
  46. Liu, L.; Lu, H.; Xiong, H.; Xian, K.; Cao, Z.; Shen, C. Counting objects by blockwise classification. IEEE Trans. Circuits Syst. Video Technol. 2019, 30, 3513–3527. [Google Scholar] [CrossRef]
  47. Duan, K.; Bai, S.; Xie, L.; Qi, H.; Huang, Q.; Tian, Q. Centernet: Keypoint triplets for object detection. In Proceedings of the IEEE/CVF International Conference on Computer Vision, Seoul, Republic of Korea, 27 October 2019–2 November 2019; pp. 6569–6578. [Google Scholar]
  48. Liu, L.; Lu, H.; Li, Y.; Cao, Z. High-throughput rice density estimation from transplantation to tillering stages using deep networks. Plant Phenomics 2020, 2020, 1375957. [Google Scholar] [CrossRef]
  49. Lin, T.Y.; Goyal, P.; Girshick, R.; He, K.; Dollar, P. Focal Loss for Dense Object Detection. IEEE Trans. Pattern Anal. Mach. Intell. 2020, 42, 318–327. [Google Scholar] [CrossRef] [PubMed]
  50. Glenn, Jocher, Yolov8. 2023. Available online: https://github.com/ultralytics/ultralytics (accessed on 26 March 2024).
  51. Lu, D.; Ye, J.; Wang, Y.; Yu, Z. Plant detection and counting: Enhancing precision agriculture in UAV and general scenes. IEEE Access 2023, 11, 116196–116205. [Google Scholar] [CrossRef]
  52. Lin, M.; Ji, R.; Wang, Y.; Zhang, Y.; Zhang, B.; Tian, Y.; Shao, L. Hrank: Filter pruning using high-rank feature map. In Proceedings of the IEEE/CVF Conference on Computer Vision and Pattern Recognition, Seattle, WA, USA, 13–19 June 2020; pp. 1529–1538. [Google Scholar]
  53. Zhang, Y.; Lin, M.; Lin, C.W.; Chen, J.; Wu, Y.; Tian, Y.; Ji, R. Carrying out CNN channel pruning in a white box. IEEE Trans. Neural Netw. Learn. Syst. 2022, 34, 7946–7955. [Google Scholar] [CrossRef] [PubMed]
  54. Courbariaux, M.; Bengio, Y.; David, J.P. Binaryconnect: Training deep neural networks with binary weights during propagations. Adv. Neural Inf. Process. Syst. 2015, 28, 3123–3131. [Google Scholar]
  55. Wang, W.; Gao, H.; Liang, Y.; Li, J.; Wang, Y. Molecular basis underlying rice tiller angle: Current progress and future perspectives. Mol. Plant 2022, 15, 125–137. [Google Scholar] [CrossRef]
Figure 1. (a) Data collection location; (b) data collection equipment and experimental scene; (c) panoramic image after collection.
Agronomy 14 00868 g001
Figure 2. Examples of images from the URCAL dataset showing the morphological diversity of different rice plants.
Agronomy 14 00868 g002
Figure 3. (a) Histogram of the number of rice plants vs. the number of pictures in the URCAL training set. (b) Histogram of the number of rice plants vs. the number of pictures in the URCAL test set.
Agronomy 14 00868 g003
Figure 4. (a) Overall architecture of P2PNet-EFF, where (x, y) are point coordinates and p is the prediction confidence generated by the classification header. T in P m > T is the threshold for filtering labels during model inference. (b) Detailed flowchart of EFF, where (B, N, W, H) denotes the shape of the feature map, B is the batch size, N is the number of channels, and W, H are the width and height, respectively.
Agronomy 14 00868 g004
Figure 5. The structure of efficient multi-scale attention module.
Agronomy 14 00868 g005
Figure 6. Visualization of the results obtained by the various methods on the URCAL dataset. In the ground truth, “count” denotes the number of ground-truth points, while in the other methods, “count” signifies the counts predicted by each respective method.
Agronomy 14 00868 g006
Figure 7. Visualization of the results by P2PNet and P2PNet-EFF on the MTC dataset. Includes prediction results and Grad-CAM heatmaps. The darker the color of the heatmap, the more attention the model pays to it and the greater its contribution to the results.
Agronomy 14 00868 g007
Figure 8. Visualization of the results by P2PNet and P2PNet-EFF on the RFRB dataset.
Agronomy 14 00868 g008
Figure 9. Visualization of the results by P2PNet and P2PNet-EFF on the DRPD dataset.
Agronomy 14 00868 g009
Figure 10. Heatmap of ablation experiments on the URCAL dataset. (a) Shows the ground-truth results; (b) shows the results of the baseline, which is the base performance without adding any enhancement module; (c) shows the results after adding the EMA module to the backbone; (d) shows the results of our P2PNet-EFF(x1) method.
Agronomy 14 00868 g010
Table 1. Experimental running software configuration and hardware configuration.
ParameterConfiguration
CPUAMD Ryzen 9 7950X
GPUNVIDIA GeForce RTX 4090
Memory128 GB
Operating systemWindows 10
CUDACUDA 12.0
PytorchPytorch 2.0.1
Table 2. Counting results of different methods on the URCAL dataset. Bold fonts indicate the best results.
MethodVenueParamsMAERMSER2Processing Time
MCNN [40]CVPR 20160.12 M19.925.70.92690.01565 s/img
CSRNet [41]CVPR 201815.51 M12.317.80.96160.05045 s/img
TasselNet V2+ [20]Front Plant Sci 20200.25 M16.921.30.94890.01096 s/img
P2PNet [29]ICCV 202118.33 M15.218.80.95840.06238 s/img
FIDTM [42]TMM 202263.50 M15.318.00.98732.87730 s/img
RPNet [43]Crop J 202319.69 M10.314.00.97690.12883 s/img
P2PNet-EFFThis paper19.06 M9.913.50.98740.12361 s/img
Table 3. Localization results of different methods on the URCAL dataset.
MethodVenuePrecisionRecallF1-Measure
P2PNet [29]ICCV 202185.5%84.8%85.1%
FIDTM [42]TMM 202280.9%82.6%81.7%
P2PNet-EFFThis paper87.1%88.4%87.7%
Table 5. Results of different methods on the RFRB dataset.
MethodVenueMAERMSER2
Faster R–CNN [45]TPAMI 2016137.3173.80.5649
CenterNet [47]ICCV 201925.534.30.9541
RetinaNet [49]TPAMI 2020265.3319.90.2748
P2PNet [29]ICCV 202121.029.90.9644
Yolov8-N [50]202328.939.30.9418
TasselLFANet [13]Front Plant Sci 202329.337.30.9526
Yolov8-UAV [51]IEEE Access 202328.536.1-
RapeNet [27]PLME 202325.332.70.9566
PlantBiCNet [14]EAAI 202425.332.20.9593
P2PNet-EFFThis paper18.325.70.9731
Table 6. Results of different methods on the DRPD dataset.
MethodVenueMAERMSER2
Faster R–CNN [45]TPAMI 20163.23.90.8239
CenterNet [47]ICCV 20192.53.10.9067
RetinaNet [49]TPAMI 20203.44.50.8386
P2PNet [29]ICCV 20211.92.40.9161
Yolov8-N [50]20232.33.30.8599
TasselLFANet [13]Front Plant Sci 20232.12.80.8903
PlantBiCNet [14]EAAI 20241.72.20.9269
P2PNet-EFFThis paper1.72.20.9247
Table 7. Ablation experiments were conducted on the URCAL dataset, where EFF(no) means that no transformer encoder layer is introduced, EFF(x1) means that the number of encoders N is 1, and EFF(x6) means that the number of encoders is 6.
BselineEMAEFF(no)EFF(x1)EFF(x6)MAERMSER2
15.218.80.9584
13.718.10.9614
11.416.10.9695
10.814.50.9751
9.913.50.9874
11.315.50.9837
Disclaimer/Publisher’s Note: The statements, opinions and data contained in all publications are solely those of the individual author(s) and contributor(s) and not of MDPI and/or the editor(s). MDPI and/or the editor(s) disclaim responsibility for any injury to people or property resulting from any ideas, methods, instructions or products referred to in the content.

