Article

Enhanced Soil Carbon Stability through Alterations in Components of Particulate and Mineral-Associated Organic Matter in Reclaimed Saline–Alkali Drainage Ditches

1
College of Soil and Water Conservation Science and Engineering, Northwest A&F University, Xianyang 712100, China
2
CAS Engineering Laboratory for Yellow River Delta Modern Agriculture, Institute of Geographic Sciences and Natural Resources Research, Chinese Academy of Sciences, Beijing 100101, China
3
College of Forestry, Northwest A&F University, Xianyang 712100, China
4
Shandong Dongying Institute of Geographic Sciences, Dongying 257000, China
*
Authors to whom correspondence should be addressed.
These authors contributed equally to this work.
Agronomy 2024, 14(4), 869; https://doi.org/10.3390/agronomy14040869
Submission received: 23 March 2024 / Revised: 11 April 2024 / Accepted: 15 April 2024 / Published: 22 April 2024
(This article belongs to the Section Farming Sustainability)

Abstract

:
Soil carbon content and stability are primarily influenced by the stabilization of particulate organic matter (POM) and mineral-associated organic matter (MAOM). Despite extensive research on the stabilization processes of POM and MAOM carbon components under various land-use types, the investigation into stabilization processes of soil carbon remains limited in saline–alkali soils. Therefore, we collected soil samples from different positions of saline–alkali drainage ditches at four reclamation times (the first, seventh, fifteenth, and thirtieth year) to determine their carbon content and physicochemical properties. Moreover, POM and MAOM fractions were separated from soil samples, and Fourier transform infrared spectra (FTIR) were used to investigate changes in their chemical composition. The results showed that with increasing reclamation time, the soil total carbon and soil organic carbon (SOC) contents significantly increased from 14 to 15 and 2.9 to 5.5 g kg−1, respectively. In contrast, soil inorganic carbon content significantly decreased from 11 to 9.6 g kg−1. Notably, the changes in soil carbon components following the increasing reclamation time were primarily observed in the furrow sole at a depth of 20–40 cm. While the SOC content of the POM fraction (SOCPOM) decreased significantly, the SOC content of the MAOM fraction (SOCMAOM) increased significantly. These alterations were largely dominated by drainage processes after reclamation instead of a possible conversion from SOCPOM to SOCMAOM. FTIR results revealed that MAOM was greatly influenced by the reclamation time more than POM was, but the change in both POM and MAOM contributed to an increase in soil carbon stability. Our findings will deepen the comprehension of soil carbon stabilization processes in saline–alkali drainage ditches after reclamation and offer a research framework to investigate the stability processes of soil carbon components via alterations in POM and MAOM fractions.

1. Introduction

Soil organic carbon (SOC) is a crucial component of the terrestrial soil carbon pool, accounting for approximately two-thirds of the carbon stocks in terrestrial ecosystems, surpassing the combined carbon stock in the global atmosphere and vegetation [1,2,3]. Maintaining and increasing SOC content is crucial for enhancing ecosystem productivity, mitigating climate change, and other related aspects [4,5]. However, the dynamics and stability of SOC are changed due to continuous alterations in climate, vegetation conditions, and land-use changes [6,7,8]. Land-use changes, particularly the conversion of fallow land to farmland, are likely to lead to SOC losses [9,10]. Despite previous extensive studies suggesting that SOC sequestration is a key measure to address global climate change [11,12,13], the current understanding of SOC stability processes under land-use changes remains limited.
Considering the regulatory role of soil organic matter (SOM) in the formation, sequestration, and stabilization of SOC, solely understanding the stability processes of SOC from a SOC perspective may have limitations [14,15,16,17]. SOM can be categorized into two main components, particulate organic matter (POM) and mineral-associated organic matter (MAOM), which exhibit distinct turnover rates and stabilization processes [16,17,18,19]. Despite the MAOM fraction being acknowledged as an important pool for long-term C stabilization in the soil [20,21,22], recent research has emphasized the stability processes with various carbon components. Islam et al. [23] proposed a stability framework for SOM, suggesting that root exudates, litter, and microbial products collectively contribute to the formation of POM and MAOM through different pathways. On the other hand, Liao et al. [17] argued that the formation and stabilization of soil carbon follow the sequence of “litter→POM→MAOM”. The stability of SOM depends not only on the properties of POM and MAOM but also on the interactions of physical and chemical processes in the soil conditions [24]. The inconsistency in these stabilization processes is largely attributed to variations in environmental factors and is impacted by changes in the SOC stability through POM and MAOM components. Consequently, it is crucial to examine how POM and MAOM components respond to environmental factors in the stabilization processes.
In the context of global change, the impact of land-use change on POM and MAOM components has been confirmed [16]. Early research indicates that in undisturbed soils, the agricultural planting process following land reclamation can lead to significant differences between POM and MAOM, making POM more susceptible to loss than MAOM [25,26,27]. However, when considering land-use changes in saline–alkali soils, specifically the saline–alkali drainage ditches formed after saline–alkali land reclamation, alterations in soil carbon components are primarily influenced by vegetation status and drainage processes. On the one hand, excessive soil salinity in saline–alkali areas restrains plant growth, reducing the carbon input from plants into the soil [28,29]; on the other hand, drainage activities often lead to frequent wet–dry cycles in drainage ditch soils, facilitating the breakdown of soil aggregates, impacting microbial activity, and exposing and decomposing, physically protected SOM [30,31]. The collective changes in these environmental factors are likely to influence the alterations and stability of soil carbon components. While current studies concentrate on investigating the stability processes and mechanisms of POM and MAOM components in various contexts [3,18,32,33], the research primarily focuses on conventional land uses like farmland, forests, and shrubs, with minimal attention given to the carbon stabilization processes in saline–alkali soils.
A comprehensive understanding of the stable process of soil carbon components is needed for examining the changes in their chemical composition. Infrared spectroscopy is commonly utilized for the qualitative analysis of functional groups in SOM and the quantitative analysis of SOC [34,35]. In the physical fractionation of SOM, Fourier transform infrared (FTIR) spectroscopy serves as a supplementary method to gain insights into the chemical composition of soil carbon components [36]. Furthermore, it facilitates the qualitative analysis of the functional group composition of SOM without changing the soil chemical composition [37]. The continuous advancements in infrared spectroscopy technology have seen the rise of diffuse reflectance (DRIFT) and attenuated total reflection (ATR) FITR spectroscopy as alternative options to FTIR spectroscopy [38]. While DRIFT and ATR FITR spectroscopy allow spectral analysis without the need for traditional KBr pellet preparation, they exhibit minimal changes in the spectrum compared to transmission FTIR spectra under the same analysis conditions [39,40]. At present, FTIR spectroscopy is a more established method for determining the relative composition of specific functional groups in SOM, maintaining comparability with DRIFT and ATR FITR spectroscopy [38,41]. Furthermore, to enhance the precision of FTIR spectroscopy, the utilization of a significant amount of spectroscopy data is imperative to minimize systematic errors during spectral scanning.
Therefore, the objective of this study is to reveal the stabilization processes of soil carbon components in reclaimed saline–alkali ditches and their responses to environmental factors. To address this, the agricultural farmland in the Yellow River Delta region was chosen as the study area. We measured soil carbon contents and physicochemical properties of the saline–alkali drainage ditches at four reclamation times (the first, seventh, fifteenth, and thirtieth years). In addition, to gain further insight into the stable process of soil carbon components, the POM and MAOM fractions were isolated and analyzed for changes in their chemical composition using FTIR spectroscopy. The findings of this study will contribute to the development of a theoretical foundation for effectively enhancing the carbon content and stability of saline–alkali soils.

2. Materials and Methods

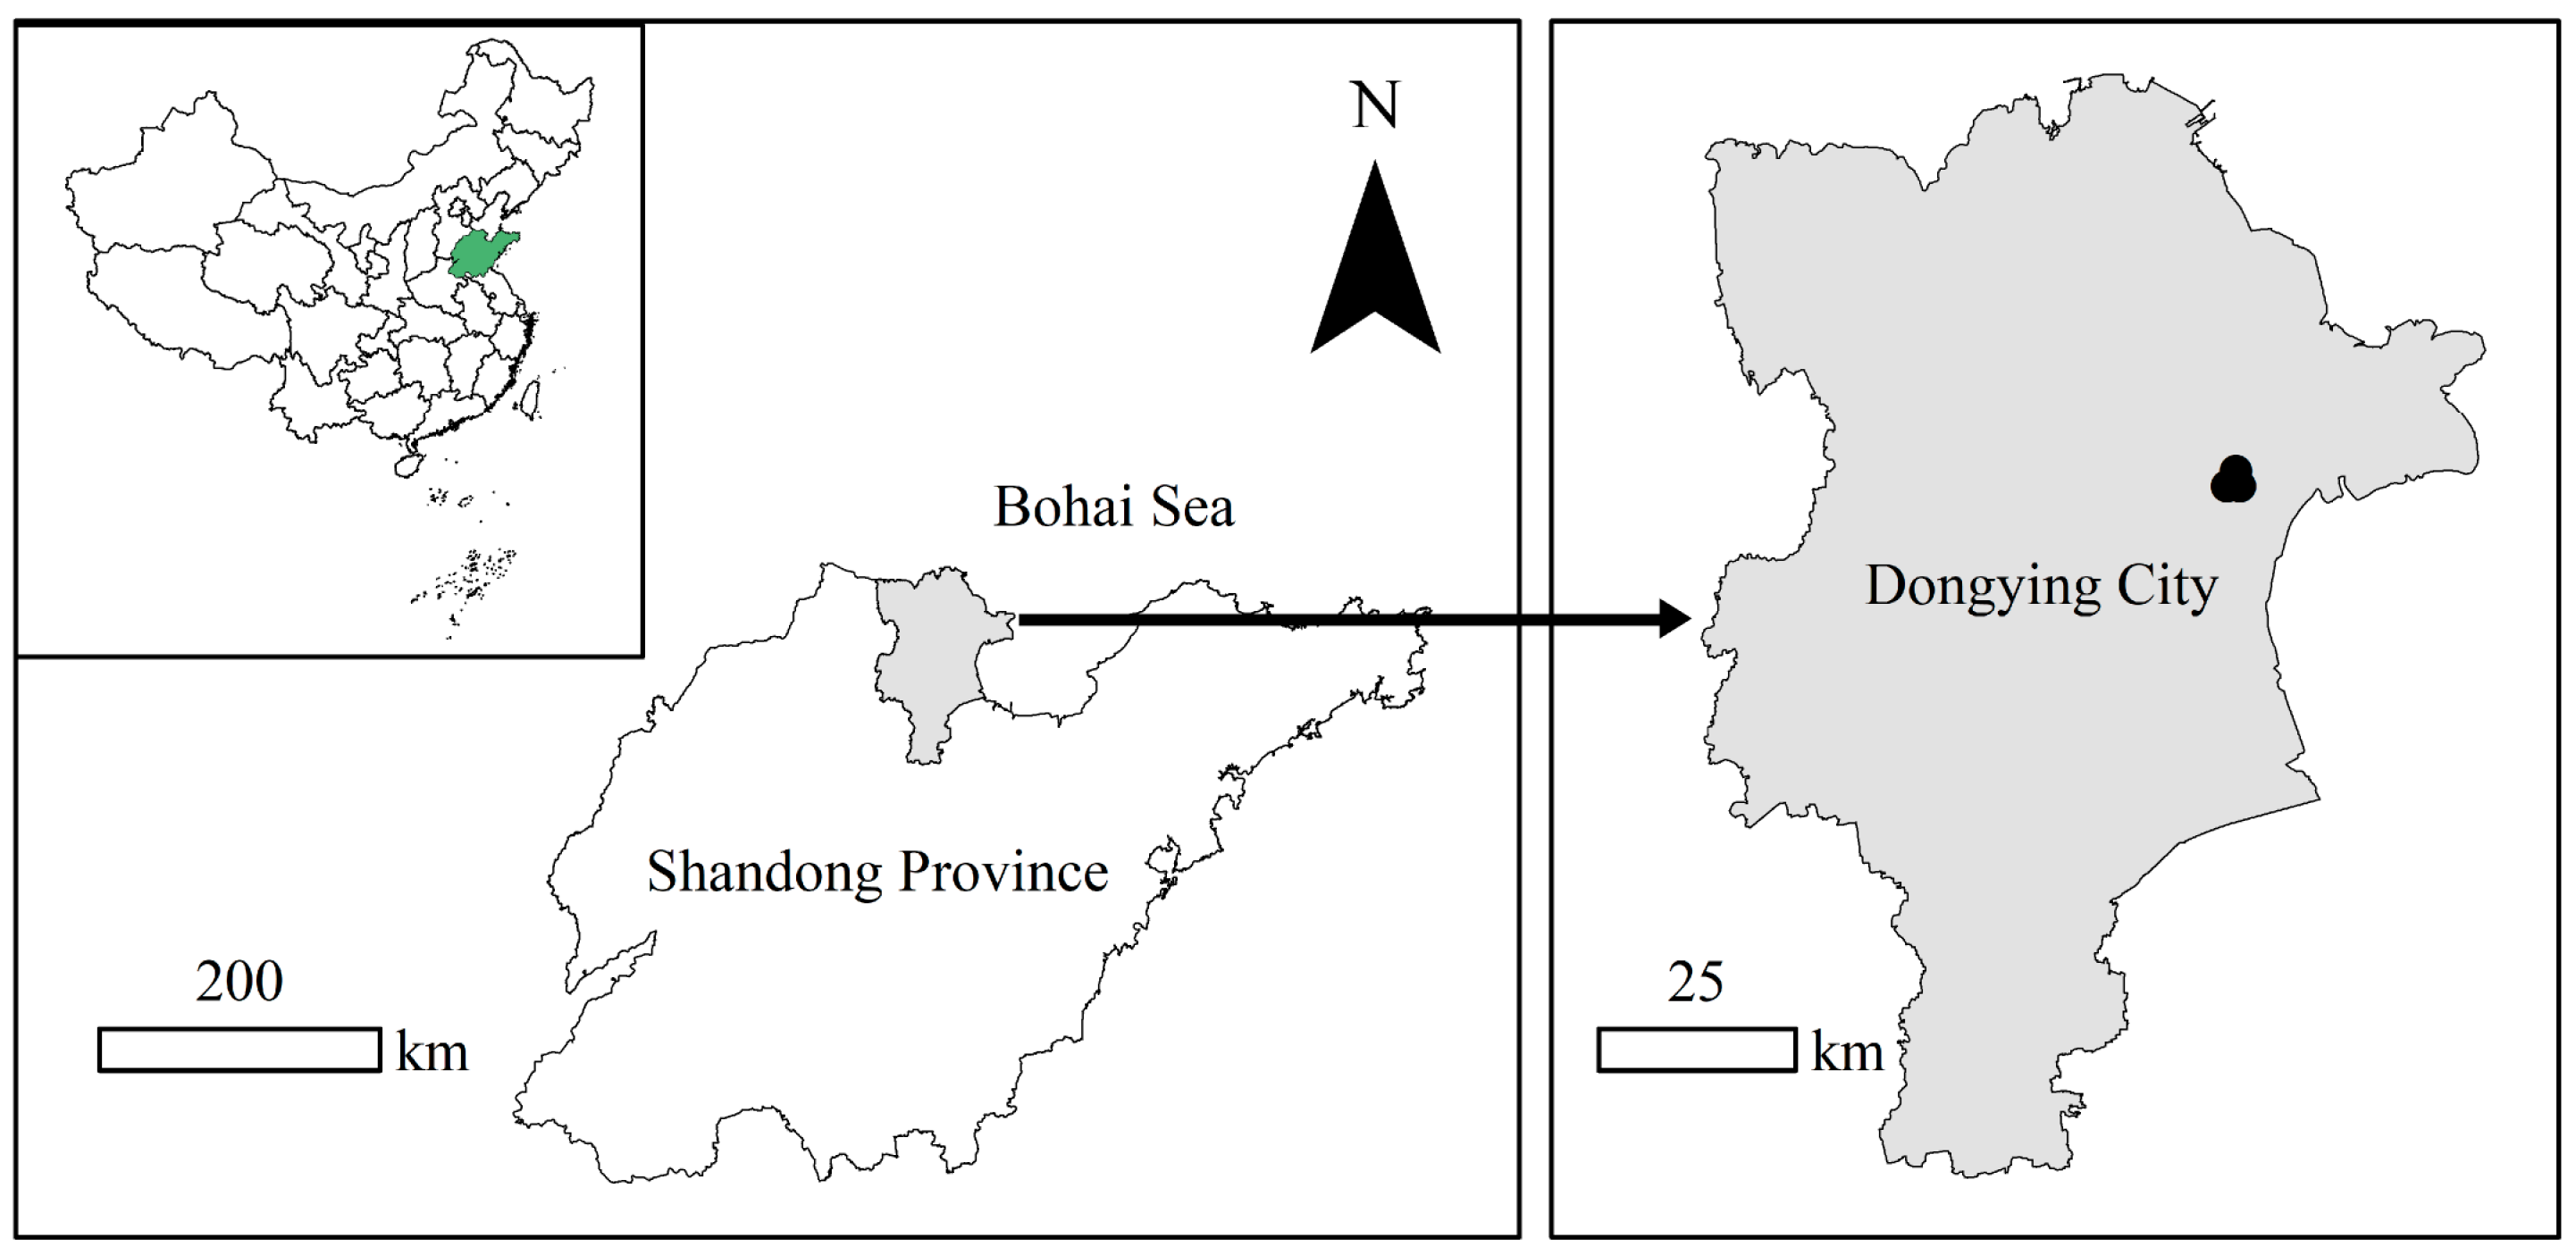
2.1. Site Description

The study area is situated in Dongying City, Shandong Province, China, near the research center base of the Yellow River Delta, Chinese Academy of Sciences (37°40′ N, 118°55′ E). With an average annual temperature of 12.60 °C and an average annual rainfall of around 465 mm, it has a moderate continental monsoon climate. There is an annual variation in evaporation of 1900–2400 mm. The soil in this study area comes from the alluvial deposits of the Yellow River. The soil type is classed as sandy loam by the United States Department of Agriculture, with sand particles (0.05–2.00 mm) accounting for 23.22%, silt particles (0.002–0.05 mm) accounting for 70.88%, and clay particles (<0.002 mm) accounting for 5.90%. Numerous drainage ditches have been formed as a result of the reclamation of saline–alkali farmland in recent decades. Phragmites australis (Cav.) Trin. ex Steud., Suaeda salsa (L.) Pall., Imperata cylindrica (L.) P. Beauv., Leymus chinensis (Trin.) Tzvel., Artemisia capillaris Thunb., and Tamarix chinensis Lour are the main plant species found in these drainage ditches.

2.2. Soil Sampling Processing

Four reclamation years (the first, seventh, fifteenth, and thirtieth years) within a 3 km radius of one another in the study area were used to choose sample locations in order to examine differences in the soil carbon components of saline–alkali drainage ditches (Figure 1). Four nearby drainage ditches with comparable cross-sectional dimensions, channel lengths, and plant covers were selected as sampling plots at each sampling location. Three randomly selected 1 m × 1 m subplots were chosen at various positions within each sampling plot, including the furrow sole, middle slope, lower slope, upper slope, and slope crest. For every subplot, plant biomass was measured by harvesting the above-ground biomass after plant height and vegetation covering were noted. The types and growth status of native vegetation in drainage ditches with different reclamation years are provided in Table 1. Within each subplot, soil samples were taken with a soil auger at three different depths: 0–20 cm, 20–40 cm, and 40–60 cm. Soil samples were taken from this location at depths of 0–20 cm and 20–40 cm due to the complicated soil and water conditions at the furrow sole. Soil samples from the same position and depth inside the three slope sections were mixed to generate a composite sample that represented each drainage ditch after plant litter and roots were removed using a 2 mm sieve. There were 224 composite samples gathered in all.

2.3. Fraction Separation, Soil Carbon Content, and Physicochemical Properties Analyses

According to Cotrufo et al. [19], POM and MAOM fractions were separated by the physical fractionation method. In this method, 10 g of air-dried soil was dispersed in a 30 mL solution containing 5 g L−1 of (NaPO3)6. The soil suspension was then shaken on a reciprocating shaker for 15 h to distribute soil particles. Subsequently, the distributed soil mixture was filtered using a 53 µm sieve and repeatedly washed several times with deionized water. The material retained on the sieve was identified as the POM fraction (53–2000 µm), while the material that passed through the sieve was identified as the MAOM fraction (<53 µm).
The soil total carbon (TC) and soil inorganic carbon (SIC) contents were measured using an automated carbon nitrogen analyzer (Primacs SNC100–IC–E, Skalar Analytical BV, Breda, The Netherlands). The TC content was determined through high-temperature combustion and nondispersive infrared detection (NDIR), while the SIC content was determined through automatic acidification, heating, gas stripping, and NDIR detection. The SOC content was calculated by subtracting the SIC from the TC content. Moreover, the analysis also included the determination of organic carbon (SOCPOM and SOCMAOM) and inorganic carbon (SICPOM and SICMAOM) contents in the POM and MAOM fractions using the same analytical methodology. Using a continuous flow analyzer (Auto Analyzer 3, Bran and Luebbe GmbH, Norderstedt, Germany), the accessible phosphorus (AP) level of the soil was determined. Deionized water was used to create a 1:5 soil–water mixture. A pH meter (PHS–3E, Leici Instruments, Shanghai, China) and a conductivity meter (FE38–Standard, Mettler Toledo, Greifensee, Switzerland) were used to measure the soil’s pH and electrical conductivity (EC), respectively. Soil total nitrogen (TN) content was determined using the Kjeldahl method, while the soil total phosphorus (TP) content was determined using the H2SO4-HClO4 digestion method. Continuous flow analyzers were used to measure both TN and TP. Using a modified technique created by Zhan and Zhou, the dissolved organic carbon (DOC) content of the soil was ascertained [42]. The KCI–indophenol blue colorimetric method and the dual-wavelength UV spectrophotometric approach were used to quantify the amounts of soil soluble ammonium nitrogen ( N H 4 + -N) and soil soluble nitrate nitrogen ( N O 3 - -N). A UV–visible spectrophotometer was used for all three measurements.

2.4. Chemical Composition Analysis of Carbon Components

A FTIR spectrometer (Nicolet iS10, ThermoFisher, Madison, WI, USA) was employed to analyze the infrared spectra of soil samples from the POM and MAOM fractions. Before conducting infrared spectrum scanning, soil samples from distinct sections with the same reclamation time were individually mixed (56 samples each) to minimize errors during the scanning process. The samples were then combined with KBr in a 1:100 ratio, ground, and compressed into pellet molds using an agate mortar. Subsequently, the Fourier transform infrared spectrometer was used to measure the infrared transmittance spectra of the pellets with a spectroscopically pure KBr pellet serving as the background reference. The spectral range was set between 4000 and 400 cm−1, with a resolution of 4 cm−1 and a scanning frequency of 32 times. The analysis of the infrared spectra was performed using OMNIC software (v.8.2).
In this study, we chose Liu et al.’s [43] research method based on previous research and review [44,45] due to the similarity of soil deposition and vegetation restoration conditions in our study area. To examine alterations in the chemical composition of soil carbon fractions during the reclamation process, we distinguished four specific functional groups in the infrared spectra of POM and MAOM soil fractions. These functional groups include alcohol C–OH/C–NH bonds (peak height at 3424 cm−1, range 3300–3700 cm−1), aliphatic C–H bonds (peak height at 2925 and 2850 cm−1, range 2800–2950 cm−1), aromatic C=C/C=N bonds (peak height at 1638 cm−1, range 1350–1700 cm−1), and polysaccharide C–O bonds (peak height at 1030 cm−1, range 1000–1100 cm−1). Peak areas were calculated after normalizing all FTIR spectra to represent the relative proportions of different functional groups. The extended multiplicative signal correction method, as detailed by Margenot et al. [46], was applied to adjust the baseline of the spectra and eliminate biases and noise.
Additionally, this study employed the methodology outlined by Pärnpuu et al. [47] to assess the decomposition extent of various carbon components and their reactions to the water environment in saline–alkali drainage ditches. The evaluation included parameters such as soil hydrophobicity (W), hydrophobicity index (HI), and decomposition degree index (DDI). W was computed by calculating the ratio of the sum of peak heights at 2921 and 2852 cm−1 to the peak height at 1633 cm−1 in the infrared spectra [48,49]. HI was determined by evaluating the ratio of the sum of peak heights at 2921 and 2852 cm−1 to the SOC content in the infrared spectra [50]. DDI was calculated by dividing the peak height at 1633 cm−1 by the sum of peak heights at 2921 and 2852 cm−1 in the infrared spectra [51,52,53].

2.5. Data Analysis

After checking the normality (Shapiro–Wilk’s test) and homogeneity of variances (Levene’s test) for all measured indicators, one-way ANOVA with least significant difference (LSD) was used to examine the differences in soil properties (TC, SOC, SIC, DOC, TN, N H 4 + -N, N O 3 - -N, TP, AP, pH, EC, SWC) of different reclamation years, soil carbon component contents (SOCPOM, SOCMAOM, SICPOM, SICMAOM), relative proportions of different functional groups (alcohol C–OH/C–NH, aliphatic C–H, aromatic C=C/C=N, polysaccharide C–O), and W, HI, and DDI among different reclamation years, soil depths, and sampling positions. A significance level of p < 0.05 was considered statistically significant for all values, and all statistical analyses were conducted using SPSS (v22.0.0.0) software.
In this study, a multiple regression model was employed to assess the effects and relative importance of vegetation status (dry weight and coverage), soil nitrogen (TN, N H 4 + -N, and N O 3 -N), soil phosphorus (TP and AP), and soil and water conditions (SWC, EC, and pH) on different soil carbon components. To standardize all environmental factors and response variables, a model was constructed using the MuMIn package in the R language (version 4.3.2), incorporating all possible combinations of initial influencing factors. The models were subsequently ranked based on the Akaike information criterion (AIC) derived from maximum likelihood fitting, and the fit best model with ΔAIC < 2 was selected. Finally, model averaging was employed to estimate the parameters and relevant p-values. The relative effects of each influencing factor were calculated and compared with the effects of all parameter estimates. The analyses were implemented using the MuMIn, rdacca.hp, ggplot2, and cowplot packages in R language.

3. Results

3.1. Changes in Vegetation Condition and Soil Physicochemical Properties after Reclamation

Changes in vegetation status after reclamation are presented in Table 1. Plant height, dry weight, and vegetation coverage had significant variations during the different reclamation years. As reclamation time increased, plant height, dry weight, and coverage significantly increased from 73 to 150 cm, 0.46 to 0.76 kg, and 54% to 97%, respectively (p < 0.05). Additionally, the species of main vegetation in the saline–alkali ditches increased gradually.
Changes in soil properties following reclamation are presented in Table 2. As reclamation time increased, TN and TP contents significantly increased from 140 to 340 mg kg−1 and 0.48 to 0.53 g kg−1, respectively (p < 0.05). N O 3 -N content increased from 19 mg kg−1 to 20 mg kg−1 in the 1st year compared to the 15th year of reclamation, subsequently decreasing to 8.4 mg kg−1 in the 30th year (p < 0.05). AP content decreased significantly from 26 to 12 mg kg−1 (p < 0.05), while N H 4 + -N content exhibited no significant variations across different reclamation years (p > 0.05). SWC and pH significantly increased from 26% to 30% and 8.5 to 9.1, respectively, whereas EC decreased significantly from 3600 to 290 μs cm−1 (p < 0.05).
Table 1. The types and growth status of native vegetation in drainage ditches with different reclamation years.
Reclamation YearsPlant Height (cm)Dry Weight (kg)Coverage (%)Main Vegetation
1st year73 ± 5 c0.46 ± 0.07 c54 ± 6 cS. salsa, P. australis
7th year140 ± 3 b0.69 ± 0.04 b84 ± 2 bS. salsa, P. australis, I. cylindrica, L. chinensis
15th year79 ± 3 c0.41 ± 0.04 c77 ± 4 bS. salsa, P. australis, I. cylindrica, L. chinensis, A. capillaris
30th year150 ± 5 a0.76 ± 0.06 a97 ± 0.8 aS. salsa, P. australis, I. cylindrica, L. chinensis, A. capillaris, T. chinensis
Values are mean ± standard error. Different lowercase letters of the same variable indicate significant differences at the level of p < 0.05.
Table 2. Soil properties of the saline–alkali ditches with different reclamation years.
Reclamation Years
1st Year7th Year15th Year30th Year
TC (g kg−1)14 ± 0.3 b15 ± 0.4 bc14 ± 0.2 c15 ± 0.2 a
SOC (g kg−1)2.9 ± 0.1 b3.5 ± 0.2 b2.9 ± 0.1 b5.5 ± 0.3 a
SIC (g kg−1)11 ± 0.3 a12 ± 0.3 a11 ± 0.2 a9.6 ± 0.3 b
DOC (mg kg−1)48 ± 3 a47 ± 3 b36 ± 3 ab78 ± 10 a
TN (mg kg−1)140 ± 10 b340 ± 20 a110 ± 10 b340 ± 20 a
N H 4 + -N (mg kg−1)3.7 ± 0.3 a4.0 ± 0.4 a3.3 ± 0.4 a3.6 ± 0.2 a
N O 3 -N (mg kg−1)19 ± 0.1 b20 ± 0.1 a20 ± 0.09 a8.4 ± 0.3 bc
TP (g kg−1)0.48 ± 0.01 b0.55 ± 0.01 a0.50 ± 0.01 b0.53 ± 0.01 a
AP (mg kg−1)26 ± 1 a20 ± 1 b28 ± 2 ab12 ± 1 c
SWC (%)26 ± 0.5 c22 ± 1 d30 ± 0.6 b30 ± 0.7 a
EC (μs cm−1)3600 ± 400 a1200 ± 70 a1000 ± 100 a290 ± 20 b
pH8.5 ± 0.03 b8.6 ± 0.03 b9.0 ± 0.03 b9.1 ± 0.03 a
Values are mean ± standard error. Different lowercase letters of the same variable indicate significant differences at the level of p < 0.05. (TC, soil total carbon; SOC, soil organic carbon; SIC, soil inorganic carbon; DOC, soil dissolved organic carbon; TN, soil total nitrogen; N H 4 + -N, soil soluble ammonium nitrogen; N O 3 -N, soil soluble nitrate nitrogen; TP, soil total phosphorus; AP, soil available phosphorus; SWC, soil water content; pH, soil pH; and EC, soil electrical conductivity).

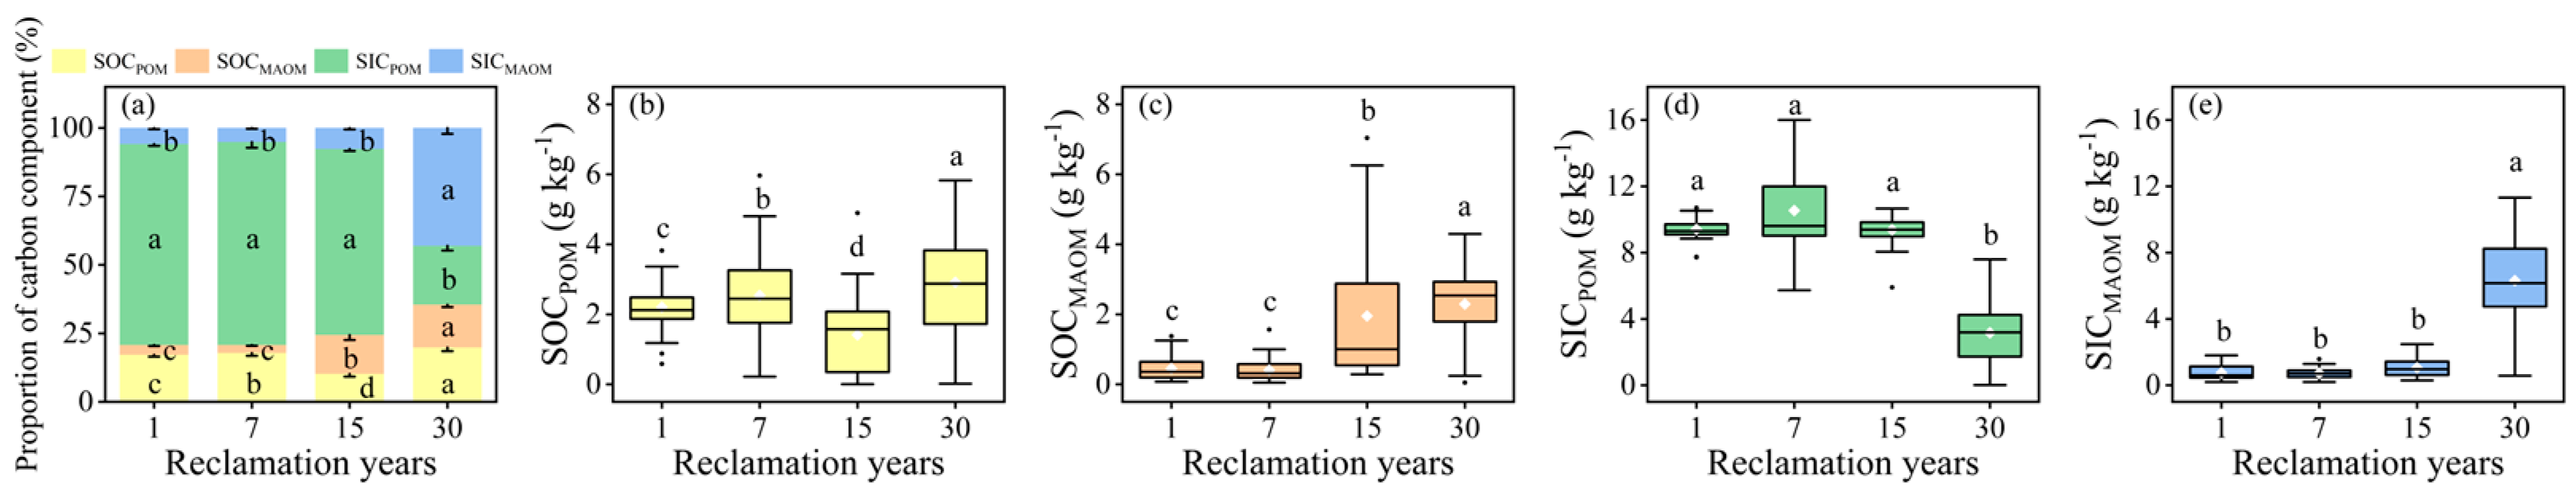
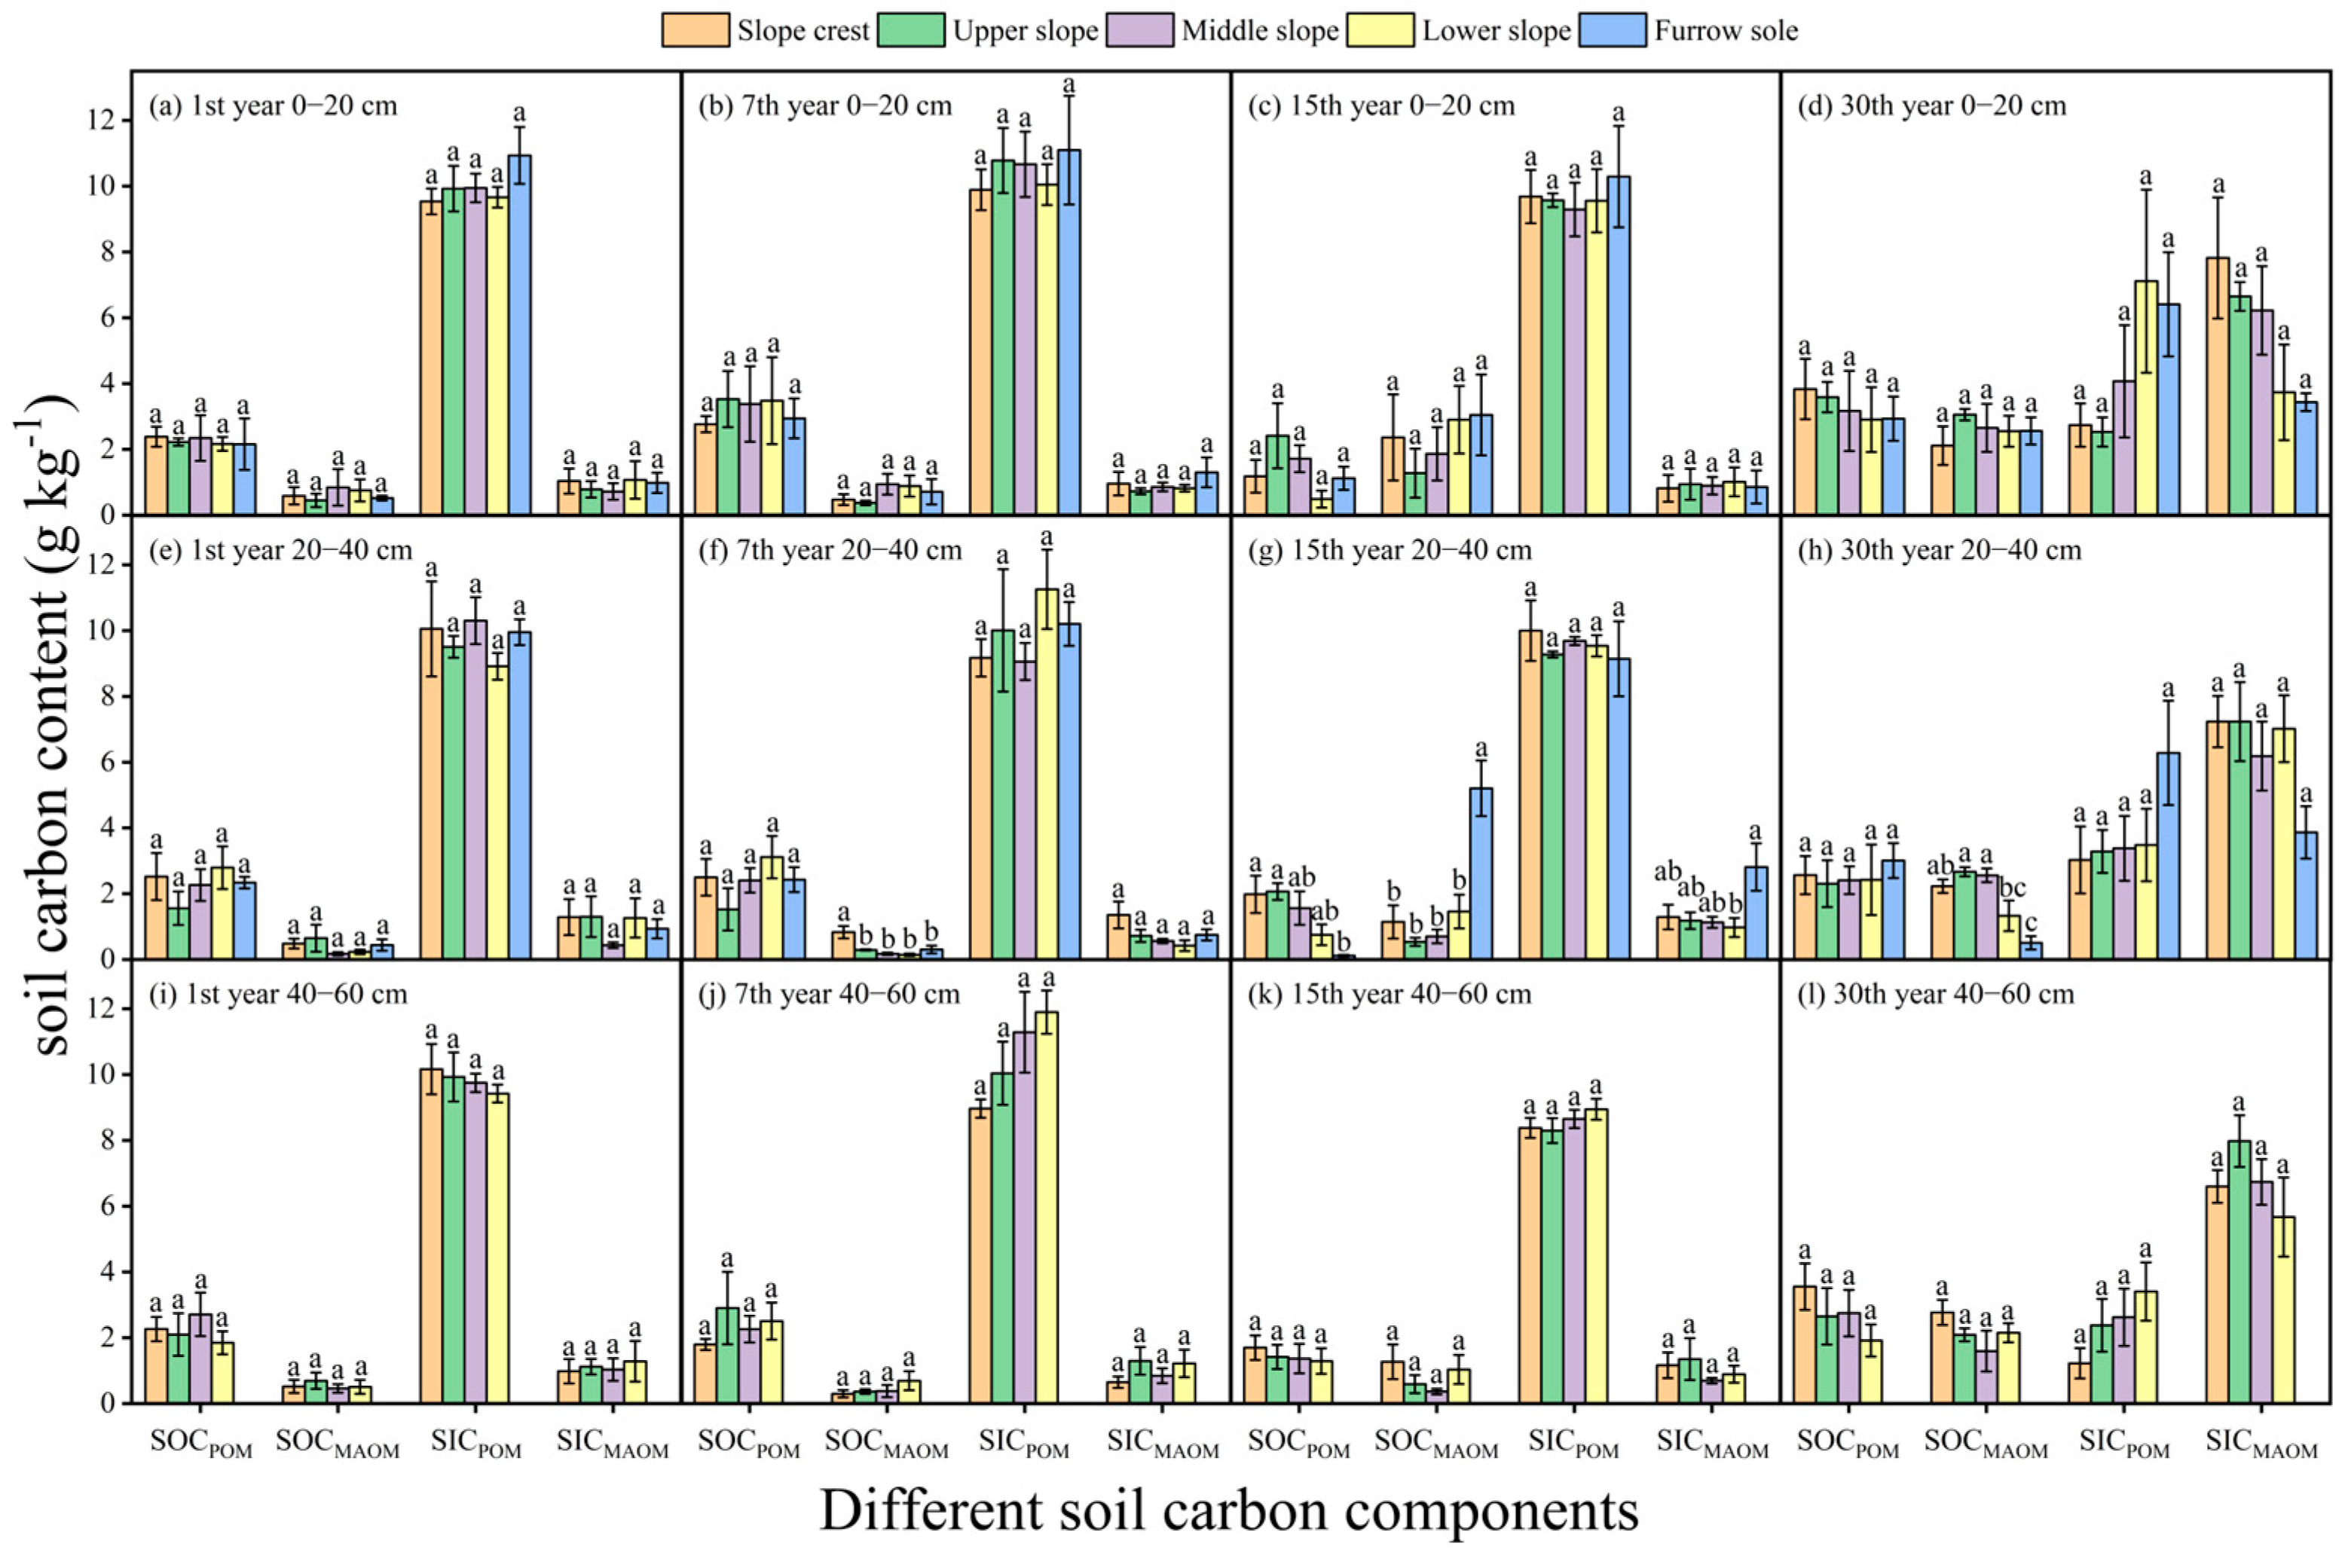
3.2. Changes in Soil Carbon Components after Reclamation

Overall, significant changes in soil carbon fractions following reclamation can be observed (Table 2, Figure 2). With increasing reclamation time, TC and SOC contents significantly increased from 14 to 15 g kg−1 and 2.9 to 5.5 g kg−1, respectively, while SIC content decreased significantly from 11 to 9.6 g kg−1 (p < 0.05). DOC content decreased significantly from 48 to 47 mg kg−1 in the 1st year compared to the 7th year of reclamation, then significantly increased to 78 mg kg−1 in the 30th year (p < 0.05). Furthermore, SOCPOM, SOCMAOM, and SICMAOM contents significantly increased from 2.2 to 3.6 g kg−1, 0.7 to 1.9 g kg−1, and 1.2 to 6.3 g kg−1, respectively, while SICPOM content decreased from 9.9 g kg−1 to 3.5 g kg−1 (p < 0.05). Specifically, the changes in soil carbon components after reclamation mainly occurred in the soil layer at a depth of 20–40 cm (Figure 3). From the 7th year to the 15th year, there was a significant decrease in SOCPOM content and a significant increase in SOCMAOM content in furrow sole. From the 7th year to the 30th year, there was a significant decrease in SOCMAOM content (p < 0.05).

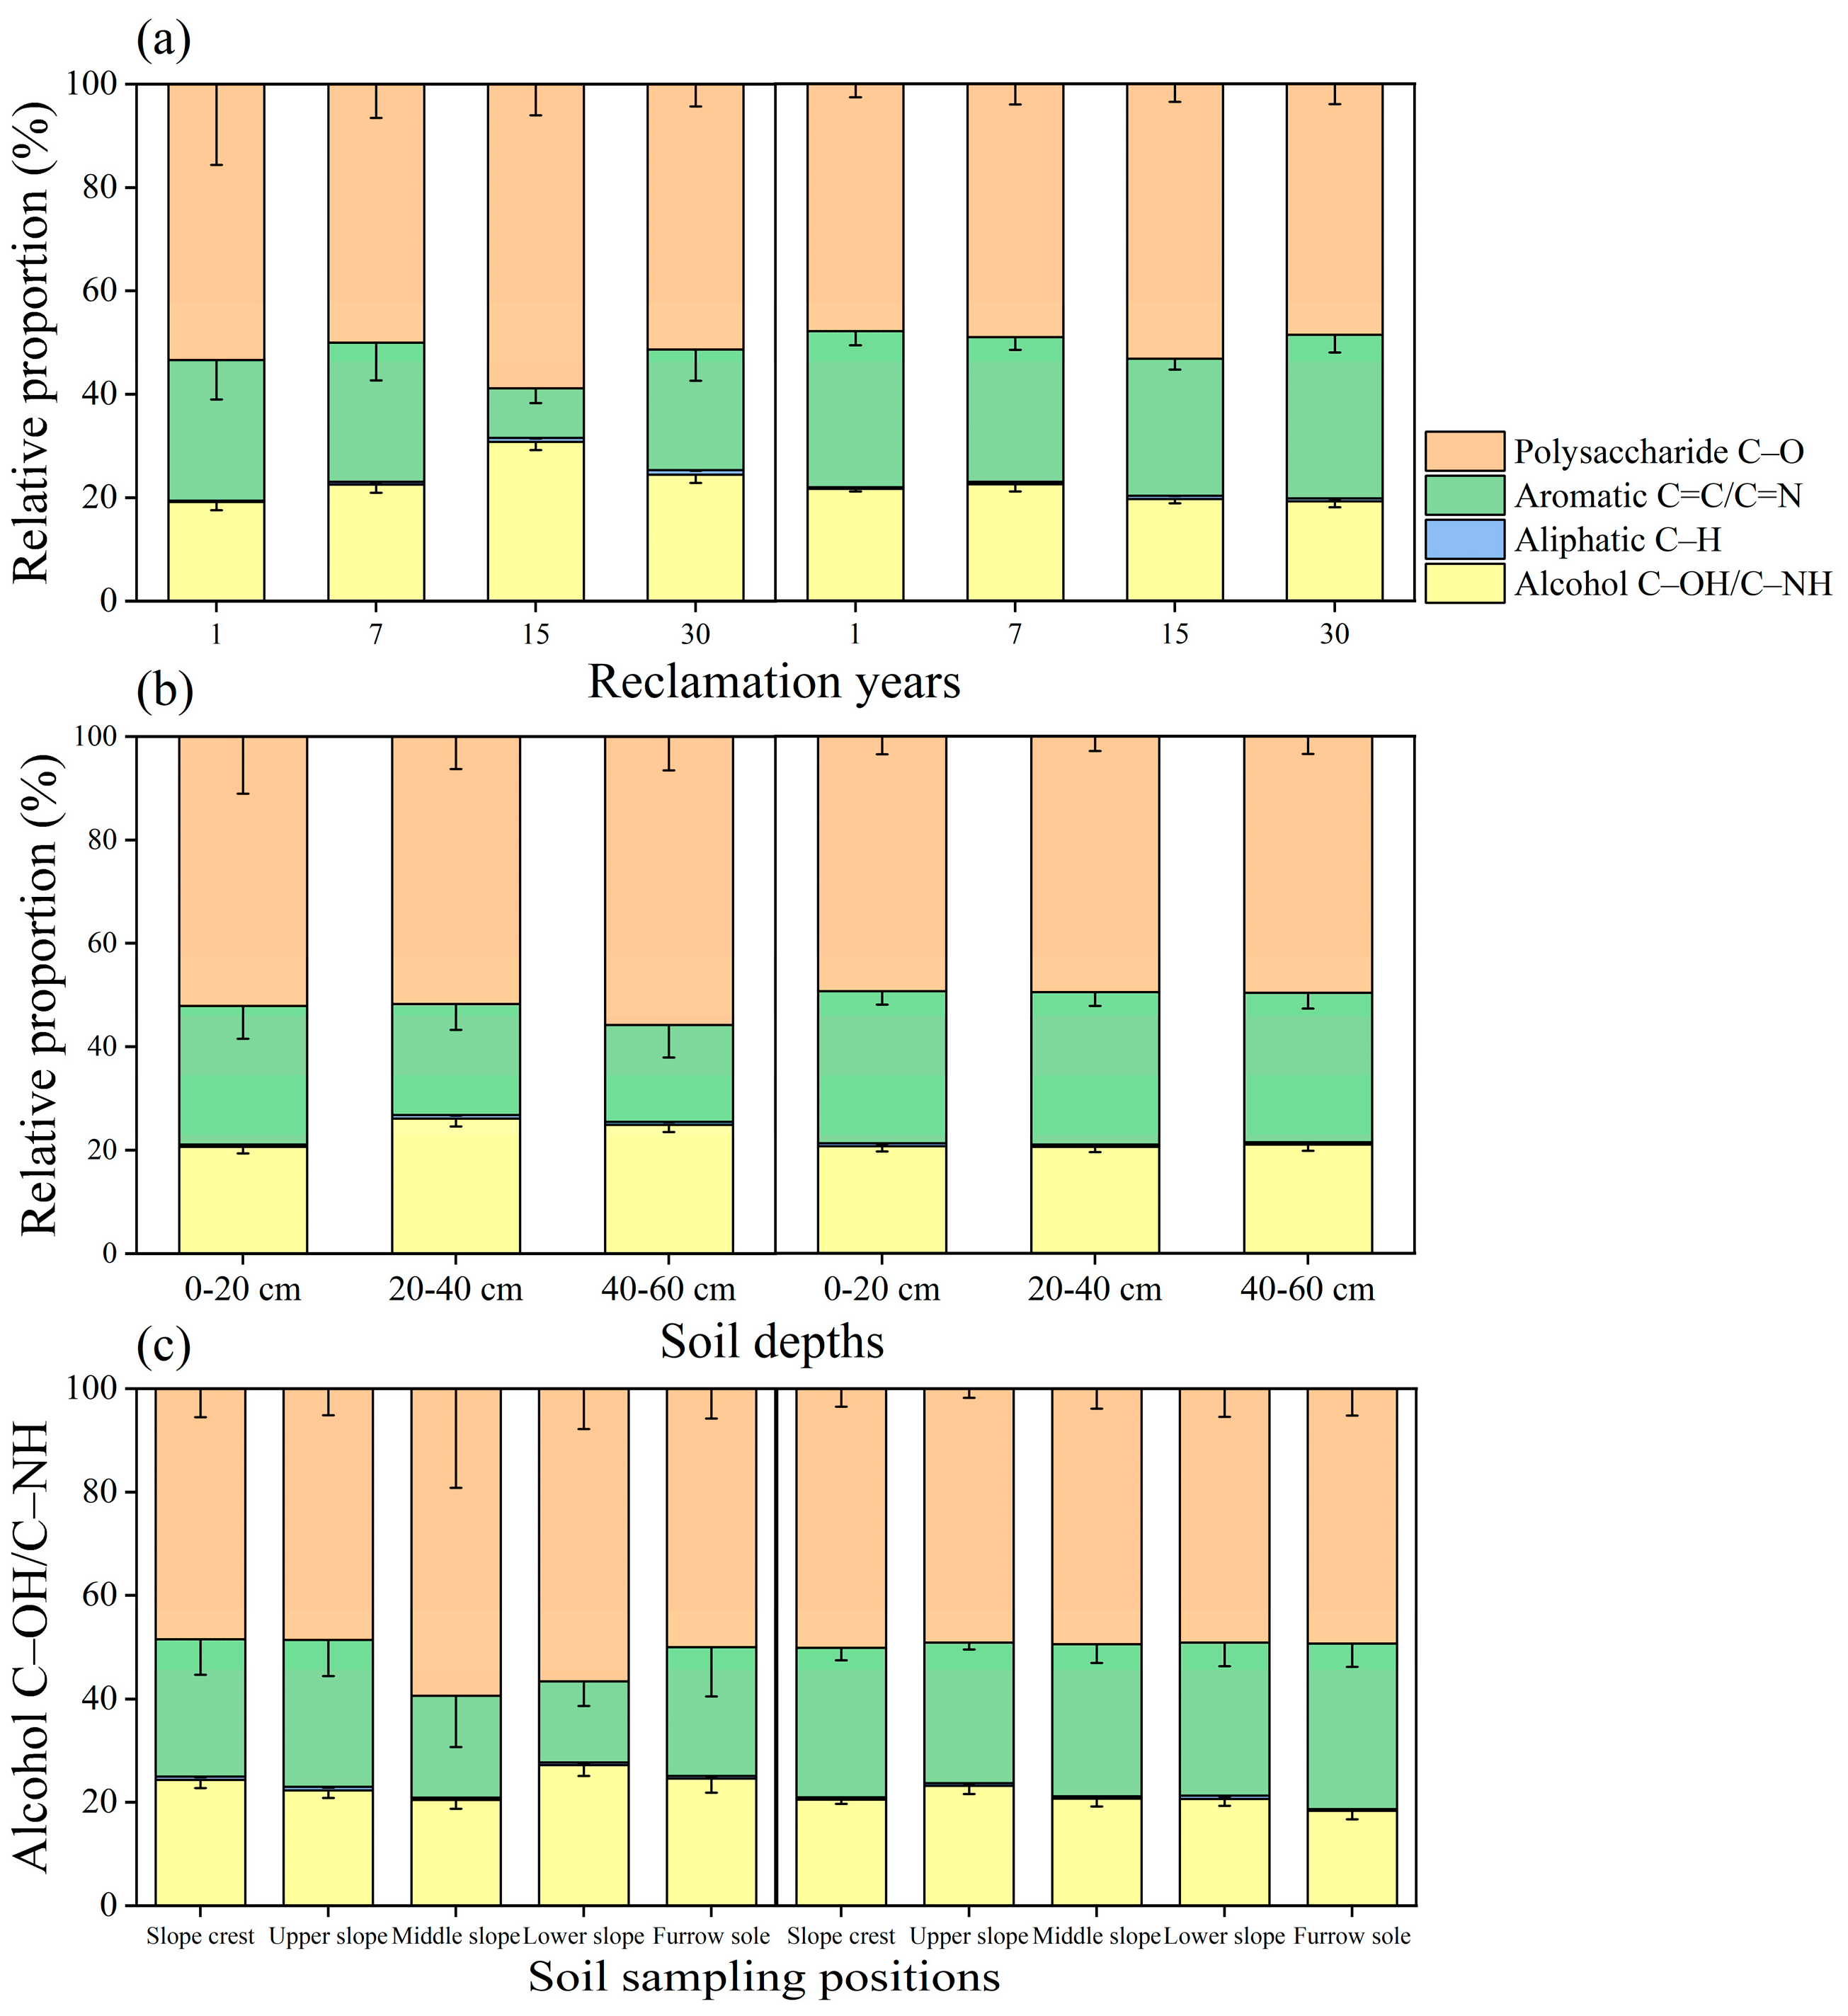
3.3. Chemical Composition in POM and MAOM Fractions

Four specific functional group peak areas of POM and MAOM in the soil showed significant variation among different reclamation years (p < 0.05), while they did not show significant differences among different soil depths and sampling locations (p > 0.05), as indicated by FTIR results (Table 3, Tables S1 and S2, Figure 4). The relative proportion of the polysaccharides C–O was the highest, while the relative proportion of aromatic C=C/C=N was the lowest. In the POM fraction, the relative proportion of alcohol C–OH/C–NH was greater than alkanes C–H, while in the MAOM fraction, the relative proportion of C–H was greater than C–OH/C–NH. With increasing reclamation time, there was no significant change observed in the C–O groups (p > 0.05). The C=C/C=N groups significantly decreased in the POM fraction but showed an increase in the MAOM fraction (p < 0.05). The C–OH/C–NH groups did not show a significant difference in the POM fraction (p > 0.05). However, C–OH/C–NH groups decreased from the 1st to the 15th year and significantly increased from the 15th to the 30th year of reclamation in the MAOM fraction (p < 0.05). Moreover, the C–H groups showed a significant increase (p < 0.05).
The changes in the W, HI, and DDI of POM and MAOM fractions varied significantly with increasing reclamation years (Table 4). Conversely, no significant differences were observed among different soil depths and sampling locations (Tables S3 and S4). In the POM fraction, W decreased significantly in the 15th year of reclamation and increased significantly in the 30th year (p < 0.05); HI decreased significantly in the 30th year of reclamation (p < 0.05), while DDI remained unchanged (p > 0.05). In the MAOM fraction, W decreased significantly in the 15th year of reclamation and increased significantly in the 30th year (p < 0.05); DDI increased significantly in the 15th year of reclamation and decreased significantly in the 30th year (p < 0.05), with no significant changes observed for HI (p > 0.05).

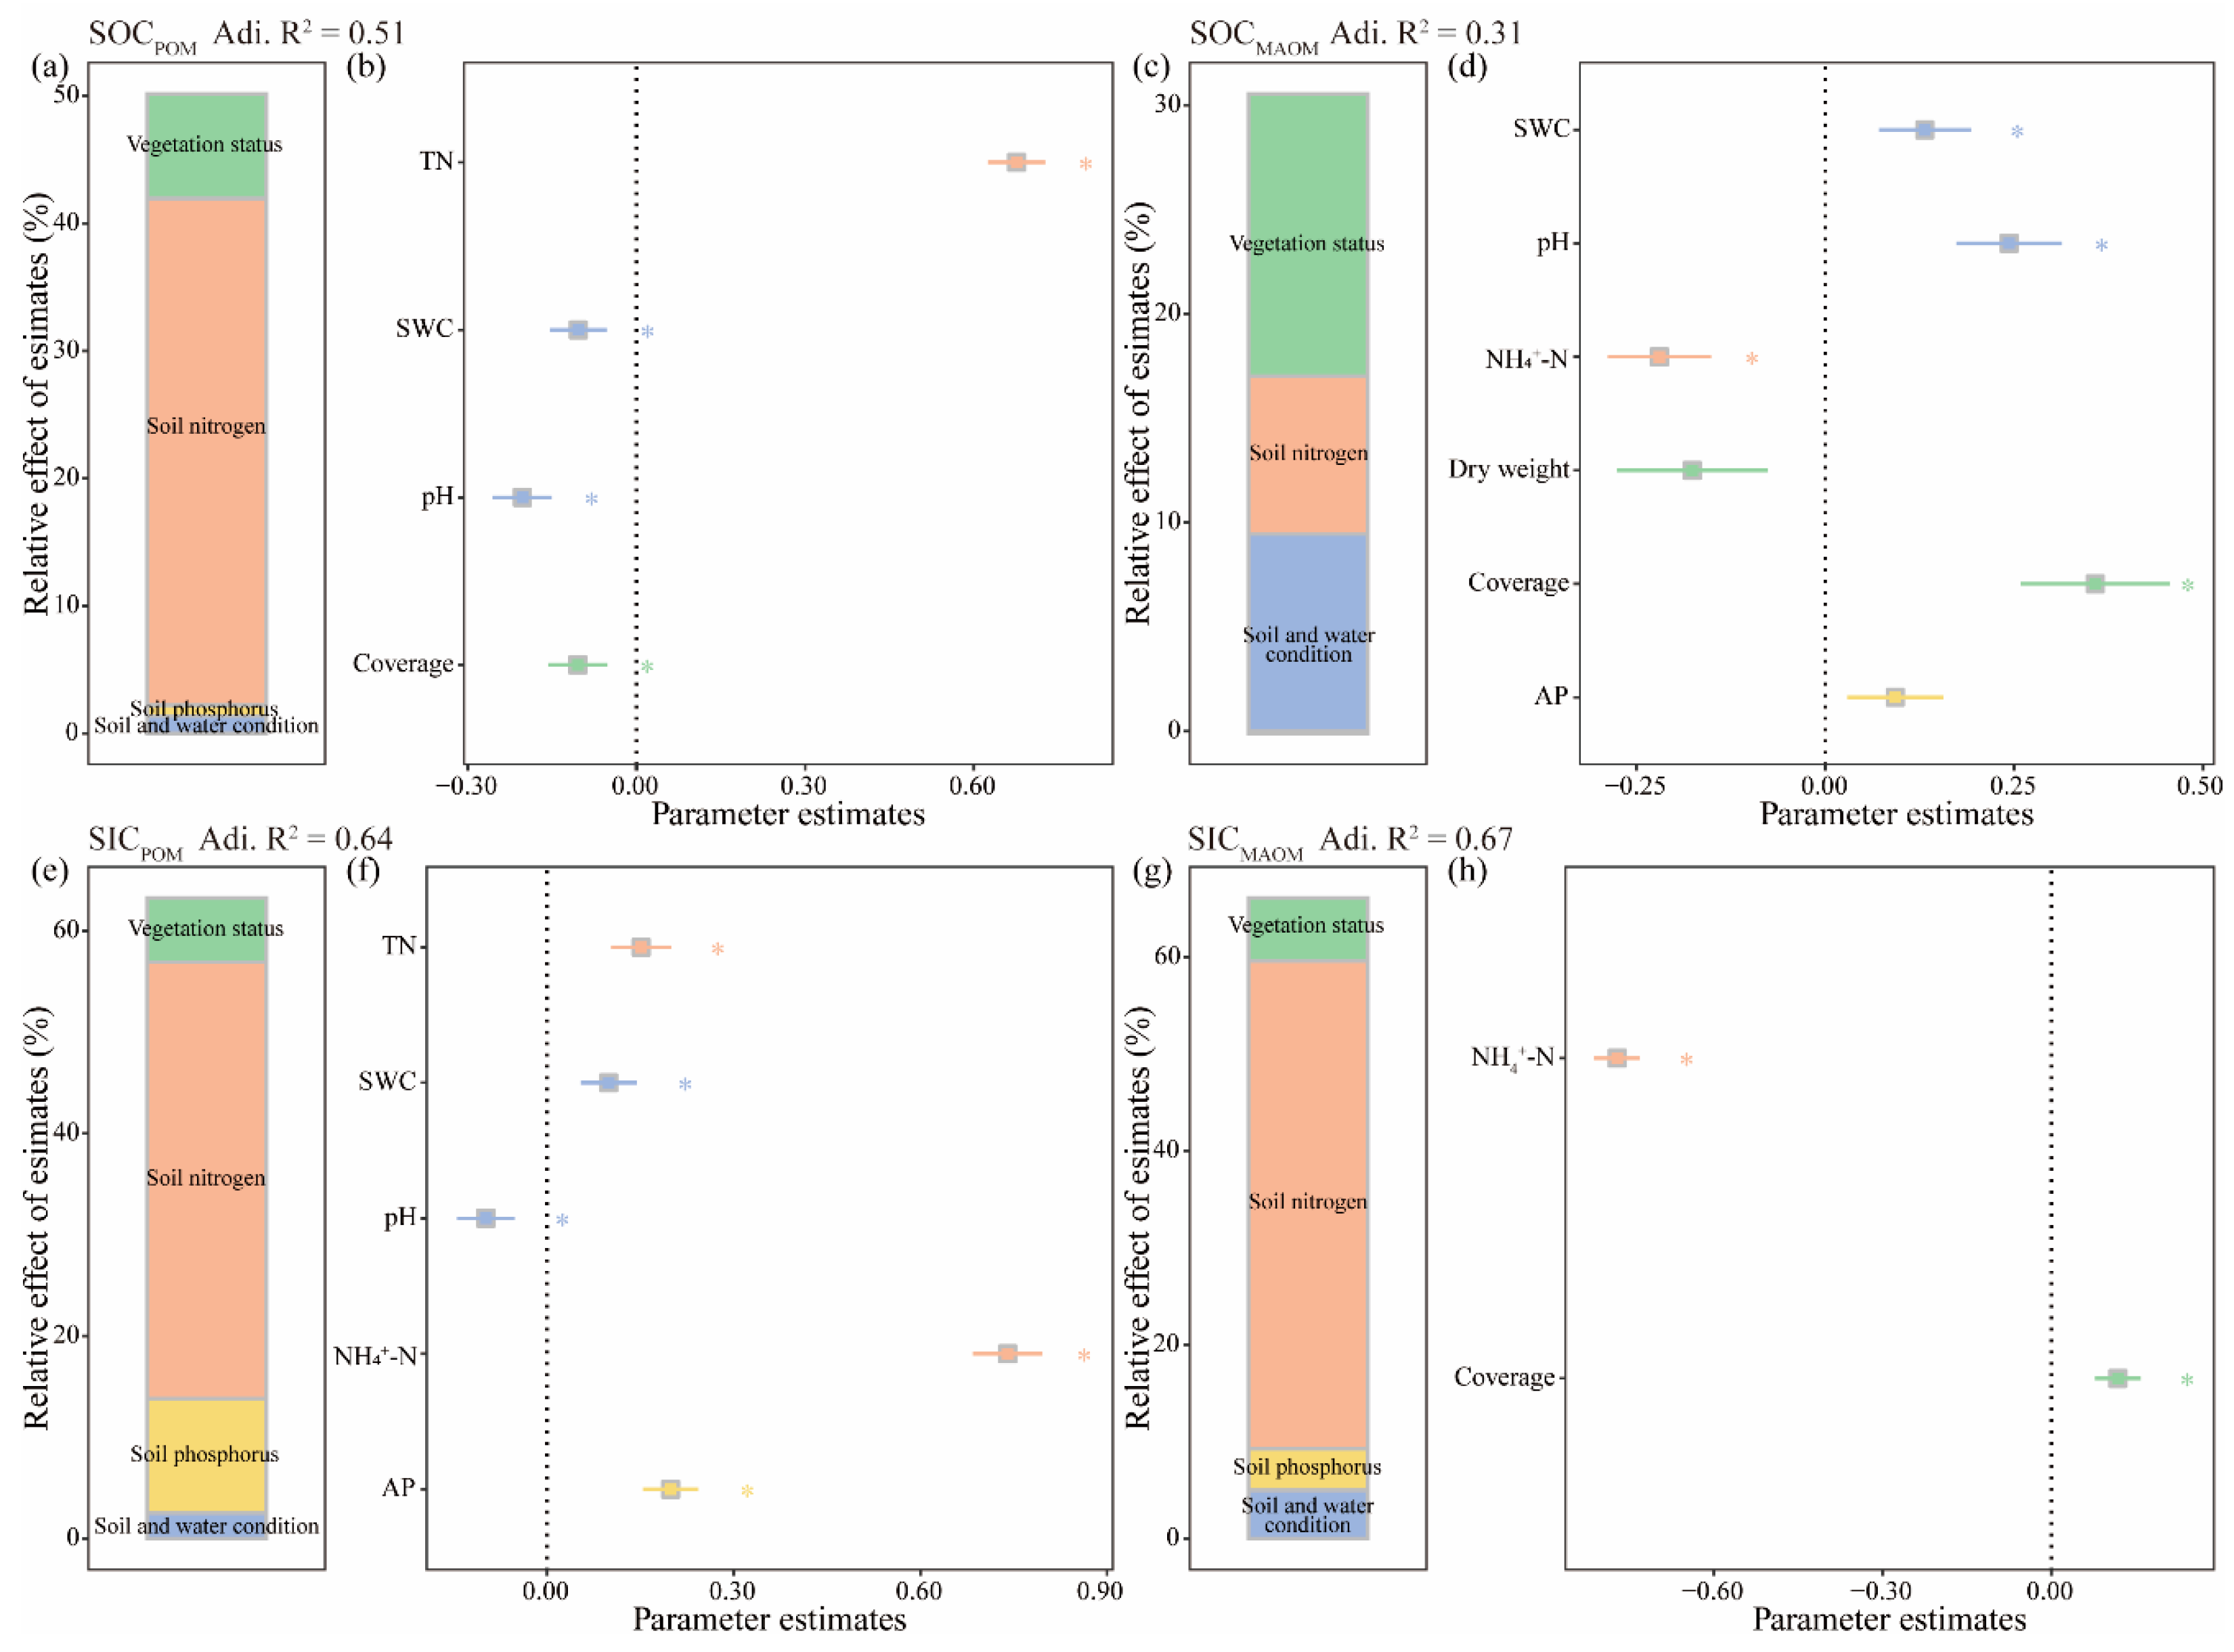
3.4. The Main Factors Influencing the Changes in Soil Carbon Components

The multiple regression models for different carbon components are presented in Figure 5. In the SOCPOM model, a significant positive correlation was observed between SOCPOM and TN, while significant negative correlations were found with SWC, pH, and coverage (p < 0.05). Vegetation status, soil nitrogen, soil phosphorus, and the soil and water conditions explained 8.2%, 40%, 0.86%, and 1.3% of the variance in SOCPOM, respectively. In the case of SOCMAOM, significant positive correlations were identified between SOCMAOM and SWC, pH, and coverage, while a significant negative correlation was observed with N H 4 + -N (p < 0.05). Vegetation status, soil nitrogen, and the soil and water conditions explained 13%, 7.6%, and 9.4% of the variance in SOCMAOM, respectively. For the SICPOM model, significant positive correlations were found with TN, SWC, N H 4 + -N, and AP, while a significant negative correlation was observed with pH (p < 0.05). Vegetation status, soil nitrogen, soil phosphorus, and the soil and water conditions contributed 6.3%, 43%, 11%, and 2.5% to the variance in SICPOM, respectively. Regarding the SICMAOM model, it exhibited a significant positive correlation with coverage and a significant negative correlation with N H 4 + -N (p < 0.05). Vegetation status and soil nitrogen accounted for 6.5% and 50% of the variance in SICMAOM, respectively.

4. Discussion

As a consequence of the reclamation of saline–alkali drainage ditches, alterations in soil carbon content and components have occurred, alongside an improvement in the stability of the soil carbon pool. This study specifically reveals that TC and SOC contents in the saline–alkali drainage ditches rose as the reclamation time advanced, whereas SIC content decreased (Table 2). This contrasts with previous studies on reclaimed saline–alkali farmland, which reported an increase in both SOC and SIC contents [54]. The changes in vegetation status and SWC of drainage ditches largely account for this discrepancy. On the one hand, drainage ditches experience less disturbance compared to farmland and exhibit better vegetation status (Table 1), leading to increased carbon input from plants to the soil. On the other hand, the drainage process in saline–alkali ditches results in higher SIC loss due to increased carbonate dissolution caused by higher SWC (Table 2). This leads to more SIC being dissolved into the water body or groundwater of the ditches [11,55,56]. However, the nuanced changes in soil carbon components more accurately illustrate the variations in SOC and SIC contents (Figure 2). As reclamation time increased, the SOCPOM, SOCMAOM, and SICMAOM contents increased, while the SICPOM content decreased, showing a more significant change compared to SICMAOM. This suggests an overall increase in SOC content and a decrease in SIC content (Table 2). Moreover, the increasing SOCMAOM content also suggests an enhancement in stable components of saline–alkali drainage ditch soils (Figure 2d,e), ultimately enhancing the stability of the soil carbon pool [57,58,59].
The extended turnover time and enhanced stability of MAOM in comparison to POM establish MAOM as a crucial component in soil carbon sequestration [16,32,60]. In this study, the proportion of unstable functional groups (polysaccharide C–O and alcohol C–OH/C–NH) was higher in the POM fraction than in the MAOM fraction (Figure 4). This finding is consistent with previous research and implies that MAOM possesses greater stability than POM [43,61]. Changes in the peak area of functional groups in both POM and MAOM fractions further illustrate the enhancing stability of carbon components with the increasing reclamation time (Table 3). Specifically, as reclamation time increased, the C=C/C=N groups decreased and C-H groups increased in the POM fraction, while both C=C/C=N and C-H groups increased in the MAOM fraction (Table 3). This trend implies that increased reclamation time enhances the stability of both POM and MAOM fractions. Moreover, the changes in POM and MAOM components likely occurred through changes in C=C/C=N and C–H groups, as indicated by the decrease in SOCPOM content and the increase in SOCMAOM content in the 15th year of reclamation (Figure 2b,c). Notably, the higher C–H groups in POM are associated with plant contributions [32,62,63], whereas the comparable distribution of C–H groups in both MAOM and POM fractions indicates that saline–alkali ditch plants contribute similarly to both organic matter fractions (Table 3).
By quantifying the degree of decomposition in the POM and MAOM fractions and their response to the water environment in saline–alkali drainage ditches, the results further demonstrate an increase in the stability of soil carbon components (Table 4). Specifically, the concentration of W in both the POM and MAOM fractions initially decreased from the 7th to the 15th year of reclamation and then increased from the 15th to the 30th year. This variation is primarily influenced by fluctuations in SWC. In anaerobic conditions, oxygen-containing functional groups serve as a source of oxygen, leading to an increase in C–H groups and a decrease in C–O groups, consequently elevating the concentration of W [64,65,66]. This increase in W reflects enhanced aggregate stability [67]. The inverse relationship between SWC and W confirms this association and implies that the aggregate stability of both the POM and MAOM fractions initially diminishes and then amplifies over time. Moreover, in the POM fraction, DDI remains constant; meanwhile, in the MAOM fraction, it decreases from the 7th to the 15th year of reclamation and subsequently increases from the 15th to the 30th year, consistently exceeding the values of the POM fraction (Table 4). This discrepancy indicates differences in the degree of decomposition between the POM and MAOM fractions. Despite changes occurring in the MAOM fraction, its stability consistently surpasses that of the POM fraction. The stable nature of the POM fraction further emphasizes the pronounced influence of the reclamation process on MAOM.
Although FTIR spectroscopy has enhanced our understanding of the stability changes in soil carbon components through chemical composition analysis, there are still limitations in the current FTIR spectroscopy analysis methods for the physically separated POM and MAOM fractions from soil. The obtained infrared spectroscopic data from these fractions may still be subject to uncertainties. One challenge is the potential peak shifts in the infrared spectra of POM and MAOM fractions due to the complex particle composition of soil samples, which can lead to misinterpretation of peaks as SOM or soil moisture. Additionally, KBr, a commonly used solid dispersant in infrared spectroscopic analysis, may not be completely inert and could react with metal halides present in the soil. However, FTIR spectroscopy continues to be a valuable method for qualitatively analyzing the composition of SOM functional groups. Our study offers additional insights into the stabilization process of soil carbon fractions, such as POM and MAOM, by analyzing a large number of FTIR spectra. To enhance the accuracy and reliability of infrared spectroscopic data, future research should focus on refining the resolution of using KBr pellets for infrared spectroscopic analysis and augmenting the spectral information with mineral fraction identification tables specific to soil samples.
The stabilization of soil carbon components was mainly affected by vegetation status and soil and water conditions in saline–alkali ditches after reclamation. Multiple regression analysis revealed that vegetation status and soil nitrogen play key roles in influencing these changes (Figure 5). This can be attributed to the fact that TN promotes SOCPOM and SICPOM contents. Additionally, coverage facilitates SOCMAOM and SICMAOM. Consequently, an increase in soil nitrogen not only improves vegetation growth status but also enhances the carbon input into the soil by plants [68]. Improving vegetation growth status and increasing soil nitrogen levels thus prove to be effective approaches for augmenting carbon content in ditch soils. The inhibition of SICPOM by N H 4 + -N and the promotion of SOCMAOM and SICMAOM in drained ditches indicate a likely association between N H 4 + -N and the generation of SIC, possibly promoting the formation and stabilization of MAOM. This relationship arises from the long-term fertilization processes in farmland, in which nutrient elements inevitably migrate into the soil and water via drainage. While this process enhances vegetation growth in ditches, the soil acidification resulting from nitrogen fertilizer utilization can lead to the loss of SIC [69,70,71,72]. The distinct responses of SOCPOM and SOCMAOM contents to variations in SWC and pH suggest that the combined influence of SWC and pH promotes SOCMAOM while inhibiting SOCPOM. Increased SWC and pH reduce microbial activity, thereby enhancing the stability of SOCMAOM [73,74,75]. Conversely, elevated SWC and pH levels inhibit plant growth, as excessive water stress affects normal plant development and reduces carbon input into the soil by plants [76,77]. Additionally, a high pH soil condition (pH > 8) can result in SOC desorption and greater losses of relatively labile SOCPOM [78,79].
Early models proposed that MAOM is formed from POM decomposition [1,80]. However, recent research suggests separate formation and stabilization pathways for POM and MAOM, with no consistent evidence of POM converting into MAOM [81,82,83]. Notably, a key observation is that the decrease in POM is not parallel with the increase in MAOM [83]. In our study, the decrease in SOCPOM and the increase in SOCMAOM contents occurred in the 15th year of reclamation, primarily at the 20–40 cm depth of the furrow sole (Figure 2 and Figure 3g). However, this does not necessarily indicate a conversion from POM to MAOM, as it is largely influenced by the structural characteristics of the saline–alkali ditches. The plant soluble inputs accumulate at the furrow sole during drainage processes in saline–alkali ditches, forming MAOM when they interact with soil mineral surfaces at depths of 20–40 cm [23,84,85,86]. Conversely, plant structural inputs are unlikely to concentrate at the furrow sole during drainage processes; instead, more POM is formed relative to the furrow sole [23,81,86].
Enhancing soil carbon content and stability in saline–alkali ditches primarily relies on long-term drainage processes. To effectively reduce soil salinity, numerous drainage ditches have been constructed, leading to the influx of nutrients from farmland soils into the soil and water within ditches during extended drainage. Subsequent enhancements in vegetation status and soil and water conditions have led to an amount of carbon in the ditch soil. Despite the loss in SIC and reduced SOC stability caused by soil acidification from fertilizer application, the overall impact on the carbon content and stability in saline–alkaline ditch soil is relatively minor. Moreover, the potential of ditch structures to promote soil carbon sequestration may be underestimated. With the improvement in the soil and water conditions in the reclaimed ditches, vegetation restoration has led to the gradual formation and stabilization of aggregates, providing physical protection for soil carbon and promoting soil carbon sequestration [87,88,89]. Specifically, in the initial drainage phase, the ditch structure promotes the accumulation of SOCMAOM at the furrow sole (Figure 3g and Figure 6). The higher SWC and decreased pH at the furrow sole decrease microbial activity (Figure 3h), consequently increasing the stability of soil carbon. Conversely, in the last drainage phase, the decreased drainage frequency and volume result in alternate wetting and drying at the furrow sole soils (Figure 6). These alternating changes in the soil environment impact microbial activity, leading to the exposure and decomposition of SOCMAOM [30,31]. Thus, to effectively enhance the soil carbon sequestration capacity of saline–alkali ditches, it is recommended to maintain water levels in the ditches beyond the 15th year of reclamation and to prevent mechanical damage to the ditch structure caused by agricultural management practices.
Following the reclaimed saline–alkali ditches, this study observed a general rise in the soil carbon pool, with the soil organic carbon pool making a more significant contribution compared to the soil inorganic carbon pool. Therefore, when concentrating on the response of soil carbon pools to environmental factors, it is crucial to focus on the distinct roles played by SOC and SIC in the soil carbon stabilization process. Moreover, the enhancement of vegetation conditions and soil and water conditions in saline–alkali ditches has altered the soil carbon components after reclamation, thereby improving soil carbon stability, largely due to long-term drainage processes. Although our findings shed light on these shifts in carbon components, future research will need to employ isotope tracing methods to reveal the underlying stabilization processes behind these alterations. To further elucidate the stabilization mechanisms of soil carbon components, future studies are needed to investigate the changes in soil carbon components under diverse environmental factors. Emphasizing field experiments over laboratory studies will aid in holistically considering the processes and pathways involved in soil carbon component stabilization. This approach will offer invaluable practical insights for the informed development of soil carbon pool management strategies.

5. Conclusions

In summary, this study presents a case study that investigates the processes underlying the stability of soil carbon components based on POM and MAOM fractions. The findings demonstrate that the reclamation process of saline–alkali drainage ditches changes the soil carbon content and components, ultimately enhancing soil carbon stability. As the reclamation time increased, there was a significant increase in TC and SOC contents, along with a significant decrease in SIC content. Within the POM fraction, there was a notable increase in SOC content and a decrease in SIC content. In the MAOM fraction, both SOCMAOM and SICMAOM contents showed a significant increase. In addition, a decrease in SOCPOM content and an increase in SOCMAOM content with increasing reclamation time at the 20–40 cm depth of the furrow sole was largely dominated by drainage processes. FTIR results revealed that MAOM was greatly influenced by the reclamation time more than POM was, but the changes in both POM and MAOM contributed to an increase in soil carbon stability. Enhancing soil carbon content and stability in saline–alkali soils can be effectively achieved by utilizing the theoretical foundation provided by these findings, which deepen our understanding of soil carbon dynamics and the influence of environmental factors.

Supplementary Materials

The following supporting information can be downloaded at: https://www.mdpi.com/article/10.3390/agronomy14040869/s1, Figure S1: Typical FTIR spectra for POM and MAOM fractions with different reclamation years, soil depths, and soil sampling positions; Table S1: The specific peak areas of four functional groups in POM and MAOM fractions by FTIR with different soil depths; Table S2: The specific peak areas of four functional groups in POM and MAOM fractions by FTIR with different soil sampling positions; Table S3: Soil organic matter water repellence (W), hydrophobicity index (HI), and degree of decomposition (DDI) of POM and MAOM fractions with different soil depths; Table S4: Soil organic matter water repellence (W), hydrophobicity index (HI), and degree of decomposition (DDI) of POM and MAOM fractions with different soil sampling positions.

Author Contributions

Writing—review and editing, X.L., Z.L. and J.L.; methodology, X.L., Z.L. and Y.G.; validation, Z.L. and J.L.; data curation, X.L. and Y.G.; conceptualization, Z.L. and J.L.; project administration, Z.L. All authors have read and agreed to the published version of the manuscript.

Funding

This research was funded by the National Natural Science Foundation of China (No. 32101596), the Key R&D Program of Shandong Province, China (2022TZXD0043), the Strategic Priority Research Program of the Chinese Academy of Sciences (no. XDA26050202), and the Shandong Provincial Natural Science Foundation (no. ZR2021QC055).

Data Availability Statement

The data presented in this study are available on request from the corresponding author. The data are not publicly available due to privacy restrictions.

Conflicts of Interest

The authors declare no conflicts of interest.

References

  1. Lehmann, J.; Kleber, M. The contentious nature of soil organic matter. Nature 2015, 528, 60–68. [Google Scholar] [CrossRef] [PubMed]
  2. Dlamini, P.; Chivenge, P.; Chaplot, V. Overgrazing decreases soil organic carbon stocks the most under dry climates and low soil pH: A meta-analysis shows. Agric. Ecosyst. Environ. 2016, 221, 258–269. [Google Scholar] [CrossRef]
  3. Zhou, M.; Xiao, Y.; Zhang, X.; Sui, Y.; Xiao, L.; Lin, J.; Cruse, R.M.; Ding, G.; Liu, X. Warming-dominated climate change impacts on soil organic carbon fractions and aggregate stability in Mollisols. Geoderma 2023, 438, 116618. [Google Scholar] [CrossRef]
  4. Bradford, M.A.W.; William, R.; Bonan, G.B.; Fierer, N.; Raymond, P.A.; Crowther, T.W. Managing uncertainty in soil carbon feedbacks to climate change. Nat. Clim. Chang. 2016, 6, 751–758. [Google Scholar] [CrossRef]
  5. Knoblauch, C.; Beer, C.; Liebner, S.; Grigoriev, M.N.; Pfeiffer, E.-M. Methane production as key to the greenhouse gas budget of thawing permafrost. Nat. Clim. Chang. 2018, 8, 309–312. [Google Scholar] [CrossRef]
  6. Wiesmeier, M.; Schad, P.; von Lützow, M.; Poeplau, C.; Spörlein, P.; Geuß, U.; Hangen, E.; Reischl, A.; Schilling, B.; Kögel-Knabner, I. Quantification of Functional Soil Organic Carbon Pools for Major Soil Units and Land Uses in Southeast Germany (Bavaria). Agric. Ecosyst. Environ. 2014, 185, 208–220. [Google Scholar] [CrossRef]
  7. Sun, X.; Tang, Z.; Ryan, M.G.; You, Y.; Sun, O.J. Changes in soil organic carbon contents and fractionations of forests along a climatic gradient in China. For. Ecosyst. 2019, 6, 1. [Google Scholar] [CrossRef]
  8. Bai, T.; Wang, P.; Hall, S.; Wang, F.; Ye, C.; Li, Z.; Li, S.; Zhou, L.; Qiu, Y.; Guo, J.; et al. Interactive global change factors mitigate soil aggregation and carbon change in a semi-arid grassland. Glob. Chang. Biol. 2020, 26, 5320–5332. [Google Scholar] [CrossRef]
  9. Van der Werf, G.; Morton, D.; DeFries, R.; Olivier, J.; Kasibhatla, P.S.; Jackson, R.B.; Collatz, G.J.; Randerson, J. CO2 emissions from forest loss. Nat. Geosci. 2009, 2, 737–738. [Google Scholar] [CrossRef]
  10. Deng, L.; Liu, G.B.; Shangguan, Z.P. Land-use conversion and changing soil carbon stocks in China’s “Grain-for-Green” Program: A synthesis. Glob. Chang. Biol. 2014, 20, 3544–3556. [Google Scholar] [CrossRef]
  11. Jin, Z.; Dong, Y.; Wang, Y.; Wei, X.; Wang, Y.; Cui, B.; Zhou, W. Natural vegetation restoration is more beneficial to soil surface organic and inorganic carbon sequestration than tree plantation on the Loess Plateau of China. Sci. Total Environ. 2014, 485–486, 615–623. [Google Scholar] [CrossRef] [PubMed]
  12. Sommer, R.; Bossio, D. Dynamics and climate change mitigation potential of soil organic carbon sequestration. J. Environ. Manag. 2014, 144, 83–87. [Google Scholar] [CrossRef] [PubMed]
  13. Chaplot, V.; Dlamini, P.; Chivenge, P. Potential of grassland rehabilitation through high density-short duration grazing to sequester atmospheric carbon. Geoderma 2016, 271, 10–17. [Google Scholar] [CrossRef]
  14. Trumbore, S. Radiocarbon and soil carbon dynamics. Annu. Rev. Earth Planet. Sci. 2009, 37, 47–66. [Google Scholar] [CrossRef]
  15. Lugato, E.; Lavallee, J.M.; Haddix, M.L.; Panagos, P.; Cotrufo, M.F. Different climate sensitivity of particulate and mineral-associated soil organic matter. Nat. Geosci. 2021, 14, 295–300. [Google Scholar] [CrossRef]
  16. Lavallee, J.M.; Soong, J.L.; Cotrufo, M.F. Conceptualizing soil organic matter into particulate and mineral-associated forms to address global change in the 21st century. Glob. Chang. Biol. 2020, 26, 261–273. [Google Scholar] [CrossRef] [PubMed]
  17. Liao, C.; Chang, K.; Wu, B.; Zhang, D.; Wang, C.; Cheng, X. Divergence in soil particulate and mineral-associated organic carbon reshapes carbon stabilization along an elevational gradient. Catena 2024, 235, 107682. [Google Scholar] [CrossRef]
  18. Cambardella, C.A.; Elliott, E.T. Particulate soil organic-matter changes across a grassland cultivation sequence. Soil Sci. Soc. Am. J. 1992, 56, 777–783. [Google Scholar] [CrossRef]
  19. Cotrufo, M.F.; Ranalli, M.G.; Haddix, M.L.; Six, J.; Lugato, E. Soil carbon storage informed by particulate and mineral-associated organic matter. Nat. Geosci. 2019, 12, 989–994. [Google Scholar] [CrossRef]
  20. Marschner, B.; Brodowski, S.; Dreves, A.; Gleixner, G.; Gude, A.; Grootes, P.M.; Hamer, U.; Heim, A.; Jandl, G.; Ji, R.; et al. How relevant is recalcitrance for the stabilization of organic matter in soils? J. Plant. Nutr. Soil Sci. 2008, 171, 91–110. [Google Scholar] [CrossRef]
  21. Rumpel, C.; Eusterhues, K.; Kögel-Knabner, I. Non-cellulosic neutral sugar contribution to mineral associated organic matter in top- and subsoil horizons of two acid forest soils. Soil Biol. Biochem. 2010, 42, 379–382. [Google Scholar] [CrossRef]
  22. Jagadamma, S.; Mayes, M.A.; Phillips, J.R. Selective sorption of dissolved organic carbon compounds by temperate soils. PLoS ONE 2012, 7, e50434. [Google Scholar] [CrossRef] [PubMed]
  23. Islam, M.R.; Singh, B.; Dijkstra, F.A. Stabilisation of Soil Organic Matter: Interactions between Clay and Microbes. Biogeochemistry 2022, 160, 145–158. [Google Scholar] [CrossRef]
  24. Schmidt, M.; Torn, M.; Abiven, S.; Dittmar, T.; Guggenberger, G.; Janssens, I.; Kleber, M.; Kögel-Knabner, I.; Lehmann, J.; Manning, D.; et al. Persistence of soil organic matter as an ecosystem property. Nature 2011, 478, 49–56. [Google Scholar] [CrossRef] [PubMed]
  25. Cambardella, C.A.; Elliott, E.T. Carbon and nitrogen dynamics of soil organic matter fractions from cultivated grassland soils. Soil Sci. Soc. Am. J. 1994, 58, 123–130. [Google Scholar] [CrossRef]
  26. Collins, H.P.; Christenson, D.R.; Blevins, R.L.; Bundy, L.G.; Dick, W.A.; Huggins, D.R.; Paul, E.A. Soil carbon dynamics in corn- based agroecosystems: Results from carbon-13 natural abundance. Soil Sci. Soc. Am. J. 1999, 63, 584–591. [Google Scholar] [CrossRef]
  27. Duval, M.E.; Galantini, J.A.; Iglesias, J.O.; Canelo, S.; Martínez, J.M.; Wall, L. Analysis of organic fractions as indicators of soil quality under natural and cultivated systems. Soil Tillage Res. 2013, 131, 11–19. [Google Scholar] [CrossRef]
  28. Zhang, H.; Wu, P.; Yin, A.; Yang, X.; Zhang, M.; Gao, C. Prediction of Soil Organic Carbon in an Intensively Managed Reclamation Zone of Eastern China: A Comparison of Multiple Linear Regressions and the Random Forest Model. Sci. Total Environ. 2017, 592, 704–713. [Google Scholar] [CrossRef] [PubMed]
  29. Zhao, C.; Zhang, H.; Song, C.; Zhu, J.K.; Shabala, S. Mechanisms of Plant Responses and Adaptation to Soil Salinity. Innovation 2020, 1, 100017. [Google Scholar] [CrossRef] [PubMed]
  30. Meisner, A.; Rousk, J.; Bååth, E. Prolonged drought changes the bacterial growth response to Re-wetting. Soil Biol. Biochem. 2015, 88, 314–322. [Google Scholar] [CrossRef]
  31. Najera, F.; Dippold, M.A.; Boy, J.; Seguel, O.; Koester, M.; Stock, S.; Merino, C.; Kuzyakov, Y.; Matus, F. Effects of drying/rewetting on soil aggregate dynamics and implications for organic matter turnover. Biol. Fertil. Soils 2020, 56, 893–905. [Google Scholar] [CrossRef]
  32. Yu, W.; Huang, W.; Weintraub-Leff, S.R.; Hall, S.J. Where and why do particulate organic matter (POM) and mineral-associated organic matter (MAOM) differ among diverse soils? Soil Biol. Biochem. 2022, 172, 108756. [Google Scholar] [CrossRef]
  33. King, A.E.; Congreves, K.A.; Deen, B.; Dunfield, K.E.; Voroney, R.P.; Wagner-Riddle, C. Quantifying the relationships between soil fraction mass, fraction carbon, and total soil carbon to assess mechanisms of physical protection. Soil Biol. Biochem. 2019, 135, 95–107. [Google Scholar] [CrossRef]
  34. Dudek, M.; Kabała, C.; Łabaz, B.; Mituła, P.; Bednik, M.; Medyńska-Juraszek, A. Mid-infrared spectroscopy supports identification of the origin of organic matter in soils. Land 2021, 10, 215. [Google Scholar] [CrossRef]
  35. Tanykova, N.; Petrova, Y.; Kostina, J.; Kozlova, E.; Leushina, E.; Spasennykh, M. Study of organic matter of unconventional reservoirs by IR Spectroscopy and IR microscopy. Geosciences 2021, 11, 277. [Google Scholar] [CrossRef]
  36. Margenot, A.J.; Parikh, S.J.; Calderón, F.J. Fourier-Transform Infrared Spectroscopy for Soil Organic Matter Analysis. Soil Sci. Soc. Am. J. 2023, 87, 1503–1528. [Google Scholar] [CrossRef]
  37. Proskurnin, M.A.; Volkov, D.S.; Timofeev, Y.V.; Fomin, D.S.; Rogova, O.B. Chernozem Land Use Differentiation by Temperature-Dependent IR Spectra. Agronomy 2023, 13, 1967. [Google Scholar] [CrossRef]
  38. Beasley, M.M.; Bartelink, E.J.; Taylor, L.; Miller, R.M. Comparison of Transmission FTIR, ATR, and DRIFT Spectra: Implications for Assessment of Bone Bioapatite Diagenesis. J. Archaeol. Sci. 2014, 46, 16–22. [Google Scholar] [CrossRef]
  39. Yan, B.; Germlich, H.-U.; Moss, S.; Coppola, G.; Sun, Q.; Liu, L. A comparison of various FTIR and FT Raman methods: Applications in the reaction optimization stage of combinatorial chemistry. J. Comb. Chem. 1999, 1, 46–54. [Google Scholar] [CrossRef]
  40. Cardell, C.; Guerra, I.; Romero-Pastor, J.; Cultrone, G.; Rodriguez-Navarro, A. Innovative analytical methodology combining micro-X-Ray diffraction, scanning electron microscopy-based mineral maps, and diffuse reflectance infrared Fourier transform spectroscopy to characterize archaeological artifacts. Anal. Chem. 2009, 81, 604–611. [Google Scholar] [CrossRef]
  41. Ferraro, J. Practical Fourier Transform Infrared Spectroscopy: Industrial and Laboratory Chemical Analysis; Ferraro, J., Krishnan, K., Eds.; Academic Press: San Diego, CA, USA, 1990. [Google Scholar] [CrossRef]
  42. Zhan, X.; Zhou, L. Colorimetric determination of dissolved organic carbon in soil solution and water environment. China Environ. Sci. 2002, 22, 433–437. (In Chinese) [Google Scholar]
  43. Liu, C.; Wu, Z.; He, C.; Zhang, Y.; Huang, W.; Wang, D. Source identification and chemical compositions of particulate and mineral-associated organic matter in the deposited sediments of a dam-controlled watershed. Catena 2022, 219, 106618. [Google Scholar] [CrossRef]
  44. Fultz, L.M.; Moore-Kucera, J.; Calderón, F.; Acosta-Martínez, V. Using Fourier-Transform Mid-Infrared Spectroscopy to distinguish soil organic matter composition dynamics in aggregate fractions of two agroecosystems. Soil Sci. Soc. Am. J. 2014, 6, 1940–1948. [Google Scholar] [CrossRef]
  45. Ramírez, P.B.; Calderón, F.J.; Fonte, S.J.; Santibáñez, F.; Bonilla, C.A. Spectral responses to labile organic carbon fractions as useful soil quality indicators across a climatic gradient. Ecol. Indic. 2020, 111, 106042. [Google Scholar] [CrossRef]
  46. Margenot, A.J.; Calderón, F.J.; Bowles, T.M.; Parikh, S.J.; Jackson, L.E. Soil organic matter functional group composition in relation to organic carbon, nitrogen, and phosphorus fractions in organically managed tomato fields. Soil Sci. Soc. Am. J. 2015, 79, 772–782. [Google Scholar] [CrossRef]
  47. Pärnpuu, S.; Astover, A.; Tõnutare, T.; Penu, P.; Kauer, K. Soil Organic Matter Qualification with FTIR Spectroscopy under Different Soil Types in Estonia. Geoderma Reg. 2022, 28, e00483. [Google Scholar] [CrossRef]
  48. Kaiser, M.; Ellerbrock, R.H.; Gerke, H.H. Long-term effects of crop rotation and fertilization on soil organic matter composition. Eur. J. Soil Sci. 2007, 58, 1460–1470. [Google Scholar] [CrossRef]
  49. Matějková, S.; Šimon, T. Application of FTIR spectroscopy for evaluation of hydrophobic/hydrophilic organic components in arable soil. Plant Soil Environ. 2012, 58, 192–195. [Google Scholar] [CrossRef]
  50. Capriel, P.; Beck, T.; Borchert, H.; Gronholz, J.; Zachmann, G. Hydrophobicity of the organic matter in arable soils. Soil Biol. Biochem. 1995, 27, 1453–1458. [Google Scholar] [CrossRef]
  51. Chefetz, B.; Hatcher, P.G.; Hadar, Y.; Chen, Y. Chemical and biological characterization of organic matter during composting of municipal solid waste. J. Environ. Qual. 1996, 25, 776–785. [Google Scholar] [CrossRef]
  52. Stehlíková, I.; Madaras, M.; Lipavský, J.; Šimon, T. Study on some soil quality changes obtained from long-term experiments. Plant Soil Environ. 2016, 62, 74–79. [Google Scholar] [CrossRef]
  53. Jakab, G.; Filep, T.; Király, C.; Madarász, B.; Zacháry, D.; Ringer, M.; Vancsik, A.; Gáspár, L.; Szalai, Z. Differences in mineral phase associated soil organic matter composition due to varying tillage intensity. Agronomy 2019, 9, 700. [Google Scholar] [CrossRef]
  54. Zhang, H.; Yin, A.; Yang, X.; Wu, P.; Fan, M.; Wu, J.; Zhang, M.; Gao, C. Changes in surface soil organic/inorganic carbon concentrations and their driving forces in reclaimed coastal tidal flats. Geoderma 2019, 352, 150–159. [Google Scholar] [CrossRef]
  55. Liu, W.; Wei, J.; Cheng, J.; Li, W. Profile Distribution of Soil Inorganic Carbon along a Chronosequence of Grassland Restoration on a 22-Year Scale in the Chinese Loess Plateau. Catena 2014, 121, 321–329. [Google Scholar] [CrossRef]
  56. Zhang, L.; Zhao, W.; Zhang, R.; Cao, H.; Tan, W. Profile distribution of soil organic and inorganic carbon following revegetation on the Loess Plateau, China. Environ. Sci. Pollut. Res. 2018, 25, 30301–30314. [Google Scholar] [CrossRef] [PubMed]
  57. Li, Y.; Zhang, X.; Wang, B.; Wu, X.; Wang, Z.; Liu, L.; Yang, H. Revegetation promotes soil mineral-associated organic carbon sequestration and soil carbon stability in the Tengger Desert, northern China. Soil Biol. Biochem. 2023, 185, 109155. [Google Scholar] [CrossRef]
  58. Su, Z.; Zhong, Y.; Zhu, X.; Wu, Y.; Shen, Z.; Shangguan, Z. Vegetation restoration altered the soil organic carbon composition and favoured its stability in a Robinia pseudoacacia plantation. Sci. Total Environ. 2023, 899, 165665. [Google Scholar] [CrossRef]
  59. Yang, L.; Song, X.; Lyu, S.; Shen, W.; Gao, Y. Dynamics and Fractions of Soil Organic Carbon in Response to 35 Years of Afforestation in Subtropical China. Plant Soil 2024, 1–14. [Google Scholar] [CrossRef]
  60. Sokol, N.; Sanderman, J.; Bradford, M. Pathways of mineral-associated soil organic matter formation: Integrating the role of plant carbon source, chemistry, and point of entry. Glob. Chang. Biol. 2019, 25, 12–24. [Google Scholar] [CrossRef]
  61. Berhe, A.A.; Harden, J.W.; Torn, M.S.; Kleber, M.; Burton, S.D.; Harte, J. Persistence of soil organic matter in eroding versus depositional landform positions. J. Geophys. Res. Biogeosci. 2012, 117, G02019. [Google Scholar] [CrossRef]
  62. Demyan, M.S.; Rasche, F.; Schulz, E.; Breulmann, M.; Müller, T.; Cadisch, G. Use of specific peaks obtained by diffuse reflectance Fourier transform mid-infrared spectroscopy to study the composition of organic matter in a Haplic Chernozem. Eur. J. Soil Sci. 2012, 63, 189–199. [Google Scholar] [CrossRef]
  63. Laudicina, V.A.; Novara, A.; Barbera, V.; Egli, M.; Badalucco, L. Long-term tillage and cropping system effects on chemical and biochemical characteristics of soil organic matter in a Mediterranean semiarid environment. Land Degrad. Dev. 2014, 26, 45–53. [Google Scholar] [CrossRef]
  64. Calderón, F.J.; Reeves, J.B.; Collins, H.P.; Paul, E.A. Chemical differences in soil organic matter fractions determined by diffuse-reflectance mid-infrared spectroscopy. Soil Sci. Soc. Am. J. 2011, 75, 568–579. [Google Scholar] [CrossRef]
  65. Veum, K.; Goyne, K.; Kremer, R.; Miles, R.; Sudduth, K. Biological indicators of soil quality and soil organic matter characteristics in an agricultural management continuum. Biogeochemistry 2014, 117, 81–99. [Google Scholar] [CrossRef]
  66. Heller, C.; Ellerbrock, R.H.; Roßkopf, N.; Klingenfuß, C.; Zeitz, J. Soil organic matter characterization of temperate peatland soil with FTIR-spectroscopy: Effects of mire type and drainage intensity: SOM characterization of peatland soil using FTIR. Eur. J. Soil Sci. 2015, 66, 847–858. [Google Scholar] [CrossRef]
  67. Milanovskiy, E.; Shein, E.V. Functional role of amphiphilic humus components in humus structure formation and soil genesis. Eurasian Soil. Sci. 2002, 35, 1064–1075. [Google Scholar]
  68. Knicker, H. Soil organic N—An under-rated player for C sequestration in soils? Soil Biol. Biochem. 2011, 43, 1118–1129. [Google Scholar] [CrossRef]
  69. Zamanian, K.; Zarebanadkouki, M.; Kuzyakov, Y. Nitrogen fertilization raises CO2 efflux from inorganic carbon: A global assessment. Glob. Chang. Biol. 2018, 24, 2810–2817. [Google Scholar] [CrossRef] [PubMed]
  70. Cardinael, R.; Chevallier, T.; Guenet, B.; Girardin, C.; Cozzi, T.; Pouteau, V.; Chenu, C. Organic carbon decomposition rates with depth and contribution of inorganic carbon to CO2 emissions under a Mediterranean agroforestry system. Eur. J. Soil Sci. 2020, 71, 909–923. [Google Scholar] [CrossRef]
  71. Hodges, C.; Brantley, S.L.; Sharifironizi, M.; Forsythe, B.; Tang, Q.; Carpenter, N.; Kaye, J. Soil carbon dioxide flux partitioning in a calcareous watershed with agricultural impacts. J. Geophys. Res. Biogeosci. 2021, 126, 10. [Google Scholar] [CrossRef]
  72. Zamanian, K.; Zhou, J.; Kuzyakov, Y. Soil carbonates: The unaccounted, irrecoverable carbon source. Geoderma 2021, 384, 114817. [Google Scholar] [CrossRef]
  73. Cao, H.; Chen, R.; Wang, L.; Jiang, L.; Yang, F.; Zheng, S.; Wang, G.; Lin, X. Soil pH, total phosphorus, climate and distance are the major factors influencing microbial activity at a regional spatial scale. Sci. Rep. 2016, 6, 25815. [Google Scholar] [CrossRef] [PubMed]
  74. Yang, X.; Zhu, K.; Loik, M.E.; Sun, W. Differential responses of soil bacteria and fungi to altered precipitation in a meadow steppe. Geoderma 2021, 384, 114812. [Google Scholar] [CrossRef]
  75. Zhao, T.; Lozano, Y.M.; Rillig, M.C. Microplastics Increase Soil pH and Decrease Microbial Activities as a Function of Microplastic Shape, Polymer Type, and Exposure Time. Front. Environ. Sci. 2021, 9, 1–14. [Google Scholar] [CrossRef]
  76. Schwalm, C.R.; Anderegg, W.R.L.; Michalak, A.M.; Fisher, J.B.; Biondi, F.; Koch, G.; Litvak, M.; Ogle, K.; Shaw, J.D.; Wolf, A.; et al. Global patterns of drought recovery. Nature 2017, 548, 202–205. [Google Scholar] [CrossRef]
  77. Humphrey, V.; Zscheischler, J.; Ciais, P.; Gudmundsson, L.; Sitch, S.; Seneviratne, S.I. Sensitivity of atmospheric CO2 growth rate to observed changes in terrestrial water storage. Nature 2018, 560, 628–631. [Google Scholar] [CrossRef]
  78. Tavakkoli, E.; Rengasamy, P.; Smith, E.; McDonald, G.K. The effect of cation-anion interactions on soil pH and solubility of organic carbon. Eur. J. Soil Sci. 2015, 66, 1054–1062. [Google Scholar] [CrossRef]
  79. Zhang, K.; Wang, X.; Wu, L.; Lu, T.; Guo, Y.; Ding, X. Impacts of salinity on the stability of soil organic carbon in the croplands of the Yellow River Delta. Land Degrad. Dev. 2021, 32, 1873–1882. [Google Scholar] [CrossRef]
  80. Grandy, A.S.; Neff, J.C. Molecular C dynamics downstream: The biochemical decomposition sequence and its impact on soil organic matter structure and function. Sci. Total Environ. 2008, 404, 297–307. [Google Scholar] [CrossRef]
  81. Haddix, M.L.; Paul, E.A.; Cotrufo, M.F. Dual, differential isotope labeling shows the preferential movement of labile plant constituents into mineral-bonded soil organic matter. Glob. Chang. Biol. 2016, 22, 2301–2312. [Google Scholar] [CrossRef]
  82. Fulton-Smith, S.; Cotrufo, M.F. Pathways of soil organic matter formation from above and belowground inputs in a Sorghum bicolor bioenergy crop. GCB Bioenergy 2019, 11, 971–987. [Google Scholar] [CrossRef]
  83. Haddix, M.L.; Gregorich, E.G.; Helgason, B.L.; Janzen, H.; Ellert, B.H.; Cotrufo, M.F. Climate, Carbon Content, and Soil Texture Control the Independent Formation and Persistence of Particulate and Mineral-Associated Organic Matter in Soil. Geoderma 2020, 363, 114160. [Google Scholar] [CrossRef]
  84. Cotrufo, M.F.; Soong, J.L.; Horton, A.J.; Campbell, E.E.; Haddix, M.L.; Wall, D.H.; Parton, W.J. Formation of soil organic matter via biochemical and physical pathways of litter mass loss. Nat. Geosci. 2015, 8, 776–779. [Google Scholar] [CrossRef]
  85. Sokol, N.W.; Bradford, M.A. Microbial formation of stable soil carbon is more efficient from belowground than aboveground input. Nat. Geosci. 2019, 12, 46–53. [Google Scholar] [CrossRef]
  86. Cotrufo, M.F.; Haddix, M.L.; Kroeger, M.E.; Stewart, C.E. The Role of Plant Input Physical-Chemical Properties, and Microbial and Soil Chemical Diversity on the Formation of Particulate and Mineral-Associated Organic Matter. Soil Biol. Biochem. 2022, 168, 108648. [Google Scholar] [CrossRef]
  87. Lal, R.; Negassa, W.; Lorenz, K. Carbon Sequestration in Soil. Curr. Opin. Environ. Sustain. 2015, 15, 79–86. [Google Scholar] [CrossRef]
  88. Somasundaram, J.; Chaudhary, R.S.; Awanish Kumar, D.; Biswas, A.K.; Sinha, N.K.; Mohanty, M.; Hati, K.M.; Jha, P.; Sankar, M.; Patra, A.K.; et al. Effect of contrasting tillage and cropping systems on soil aggregation, carbon pools and aggregate-associated carbon in rainfed Vertisols. Eur. J. Soil Sci. 2018, 69, 879–891. [Google Scholar] [CrossRef]
  89. Xiao, L.; Zhang, W.; Hu, P.; Xiao, D.; Yang, R.; Ye, Y.; Wang, K. The Formation of Large Macroaggregates Induces Soil Organic Carbon Sequestration in Short-Term Cropland Restoration in a Typical Karst Area. Sci. Total Environ. 2021, 801, 149588. [Google Scholar] [CrossRef]
Figure 1. Location of the study area and the distribution of sampling sites with different reclamation years.
Agronomy 14 00869 g001
Figure 2. Distribution of the soil carbon components (a), SOCPOM (b), SOCMAOM (c), SICPOM (d), and SICMAOM (e). Different lowercase letters of the same variable indicate significant differences at the level of p < 0.05. (SOCPOM, SOC in POM fraction; SOCMAOM, SOC in MAOM fraction; SICPOM, SIC in POM fraction; SICMAOM, SIC in MAOM fraction.)
Agronomy 14 00869 g002
Figure 3. Soil carbon components distribution in soil sampling positions with different reclamation years and soil depths. Different lowercase letters of the same variable indicate significant differences between the different slope sampling positions at the level of p < 0.05. (SOCPOM, SOC in POM fraction; SOCMAOM, SOC in MAOM fraction; SICPOM, SIC in POM fraction; SICMAOM, SIC in MAOM fraction.)
Agronomy 14 00869 g003
Figure 4. Relative proportions of the four specific functional groups in the POM and MAOM fractions with different reclamation years (a), soil depths (b), and soil sampling positions (c).
Agronomy 14 00869 g004
Figure 5. Relative effects of multiple environmental factors on SOCPOM (a,b), SOCMAOM (c,d), SICPOM (e,f), and SICMAOM (g,h). The averaged parameter estimates (standardized regression coefficients) of the model environmental factors are shown with their associated 95% confidence intervals (a,c,e,g) along with the relative importance of each environmental factor, expressed as the percentage of explained variance (b,d,f,h) for SOCPOM, SOCMAOM, SICPOM, and SICMAOM. The relative effect of the environmental factors is calculated as the ratio between the parameter estimate of the environmental factor and the sum of all parameter estimates, and it is expressed as a percentage. The vegetation status includes dry weight and coverage; soil nitrogen includes TN, N H 4 + -N, and SOCPOM, SOC in POM fraction; SOCMAOM, SOC in MAOM fraction; SICPOM, SIC in POM fraction; SICMAOM, SIC in MAOM fraction; N O 3 -N; soil phosphorus includes TP and AP; soil and water condition include SWC, pH, and EC. TN, soil total nitrogen; N H 4 + -N, soil soluble ammonium nitrogen; N O 3 -N, soil soluble nitrate nitrogen; TP, soil total phosphorus; AP, soil available phosphorus; SWC, soil water content; pH, soil pH; and EC, soil electrical conductivity. * p < 0.05.
Agronomy 14 00869 g005
Figure 6. Soil carbon stabilization process in saline–alkali ditches at different drainage stages after reclamation.
Agronomy 14 00869 g006
Table 3. The specific peak areas of four functional groups in POM and MAOM fractions by FTIR.
Reclamation Years
1st Year7th Year15th Year30th Year
POM
alcohol C–OH/C–NH6.4 ± 0.5 a6.0 ± 0.4 a5.8 ± 0.3 a6.6 ± 0.4 a
aliphatic C–H0.080 ± 0.02 b0.13 ± 0.02 ab0.14 ± 0.02 ab0.24 ± 0.04 a
aromatic C=C/C=N9.0 ± 3 a7.2 ± 2 ab1.8 ± 0.6 b6.3 ± 2 ab
polysaccharide C–O18 ± 5 a13 ± 2 a11 ± 1 a14 ± 1 a
MAOM
alcohol C–OH/C–NH6.7 ± 0.2 a6.5 ± 0.4 a5.0 ± 0.2 b6.8 ± 0.4 a
aliphatic C–H0.10 ± 0.01 b0.12 ± 0.01 ab0.15 ± 0.01 a0.20 ± 0.04 a
aromatic C=C/C=N9.4 ± 0.9 ab8.1 ± 0.7 ab6.7 ± 0.5 b11 ± 1 a
polysaccharide C–O15 ± 0.8 a14 ± 1 a13 ± 0.9 a17 ± 1 a
Values are mean ± standard error. Different lowercase letters of the same variable indicate significant differences at the level of p < 0.05.
Table 4. Soil hydrophobicity (W), hydrophobicity index (HI), and decomposition degree index (DDI) of POM and MAOM fractions.
Reclamation Years
1st Year7th Year15th Year30th Year
POM
W0.28 ± 0.03 a0.28 ± 0.02 ab0.22 ± 0.01 c0.28 ± 0.02 ab
HI0.020 ± 0.01 a0.020 ± 0.01 ab0.13 ± 0.02 ab0.010 ± 0 b
DDI3.9 ± 0.3 a3.8 ± 0.2 a4.7 ± 0.2 a3.9 ± 0.3 a
MAOM
W0.23 ± 0.02 a0.21 ± 0.01 a0.16 ± 0.01 b0.22 ± 0.01 a
HI0.030 ± 0.01 a0.010 ± 0 a0.050 ± 0.01 a0.020 ± 0.01 a
DDI4.7 ± 0.3 b4.9 ± 0.2 b6.2 ± 0.2 a4.7 ± 0.2 b
Values are mean ± standard error. Different lowercase letters of the same variable indicate significant differences at the level of p < 0.05.
Disclaimer/Publisher’s Note: The statements, opinions and data contained in all publications are solely those of the individual author(s) and contributor(s) and not of MDPI and/or the editor(s). MDPI and/or the editor(s) disclaim responsibility for any injury to people or property resulting from any ideas, methods, instructions or products referred to in the content.

