Abstract
The phytochrome-interacting factor (PIF) proteins are part of a subfamily of basic helix–loop–helix (bHLH) transcription factors that integrate with phytochromes (PHYs) and are known to play important roles in adaptive changes in plant architecture. However, the characterization and function of PIFs in potatoes are currently poorly understood. In this study, we identified seven PIF members in potatoes and named them StPIF01-1, StPIF01-2, StPIF03, StPIF06-1, StPIF06-2, StPIF07, and StPIF09 based on their location in potato chromosomes. The chromosomal location, gene structures, physicochemical characteristics, phylogenetic tree, and tissue-specific expression of StPIFs were also analyzed. RT-qPCR analysis revealed that the StPIF3 gene was highly induced by shade and may play a crucial regulatory role in potato responses to shade stress. Also, multiple cis-regulatory elements involved in light response were detected in the promoter of the StPIF genes. Subcellular localization analysis indicated that the StPIF3-encoding protein is mainly localized in the nucleus. Transgenic overexpression of StPIF3 in potatoes increased stem length, chlorophyll accumulation, and enhanced shade-avoidance symptoms, whereas the StPIF3-interfering lines had a lower plant height and more chlorophyll accumulation. These findings enhance our comprehension of StPIF gene roles, potentially advancing potato yield and quality research. This study provides detailed information about StPIFs and identifies the function of StPIF3, which is involved in shade-avoidance syndrome.
1. Introduction
Light is one of the most important environmental factors for supporting plant life and not only provides energy for plant photosynthesis but also a critical environmental signal to modulate plant growth and development [1]. Plants have developed a refined control system that responds to environmental stimuli by sensing changes in the light environment [2]. Photoreceptors have been discovered that play a crucial role in external light signal reception in plants, including phytochromes (PHYs), cryptochromes (CRYs), the UV-B photoreceptor (UVR8), and phototropin [3]. Among these photoreceptors, the PHYs are involved in a series of downstream physiological and biochemical processes in plants, such as plant morphogenesis, abiotic stress, and defense responses [4,5,6]. The PHY proteins can bind the bilin of a chromophore, which absorbs light and triggers protein conformational changes that incur the first step of signal transduction [5]. However, PHY proteins interact with multiple partners to modulate the transcription of downstream target genes to control the light-regulated modulation of plant growth and development [6]. The phytochrome-interacting factor (PIF) family is one of the key interacting partners and acts as a key regulator of the transition from skotomorphogenesis to photomorphogenesis [7].
PIF proteins are encoded by a subfamily of bHLH transcription factors with two conserved domains, bHLH and APB (active phyB-binding) [8], that are widely distributed from bryophytes to higher plants and have been identified from bryophytes to angiosperms, such as Arabidopsis (Arabidopsis thaliana, eight members) [9], rice (Oryza sativa, six members) [10], maize (Zea mays, eight members) [11], tomatoes (Solanum lycopersicum, eight members) [12], apples (Malus domestica, eight members) [13], grapes (Vitis vinifera, four members) [14], Brachypodium distachyon (eight members) [15], Marchantia polymorpha (one member) [16], and Physcomitrella patens (six members) [17]. Previous studies have demonstrated that PIFs are diffusely involved in many processes of plant development and growth, such as seed germination, embryo shaft elongation, chlorophyll biosynthesis, shade-avoidance responses, circadian clock, and so on [18].
PIF proteins can bind to the G-box core motif (CACGTG) to enhance or inhibit the expression of downstream genes [9]. The primary function of PIFs has been demonstrated to be an attenuator within the phototransduction cascade that can suppress photomorphogenesis and facilitate skotomorphogenesis under dark conditions. In Arabidopsis, PIFs promote skotomorphogenesis mainly by enhancing hypocotyl elongation; for example, AtPIL5 impedes seed germination, and inhibits hypocotyl negative geotropism and hypocotyl elongation [19]. The ETHYLENE-INSENSI-TIVE 3 (EIN3) activation of AtPIF3 is essential for ethylene-mediated hypocotyl growth. AtPIF4 has been found to regulate stomatal development, chlorophyll degradation, and leaf senescence in the absence of light and can enhance the cold resistance of the plant [19]. AtPIF5 inhibits red-light-induced anthocyanin production in Arabidopsis seedlings [19]. AtPIF6 is strongly induced during seed development, which exists in two splice variants, including an alpha form and a beta form. Elevated AtPIF6 expression diminishes seed dormancy, while the suppression of AtPIF6 enhances it [20]. PHYB, as the primary shade detector, indirectly modulates growth through the dephosphorylation of PIF7 in shaded conditions, leading to an upregulation of auxin biosynthetic genes [9].
The potato (Solanum tuberosum L.), ranking fourth globally after rice, maize, and wheat, is pivotal to the agricultural economy [21]. However, the PIF family in the potato has not been well characterized, especially the functions of StPIFs, which are still unclear. In our study, a global analysis of the PIF gene family in potatoes was carried out, and seven StPIFs were identified. The chromosomal location, gene structures, physicochemical characteristics, phylogenetic tree, and tissue-specific expression patterns of StPIFs were also analyzed. Furthermore, we found that StPIF3 plays a crucial regulatory role in potato responses to shade. The overexpression of StPIF3 in potatoes increased stem length and chlorophyll accumulation and enhanced shade-avoidance symptoms. Consequently, this study provides detailed information about StPIFs and identifies the function of StPIF3, which is involved in shade-avoidance syndrome in potatoes.
2. Materials and Methods
2.1. Plant Materials and Processing Method
The potato cultivar “Atlantic” was used as the experimental material in our research. Potatoes were planted in test tubes under the following conditions: 22 ± 2 °C; 16 h light/8 h dark; humidity at 80%. Then, 20-day-old test-tube plants were randomly divided into control and treatment groups, treatment groups were subjected to shaded treatment by controlling the light intensity at 3500 Lx, and control groups were grown as usual (20,000 Lx). All the materials were separately harvested, immediately frozen in liquid nitrogen, and then stored at a −80 °C refrigerator for later use.
2.2. Genome-Wide Identification and Annotation of Potato PIF Genes
To identify the PIF family members in potatoes, we downloaded all protein sequences of AtPIF from the Arabidopsis Information Resource (TAIR) Database; all the downloaded sequences were used to search against Spud DB Potato Genomics Resources [22]. The INTERPRO [23] and SMART databases were used to further verify the candidates on the basis of integrity and the existence of the conserved domains of bHLH and APB [23]. The ExPASy database was used to calculate the isoelectric points (pIs) and molecular weights (MWs) of the proteins of all the StPIFs.
2.3. Bioinformatics Analysis of StPIF Genes
The plant-mPLoc website was used to analyze the subcellular localization of StPIFs. We exploited GSDS to identify the number and location of the introns and exons of StPIF genes by blasting the CDS and genomic sequences of the StPIF genes. Chromosome localization of the StPIFs was achieved with TBtools (v2. 034). MEGA7 was used for multiple sequence alignment analysis, and the bootstrap test had 1000 replicates. We downloaded all protein sequences for PIFs from rice, tomato, and Arabidopsis thaliana genomic databases to construct the phylogenetic analysis. The MEME (v5. 5. 5) website was used to analyze conserved motifs; we set the motif number as 10 and chose motifs with E-values ≤ 1 × 10⁻³⁰. In order to reveal the potential regulatory patterns of StPIFs, PlantCare and TBtools were used to analyze the cis-acting elements in the promoter regions of the StPIF genes.
2.4. Gene Expression Analysis of StPIFs
Total RNA was extracted from the potato leaves using the CTAB method [24] and was then used for reverse transcription using kits offered by TaKaRa (Takara Biomedical Technology, Beijing, China). Quantitative real-time PCR (RT-PCR) was performed with the CFX96 Real-Time PCR Detection system (Roche, Switzerland). Each qPCR reaction was established with three technical replicates. The 2−∆∆Ct method was used to calculate the expression levels of the StPIFs [25]. The EF1α gene served as an internal control.
2.5. Tissue-Specific Analysis of Expression Levels
For inquiry on the expression patterns of the StPIFs in different organs and tissues of potatoes, we downloaded the RNA sequencing data of the StPIFs from the PGSC database [26], which were DM (double monoploid S. tuberosum group phureja DM-13). Tbtools was adopted to visualize the analysis of RNA-seq expression.
2.6. Subcellular Localization of StPIF3
To investigate the subcellular localization of the StPIF3 protein, the ORF sequences of the StPIF3 gene were cloned into the pCAMBIA1300-35S-EGFP vector, and we constructed the fusion expression vector of pCAMBIA1300-EGFP-StPIF3. The primers were as follows: 5′-AGAACACGGGGGACGAGCTCATGCCTCTCTCTGAGTTCG-3′ (SacI site in bold); 5′-TGCTCACCATGTCGACGTTGGTCAACCTATTCGCC-3′ (SalI site in bold). These were then transformed into Agrobacterium tumefaciens GV3101. Nicotiana benthamiana foliage was infiltrated with StPIF3 GFP vectors. After two days of treatment in darkness, GFP fluorescence signals were visualized with a laser scanning confocal microscope (Leica, Weztlar, Germany).
2.7. Plasmid Construction and Generation of the Solanum tuberosum Transgenic Plant
We amplified the full-length sequence of StPIF3 from potatoes with the primes 5′-AGAACACGGGGGACGAGCTCATGCCTCTCTCTGAGTTCTG-3′ (SacI site in bold) and 5′-TGCTCACCATGTCGACTCAGTTGGTCAACCTATTCGCG-3′ (SalI site in bold); then, the amplified fragment was cloned into the pCAMBIA1300-35S-EGFP vector, and we constructed the overexpression vector of StPIF3. The interference vector of StPIF3 was constructed with artificial miRNA technology according to a previously published method [27]. The recombinant construct was transformed into Agrobacterium tumefaciens strain GV3101. Sterile microtubes were employed for Agrobacterium-mediated potato transformation to generate potato transgenic plants following the method described by Si et al. [28]. The regenerated plantlets were selected from hygromycin-resistant genes and confirmed by genomic PCR analysis.
2.8. Shade-Avoidance Syndrome Analysis of Transgenic Potato Plants
Plant height and chlorophyll accumulation are typical syndromes under shade-avoidance responses. In order to understand the function of StPIF3 in potato shade-avoidance responses, we measured the plant height and chlorophyll content of the transgenic plants. Thus, 25-day-old both wild-type and transgenic plants were used for shade-avoidance syndrome analysis. The chlorophyll content (Chl) analysis was performed according to the TYS-B live chlorophyll meter (Jisenpuer, Zhejiang, China) and the fully expanded leaves of the upper, middle, and lower parts of each plant were measured. The plant height assays of the wild-type and transgenic plants were performed after seven days of shade treatment.
3. Results
3.1. Identification of Potato PIFs
In this study, a total of seven candidate StPIFs were finally identified in potatoes and named PIF01-1, PIF01-2, PIF03, PIF06-1, PIF06-2, PIF07, and PIF09 based on their locations on chromosomes; each of their encoded proteins contain bHLH and APB domains, while StPIF06-2 and, StPIF01-2 have APA domains. The CDS sequence of seven StPIF genes varying from 1254 to 2151 bp in length, encodes proteins varying from 417 to 716 amino acids in length; the theoretical isoelectric point (pI) value ranges from 5.15 to 8.71, and the molecular weight ranges from 41,285.79 to 76,772.66 Da. Detailed information on gene IDs, subfamilies, CDS length, protein length, molecular weight, theoretical pI, and domain regions are summarized in Table 1.

Table 1.
Characteristics of phytochrome-interacting factor (PIF) genes in the potato.
3.2. Subcellular Localization, Chromosome Localization, and Gene Structure Analysis of Potato PIFs
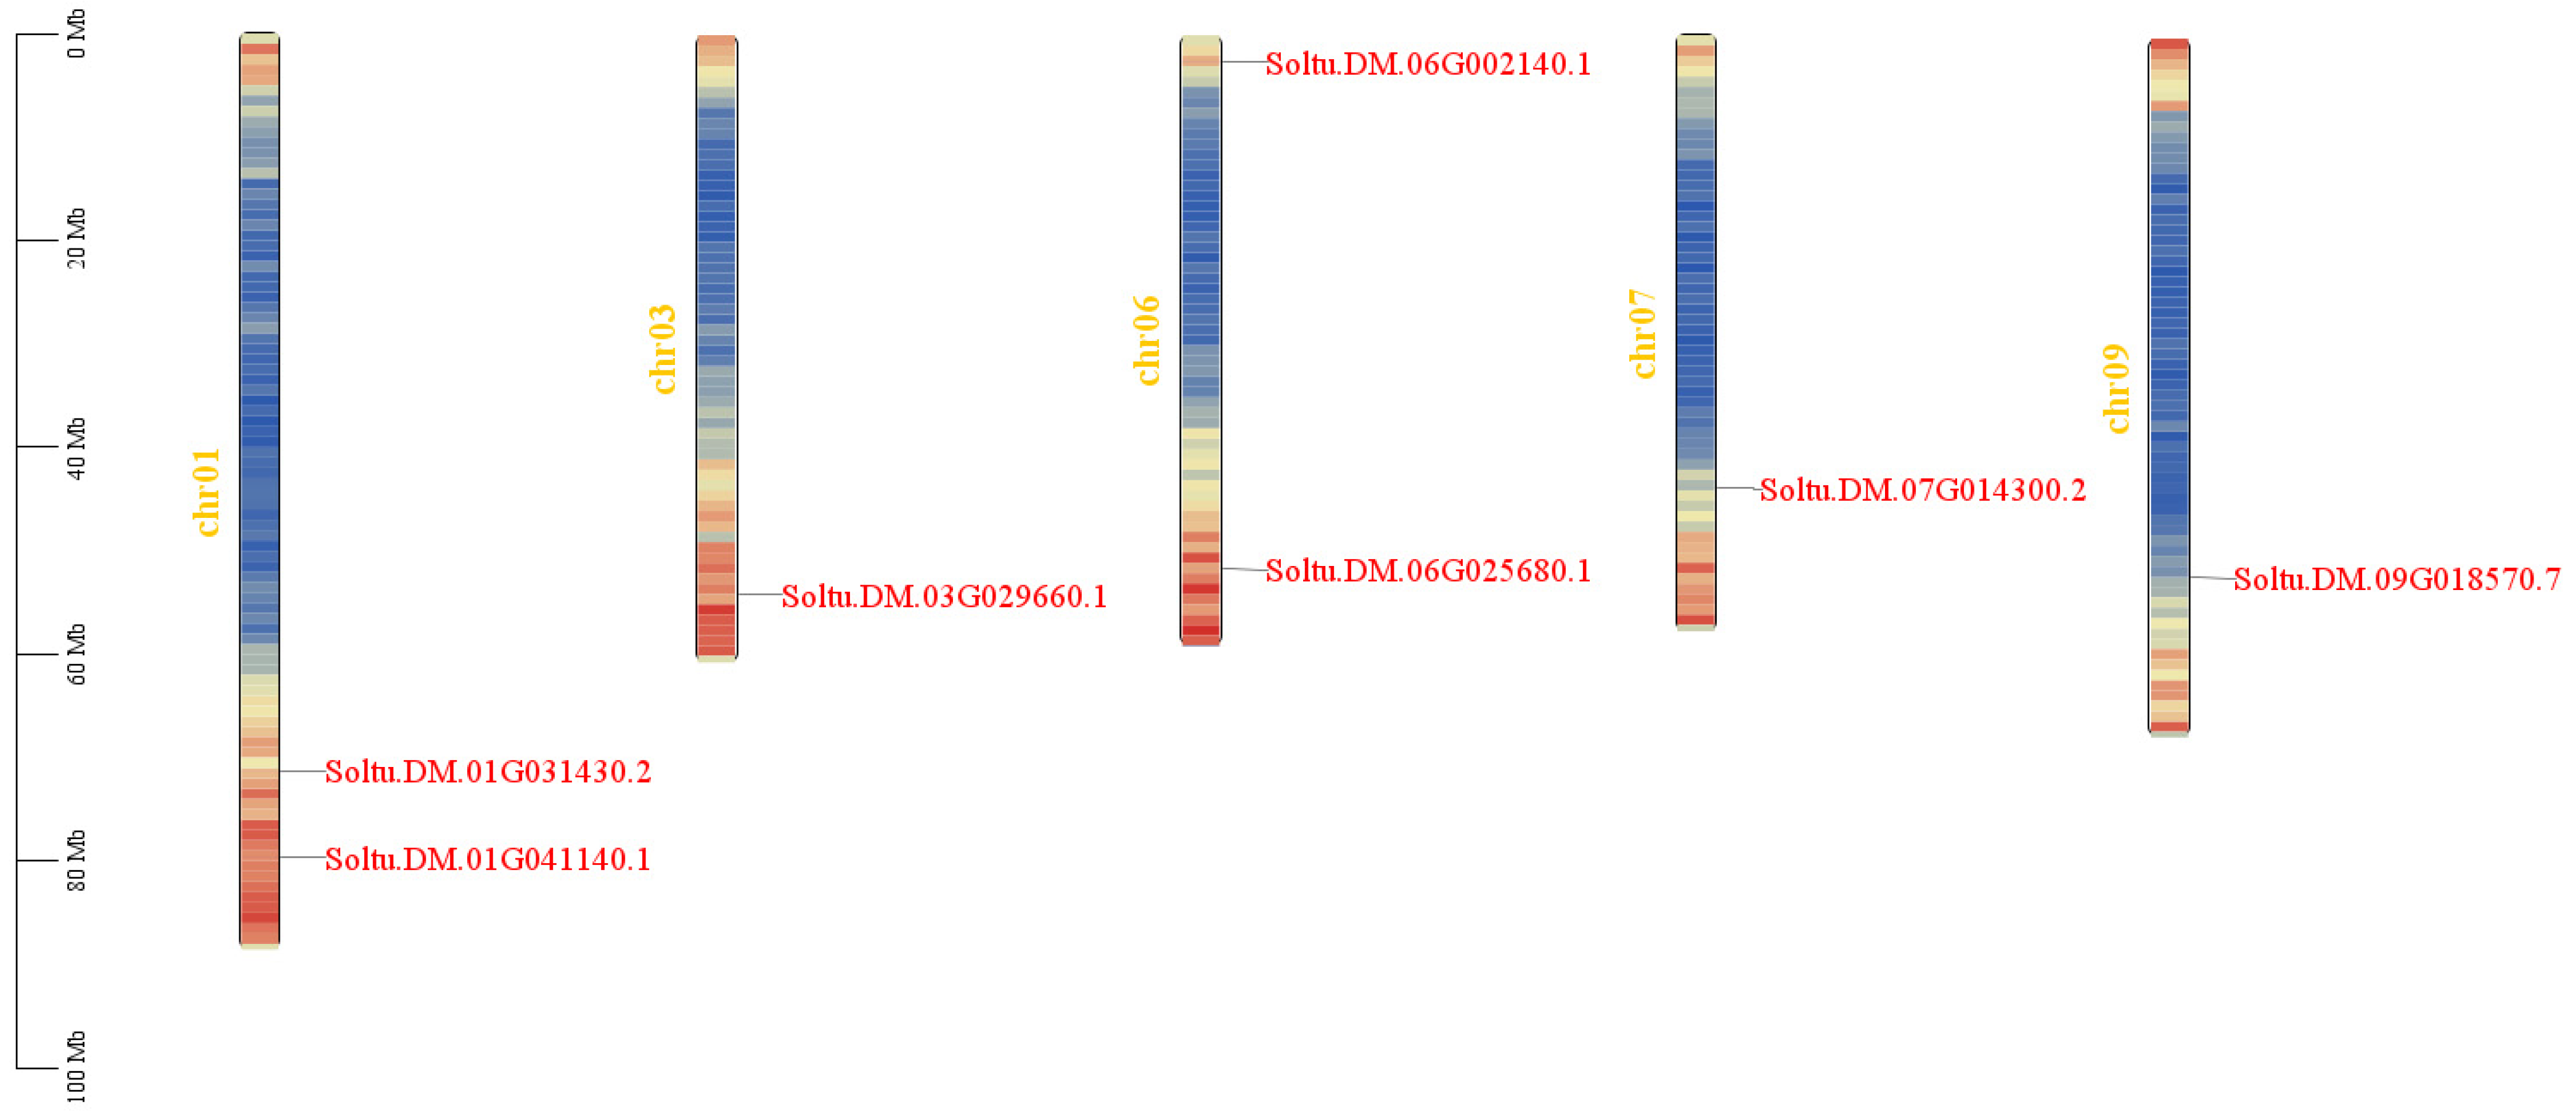
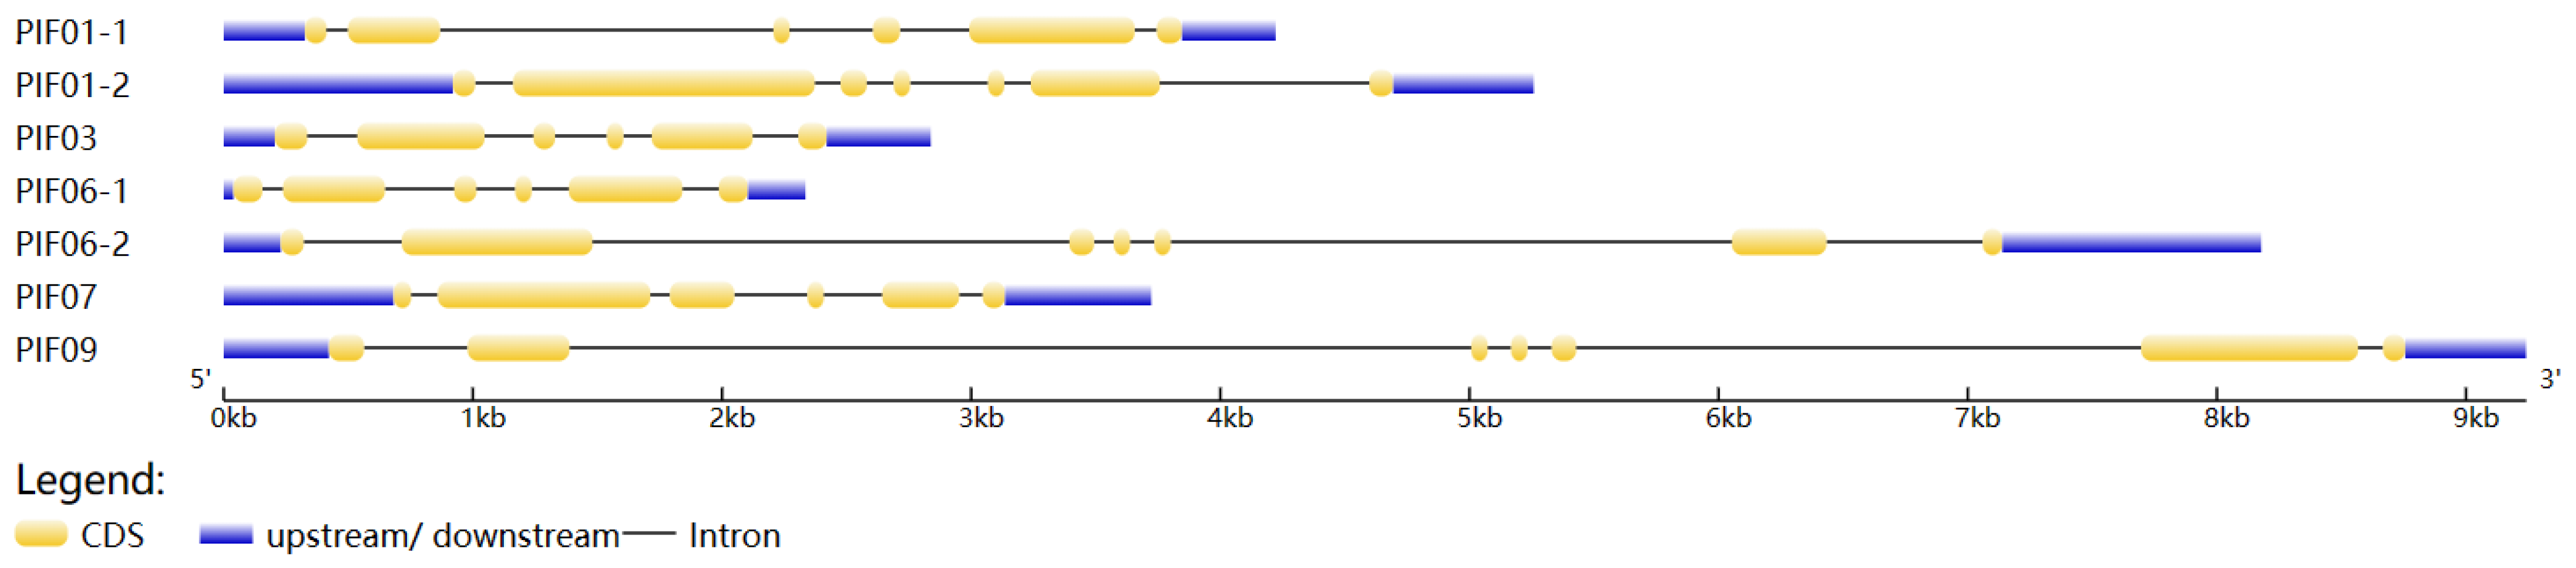
The results of subcellular localization prediction showed that seven StPIF genes were located in the nucleus, indicating that they were typical transcription factors and could regulate the expression of downstream genes. Seven StPIFs were mapped into five chromosomes of the potato (Chr 1, Chr3, Chr6, Chr7, and Chr9) (Figure 1). Gene structure analysis showed that all seven StPIF genes had intron and exon structures; PIF01-2, PIF06-2, and PIF09 had six introns; and the rest had five introns (Figure 2).
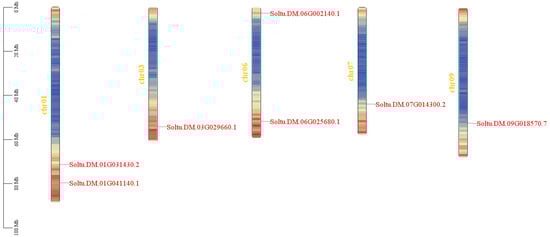
Figure 1.
Chromosome localization analysis of StPIFs. The different colors represent the density information of the genes, red represents higher gene density, blue is the opposite.
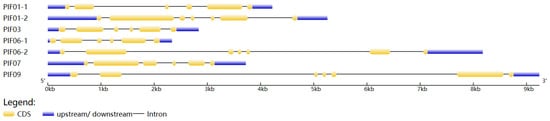
Figure 2.
Gene structure characteristics of StPIFs. The blue and yellow boxes represent UTR and CDS, and the black lines represent introns.
3.3. Multiple Sequence Alignment and Phylogenetic Analysis
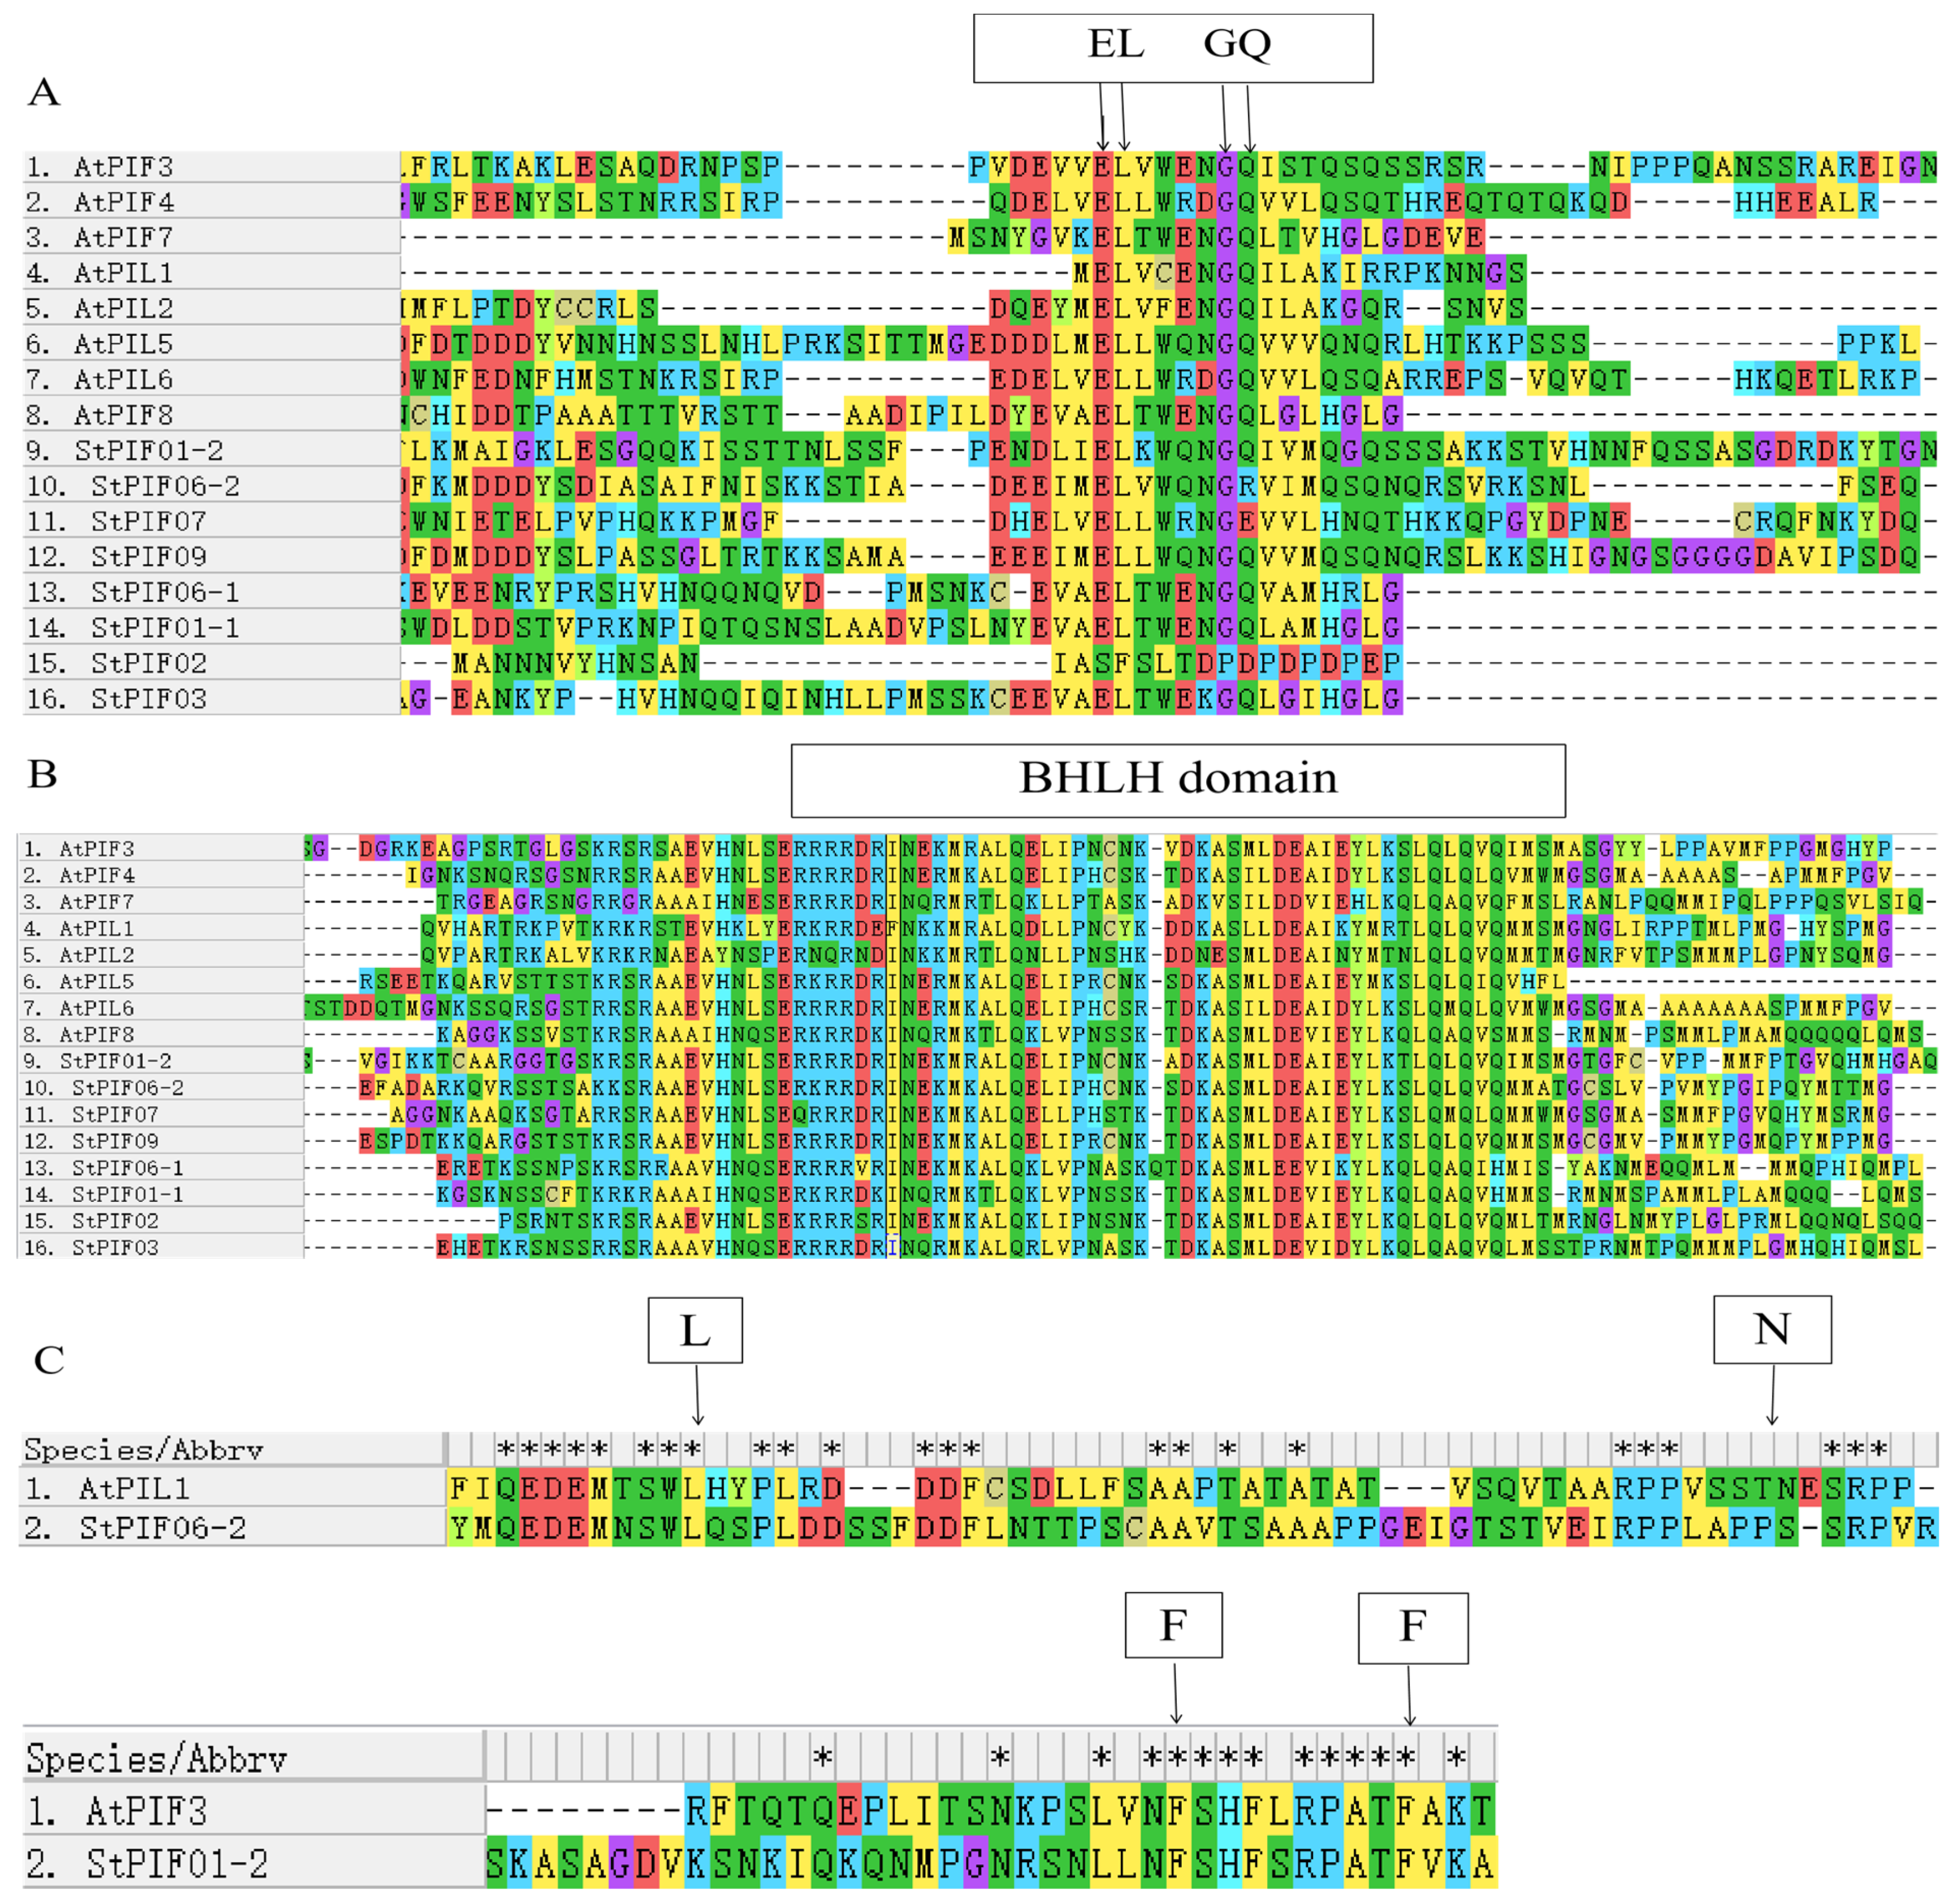
The bHLH and APB domains were universally identified across all AtPIF proteins, showcasing their highly conservative. The same results were obtained for seven StPIF proteins, and StPIF02 was removed due to a lack of an APB domain [29]. Our study employed phylogenetic analysis utilizing an unrooted tree with 1000 bootstrap replicates of full-length amino acid sequences to analyze the evolutionary trajectories of potato PIF proteins alongside those from diverse plant species (Figure 3). Our phylogenetic investigation revealed six distinct clades, with StPIFs predominantly pairing with their orthologous counterparts within subgroups in Solanum lycopersicum or Arabidopsis thaliana. For example, StPIF01-2 shared high homology with SlPIF3. StPIF01-1 clustered with SlPIF8a. StPIF07 showed a close relationship with SlPIF4. According to Figure 4, StPIFs are more closely related to SlPIFs than OsPIFs and AtPIFs.
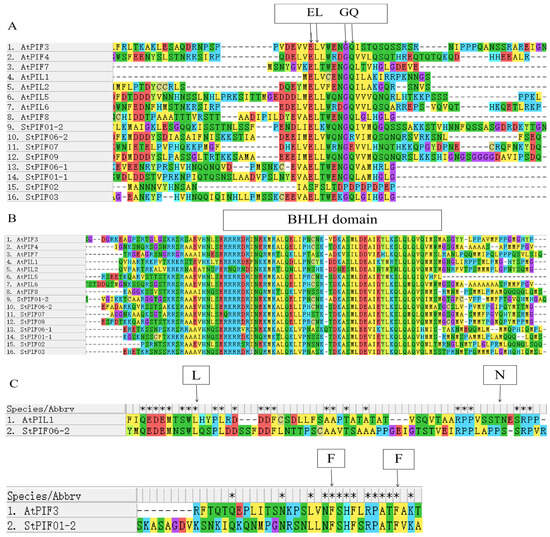
Figure 3.
The multiple alignment of deduced amino acid sequences of StPIFs. (A) Comparison of active PHYB binding (APB). (B) Comparison of BHLH binding. (C) Comparison of active PHYA binding (APA). * represents identical amino acid residue. EL, GQ represent conserved amino acid residues in the APB domain. L, N represent conserved amino acid residues of the APA domain in PIF1. F, F represent conserved amino acid residues of the APA domain in PIF3.
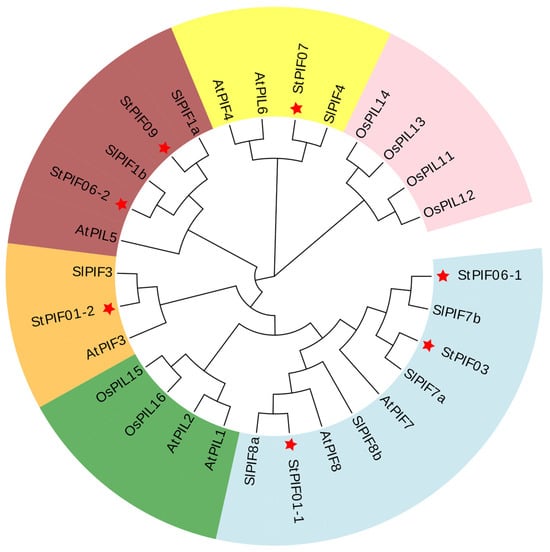
Figure 4.
Unrooted phylogenetic tree of PIF proteins from Solanum tuberosum L., Solanum lycopersicum, Arabidopsis thaliana, and Oryza sativa. Each color represents one group. The red stars represent the highlighting of the StPIFs.
3.4. Conserved Motif and Cis-Acting Element Analysis of PIF Family
To investigate the structural diversity of StPIF-encoded proteins, we detected the motif compositions of these StPIFs. A total of 10 motifs were found among the StPIF gene family (Figure 5), named Motifs 1 to 10. In detail, Motif 1 and Motif 2 existed in all StPIF-encoded proteins and were inferred from the nucleotide composition of the bHLH domain. All StPIFs had Motif 3 (the APB domain). Moreover, StPIF06-2 and StPIF09 had the same kinds of motifs and were on a branch of the phylogenetic tree. StPIF06-1 and PIF03 had the same condition.
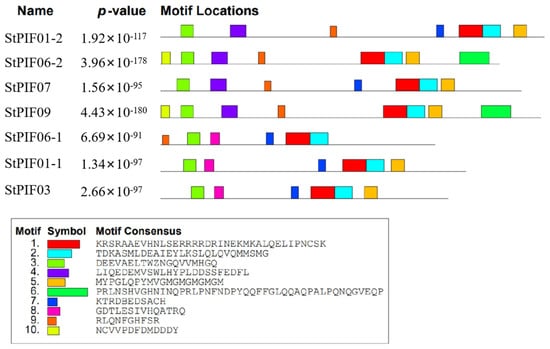
Figure 5.
Conserved motifs of PIF genes in potatoes. The MEME software (V5. 5. 4) facilitated the prediction of conserved motifs, with motif quantity fixed at ten. One color box corresponds to one motif.
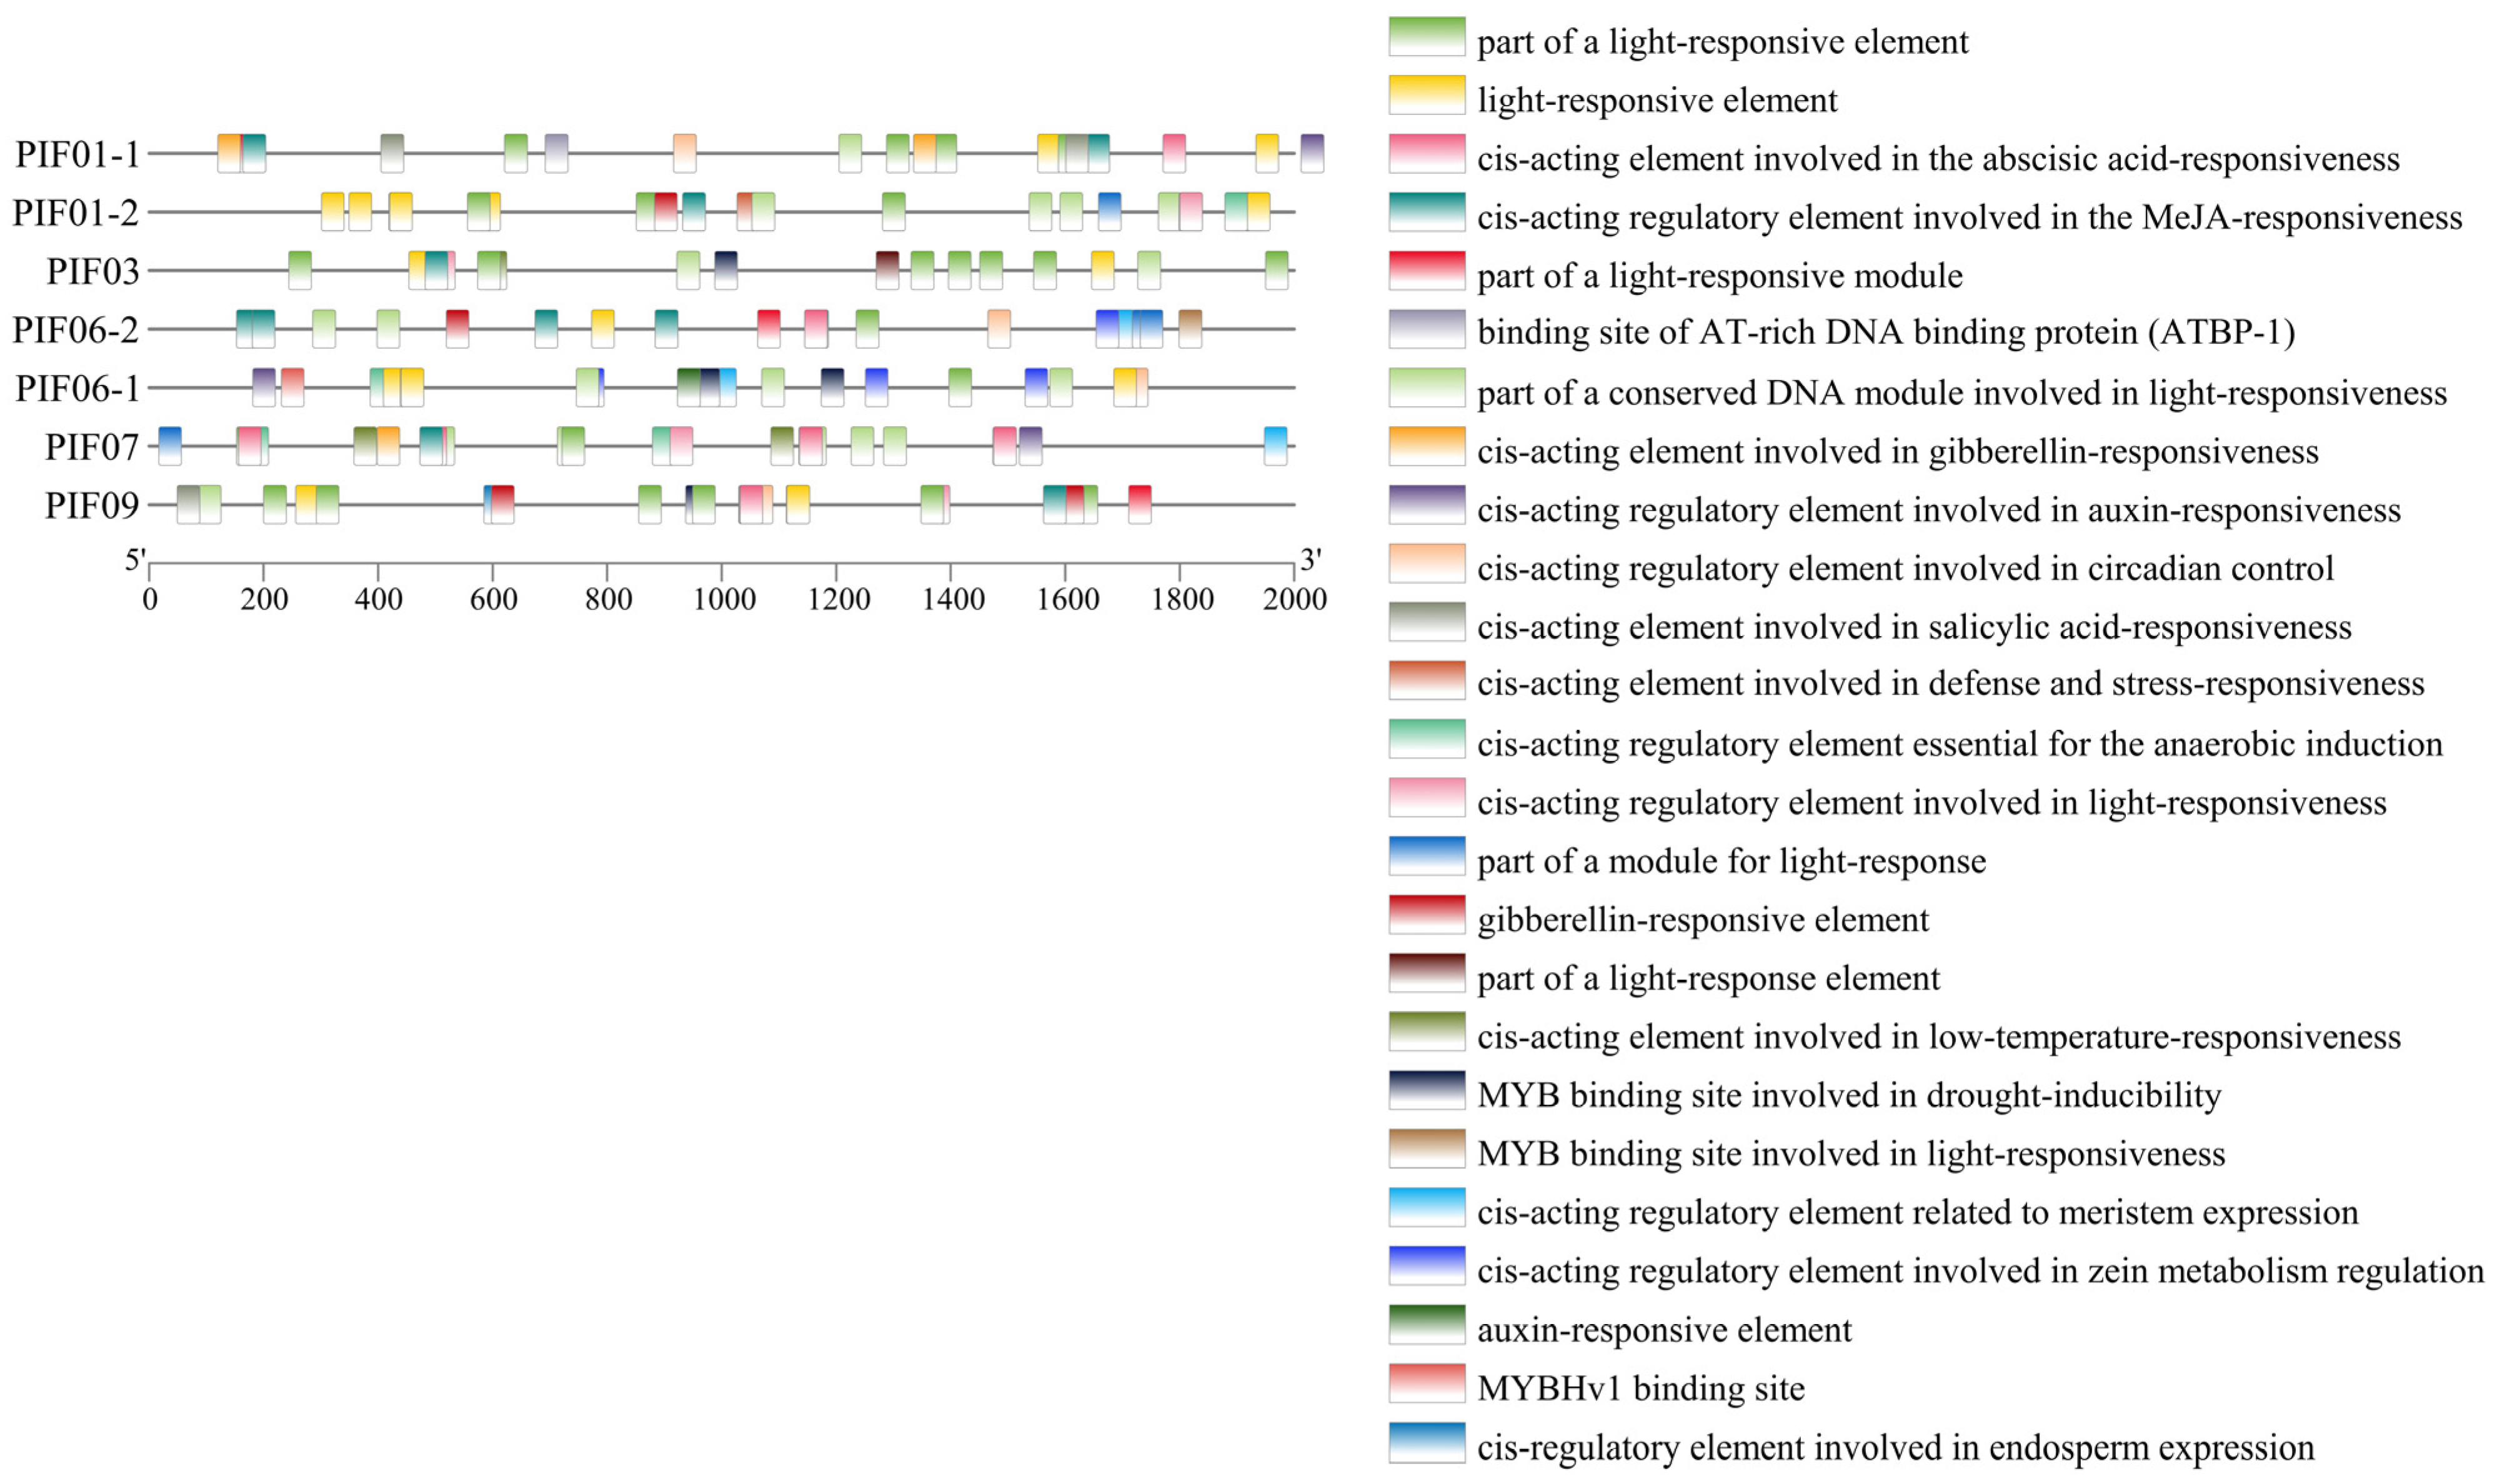
We analyzed the cis-elements of PIF genes to clarify the gene function and transcriptional regulation mechanism. All StPIFs had TATA-box and CAAT-box. The predicted cis-elements could be divided into three classes; these are the cis-elements related to photoreaction, phytohormones, and adverse environmental conditions. The cis-elements related to photoreaction (GT1-motif, GA-motif, TCT-motif, Box 4, AE-box, GATA-motif, ACE, I-box, AT1-motif, Sp1, G-box, TCCC-motif, and CAG-motif) were more abundant than the remaining two classes and varied from three to nine. The cis-elements related to phytohormones included cis-acting elements involved in abscisic acid, jasmonic acid, gibberellin, salicylic acid, and the auxin response. StPIF03 and StPIF07 had low-temperature stress responsiveness (LTR) elements. Drought-inducibility (MBS)-related elements were found in the promoters of StPIF03, StPIF06-1, and StPIF09. Circadian control (circadian: CANNNNATC) elements were detected in the promoters of StPIF01-1, StPIF06-1, and StPIF09. StPIF01-1 had a heat stress responsiveness element (an AT-rich element). Anaerobic induction (ARE)-related elements were detected in the promoters of StPIF01-2, StPIF06-1, and StPIF07; the promoters of StPIF06-2, StPIF06-1, and StPIF07 had cis-acting regulatory elements of meristem expression (CAT-box). The cis-acting elements related to zein metabolism were detected in the promoters of StPIF06-2 and StPIF06-1. The promoters of StPIF06-1 had the MYBHv1 (CCAAT-box) cis-acting element. Additionally, cis-acting elements involved in defense and stress responsiveness (TC-rich repeats) were also found in the promoters of StPIF01-2; StPIF09 had the cis-acting elements of seed-specific expression (GCN4-motif), and the MYB binding site involved in light responsiveness (MRE) was found in the promoters of StPIF06-2 (Figure 6). These results indicated that StPIFs play diverse roles in regulating polymorphism, hormone metabolism, and responses to various stresses.
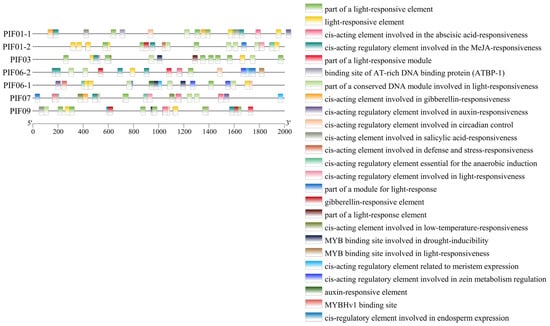
Figure 6.
The cis-elements in the promoters of potato PIF genes. The PlantCare website was used to analyze and present the results with TBtools. The 2000 bp upstream of the StPIFs was used to perform cis-elements analysis.
3.5. QRT-PCR Analysis of StPIF Genes under Shaded Stress
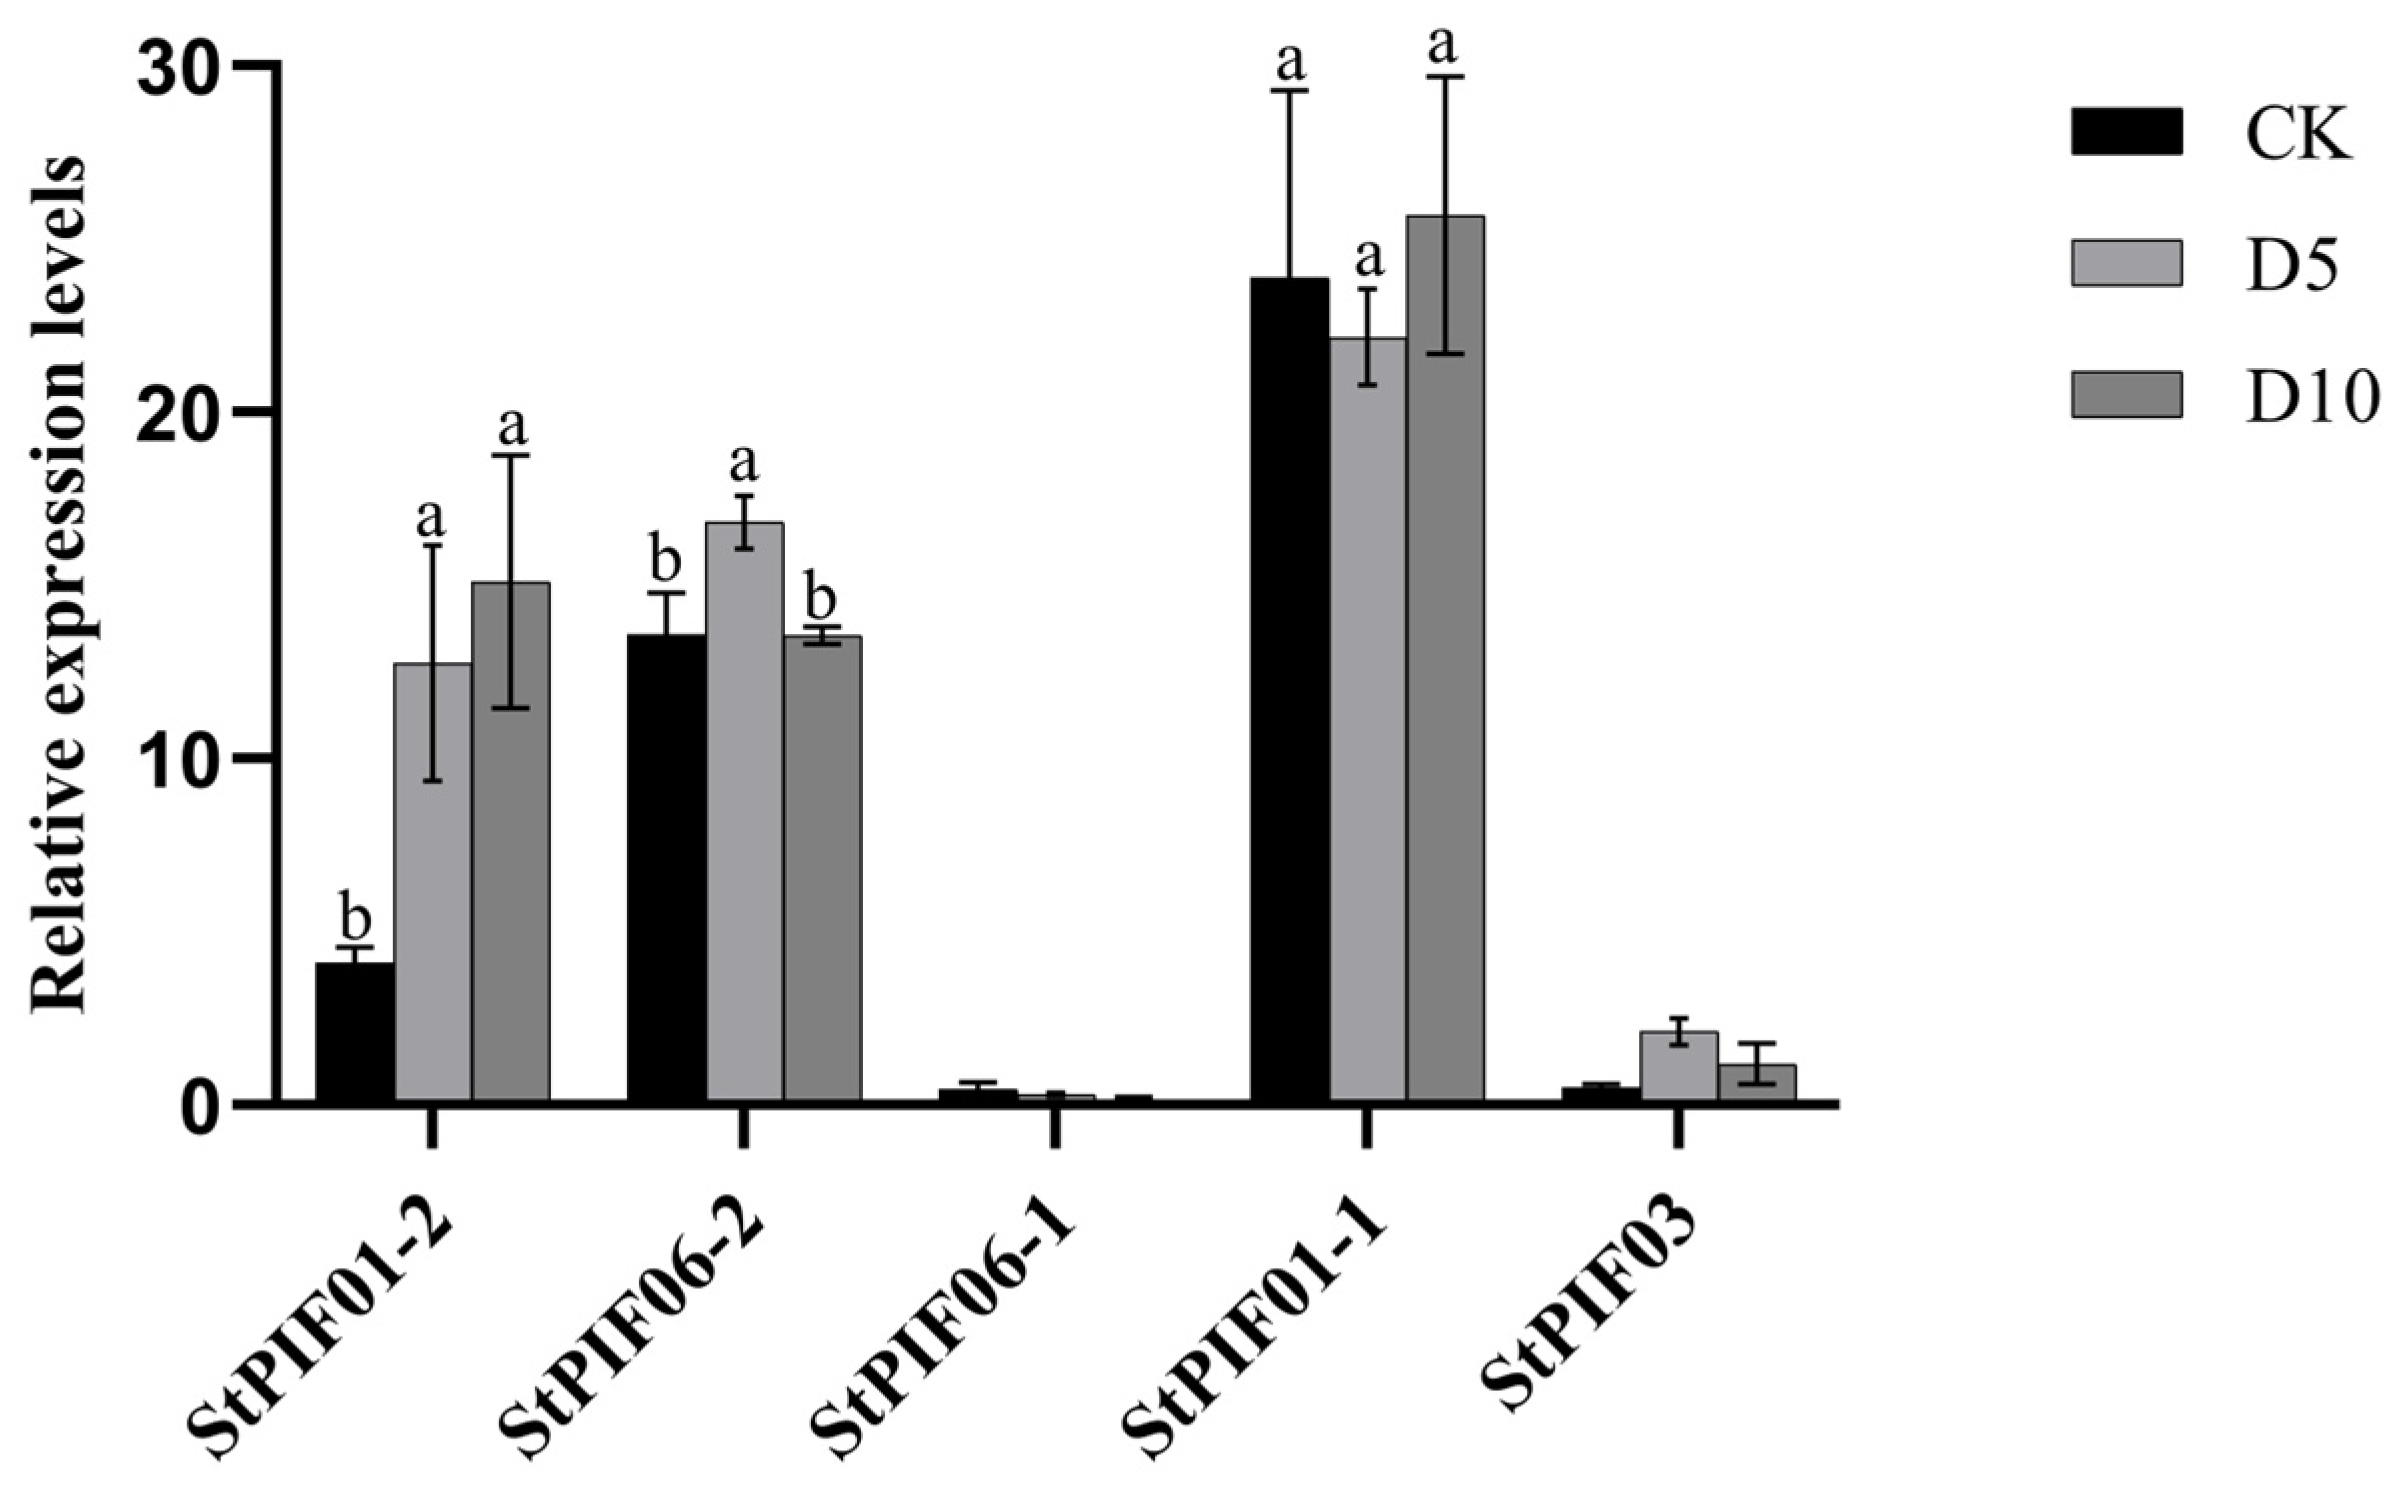
By combining cis-acting element analysis and previous report results, we found that the PIF gene family is involved in shade-avoidance responses and regulates multiple shade-avoidance syndromes. To investigate the expression pattern of the seven StPIF genes under shading conditions, the expression levels of these StPIFs under shade were analyzed by RT-qPCR (Figure 7). The results showed that the expression level of StPIF01-2 was obviously increased after shade treatment; the expression level of StPIF06-1 was decreased after shade treatment; the expression levels of StPIF06-2 and StPIF03 were increased after 5 days of shade treatment and decreased after 10 days of shade treatment; the expression level of StPIF01-1 was decreased after 5 days of shade treatment and increased after 10 days of shade treatment; and the expression of StPIF07 was not detected in this experiment. Based on the results above, the expression level of StPIF01-2 was found to be significantly induced under shade conditions, and it was renamed StPIF3 for future functional identification.
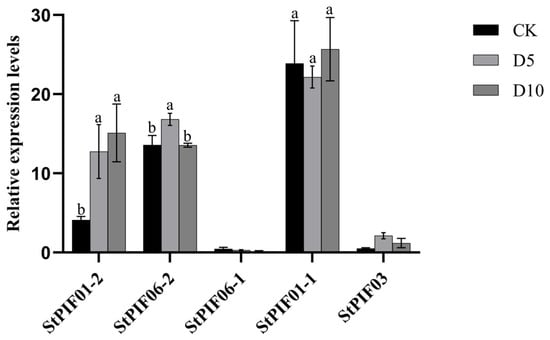
Figure 7.
Relative expression of StPIF genes under shade. Black squares represent the control group. Gray squares represent the shading treatment on the fifth day. Dark gray squares represent the shading treatment on the tenth day. Significant differences are shown using different alphabets when assessed using Duncan’s multiple range test (p < 0.05, n = 3).
3.6. Tissue-Specific Analysis of Expression Levels of StPIFs in Potatoes
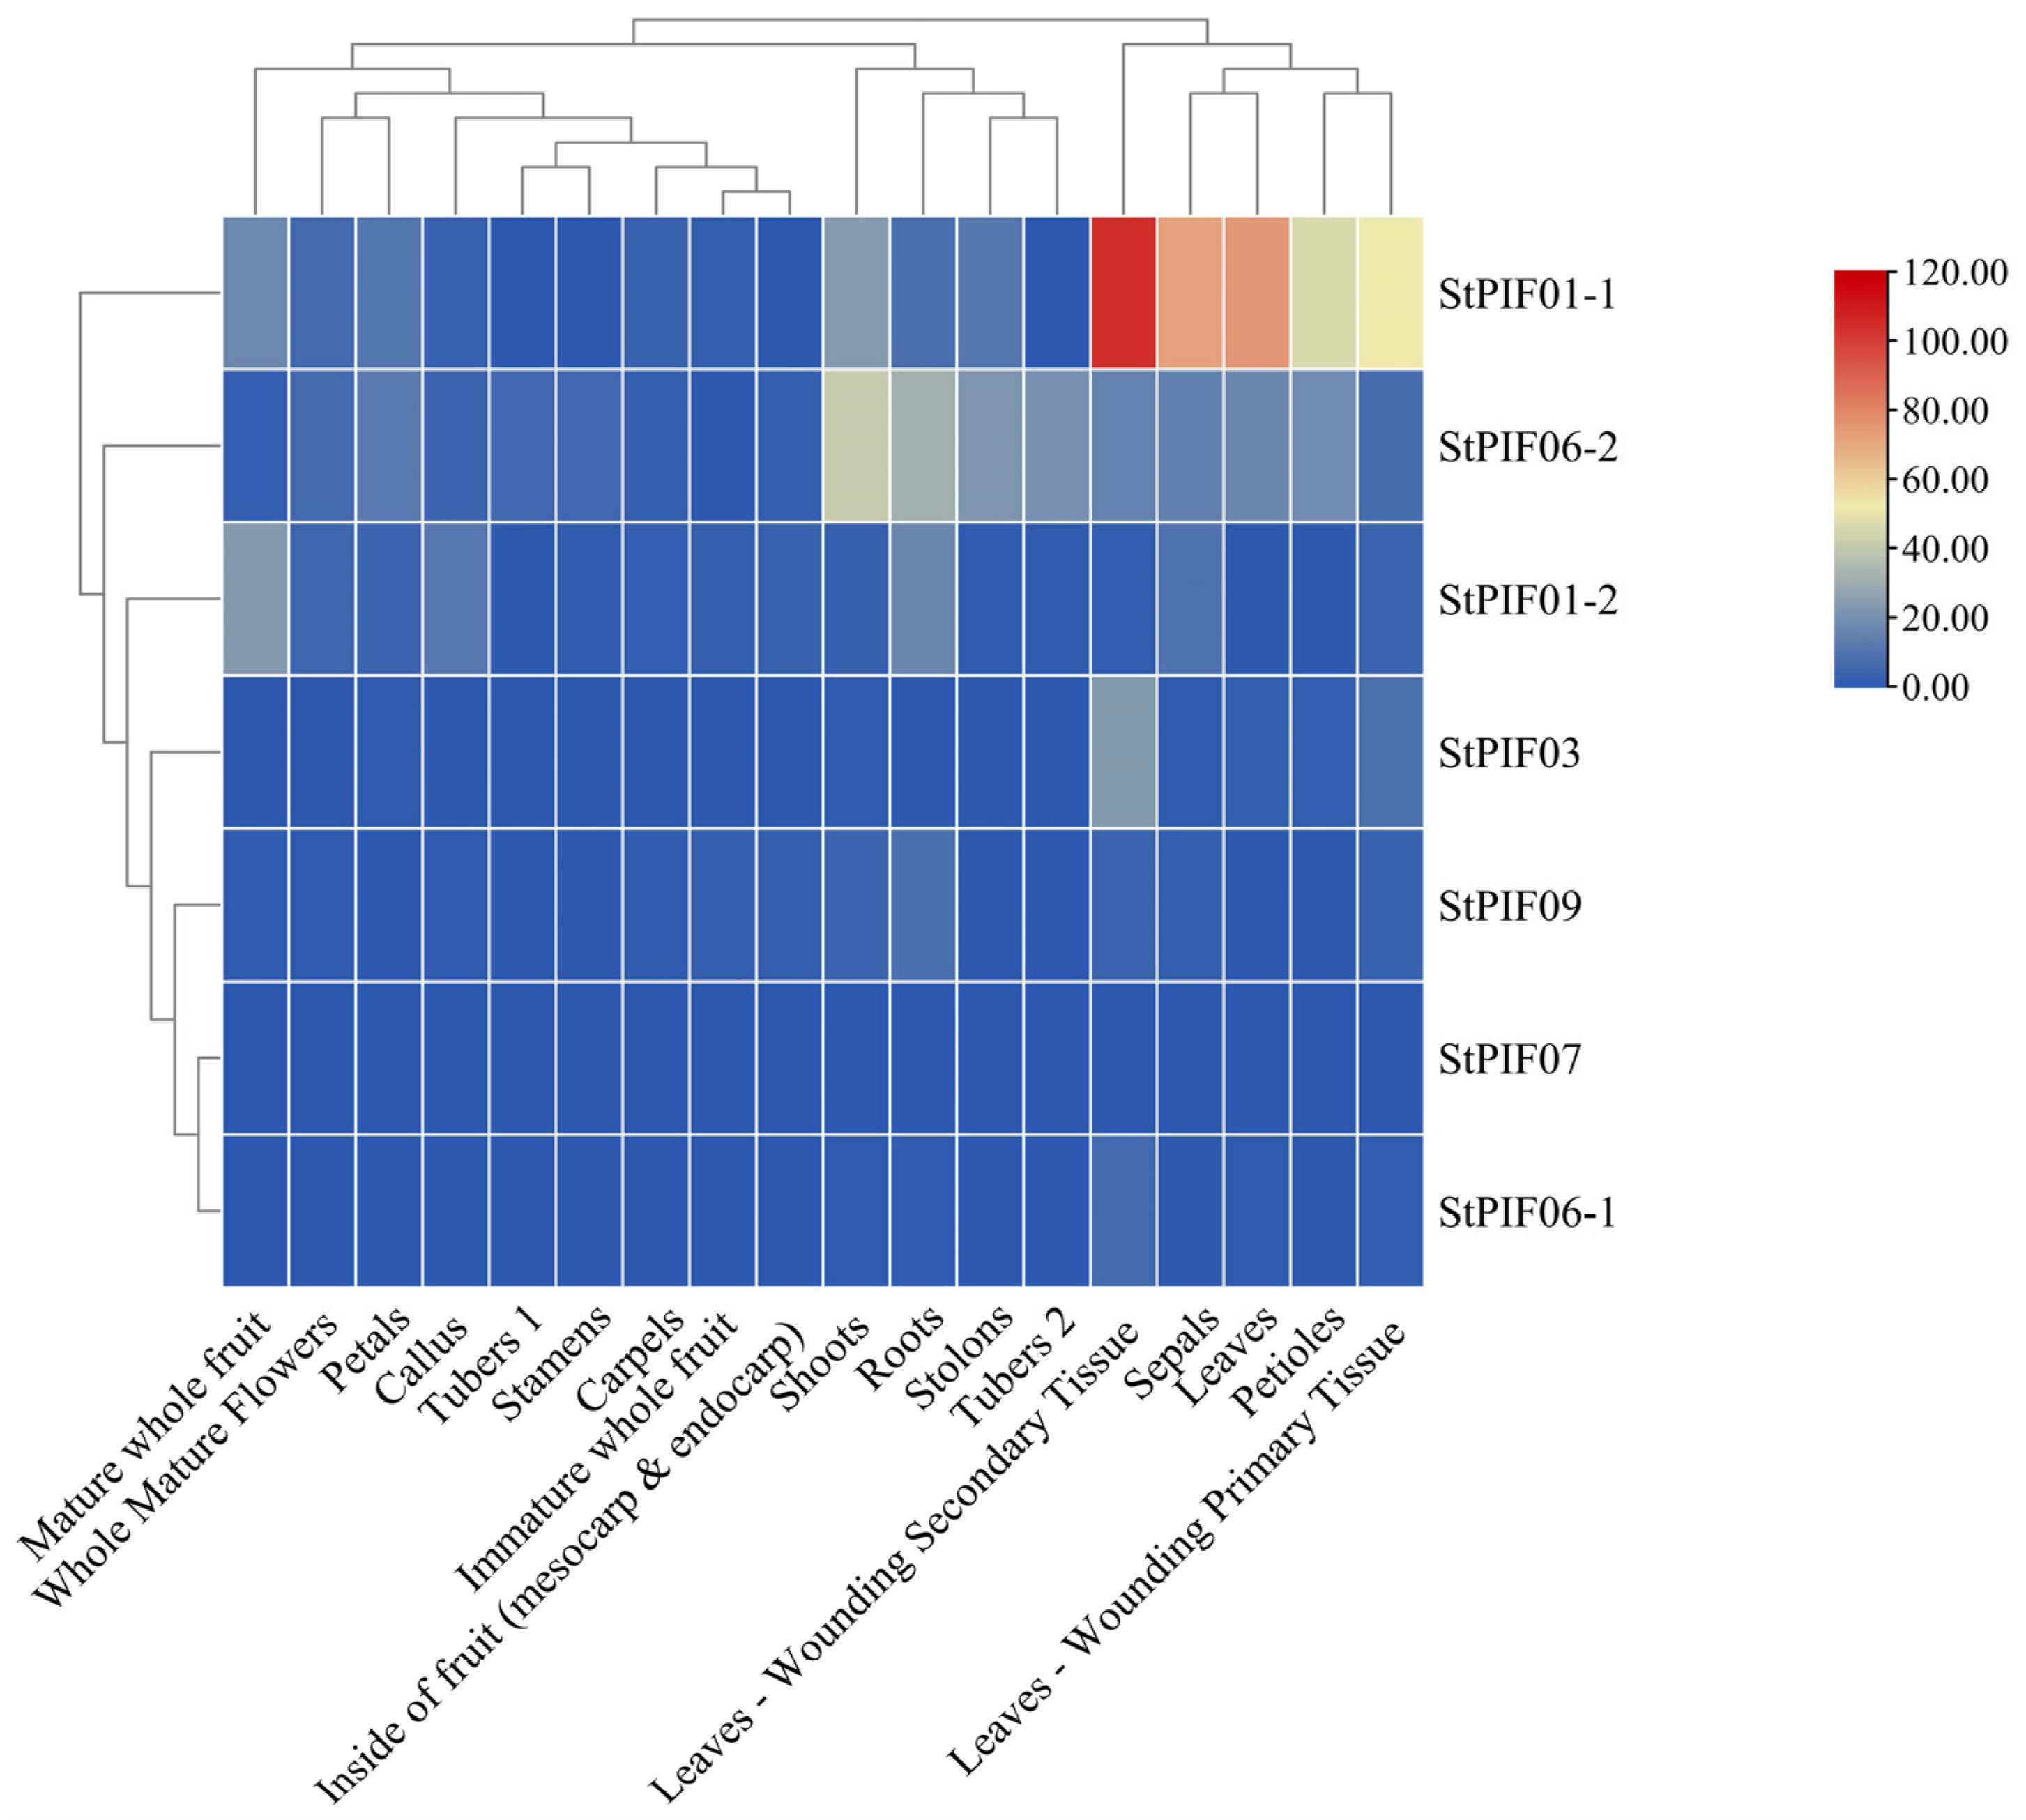
The expression levels of the seven StPIFs were investigated thoroughly using a transcriptome analysis procedure based on the public transcriptomic data of 18 different tissues of potatoes, including leaves, roots, shoots, leaf-wounding secondary tissue, callus, tuber 1, tuber 2, sepals, stamens, stolon, whole mature flowers, petioles, petals, carpels, leaf-wounding primary tissue, mature whole fruit, immature whole fruit, and the insides of the fruit (mesocarp and endocarp) (Figure 8). The results indicated that the seven StPIF genes exhibited constitutive expression in all tissues. In leaf-wounding secondary tissue, StPIF01-1 had the highest expression compared with the other tissues. Some StPIFs were predominantly expressed in different organs and tubers, such as StPIF01-1, which had a higher expression in leaf-wounding secondary tissue, sepals, leaves, petioles, and leaf-wounding primary tissue; StPIF06-2 had a higher expression in shoots and showed a slight expression in roots, stolons, tuber 2, petals, and leaves. StPIF01-2 in mature whole fruit, roots, the callus, and sepals presented with higher expression than the other tissues. StPIF03 in leaf-wounding primary tissue had higher expression than the other tested tissues. StPIF09 in roots and StPIF06-1 in leaf-wounding primary tissue showed slight expression. StPIF07 was almost not expressed, and the expression level was the lowest compared with other members.

Figure 8.
Expression levels of StPIFs in different tissues of potatoes.
3.7. Subcellular Localization of StPIF3
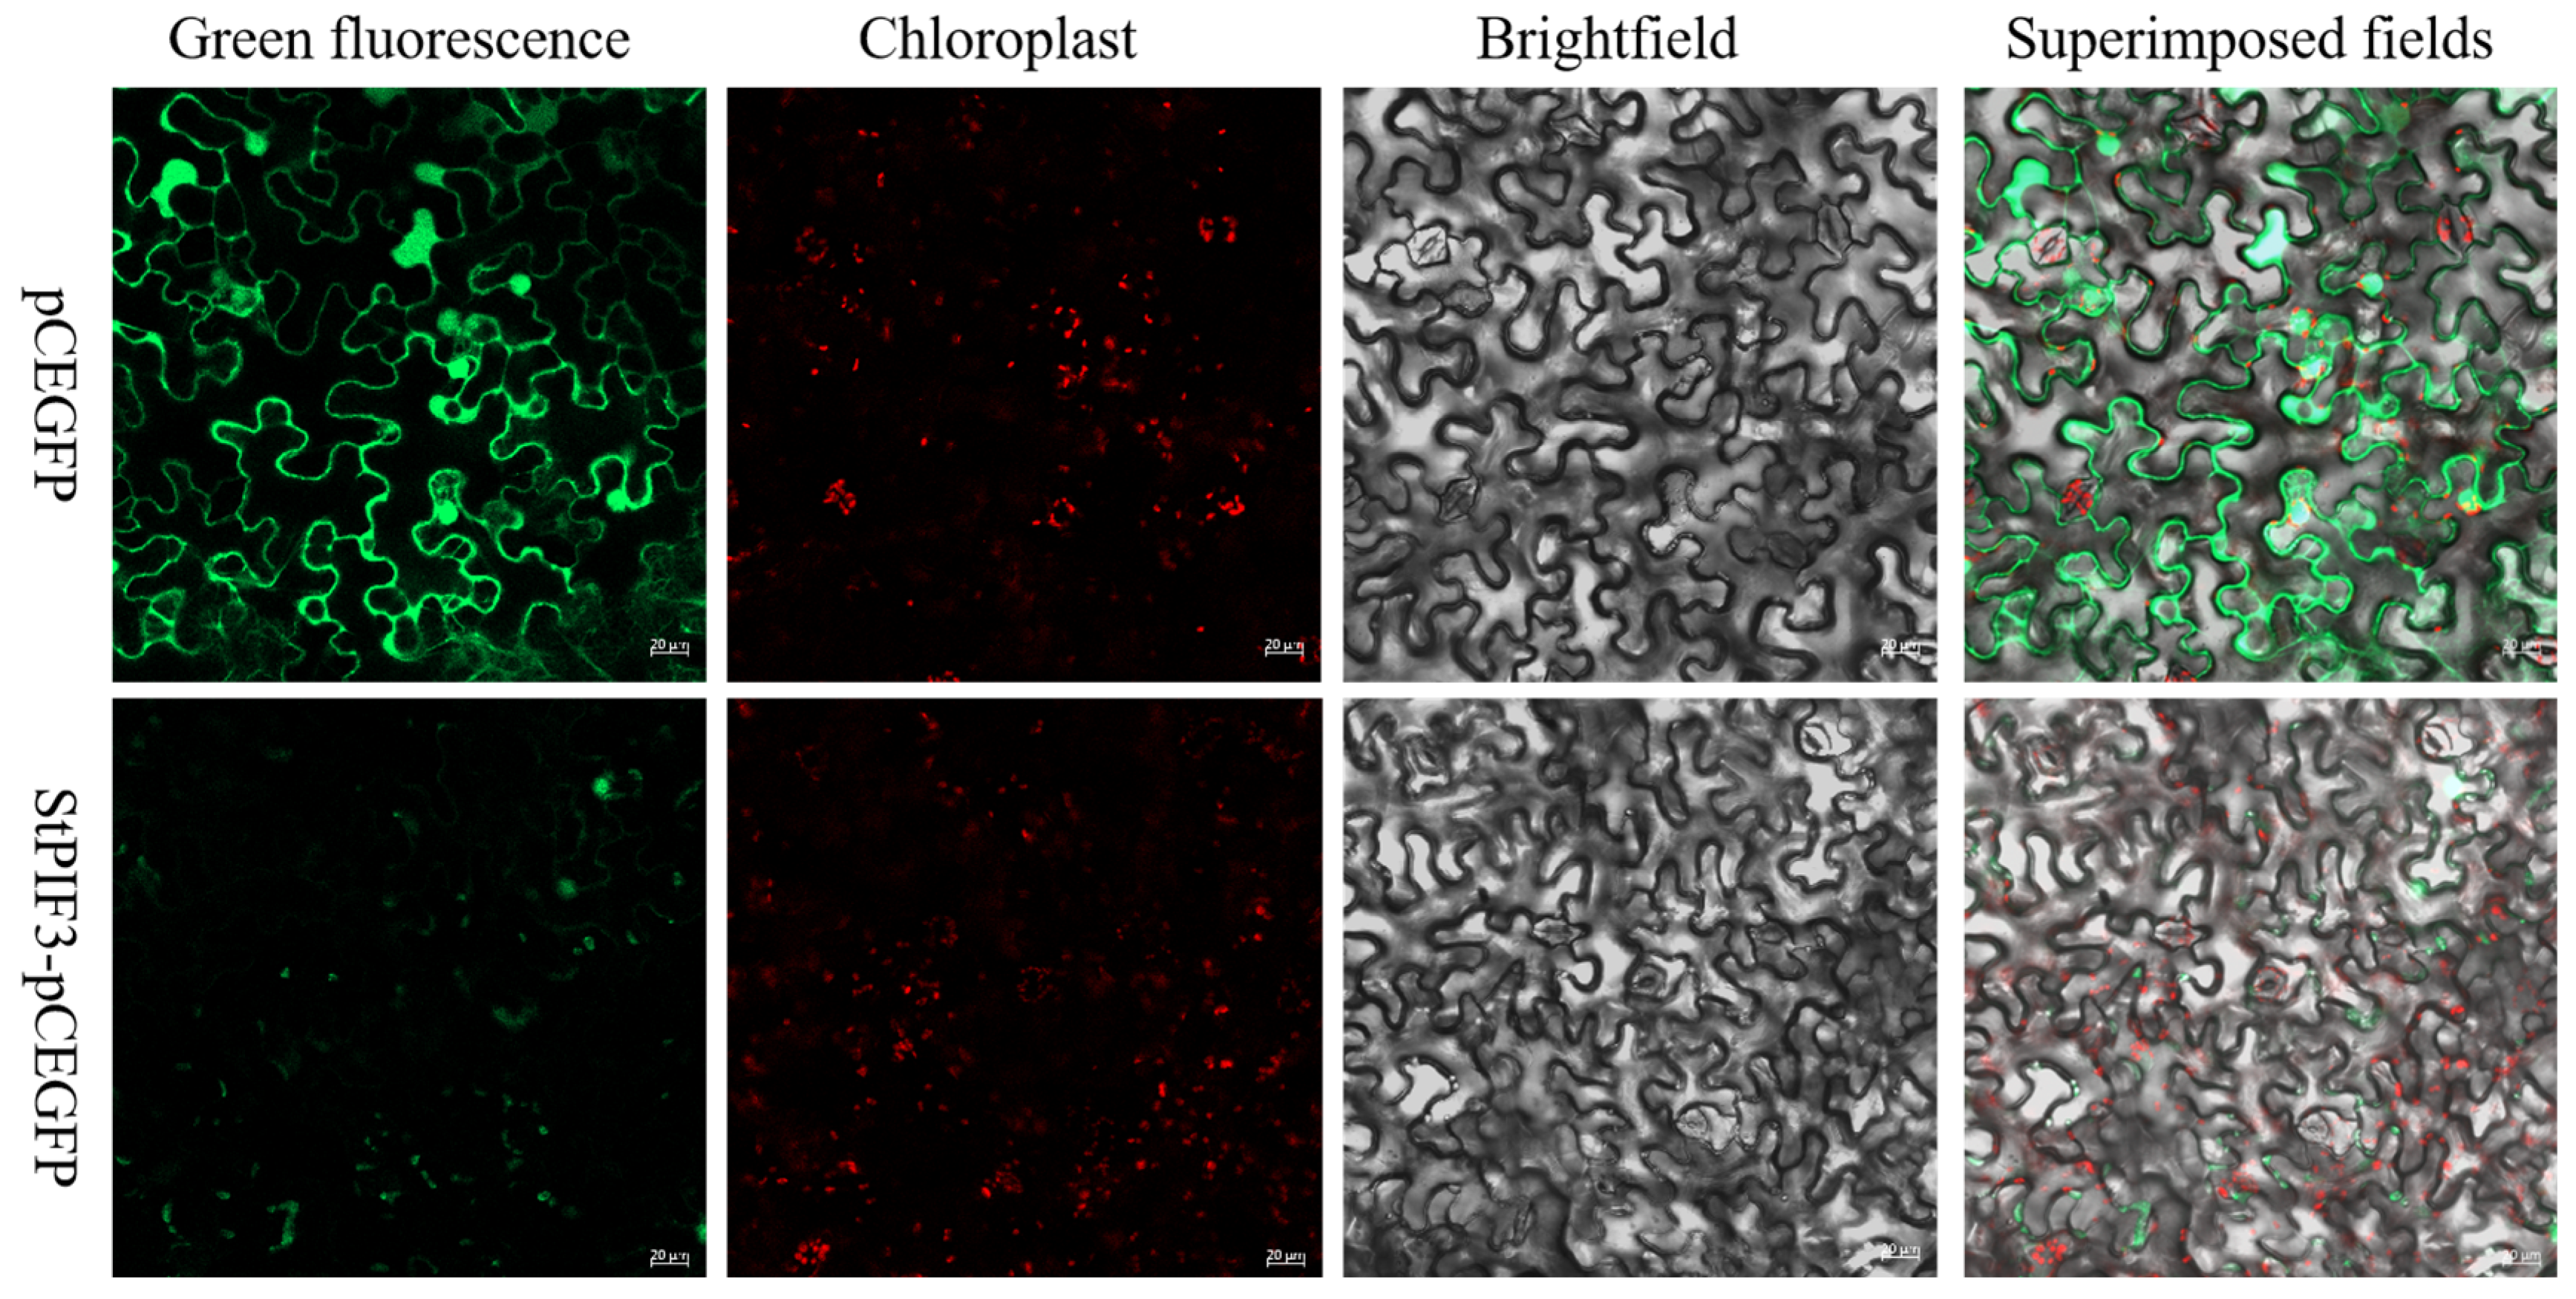
To better understand the role of StPIF3 in potatoes, subcellular localization analysis was used to trace the intracellular proteins of StPIF3, and we constructed a fusion plasmid StPIF3-GFP. the recombinant plasmid was transiently transfected into tobacco leaf cells, and subsequent confocal laser scanning microscopy revealed the nuclear localization of StPIF-GFP fusion protein fluorescence, while GFP in the controls was distributed throughout the cytoplasm and nucleus (Figure 9). These results indicated that StPIF3 is localized in the nucleus. This shows that it is a typical transcription factor.
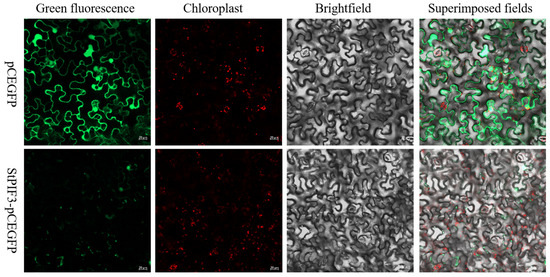
Figure 9.
Subcellular localization of StPIF3 protein. Scale bar = 20 µm. Green represents green fluorescent protein and red represents red fluorescent protein, a pair of marker proteins that are often used.
3.8. Potato Transformation and Identification
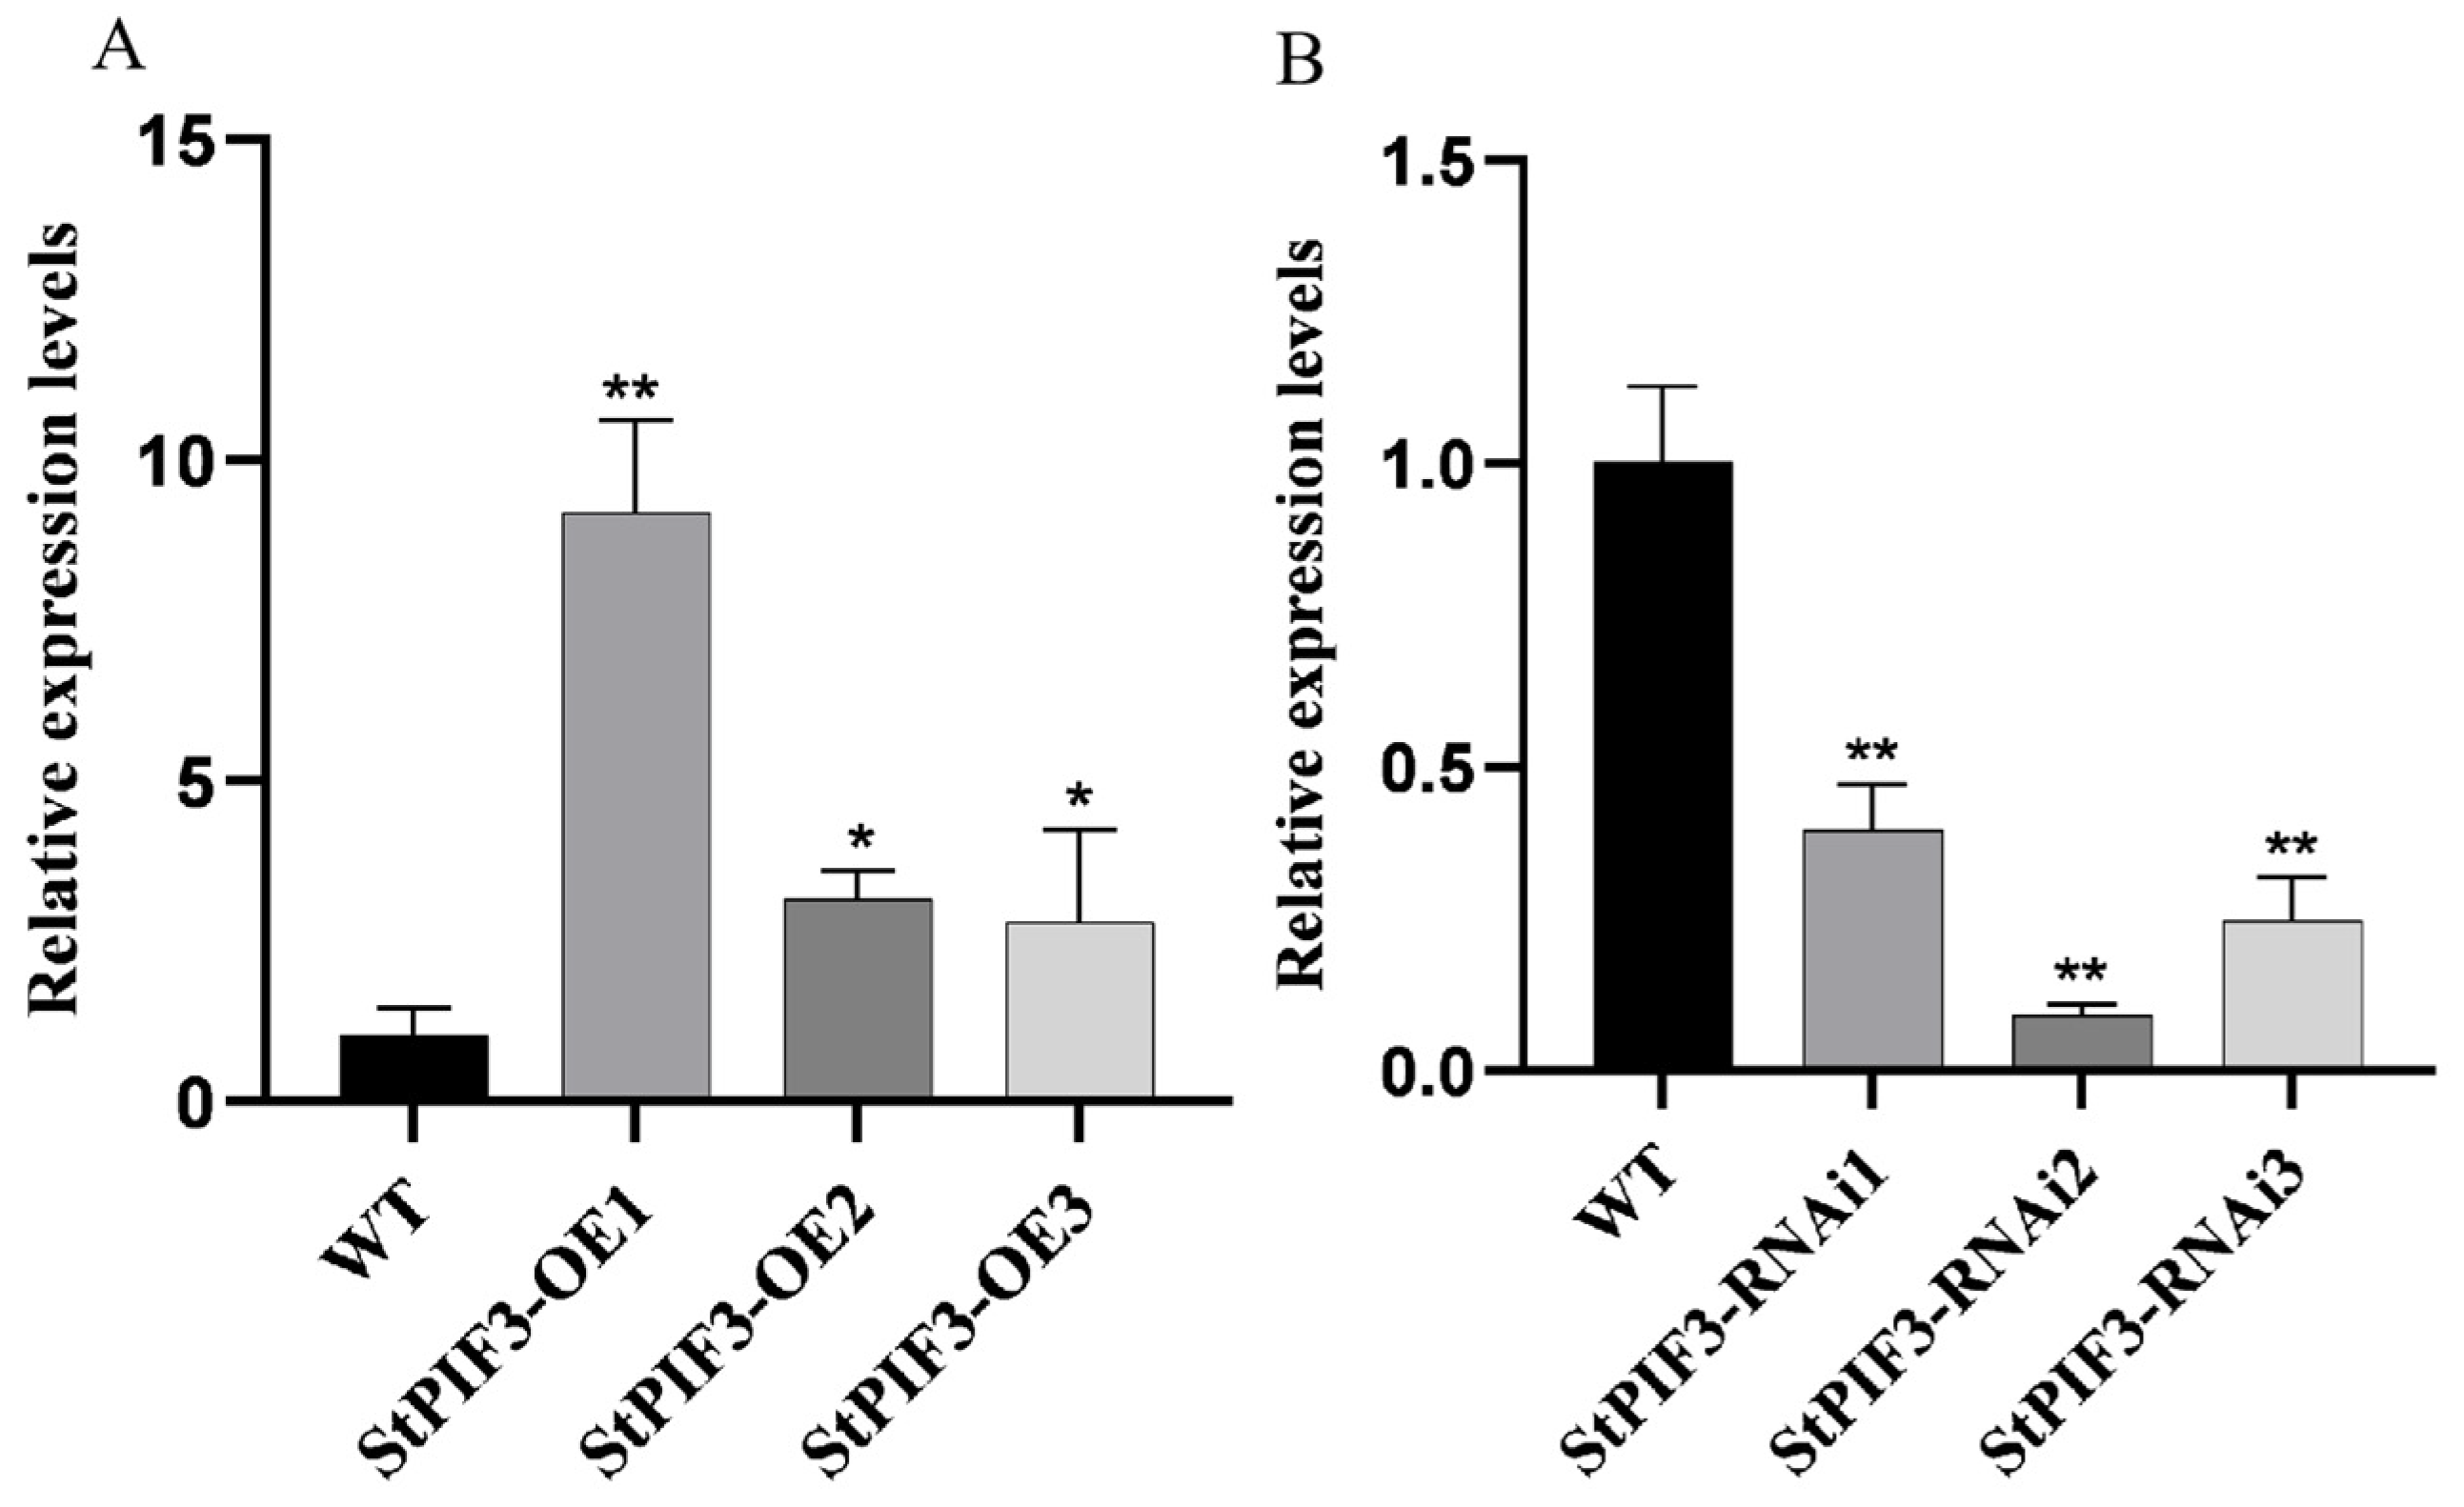
To elucidate the potential function of StPIF3 in potato shade-avoidance responses, StPIF3 overexpression (OE) and knockdown (RNAi) transgenic potato lines were obtained. In total, six independent transformants were detected as transgenic potato lines by genomic PCR (Figure 10). QRT-PCR analysis revealed that the expression level of StPIF3 in the leaves of the overexpression transgenic lines was significantly higher than that of the non-transgenic lines (Figure 10A), while the relative expression levels of StPIF3 were significantly lower in RNAi lines than non-transformed lines (Figure 10B), indicating that we successfully achieved StPIF3 overexpression and the suppression of transgenic potato lines. Based on the qRT-PCR results, three independent overexpression lines (StPIF3-OE1, StPIF3-OE2, and StPIF3-OE3) and three suppression transgenic lines (StPIF3-RNAi1, StPIF3-RNAi2, abd StPIF3-RNAi3) were severally selected for further analysis.
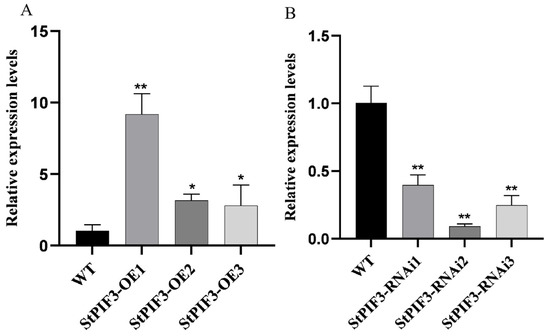
Figure 10.
Expression analysis of StPIF3 in WT and transgenic strains. StEf1α (elongation factor 1α) was used as an internal control. (A) Comparison of the expression levels of overexpressed StPIF3 lines and WT controls. (B) Comparison of the expression levels of interfering expression lines and WT controls. Asterisks denote significant differences from control (*, p < 0.05; **, p < 0.01).
3.9. StPIF3 Regulates Shade-Avoidance Syndrome by Coordinating Chlorophyll Accumulation
Previous studies have shown that a shade-induced decrease in chlorophyll content is a typical phenotype of shade-avoidance syndrome in plants. Chlorophyll content indicators can be used to assess plant nutritional status, photosynthesis efficiency, and growth and development levels. To examine the effects of StPIF3 on potato chlorophyll content, we measured chlorophyll content among StPIF3 overexpression and knockdown transgenic lines and wild-type potatoes (Figure 11). The results showed that the chlorophyll content was higher in the StPIF3 knockdown plants than the wild-type plants, while the chlorophyll content was lowest in the StPIF3 overexpression plants between wild-type and knockdown lines. These results reveal that StPIF3 negatively regulates chlorophyll content and then enhances shade-avoidance syndrome.
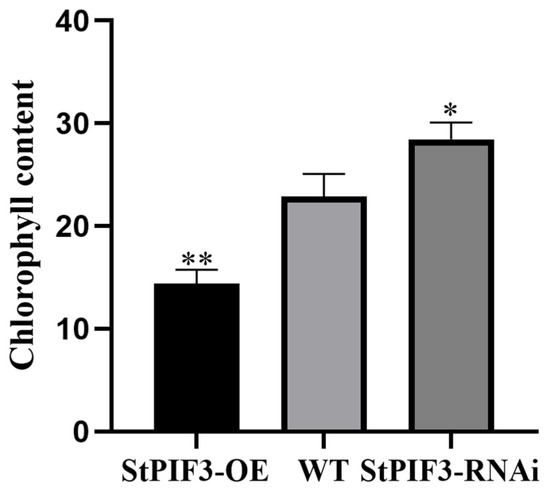
Figure 11.
Accumulation of chlorophyll in StPIF3-OE, WT, and StPIF3-RNAi plants. (*, p < 0.05; **, p < 0.01).
3.10. StPIF3 Regulates Shade-Avoidance Syndrome by Regulating Plant Heights
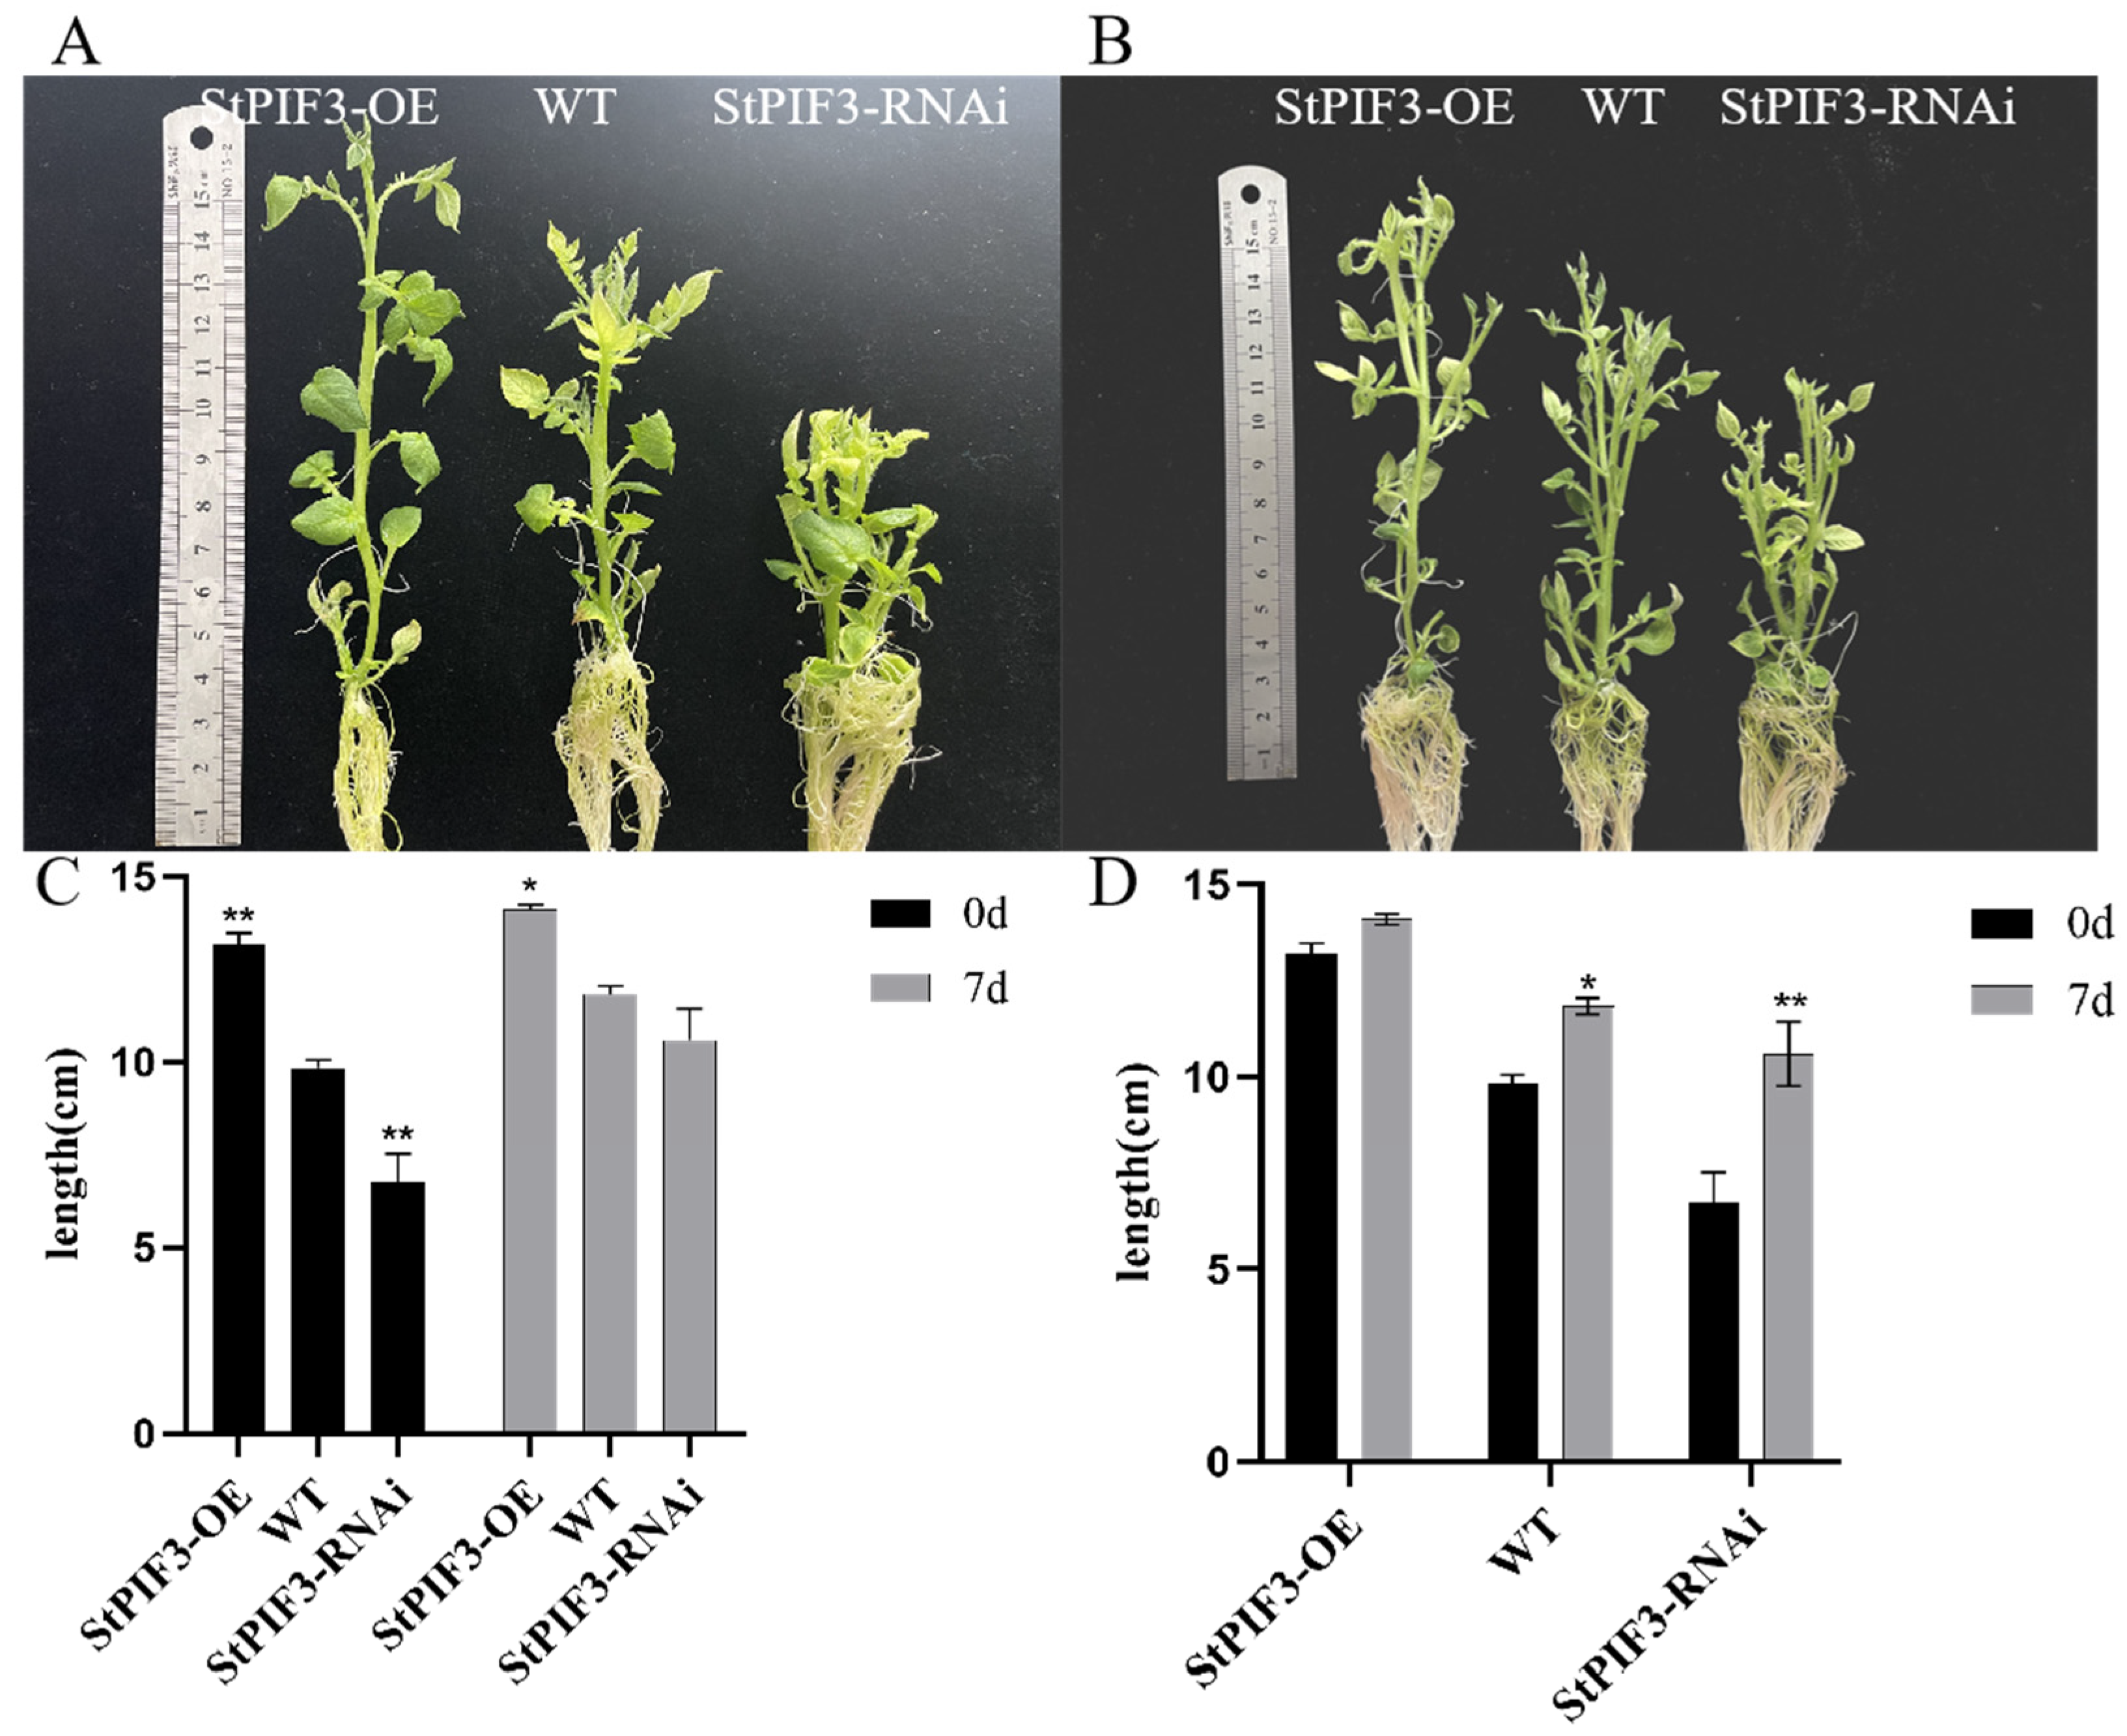
In order to identify the role of StPIF3 in potato shade-avoidance responses, we constructed StPIF3 overexpression and knockdown transgenic lines and measured the plant height of transgenic potato lines and a wild-type control. The results showed that there was a significant difference in plant height between the transgenic lines and the wild-type potato plants (Figure 12A,C). The plant height was obviously increased in the StPIF3 overexpression transgenic lines, whereas the plant height was significantly shortened in StPIF3 knockdown transgenic lines. As expected, the plant height of both the transgenic and wild-type plants significantly increased after shade treatment; however, there was a significant difference in the increase rate between the transgenic and wild lines (Figure 12B,D). Taken together, these results imply the crucial role of StPIF3 in regulating plant height and shade-avoidance responses.
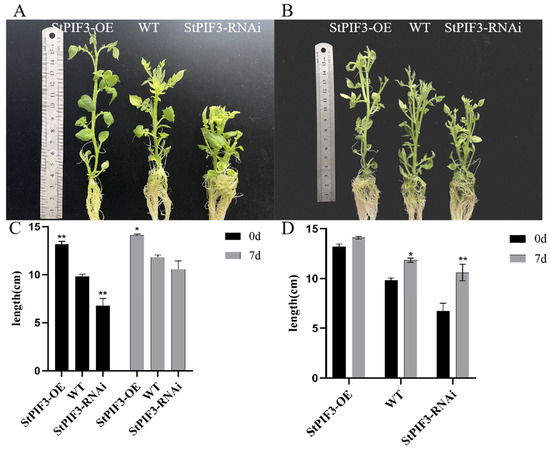
Figure 12.
Physiological indicator determination of transgenic and wild-type plants before and after shading treatment. (A,B) Pictures of transgenic plants before and after low-light treatment. (C,D) Comparison of plant height between transgenic and wild-type plants after seven days of low-light treatment. (*, p < 0.05; **, p < 0.01).
4. Discussion
4.1. StPIF Identification and Evolution in Potatoes
Phytochrome-interacting factors have been discovered as regulatory hubs that integrate environmental cues into transcriptional scenarios, and functional characterizations have shown that PIF proteins are widely involved in plant growth, development, and stress response biological processes [30,31]. Several PIF genes have been identified in many species; for example, eight candidate PIF genes have been reported in Arabidopsis [9], tomatoes [12], maize [11,32], apples [13,33], and Brachypodium distachyon [15]; six have been reported in rice [10] and Physcomitrella patens [17]; and only one has been reported in Marchantia polymorpha [16]. However, the PIF genes have been insufficiently identified in potatoes to date. In this study, we identified seven candidate StPIFs in potatoes; StPIF02 was removed due to a lack of an APB domain (Figure 3). The number of StPIFs was similar to most plants, probably due to the evolutionary conservation of the gene family. Physicochemical property analysis showed that there were differences in the theoretical isoelectric point and the location of the characteristic domains of the StPIFs; this showed that their structures were quite different, and we can speculate that they perform different functions (Table 1). The APB and APA domains have been reported to be necessary factors for identifying PIF family members apart from bHLH domains. PIF family members regulate the morphogenesis of plants via the APB domain, combined with the phyB or APA domain, combined with phyA [7]. In our study, all the gene family members had the APB domain; only StPIF06-2 and StPIF01-2 had both the APA domain and the APB domain, similar to AtPIF1 and AtPIF3, suggesting that they may physically interact with phyA and phyB, so these StPIFs might be close to AtPIF1 and AtPIF3 on an evolutionary scale [34] (Figure 3). A comparative phylogenetic investigation revealed high orthology between the StPIFs and their Solanum lycopersicum PIF counterparts (Figure 4).
4.2. PIF Transcription Factors Exhibit Phylogenetic Conservation across Plantae
Evolutionary analysis showed that the phylogenetic trees of StPIFs can be divided into six groups and clustered with tomatoes: SlPIF1a/1b, SlPIF3, SlPIF4, SlPIF7a/7b, and SlPIF8a/8b (Figure 4). Further analysis of the conserved motifs of the StPIF family members using the MEME software revealed that the majority of StPIFs in the same group had similar motifs, and those genes containing similar motifs were likely generated by gene amplification in the same group (Figure 5) [35]. We found motifs that were conserved across all groups; for example, Motifs 1, 2, and 8 contained the bHLH domain, and Motif 3 contained the APB domain. Different groups of StPIFs showed some differences in motifs. Although StPIF03 was missing Motif 4 in a group and had one more Motif 7 compared with StPIF06-1, this may reflect the diversity of StPIF protein functions. The number of exons and introns of the StPIF06-2 and StPIF07 was similar to that of A. thaliana and Vitis vinifera L., implying that PIF genes can be functionality conserved across plant species [9,14]. StPIF06-2, StPIF09, StPIF06-1, StPIF03, and StPIF01-1 shared the same number of exons and introns; we also found that they were from the same group (Figure 2).
4.3. PIFs Function as Key Nodes Conjoining Environmental and Hormonal Signals
Increasing evidence underscores the centrality of PIFs as regulatory nodes in various biological processes, including resistance to drought [36], salt [37], cold [38], chlorophyll biosynthesis [39], plant hormone signaling pathways (GA, BR, and auxin) [40], and the regulation of plant immune responses [41]. Promoter cis-acting element analysis is useful for predicting the potential functions of genes. A variety of cellular proteins, including transcription factors, can bind promoter cis-elements that regulate gene transcription and expression in response to environmental and hormonal signals. There are a total of 25 predicted promoter cis-acting elements, which roughly include hormone response elements, light response elements, response elements related to abiotic stress, and some special elements (Figure 6). For example, in the gibberellin signaling pathway, DELLA protein stabilization inhibits PIF4-driven cellular expansion, while gibberellins promote elongation by destabilizing DELLA, facilitating nuclear PIF4 accrual and target gene activation [42]. In Cucumis sativus, researchers delineate CsPIF3’s pivotal function in the orchestration of red/far-red and UV-B light signaling pathways that govern hypocotyl development. Specifically, the interaction between CsPhyB and CsPIF3, followed by downstream engagement with CsGA20ox-2-DELLA and CsPIF3-CsARF18, modulates hypocotyl elongation via gibberellin and auxin routes. CsPIF3’s transcriptional control is affected through its binding to G/E-box motifs within the CsGA20ox-2 and CsARF18 promoter regions [30]. Considering the central role of PIFs in light signal transduction, this study explored the effect of light intensity on StPIF expression levels. Our results indicated that the expression of six StPIFs was affected by the light intensity. Shading treatments can increase the expression level of PIF06-2 and StPIF03, but the increase was limited with time. The expression level of StPIF01-1 decreased obviously and then increased after shade; the expression of StPIF06-1 was induced by light-shading conditions (Figure 7). In grapes, shade treatment facilitates increased transcript levels of VvPIFs [14]. This is generally consistent with our results.
Transcriptomic profiling of StPIFs in different potato organs and tissues revealed the dynamics of gene expression, providing valuable insights for functional analysis. An expression weight heat map was obtained and revealed the spatial differences in the expression levels of StPIFs in different potato organs/tissues. StPIF01-1 had the highest expression in leaf-wounding secondary tissue, StPIF06-2 was highly expressed in shoots, and most of the StPIFs showed different expression patterns in different organs/tissues, suggesting that different StPIFs had different biological functions (Figure 8).
4.4. StPIF3 Regulates Shade-Avoidance Syndrome in Potatoes
Previous studies have shown that PIFs participate in regulating light-dependent growth and development processes. AtPIF3 is a positive regulator of PHYB signal transduction; in Poc1 mutant plants, dark conditions attenuate PIF3 transcript levels, whereas red illumination upregulates expression concomitantly with abbreviated hypocotyl elongation, which has been interpreted as being associated with PIF3 overexpression [43]. In Arabidopsis thaliana, researchers characterized PIF3’s role in photomorphogenesis, revealing that overexpression lengthens hypocotyls and shrinks cotyledons under red light, with diminished cotyledon expansion under red and far-red spectra, contrasting the truncated phenotypes observed in pif3 mutants [44]. In our study, StPIF3-overexpressed potato plants have higher plant heights compared with wild-type and interfering expressing plants, and the overexpression plants exhibited smaller cotyledons; this is consistent with previous reports. The key role of PIF3 in light signal transduction is demonstrated in Figure 12. Shade during the tuber expansion period can lead to an increase in chlorophyll content [45]. In Arabidopsis thaliana, PIF3 overexpression lines exhibit elevated anthocyanin and diminished chlorophyll levels [44]. Our results showed that StPIF3 overexpression significantly decreased the chlorophyll content compared with wild-type plants, which may be related to the fact that they have smaller cotyledons; this is basically consistent with previous research. Increased plant height is one of the typical shade-avoidance syndromes. The results of our experiment also confirmed that the overexpression of StPIF3 can greatly improve the plant height of transgenic potatoes. In summary, we propose that StPIF3 plays a critical role in regulating shade-avoidance syndrome in potatoes.
5. Conclusions
This study identified seven StPIF genes, all putative amino acid sequences containing APB and bHLH conserved domains unique to PIFs. In evolutionary relationships, StPIFs can be divided into four groups, each group with similar conserved motifs. Tissue expression profiling indicated that most of these genes were highly expressed in the leaves. All seven StPIFs screened responded to light intensity changes, and shading was beneficial to improving the expression level of the StPIFs. StPIF3 overexpression showed higher plant height and less chlorophyll accumulation in normal light; interfering expression was the opposite. Furthermore, StPIF3 overexpression reduced sensitivity to low-light treatment. Our research will provide ideas for optical signal transduction networks of PIFs in potatoes.
Author Contributions
Conceived and designed the experiments: J.Y. and H.S.; performed the experiments: Y.H. and J.Y.; analyzed the data: Y.H. and J.Y.; contributed reagents/materials/analysis tools: N.Z., Y.G., M.L., R.Q., X.J., F.Z. and X.L.; wrote the paper: Y.H., J.Y. and H.S. All authors have read and agreed to the published version of the manuscript.
Funding
This research was supported by the Innovation Fund of the Youth Mentor Fund of Gansu Agricultural University (No. GSAU-QDFC-2021-15); the Education Department of Gansu Province (2023A-061); and the Gansu Provincial Key Laboratory of Aridland Crop Science, Gansu Agricultural University (No. GSCS-2017-6).
Data Availability Statement
All the research data are share in manuscript.
Conflicts of Interest
The authors declare no conflicts of interest.
References
- Bae, G.; Choi, G. Decoding of light signals by plant phytochromes and their interacting proteins. Annu. Rev. Plant Biol. 2008, 59, 281–311. [Google Scholar] [CrossRef] [PubMed]
- Roeber, V.M.; Bajaj, I.; Rohde, M.; Schmulling, T.; Cortleven, A. Light acts as a stressor and influences abiotic and biotic stress responses in plants. Plant Cell Environ. 2021, 44, 645–664. [Google Scholar] [CrossRef] [PubMed]
- Franklin, K.A.; Larner, V.S.; Whitelam, G.C. The signal transducing photoreceptors of plants. Int. J. Dev. Biol. 2005, 49, 653–664. [Google Scholar] [CrossRef] [PubMed]
- Chen, M.; Chory, J. Phytochrome signaling mechanisms and the control of plant development. Trends Cell Biol. 2011, 21, 664–671. [Google Scholar] [CrossRef] [PubMed]
- Carvalho, R.F.; Campos, M.L.; Azevedo, R.A. The role of phytochrome in stress tolerance. J. Integr. Plant Biol. 2011, 53, 920–929. [Google Scholar] [CrossRef] [PubMed]
- Ballare, C.L. Light regulation of plant defense. Annu. Rev. Plant Biol. 2014, 65, 335–363. [Google Scholar] [CrossRef] [PubMed]
- Castillon, A.; Shen, H.; Huq, E. Phytochrome interacting factors: Central players in phytochrome-mediated light signaling networks. Trends Plant Sci. 2007, 12, 514–521. [Google Scholar] [CrossRef] [PubMed]
- Leivar, P.; Quail, P.H. PIFs: Pivotal components in a cellular signaling hub. Trends Plant Sci. 2011, 16, 19–28. [Google Scholar] [CrossRef] [PubMed]
- Lee, N.; Choi, G. Phytochrome-interacting factor from Arabidopsis to liverwort. Curr. Opin. Plant Biol. 2017, 35, 54–60. [Google Scholar] [CrossRef]
- Nakamura, Y.; Kato, T.; Yamashino, T.; Murakami, M.; Mizuno, T. Characterization of a set of phytochrome-interacting factor-like bHLH proteins in Oryza sativa. Biosci. Biotechnol. Biochem. 2007, 71, 1183–1191. [Google Scholar] [CrossRef] [PubMed]
- Zhang, T.; Lv, W.; Zhang, H.; Ma, L.; Li, P.; Ge, L. Genome-wide analysis of the basic Helix-Loop-Helix (bHLH) transcription factor family in maize. BMC Plant Biol. 2018, 18, 235. [Google Scholar] [CrossRef]
- Rosado, D.; Gramegna, G.; Cruz, A.; Lira, B.S.; Freschi, L.; de Setta, N. Phytochrome interacting factors (PIFs) in Solanum lycopersicum: Diversity, evolutionary history and expression profiling during different developmental processes. PLoS ONE 2016, 11, e0165929. [Google Scholar] [CrossRef] [PubMed]
- Zheng, P.F.; Wang, X.; Yang, Y.Y.; You, C.X.; Zhang, Z.L.; Hao, Y.J. Identification of phytochrome-interacting factor family members and functional analysis of MdPIF4 in Malus domestica. Int. J. Mol. Sci. 2020, 21, 7350. [Google Scholar] [CrossRef] [PubMed]
- Zhang, K.K.; Zheng, T.; Zhu, X.D.; Jiu, S.T.; Liu, Z.J.; Guan, L.; Jia, H.F.; Fang, J.G. Genome-wide identification of PIFs in Grapes (Vitis vinifera L.) and their transcriptional analysis under lighting/shading conditions. Genes 2018, 9, 451. [Google Scholar] [CrossRef] [PubMed]
- Jiang, M.; Wen, G.; Zhao, C. Phylogeny and evolution of plant Phytochrome Interacting Factors (PIFs) gene family and functional analyses of PIFs in Brachypodium distachyon. Plant Cell Rep. 2022, 41, 1209–1227. [Google Scholar] [CrossRef] [PubMed]
- Inoue, K.; Nishihama, R.; Kataoka, H.; Hosaka, M.; Manabe, R.; Nomoto, M. Phytochrome signaling is mediated by phytochrome interacting factor in the liverwort Marchantia polymorpha. Plant Cell 2016, 28, 1406–1421. [Google Scholar] [CrossRef] [PubMed]
- Possart, A.; Xu, T.; Paik, I.; Hanke, S.; Keim, S.; Hermann, H.M.; Wolf, L.; Hiß, M.; Becker, C.; Huq, E.; et al. Characterization of phytochrome interacting factors from the moss Physcomitrella patens illustrates conservation of phytochrome signaling modules in land plants. Plant Cell 2017, 29, 310–330. [Google Scholar] [CrossRef] [PubMed]
- Leivar, P.; Monte, E. PIFs: Systems integrators in plant development. Plant Cell 2014, 26, 56–78. [Google Scholar] [CrossRef] [PubMed]
- Liu, Z.; Zhang, Y.; Wang, J.; Li, P.; Zhao, C.; Chen, Y.; Bi, Y. Phytochrome-interacting factors PIF4 and PIF5 negatively regulate anthocyanin biosynthesis under red light in Arabidopsis seedlings. Plant Sci. 2015, 238, 64–72. [Google Scholar] [CrossRef] [PubMed]
- Penfield, S.; Josse, E.M.; Halliday, K.J. A role for an alternative splice variant of PIF6 in the control of Arabidopsis primary seed dormancy. Plant Mol. Biol. 2010, 73, 89–95. [Google Scholar] [CrossRef] [PubMed]
- Camire, M.E.; Kubow, S.; Donnelly, D.J. Potatoes and human health. Crit. Rev. Food Sci. Nutr. 2009, 49, 823–840. [Google Scholar] [CrossRef] [PubMed]
- Gómez-Ocampo, G.; Cascales, J.; Medina-Fraga, A.L.; Ploschuk, E.L.; Mantese, A.I.; Crocco, C.D.; Matsusaka, D.; Sánchez, D.H.; Botto, J.F. Transcriptomic and physiological shade avoidance responses in potato (Solanum tuberosum) plants. Physiol. Plant. 2023, 175, e13991. [Google Scholar] [CrossRef] [PubMed]
- Liu, W.; Tang, X.; Zhu, X.; Qi, X.; Zhang, N.; Si, H. Genome-wide identification and expression analysis of the E2 gene family in potato. Mol. Biol. Rep. 2019, 46, 777–791. [Google Scholar] [CrossRef] [PubMed]
- Wang, C.; Han, J.; Shangguan, L.; Yang, G.; Kayesh, E.; Zhang, Y.; Leng, X.; Fang, J. Depiction of grapevine phenology by gene expression information and a test of its workability in guiding fertilization. Plant Mol. Biol. 2014, 32, 1070–1084. [Google Scholar] [CrossRef]
- Livak, K.J.; Schmittgen, T.D. Analysis of relative gene expression data using real-time quantitative PCR and the 2−ΔΔCT method. Methods 2001, 25, 402–408. [Google Scholar] [CrossRef] [PubMed]
- Xu, X.; Pan, S.; Cheng, S.; Zhang, B.; Mu, D.; Ni, P.; Zhang, G.; Yang, S.; Li, R.; Wang, J.; et al. Genome sequence and analysis of the tuber crop potato. Nature 2011, 475, 189–195. [Google Scholar] [CrossRef] [PubMed]
- Pieczynski, M.; Marczewski, W.; Hennig, J.; Dolata, J.; Bielewicz, D.; Piontek, P.; Wyrzykowska, A.; Krusiewicz, D.; Strzelczyk-Zyta, D.; Konopka-Postupolska, D.; et al. Down-regulation of CBP80 gene expression as a strategy to engineer a drought-tolerant potato. Plant Biotechnol. J. 2013, 11, 459–469. [Google Scholar] [CrossRef] [PubMed]
- Si, H.J.; Xie, C.H.; Liu, J. Optimization of agrobacterium-mediated genetic transformation system of potato in vitro potato and introduction of antisense class I. patatin gene. Acta Agron. Sin. 2003, 29, 801–805. [Google Scholar]
- Al-Sady, B.; Ni, W.; Kircher, S.; Schäfer, E.; Quail, P.H. Photoactivated phytochrome induces rapid PIF3 phosphorylation prior to proteasome-mediated degradation. Mol. Cell 2006, 23, 439–446. [Google Scholar] [CrossRef] [PubMed]
- Zhao, J.; Bo, K.; Pan, Y.; Li, Y.; Yu, D.; Li, C.; Chang, J.; Wu, S.; Wang, Z.; Zhang, X.; et al. Phytochrome-interacting factor PIF3 integrates phytochrome B and UV-B signaling pathways to regulate gibberellin- and auxin-dependent growth in cucumber hypocotyls. J. Exp. Bot. 2023, 74, 4520–4539. [Google Scholar] [CrossRef] [PubMed]
- Pham, V.N.; Kathare, P.K.; Huq, E. Phytochromes and phytochrome interacting factors. Plant Physiol. 2018, 176, 1025–1038. [Google Scholar] [CrossRef] [PubMed]
- Wu, G.; Zhao, Y.; Shen, R.; Wang, B.; Xie, Y.; Ma, X.; Zheng, Z.; Wang, H. Characterization of maize phytochrome-interacting factors in light signaling and photomorphogenesis. Plant Physiol. 2019, 181, 789–803. [Google Scholar] [CrossRef] [PubMed]
- Han, X.; Liu, K.; Yuan, G.; He, S.; Cong, P.; Zhang, C. Genome-wide identification and characterization of AINTEGUMENTA-LIKE (AIL) family genes in apple (Malus domestica Borkh.). Genomics 2022, 114, 110313. [Google Scholar] [CrossRef] [PubMed]
- Shen, H.; Zhu, L.; Castillon, A.; Majee, M.; Downie, B.; Huq, E. Light-induced phosphorylation and degradation of the negative regulator PHYTOCHROME-INTERACTING FACTOR1 from Arabidopsis depend upon its direct physical interactions with photoactivated phytochromes. Plant Cell 2008, 20, 1586–1602. [Google Scholar] [CrossRef] [PubMed]
- Freeling, M. Bias in plant gene content following different sorts of duplication: Tandem, whole-genome, segmental, or by transposition. Annu. Rev. Plant Biol. 2009, 60, 433–453. [Google Scholar] [CrossRef] [PubMed]
- Gao, Y.; Wu, M.; Zhang, M.; Jiang, W.; Ren, X.; Liang, E.; Zhang, D.; Zhang, C.; Xiao, N.; Li, Y. A maize phytochrome-interacting factors protein ZmPIF1 enhances drought tolerance by inducing stomatal closure and improves grain yield in Oryza sativa. Plant Biotechnol. J. 2018, 16, 1375–1387. [Google Scholar] [CrossRef] [PubMed]
- Gao, Y.; Jiang, W.; Dai, Y.; Xiao, N.; Zhang, C.; Li, H.; Lu, Y.; Wu, M.; Tao, X.; Deng, D. A maize phytochrome-interacting factor 3 improves drought and salt stress tolerance in rice. Plant Mol. Biol. 2015, 87, 413–428. [Google Scholar] [CrossRef] [PubMed]
- Wang, F.; Chen, X.; Dong, S.; Jiang, X.; Wang, L.; Yu, J.; Zhou, Y. Crosstalk of PIF4 and DELLA modulates CBF transcript and hormone homeostasis in cold response in tomato. Plant Biotechnol. J. 2020, 18, 1041–1055. [Google Scholar] [CrossRef] [PubMed]
- Huq, E.; Al-Sady, B.; Hudson, M.; Kim, C.; Apel, K.; Quail, P.H. Phytochrome-interacting factor 1 is a critical bHLH regulator of chlorophyll biosynthesis. Science 2004, 305, 1937–1941. [Google Scholar] [CrossRef] [PubMed]
- Choi, H.; Oh, E. PIF4 integrates multiple environmental and hormonal signals for plant growth regulation in Arabidopsis. Mol. Cells 2016, 39, 587–593. [Google Scholar] [CrossRef] [PubMed]
- Gangappa, S.N.; Berriri, S.; Kumar, S.V. PIF4 coordinates thermosensory growth and immunity in Arabidopsis. Curr. Biol. 2017, 27, 243–249. [Google Scholar] [CrossRef] [PubMed]
- De Lucas, M.; Davière, J.M.; Rodríguez-Falcón, M.; Pontin, M.; Iglesias-Pedraz, J.M.; Lorrain, S.; Fankhauser, C.; Blázquez, M.A.; Titarenko, E.; Prat, S. A molecular framework for light and gibberellin control of cell elongation. Nature 2008, 451, 480–484. Available online: https://www.nature.com/articles/nature06520#citeas (accessed on 6 March 2024). [CrossRef] [PubMed]
- Halliday, K.J.; Hudson, M.; Ni, M.; Qin, M.; Quail, P.H. Poc1: An Arabidopsis mutant perturbed in phytochrome signaling because of a T DNA insertion in the promoter of PIF3, a gene encoding a phytochrome-interacting bHLH protein. Proc. Natl. Acad. Sci. USA 1999, 96, 5832–5837. [Google Scholar] [CrossRef] [PubMed]
- Kim, J.; Yi, H.; Choi, G.; Shin, B.; Song, P.S.; Choi, G. Functional characterization of phytochrome interacting factor 3 in phytochrome-mediated light signal transduction. Plant Cell 2003, 15, 2399–2407. [Google Scholar] [CrossRef] [PubMed]
- Li, P.H.; Peng, X. Study on photosynthesis effect of potato shading light. Chin. Agric. Sci. Bull. 2007, 23, 220–227. Available online: https://www.casb.org.cn/CN/Y2007/V23/I4/220 (accessed on 6 March 2024).


Disclaimer/Publisher’s Note: The statements, opinions and data contained in all publications are solely those of the individual author(s) and contributor(s) and not of MDPI and/or the editor(s). MDPI and/or the editor(s) disclaim responsibility for any injury to people or property resulting from any ideas, methods, instructions or products referred to in the content. |
© 2024 by the authors. Licensee MDPI, Basel, Switzerland. This article is an open access article distributed under the terms and conditions of the Creative Commons Attribution (CC BY) license (https://creativecommons.org/licenses/by/4.0/).