Article

Comparison of the Effect of Pruning on Plant Growth and Transcriptome Profiles in Different Tea Varieties

1
College of Horticulture, Sichuan Agricultural University, Chengdu 611130, China
2
Tea Refining and Innovation Key Laboratory of Sichuan Province, Sichuan Agricultural University, Chengdu 611130, China
*
Author to whom correspondence should be addressed.
These authors contributed equally to this work.
Agronomy 2024, 14(6), 1105; https://doi.org/10.3390/agronomy14061105
Submission received: 20 March 2024 / Revised: 16 April 2024 / Accepted: 27 April 2024 / Published: 23 May 2024
(This article belongs to the Section Horticultural and Floricultural Crops)

Abstract

:
Although pruning contributes to the growth and development of new shoots, it is important to note that the growth potential and yield of tea varieties may differ after pruning due to genetic and environmental factors. In this experiment, 20 different varieties of tea plants were used to observe their potential for growth, shoot development, and other phenotypic indexes after pruning. The study aimed to determine the suitability of each variety for heavy pruning. It was concluded that there were obvious differences in tree strength and new growth after pruning of the different varieties, with ‘Zhongcha 302’ exhibiting the strongest growth and ‘Emei Wenchun’ showing the weakest growth. In order to understand the molecular mechanisms involved, a transcriptomic analysis was carried out on the two tea varieties. The results of the data indicate that the expression of CYP450 family was high in ‘Zhongcha 302’. In ‘Emei Wenchun’, the expression of NCED was higher than that in ‘Zhongcha 302’. The KEGG results indicate that pruning stimulates the expression of genes involved in phytohormone signalling and plant–pathogen interaction pathways in tea plants. The study offered scientific guidance for tea plant pruning suitability and preliminarily revealed the regulatory mechanism of new shoot growth in different tea plant varieties at the transcriptome level.

1. Introduction

Tea plant (Camellia sinensis (L.) O. Kuntze) is a perennial evergreen plant that is widely cultivated worldwide. Tea has not only a pharmacological effect, but also a nutritional value that is beneficial to human health. Research has reported that tea contains over 500 different compounds, and the most important and pharmacologically active are polyphenols. It has been proved that higher concentrations of tea polyphenols are found in young buds and leaves, which have antiseptic, anti-inflammatory, antioxidant, and hypoglycaemic properties. This is followed by caffeine, which is particularly abundant in young leaves. In addition, tea leaves also contain theanine, which has sedative and antihypertensive properties. Therefore, tea has become one of the most popular non-alcoholic beverages worldwide [1,2]. However, as the tea plant’s reproductive age is prolonged, its production and yield follow a pattern of increase, peak, and decline. Additionally, the plant’s ability to synthesise organic matter decreases, which limits the economic benefits of the tea plantation. In order to achieve sustainable development in tea production, it is important to select and breed excellent tea varieties. The quality and yield of tea are largely determined by the variety selected. Different tea varieties have different yields. In addition, effective production and management measures must be implemented in the tea garden.
Pruning is a common and crucial practice in tea garden management [3]. It regulates branch growth and new growth of tea plants by inducing phytohormones [4]. Shaping of tea plants affects the yield and quality of fresh tea leaves [5], and pruning can change the branching habit of the natural growth of the tea plants to extend the crown to the peripheral space, promote nutrient growth, and eliminate apical dominance, increase bud sprouting, and lead to an increase in the rate of photosynthesis. As a result, it enhances leaf development and longevity [6]. Pruning alters the activity of inter-root soil enzymes and the microbial functional diversity of tea plants. This improves the soil’s nutrient conversion capacity and promotes the tea plant’s nutrient uptake capacity, ultimately leading to improved growth [7].
In response to environmental stresses, plants produce a variety of phytohormones and an accumulation of metabolites to regulate their growth [8,9,10,11]. Plants under stress can stimulate secondary messengers, which activate cellular signaling. This, in turn, triggers transcriptomic responses related to plant defense. These responses enable plants to adopt different strategies to cope with the effects of different stresses [12,13]. Tea plants are no exception to this rule. Lu et al. conducted an experiment on adult tea plant ‘Jinfeng’ by implementing different pruning times and heights. The transcriptome sequencing results showed that pruning depth regulates the phytohormone signaling of tea plant. The hormone contents of tea spring buds, such as IAA, GA1, and GA3, increased significantly, which in turn affected the development of the young buds of tea plants [14]. Sun et al. conducted a study on the effects of pruning on four tea plant species, namely ‘C. sinensis cv. Duanjiebaihao’ (DJBH), ‘Foxiang 1’ (FX1), ’Foxiang 4’ (FX4), and ‘Xueya 100’ (XY100), using transcriptomics technology. The results showed a significant up-regulation in the expression of EGCG, SCPL1A, which has a catalytic ability in the biosynthesis process, and LAR, which encodes leucoanthocyanidin reductase, in pruned tea plants [15]. Zhang et al. investigated the effect of pruning on ‘Wuyi Rock Tea’ using transcriptomics technology, and the results showed that pruning enhanced the gene expression of nine metabolic pathways, including fatty acid synthesis and carbohydrate metabolism, nitrogen metabolism, endoplasmic reticulum protein processing, and phytohormone signaling in tea, thereby promoting the growth of tea plants and increasing tea yield. Pruning promotes the growth and development of tea plants [4]. However, it is important to note that different varieties of tea plants require specific regulation to ensure optimal growth and tea quality.
The growth rate of shoots is closely related to the economic benefits of tea production [16]. Thus, selecting tea varieties that are well-suited for pruning has a significant impact on improving economic benefits. Most studies have focused on the effect of pruning methods on the growth of the same tea plant species in a given environment. However, the suitability of different tea plant varieties for the same pruning method has been rarely studied. In the study, we tried to investigate the effect of the same pruning method on the growth potential of different tea varieties under the same growing environment in order to screen out tea varieties with high resistance to pruning. Therefore, this experiment observed and compared 20 different varieties of tea plant pruning tree strength, new tip growth, and other indicators, selected the stronger growth potential of the ‘Zhongcha 302’ and the weaker ‘Emei Wenchun’ varieties for transcriptomic analysis, the suitability of pruning and regeneration capacity of tea plant research, and revealed the impact of pruning on the regeneration of new tips of different varieties of tea plant regeneration capacity and the internal control mechanism for the screening of suitable pruning of tea plant varieties, providing a theoretical basis for the selection of suitable pruning tea plant varieties.

2. Materials and Methods

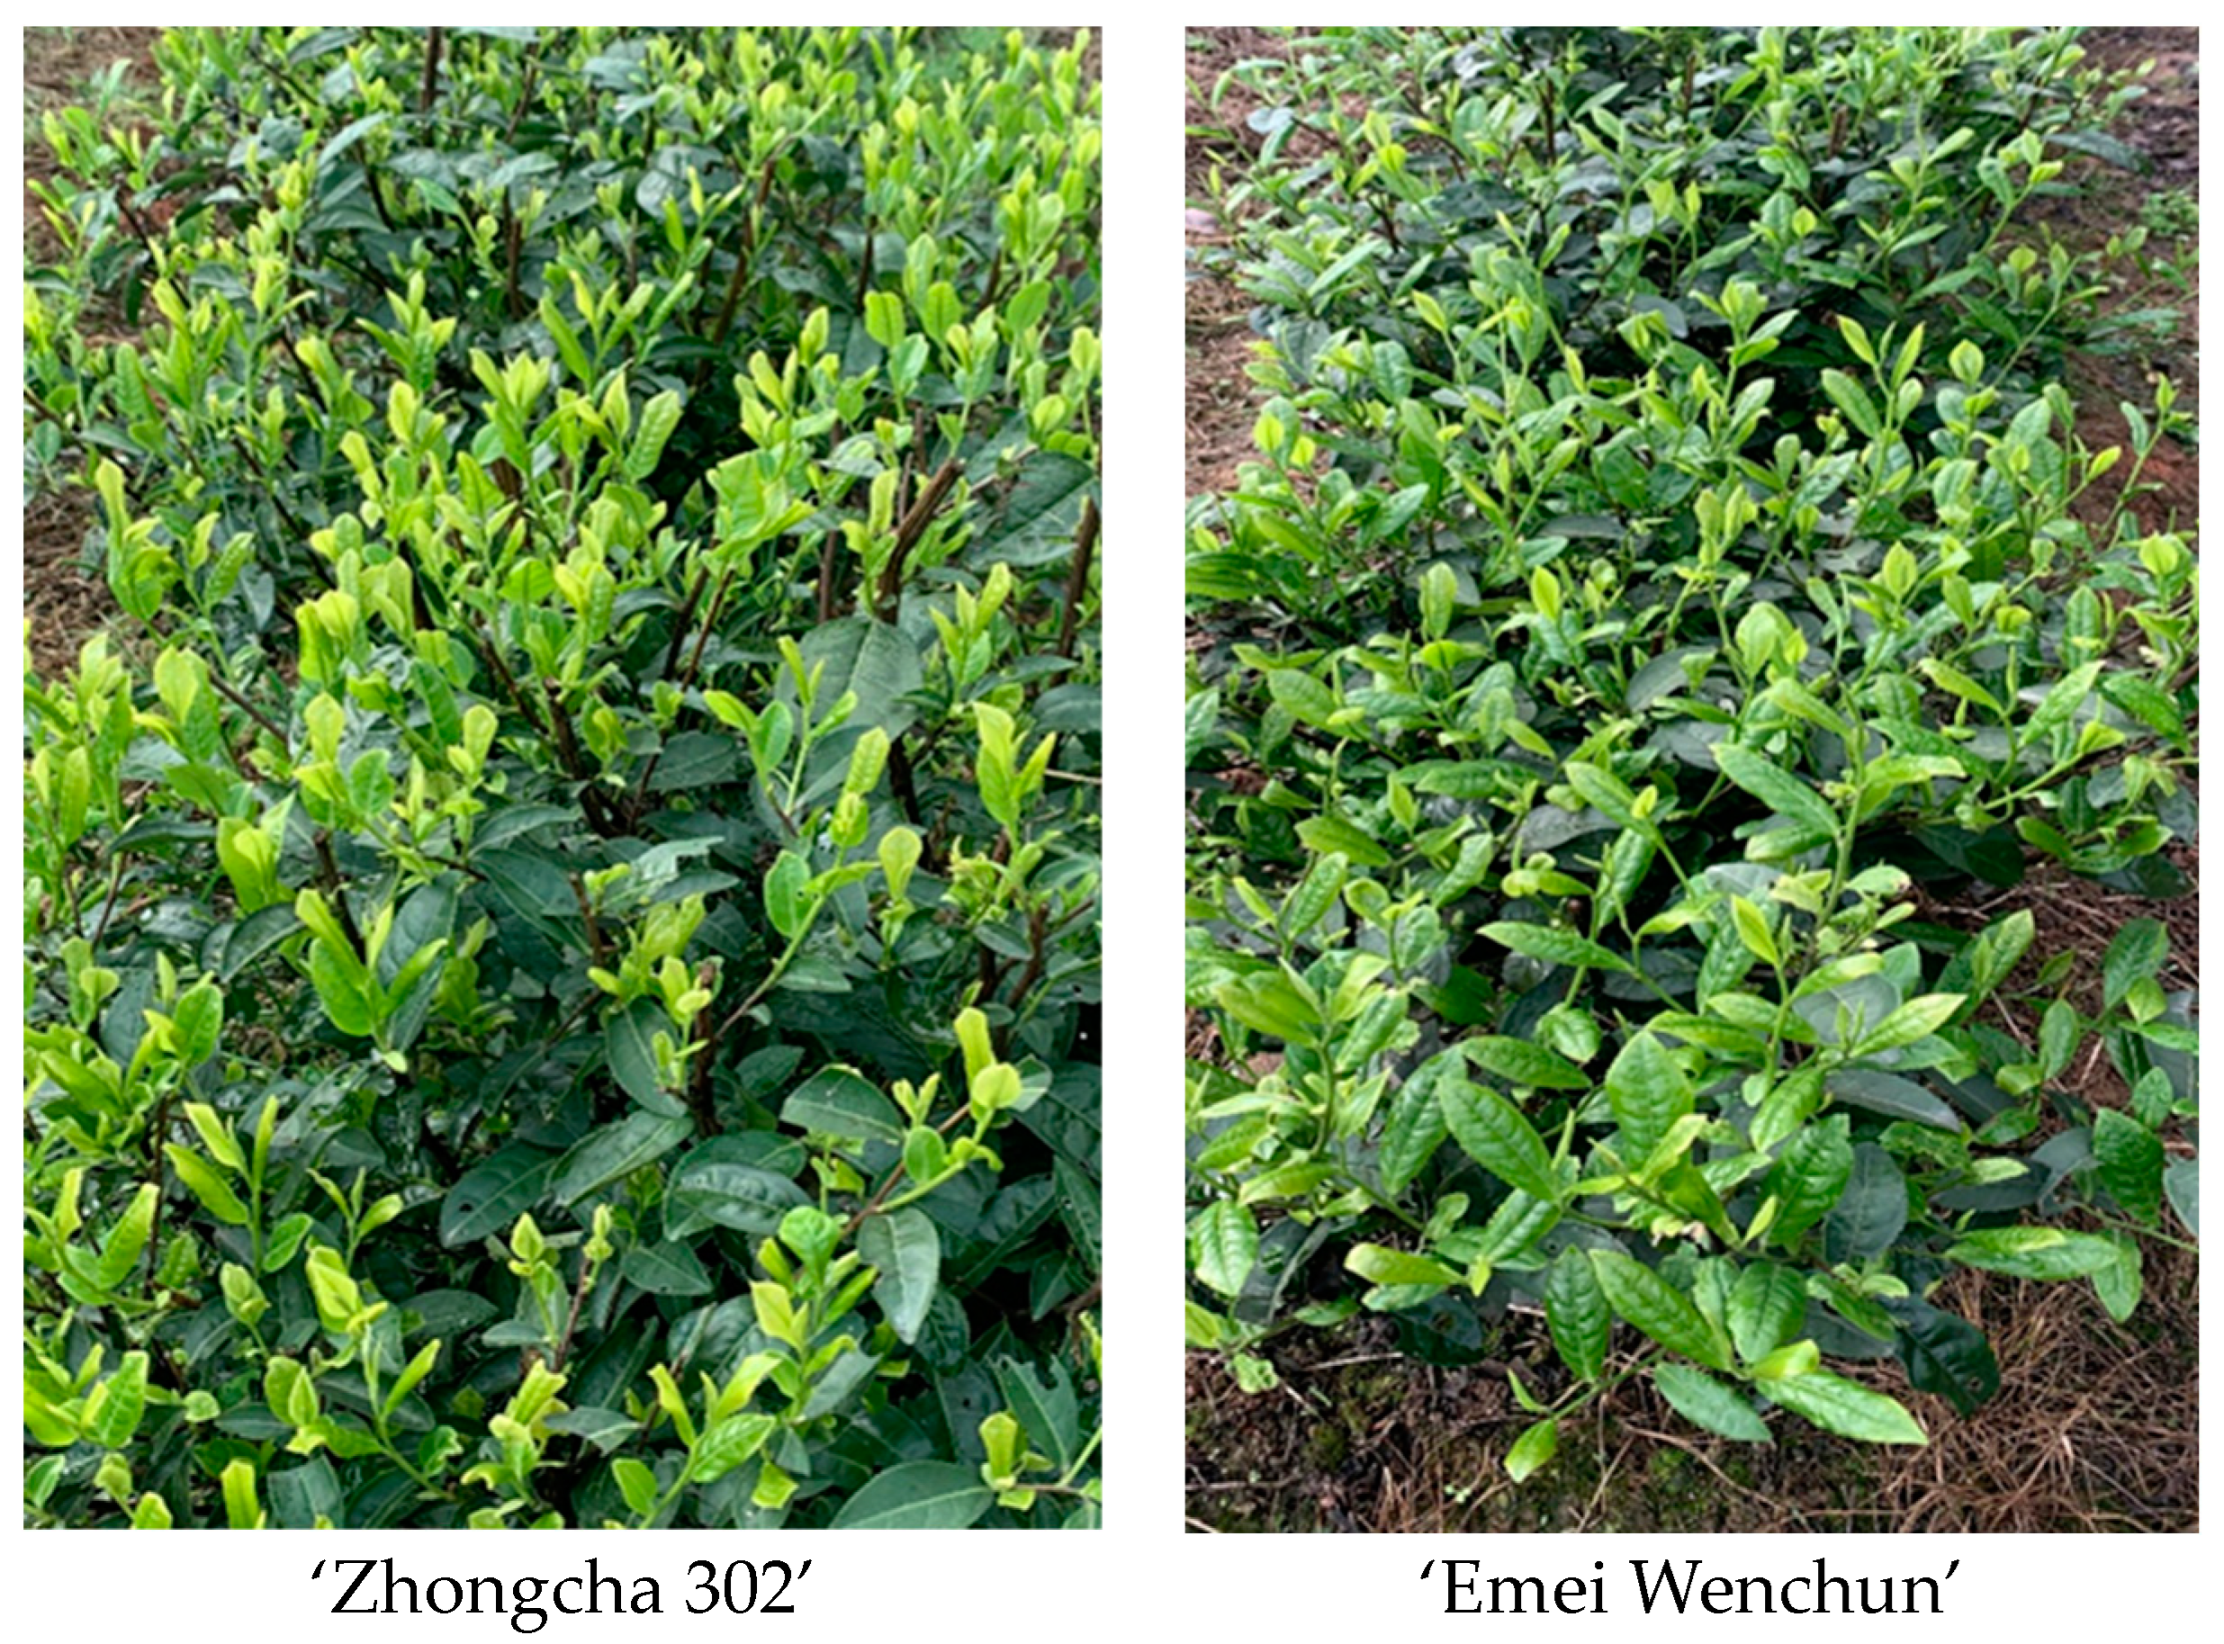
2.1. Plant Materials and Sample Preparation

The tea plants were obtained from the experimental base of Sichuan Yizhichun Tea Co(Leshan, Sichuan, China.).There were 20 varieties of ‘Fuding Dabaicha’ (FD), ‘Zhongcha 302’ (ZC302), ‘Chuanmu 217’ (CM217), ‘Chuancha 2’ (CC2), ‘Emei Wenchun’ (EW), ‘Zizhu’ (ZZ), ‘Zijuan’ (ZJ), ‘Huangyazao’ (HYZ), ‘Zhongcha 108’ (ZC 108), ‘Dangui’ (DG), ‘Chuancha 3’ (CC3), ‘Zhong cha 102’ (ZC102), ‘Mabianlv 1’ (MBL 1), ‘Xiangshanzao’ (XSZ), ‘Jianhexiangcha’ (JH), ‘Huangjingui’ (HJG), ‘Taicha 2’ (TC2), ‘Ziyan’ (ZY), ‘Mingke 1’ (MK1), and ‘Chuanmu 28’ (CM28). Adopting conventional cultivation techniques for management, the tea plants exhibited good growth potential.
The trial consisted of two treatments: (1) In May 2022, heavy pruning was carried out on 20 different varieties of tea plants, with approximately 15 plants of each variety in a row. No further treatments were conducted during this time. (2) In the same year, all the new growth was collected and the length was measured. According to the data of the length, we identified the varieties with a stronger birth growth index and the weaker ones. (3) Three independent biological replicates were collected in March 2023 from standardized one bud and two leaves of the two varieties screened during the tea plant germination period. Buds were immediately frozen in liquid nitrogen for subsequent transcriptome sequencing, and all samples were stored in a −80 °C cryogenic refrigerator prior to transcriptome analysis.

2.2. Measurement of Shoot Growth Parameters

In October 2022, all new shoots of tea plant growth were cut using a tea plant pruning machine. Subsequently, the height (highest branch tip) and amplitude of 10 randomly selected new shoots were measured for each variety of tea plants. The weight and count of the new shoots were also recorded. The average value was then taken as the height and width of the tree in centimeters. For each variety of tea plant, six trees were selected at random, and the number of branches, their length, the number of branches with sub-branches, and the total number of branches were recorded.

2.3. Statistical Analysis

The data were analyzed using Excel and IBM SPSS Statistics 23. The differences in the various indicators of growth of different tea plant cultivars were analyzed using one-way analysis of variance (ANOVA), with a significance level set at p < 0.05. To further elucidate biological significance, transcriptome data were analyzed using the Kyoto Encyclopedia of Genes and Genomes (KEGG) database. All experiments were repeated three times.

2.4. Transcriptomic and Bioinformatic Analyses

RNA isolation and sequencing were conducted by Wuhan Met Ware Biotechnology Co., Ltd. (Wuhan, China). In brief, the total RNA was extracted, enriched, and fragmented. The short fragments were obtained, reverse transcribed into cDNA, and then synthesized into second-strand cDNA. The resulting double-stranded cDNA was purified using DNA purification beads. Next, the purified cDNA was subjected to end repair, A-tailing, and ligation to sequencing junctions. Fragment size selection was performed using DNA purification beads, followed by PCR enrichment to obtain the final cDNA libraries. Following the completion of library construction, the quality of the libraries was tested. Once the libraries passed inspection, they were pooled based on the target downstream data volume and sequenced used the Illumina platform. The downstream data underwent filtering to obtain clean data. This was then compared to the specified reference genome. The mapped data were used for structural analysis, such as variable splicing analysis, new gene discovery, and gene structure optimization. Additionally, they were used for expression level analysis, including differential expression analysis, functional annotation of differentially expressed genes, and functional enrichment. The expression of genes in different samples or groups was analyzed.
The genome of ‘Tieguanyin’ [17] was analyzed using HISAT2.2.4 with the ‘-rna-strandness RF’ parameter set as default. Mismatches were allowed using the default parameters. Transcript reconstruction was performed using StringTie v1.3.1 software [18]. The gene expression level was normalized using the fragments per kilobase of transcript per million mapped reads (FPKM) method and StringTie v1.3.1 software. DESeq2 was used to identify the differentially expressed genes (DEGs) in the RNA-seq dataset based on read counts, with a threshold of |log2 fold change| > 1 and FDR < 0.05 [19]. A hypergeometric test was used to define significantly enriched KEGG pathways in all genes compared to the genome background.

3. Results

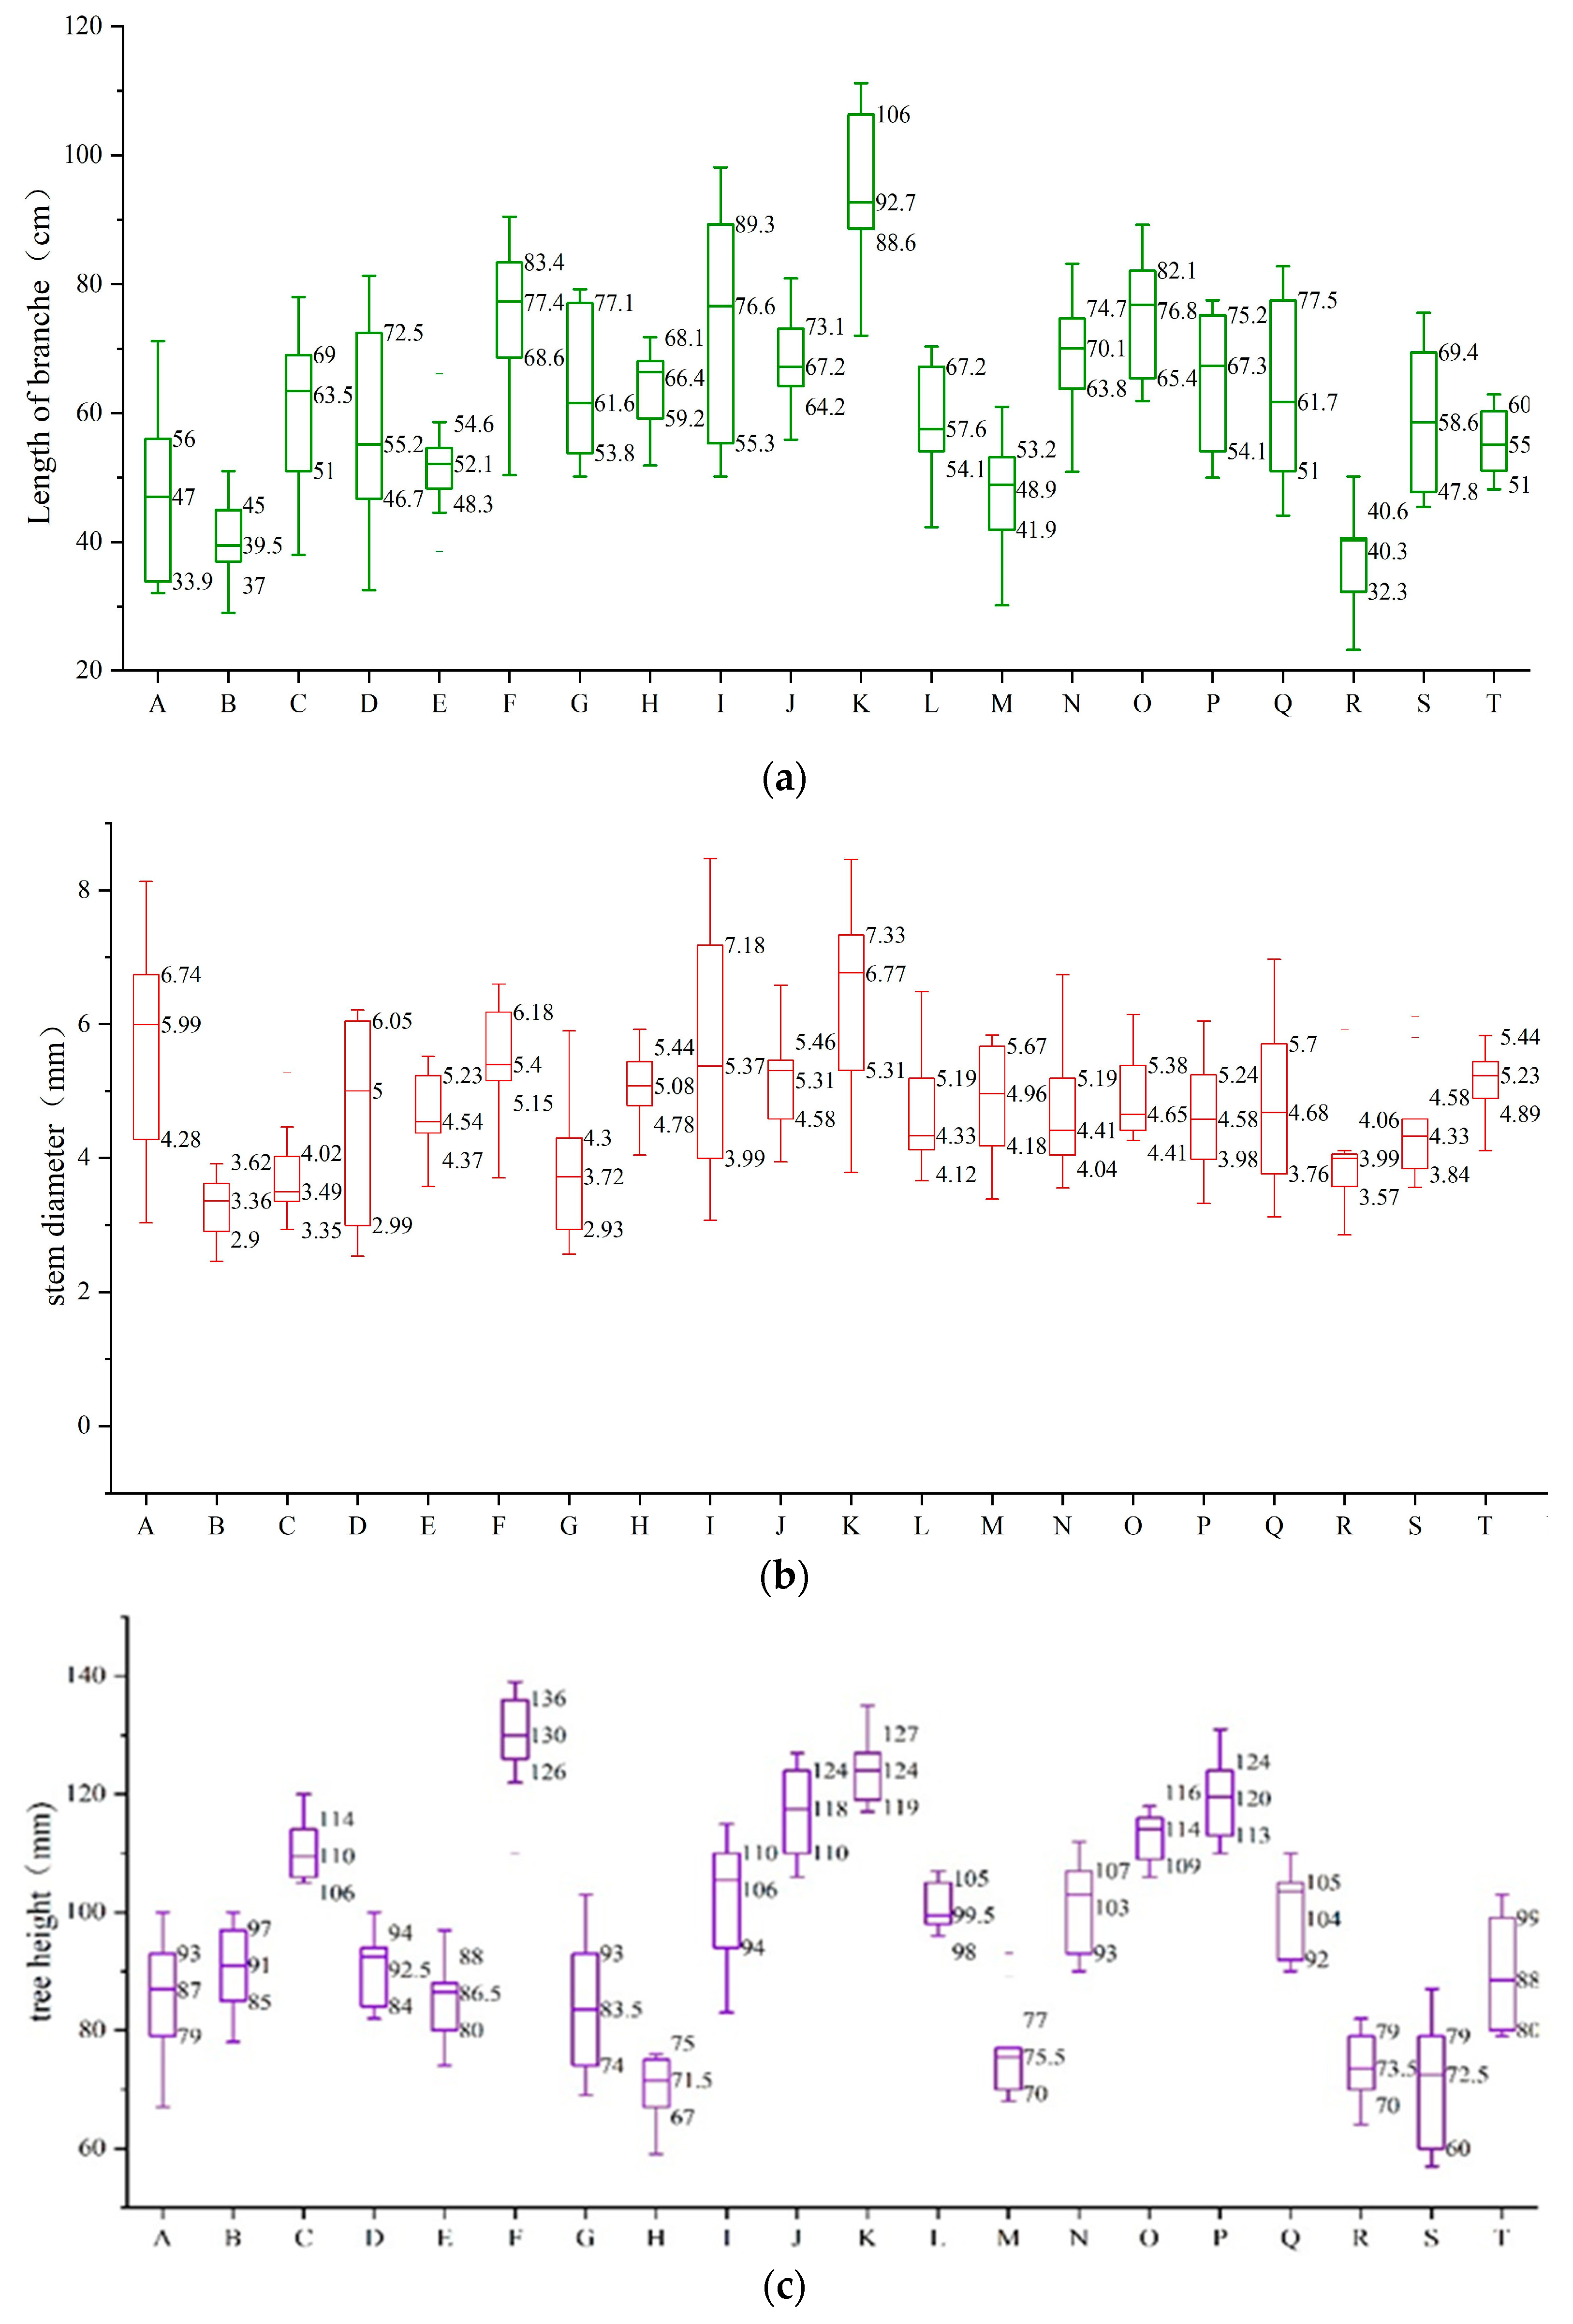
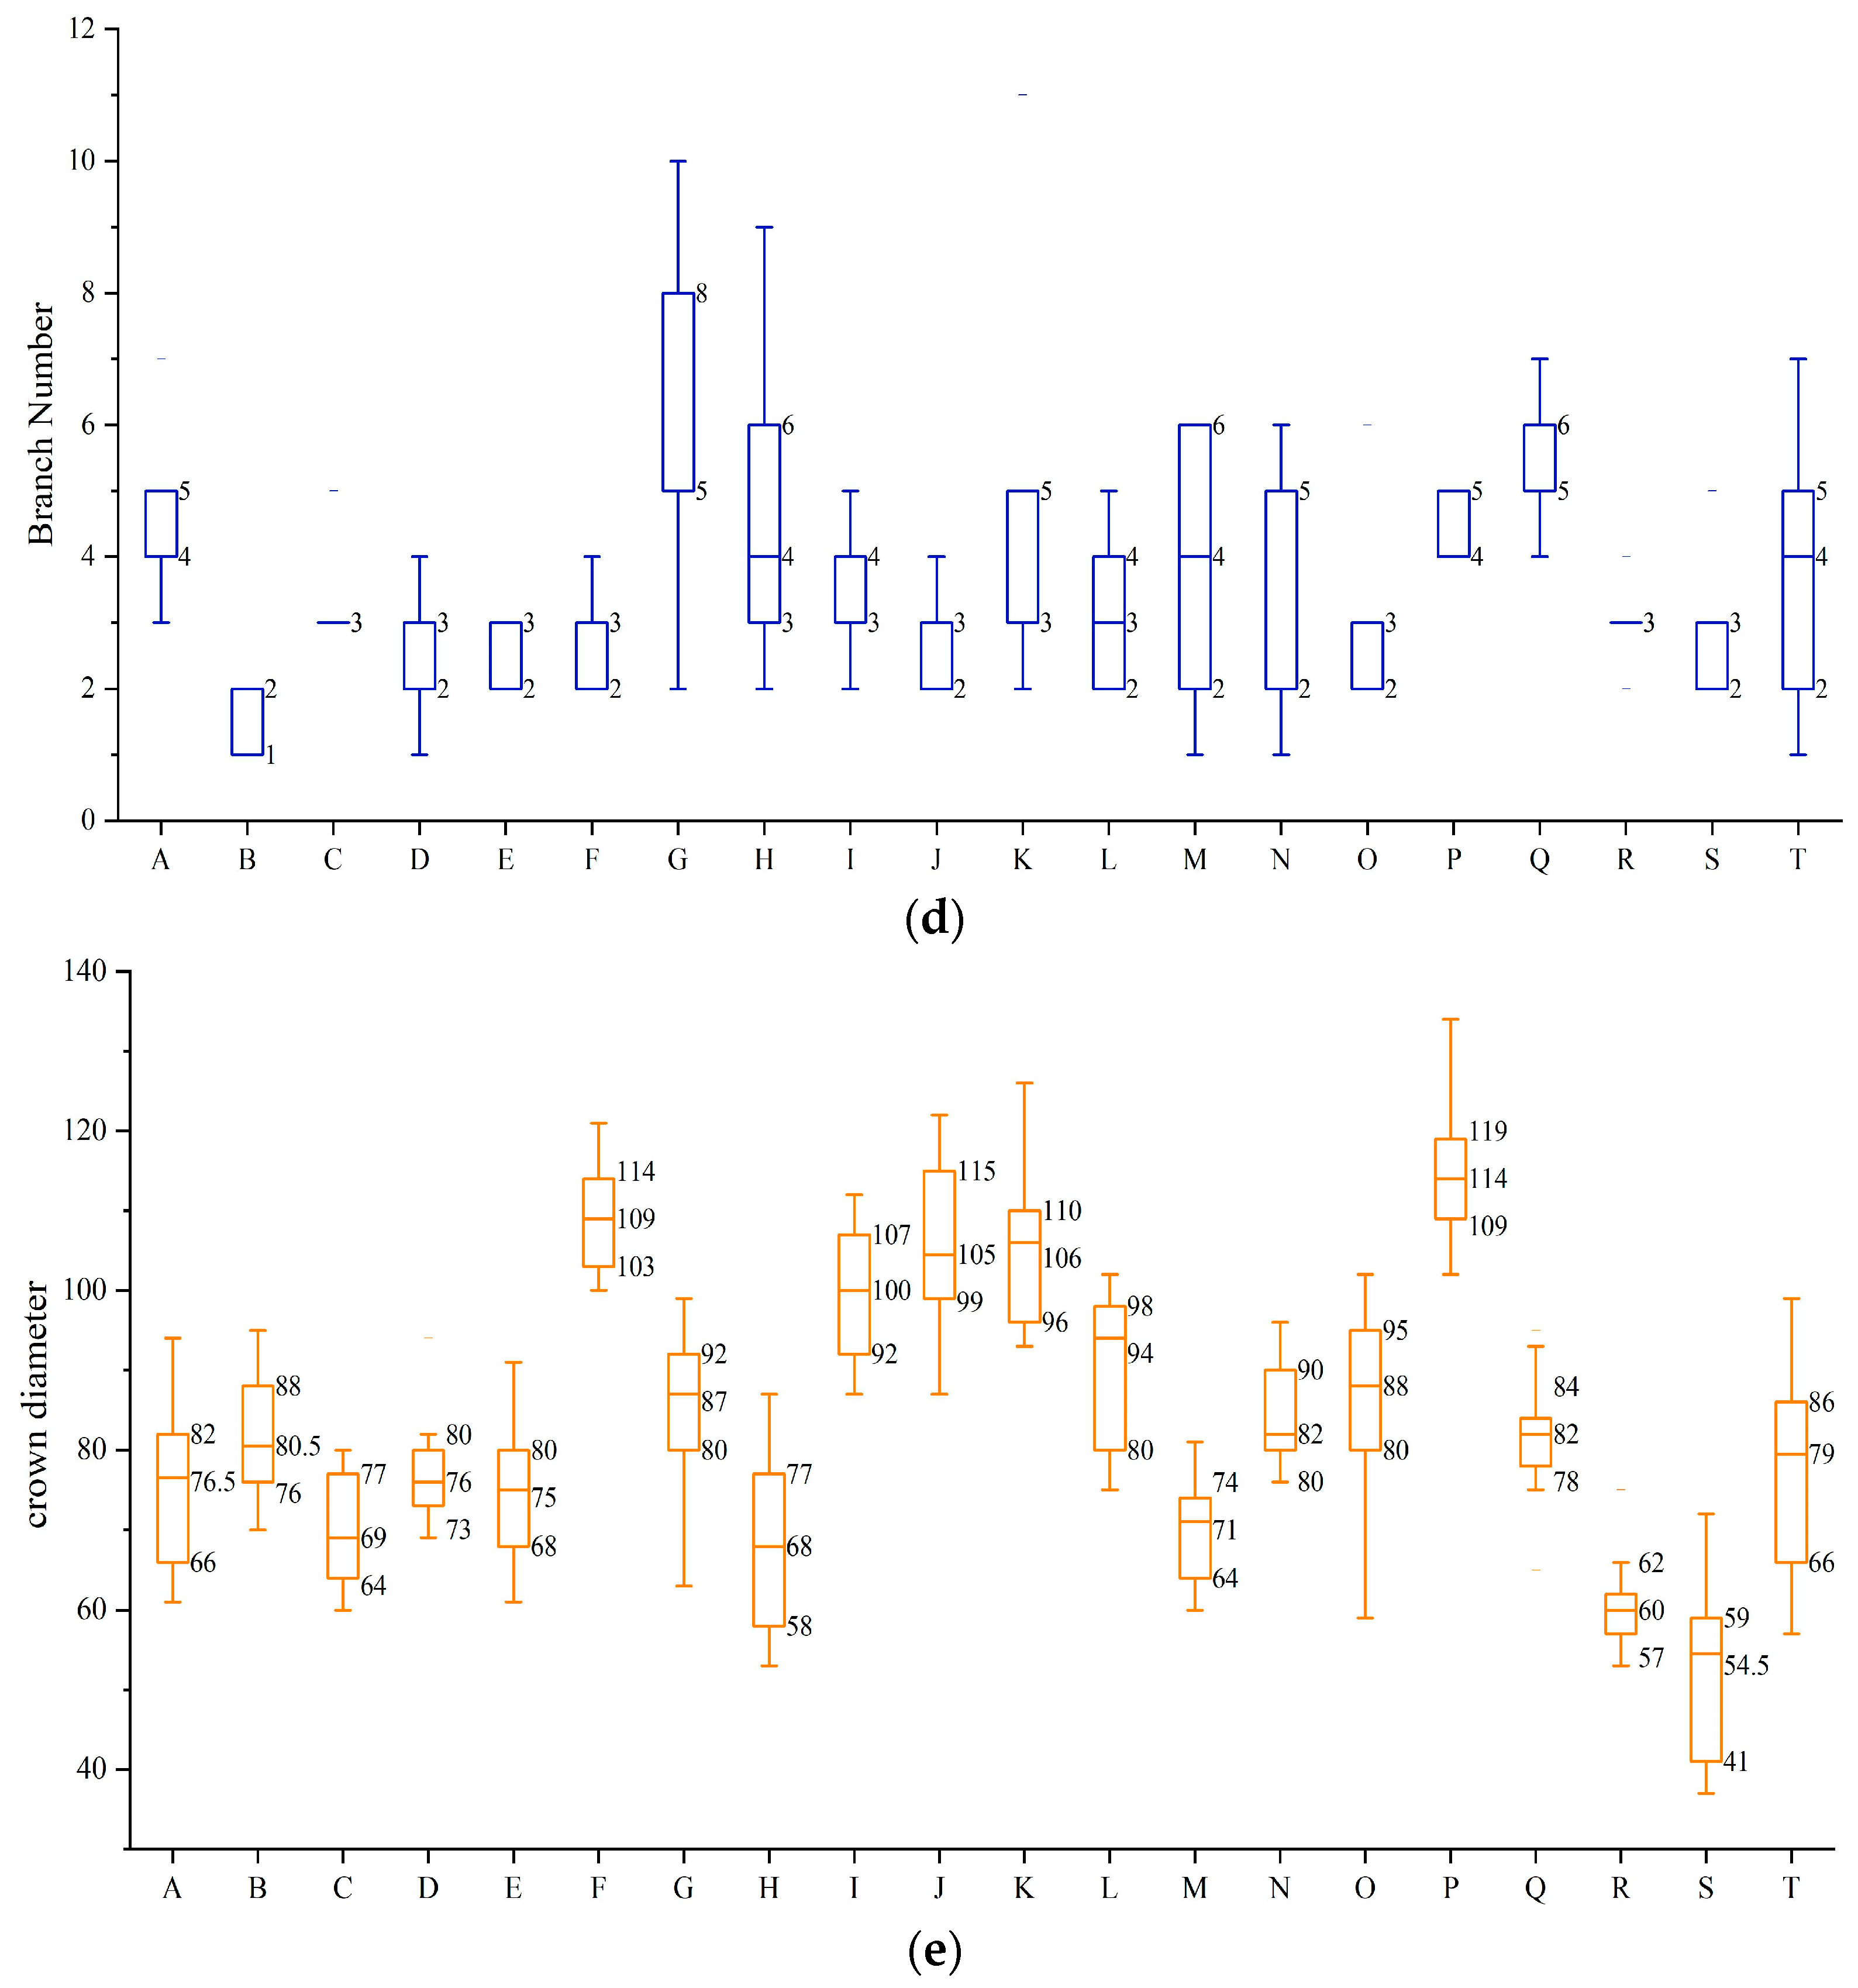
3.1. The Growth of the Shoots after the Pruning Was Measured in 20 Different Varieties of Tea Plant Cultivars

Observing the tree strength indexes for the test varieties revealed differences in each index. In regard to tree height, tree width, number of branches, and stem diameter, ‘Chuancha 3’ and ‘Zhongcha 302’ were the only varieties that exceeded 120 cm in height. For trees with a width above 100 cm, the recommended tea varieties are ‘Chuancha 3’, ‘Xiang shanzao’, ‘Zhongcha 302’, and ‘Zhongcha 108’. Branch numbers above 33 include ‘Purple Azalea’, ‘Huangyazao’, ‘Chuancha 3’, and ‘Zhongcha 108’. The following tea varieties have more than 33 branches: ‘Zi Juan’, ‘Huangyazao’, ‘Chuancha 3’, ‘Zhongcha 302’, ‘Zhongcha 108’, and ‘Ziyan’. Stems with a thickness of 5.50 mm or greater are classified as ‘Zhongcha 302’, ‘Zhongcha 108’ or ‘Mingke 1’. After a comprehensive analysis of all the data, it was found that ‘Zhongcha 302’ was dominant in all four indicators, and ‘Emei Wenchun’ performed poorly in all traits (Table 1 and Figure 1).
In March of the following year, the shoots of ‘Zhongcha 302’ and ‘Emei Wenchun’ were measured. The pictures of spring shoots and buds in the following year after heavy pruning treatments are shown in Figure 2. In the stage of one bud and two leaves, the average shoot diameter of ‘Zhongcha 302’ was 2.23 mm, which was higher than that of ‘Emei Wenchun’ (1.732 mm). The average shoot length of ‘Emei Wenchun’ was 13.48 cm, which was significantly higher than that of ‘Emei Wenchun’ (8.1 cm). The average germination density and the length of two leaves and one bud of ‘Emei Wenchun’ were 46.4 cm and 5.62 cm, respectively, values lower than those of ‘Zhongcha 302’. The mean values of each index data of ‘Zhongcha 302’ were higher than those of ‘Emei Wenchun’, indicating that its growth potential and regeneration capacity were better than those of ‘Emei Wenchun’ and more suitable for pruning (Figure 1 and Figure 3).

3.2. Transcriptome Data Analysis of Two Tea Plant Cultivars

ZC302, ZC302CK, EW, and EWCK yielded 46.59–52.6 million, 42.91–48.17 million, 43.8–49.35 million, and 48.91–53.99 million RNA-seq clean reads, respectively. The percentage of quality score (Q30) was greater than 92% and the GC content of each clean data was greater than 43%. Read-to-reference genome mapping was greater than 89% (Table 2).

3.2.1. Overall Distribution of Gene Expression in Young Tea Shoots of ‘Zhongcha 302’ and ‘Emei Wenchun’

The gene expression level was measured using FPKM [20]. The number of mapped reads and transcript length of 12 samples of pruned ‘Zhongcha 302’ and ‘Emei Wenchun’ shoots were normalized. The box plot and violin plot were prepared. The box plot indicates that the dispersion of gene expression in the 12 samples was consistent. The five numerical points, including the maximum, upper quartile, median, lower quartile, and minimum of gene expression, were compared from top to bottom. The results showed that these indices were consistent across the three biological replicates of the same treatment. In addition, the median of gene expression in the 12 samples was relatively close (Figure 4a). In addition to the probability density of gene distribution shown in the violin diagram, it is evident that the concentrated regions of gene distribution in each sample are relatively close to the overall distribution trend (Figure 4b). The PCA score plot of RNA-seq data is shown in Figure 4c, and the first two principal components (PC) accounted for 64.9% of the total variance (PC1 = 40.36%, PC2 = 17.72%). ZC302 was close to ZC302, both of which were clearly discriminated from other pruning treated samples at the direction of PC1 (Figure 4c). In summary, the degree of dispersion of gene expression in the 12 samples closely matched the distribution density of genes at each location, meaning that the differences in overall expression levels of genes treated under the conditions of this experiment were controllable within the range, meeting the requirements for subsequent gene screening.

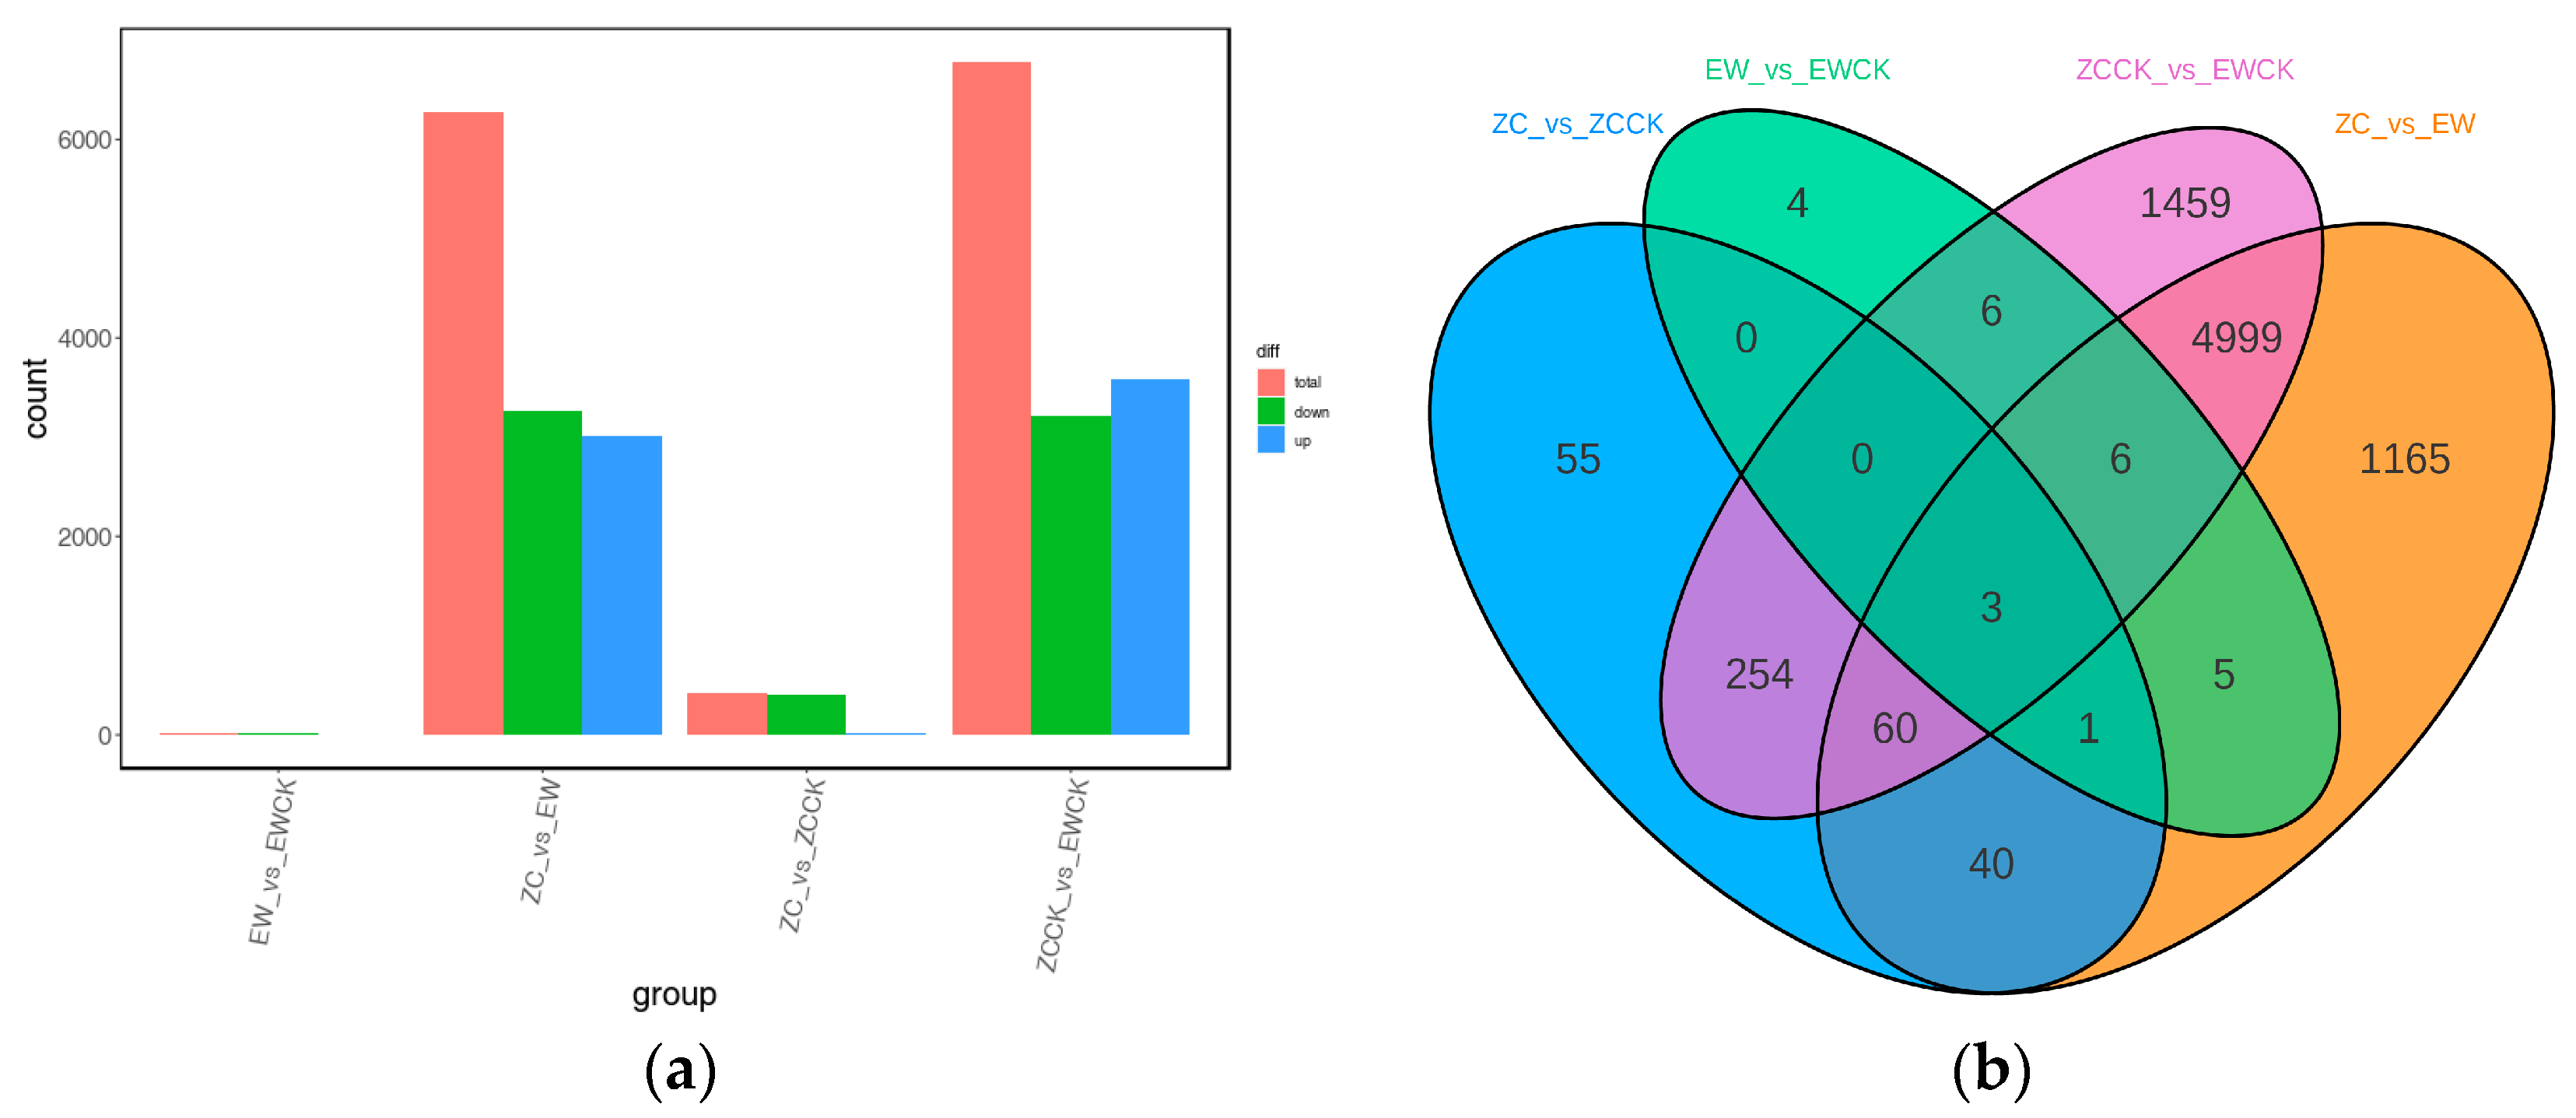
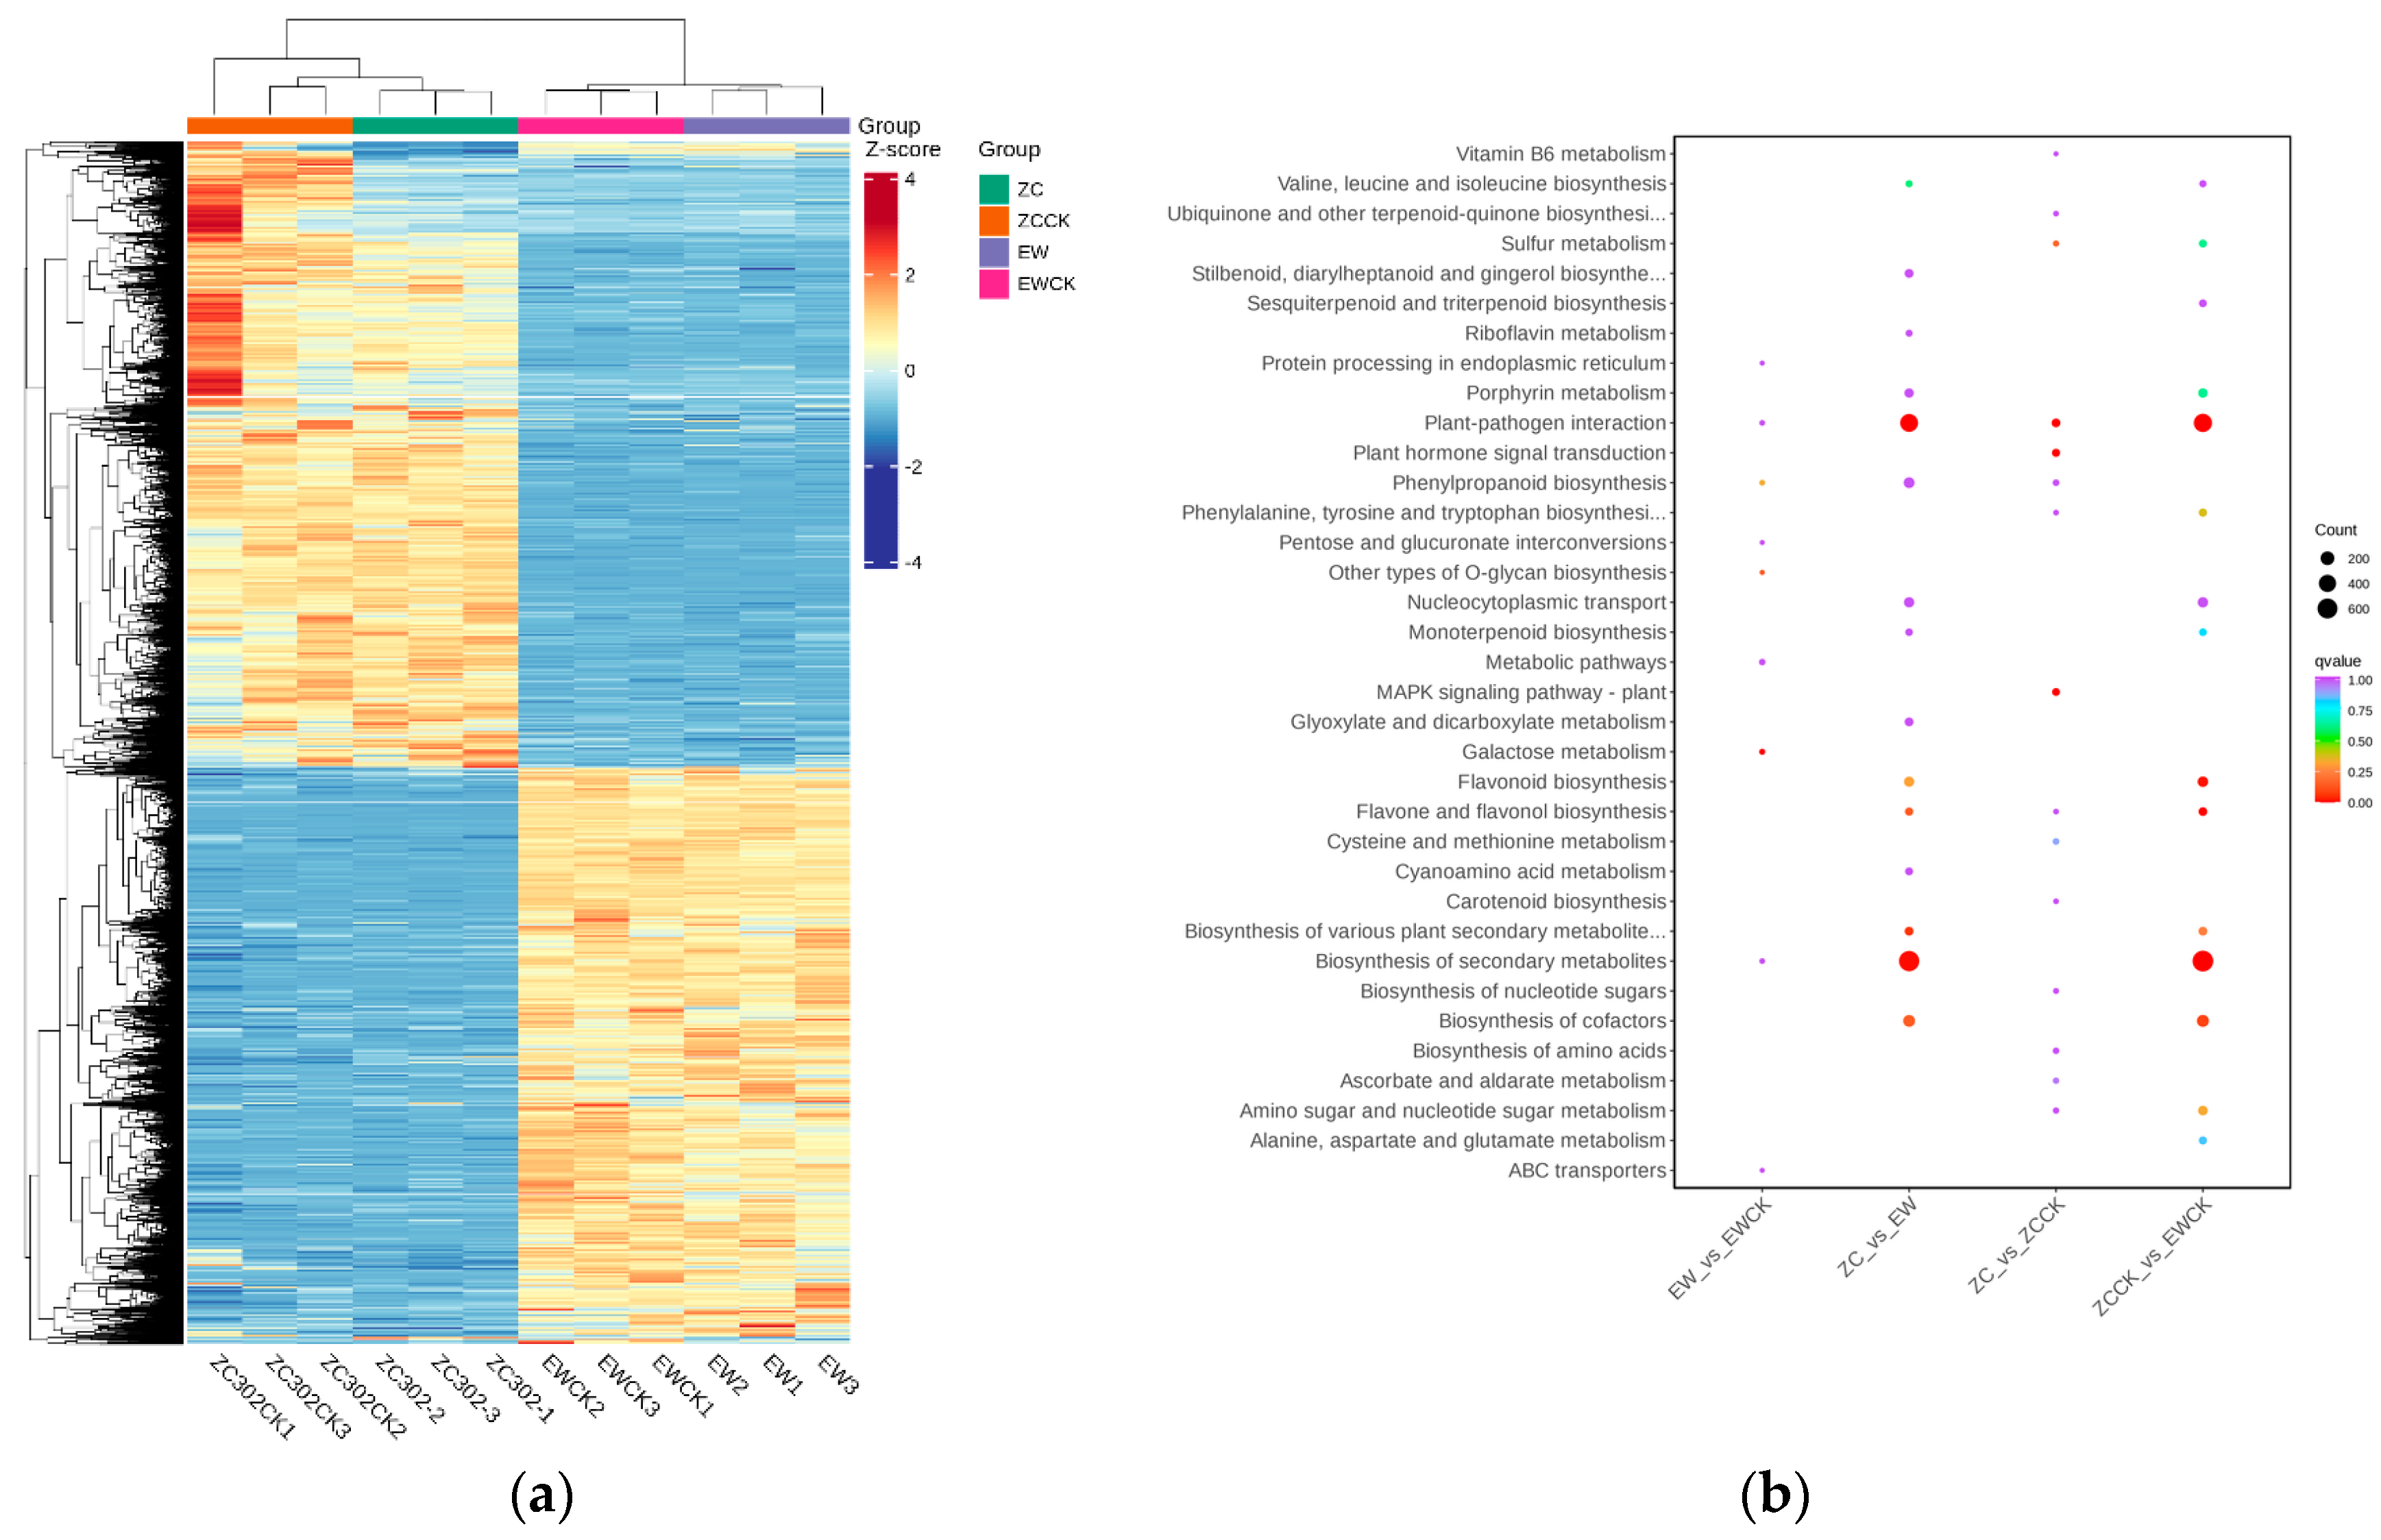
3.2.2. Differential Gene Expression Analysis

The DEGs identified in the pruned shoots of ‘Zhongcha 302’ and ‘Emei Wenchun’ are shown in Figure 5a. In the groups of ZCCK vs. EWCK, there were 6787 DEGs in the dataset (3576 up-regulated and 3211 down-regulated DEGs). As for ZC vs. EW, there were 6279 DEGs in the dataset (3018 up-regulated and 3261 down-regulated DEGs), and 413 DEGs in the dataset of ZC vs. ZCCK (16 up-regulated and 397 down-regulated DEGs). Finally, in group of EW vs. EWCK, 25 DEGs were found (8 up- and 17 down-regulated DEGs). The Venn diagram shows three common DEGs for the four gene sets and good clustering of DEGs in the four GEO datasets (Figure 5b).

3.2.3. KEGG Pathway Enrichment Analysis

KEGG pathway enrichment was used to analyze the enrichment pathways of DEGs. Figure 6 displays the enrichment pathways. The ZC and EW groups, as well as the EWCK and ZCCK groups, were enriched with more pathways than the other pruning groups. These pathways include metabolic pathways such as plant–pathogen interactions, biosynthesis of secondary metabolism, vitamin metabolism, biosynthesis of ubiquinone and other terpene quinones, and biosynthesis of amino acids (Figure 6b). The most significantly enriched pathways were those of the ZCCK and EWCK groups, followed by those of the ZC and EW groups. All four transcriptome datasets identified cytochrome P450 family genes involved in the synthesis, catabolism, and production of most phytohormones and many secondary metabolites [21].
In the transcriptome data of ‘Zhongcha 302’, the expression levels of CYP4, CYP19 and other CYP450 family genes were significantly higher than those of ‘Emei Wenchun’. This difference may be one of the reasons why the new shoot growth rate of ‘Zhongcha 302’ was faster than that of ‘Emei Wenchun’. The CYP450 family genes regulate the synthesis of plant hormones in ‘Zhongcha 302’, promoting the rapid growth of new shoots.
Among the various plant hormones, abscisic acid (ABA) acts as an inhibitor of plant growth [22]. The 9-cis-epoxycarotenoid dioxygenase (NCED) is a crucial enzyme in the biosynthesis pathway of abscisic acid (ABA). It acts as a rate-limiting step by cleaving 9-cis-epoxycarotenoids into xanthophyll aldehydes, which then form abscisic acid aldehydes, and ultimately abscisic acid [23]. It has been reported that methylnaphthoquinone is involved in abscisic acid biosynthesis in pruned tea plants, and the NAD(P)H gene encodes methylnaphthoquinone [24]. Both genes were expressed in ‘Zhongcha 302’ and ‘Emei Wenchun’. However, the expression was slightly higher in ‘Emei Wenchun’, indicating a higher accumulation of abscisic acid. This may be one of the reasons for the slower growth of ‘Emei Wenchun’.

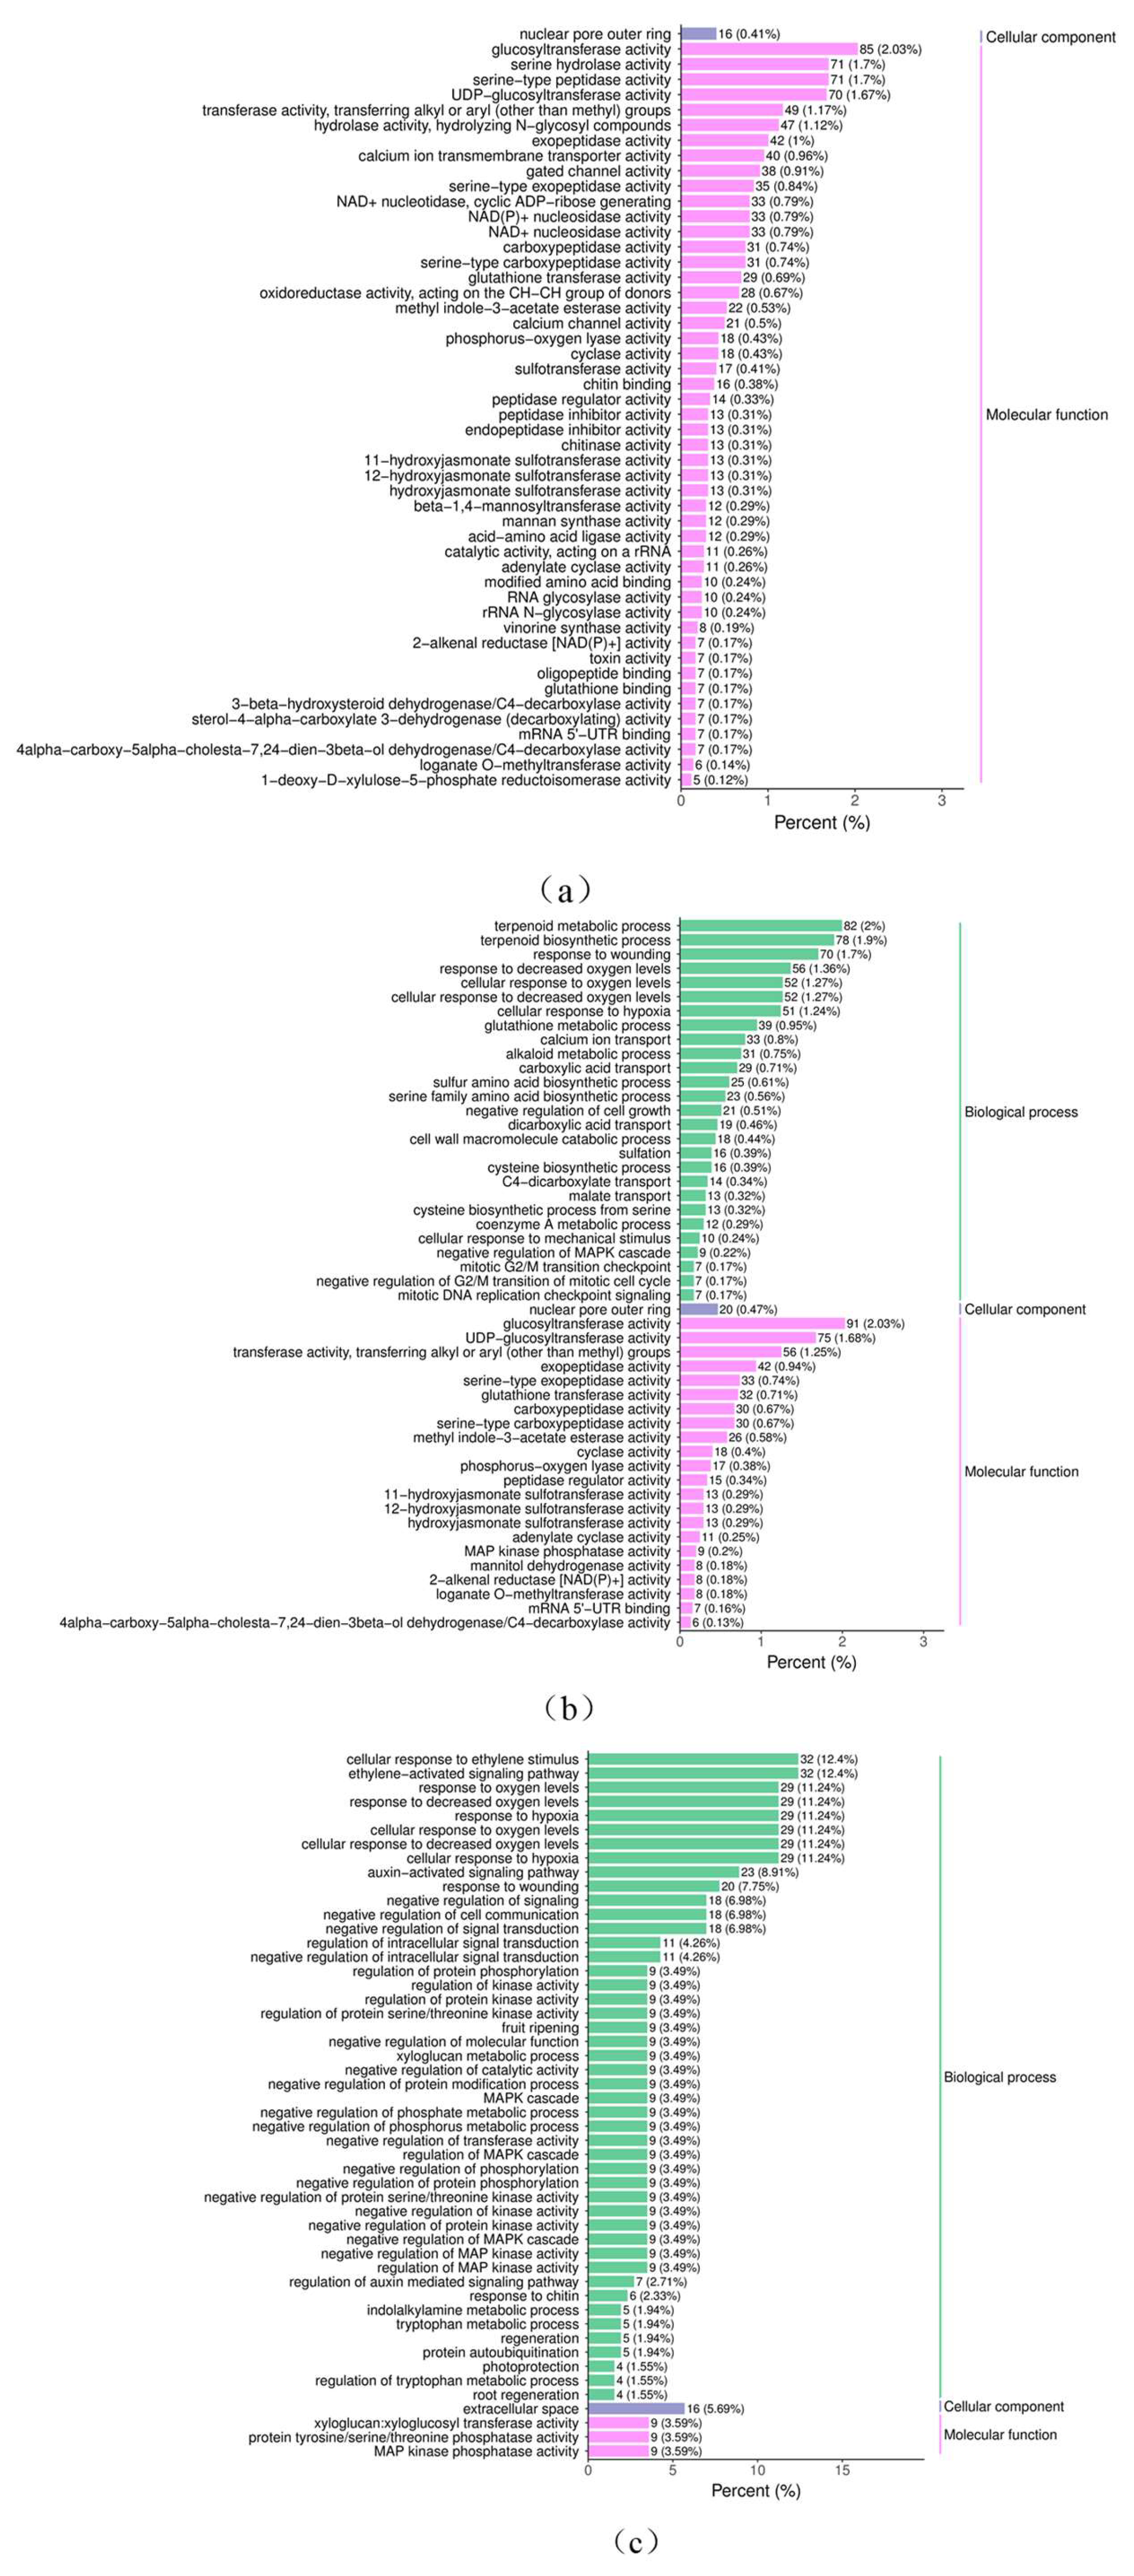
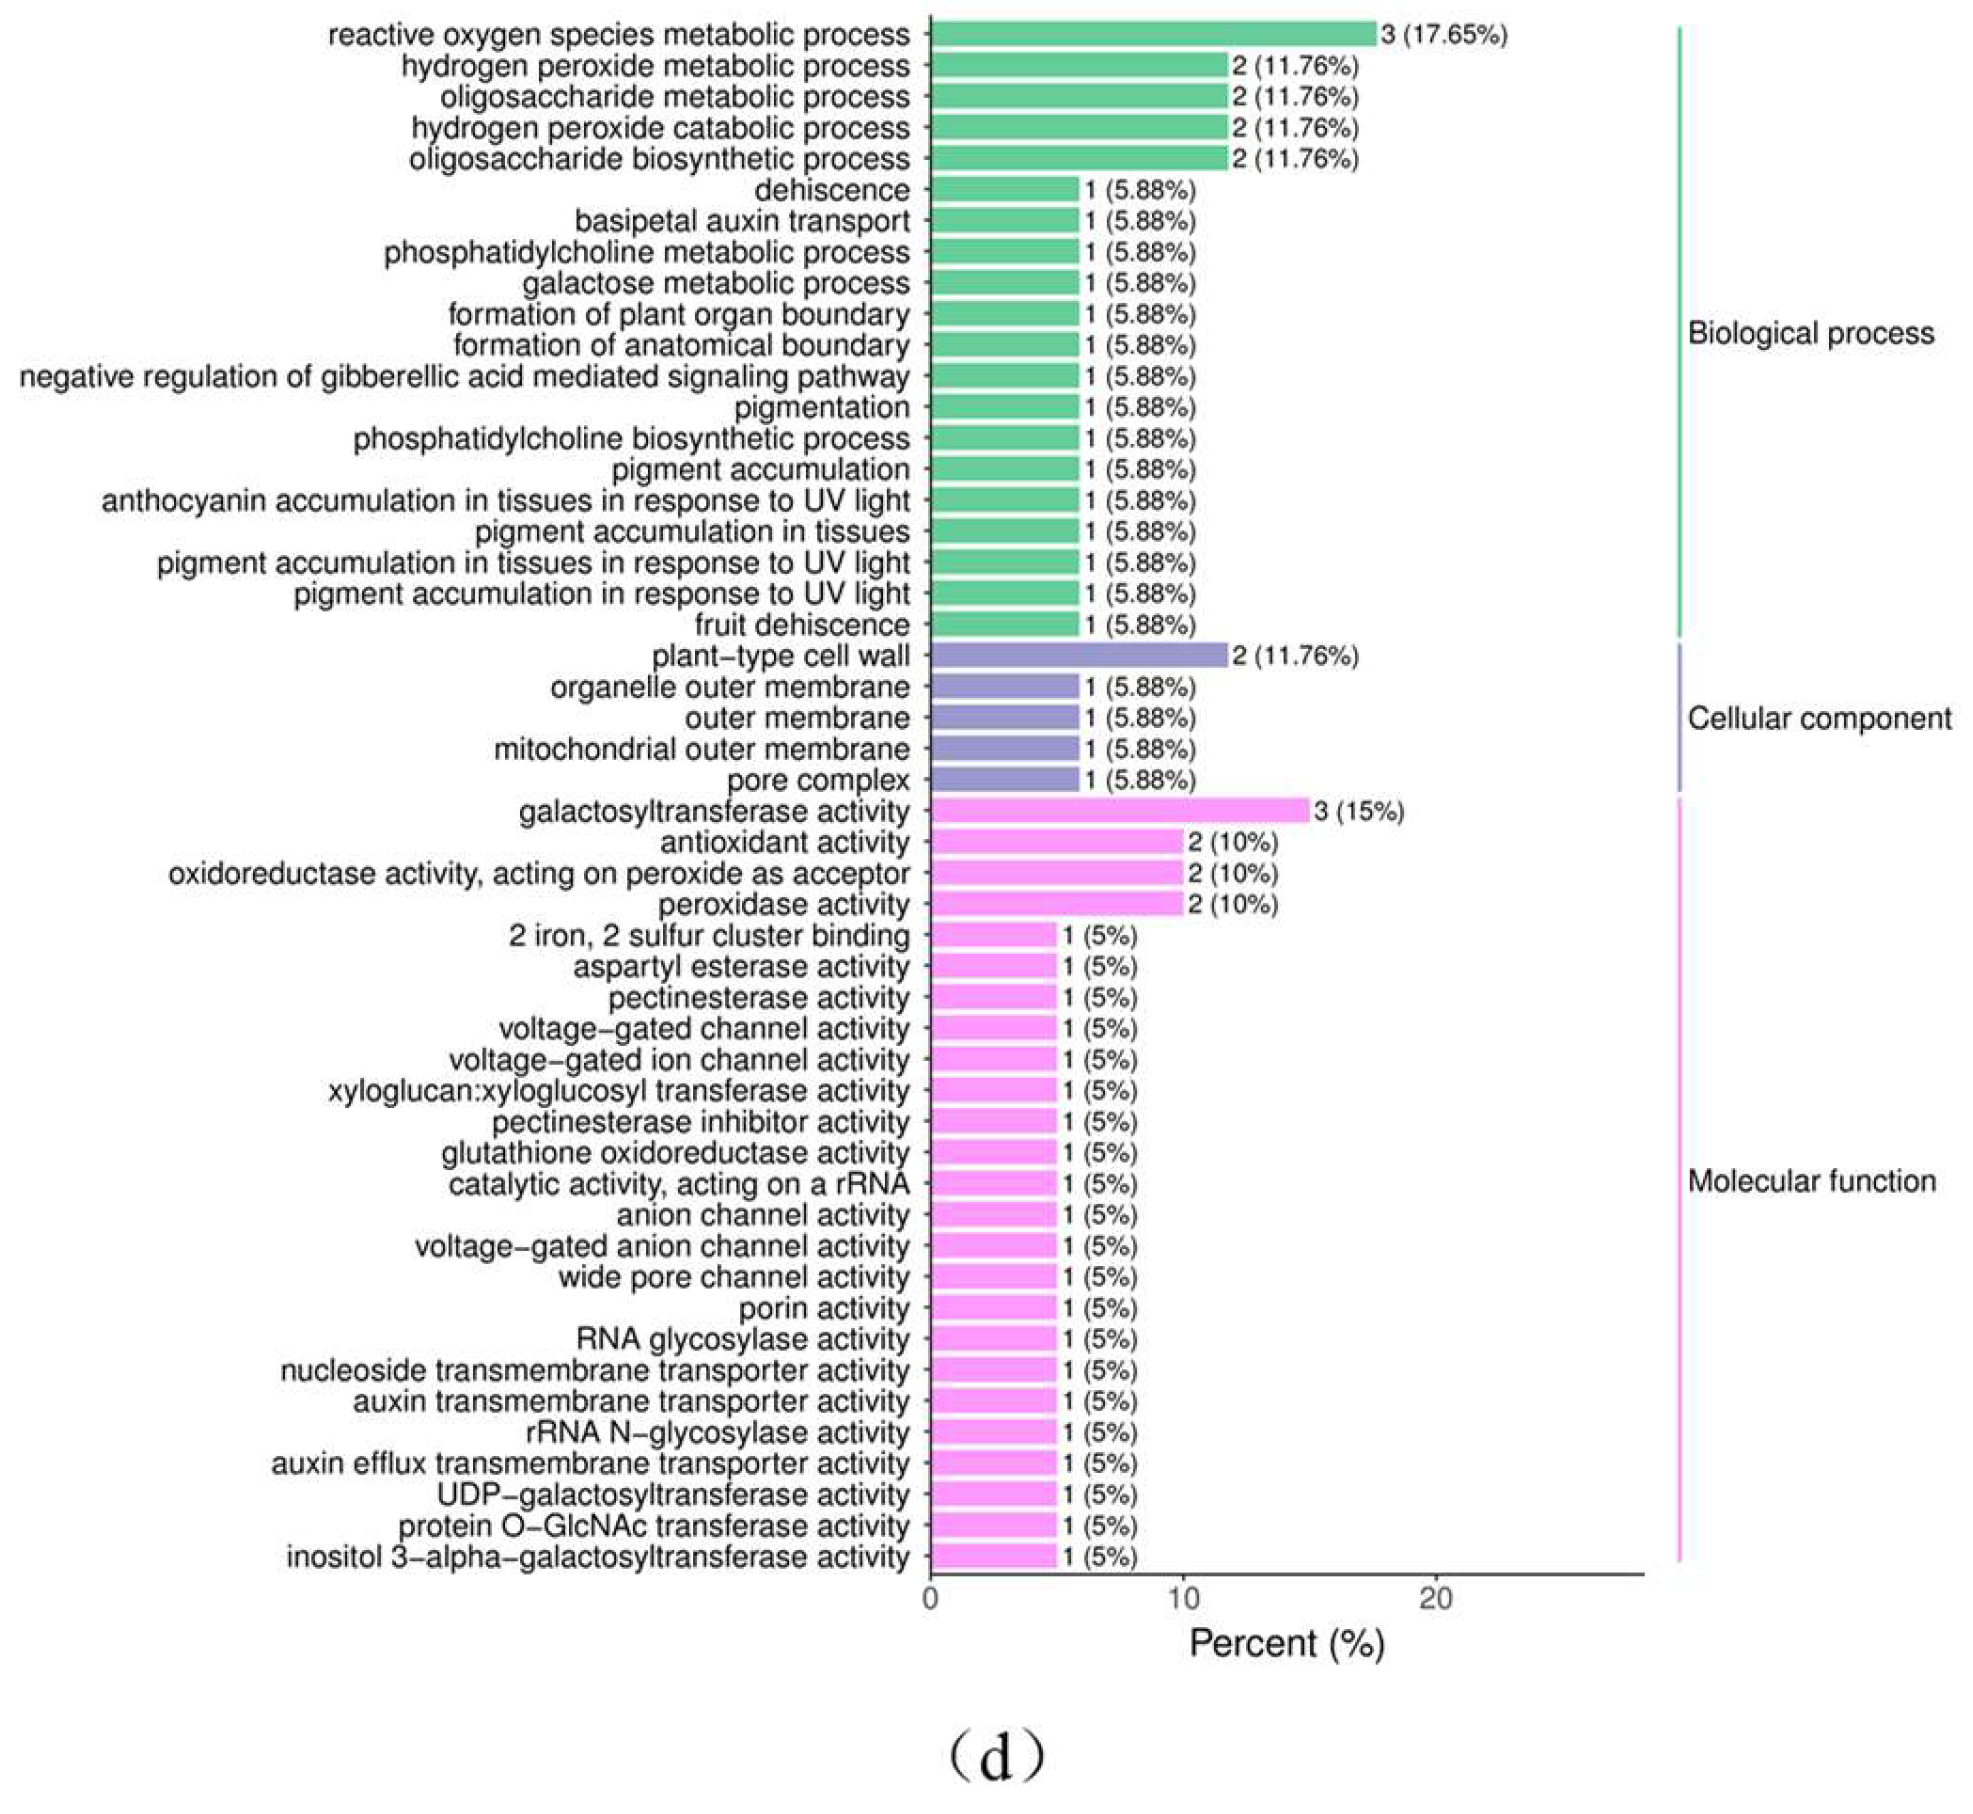
3.2.4. GO Enrichment Analysis

The Gene Ontology (GO) is an internationally recognized standard classification system for gene functions [25]. It defines and describes the functions of genes and proteins, and is divided into three categories: Biological Process (BP), Cellular Component (CC), and Molecular Function (MF). In this study, GO classification statistics were conducted on DEGs in the ‘Zhongcha 302’, ‘Emei Wenchun’, and control groups. The results are presented in Figure 7. The analysis of the results (Figure 7a) indicates that the differentially expressed genes in the ‘Zhongcha 302’ experimental group were mainly enriched in biological processes and molecular functions ontology compared with the ‘Emei Wenchun’ experimental group. Specifically, genes were mainly enriched in ‘biological process’ and ‘metabolic process’ in the biological process ontology, and in ‘protein binding’ and ‘catalytic activity’ in the molecular function ontology. Figure 7b shows that the enrichment of differentially expressed genes in ZCCK compared to EWCK was similar to that in the ‘Zhongcha 302’experimental group compared to the ‘EW’ experimental group. Both were enriched mainly in biological processes and molecular functions. Figure 7c shows that the differentially expressed genes of ZC compared to ZCCK were mainly enriched in biological processes and molecular function ontology. The genes were mainly enriched in ‘biological processes’ and ‘stimulus response’ in the biological process ontology, and in ‘protein binding’ and ‘catalytic activity’ in the molecular function ontology. As shown in Figure 7d, the differentially expressed genes were mainly enriched in the biological processes and molecular function ontology, such as metabolic processes and catalytic activity, as well as biological processes and protein binding.

3.2.5. Column Chart of the Differential Gene GO Enrichment Analysis

Following the screening of differential genes based on the experiment’s purpose, enrichment analysis was conducted to examine the distribution of differential genes in GO analysis. This was performed to clarify the expression of sample differences in gene function. The 50 GO terms with the lowest q-value in the enrichment analysis results were used to create a column chart of enrichment items (Figure 8). Figure 8a shows that ‘glucosyltransferase activity’, ‘serine hydrolase activity’, and ‘serine-type peptidase activity’ were highly enriched compared to EW. There were 85, 71, and 71 differentially expressed genes enriched, respectively, accounting for 2.03% and 1.7% of the total DEGs. Figure 8b illustrates that ZCCK had a higher enrichment in the ‘terpenoid metabolism process’ and ‘glucosyltransferase activity’ compared to EWCK. Specifically, 82 and 91 differentially expressed genes were enriched, respectively, accounting for 2% and 2.03% of the total differentially expressed genes. As shown in Figure 8c, ZC was more highly enriched for cellular response to ethylene stimulus and ethylene-activated signalling pathways compared to ZCCK, both of which were enriched for 32 differentially expressed genes, both of which accounted for 12.4% of the total differentially expressed genes. Figure 8d shows that compared to EWCK, EW had a higher enrichment in ‘reactive oxygen species metabolic process and galactosytan sierase activity’. There were three differentially expressed genes enriched, accounting for 17.65% and 15% of the total differentially expressed genes. In conclusion, after pruning, there were significant differences in enzyme activity, terpenoid anabolism, hormone signal transduction, and other pathways between ZC and EW compared to CK.

4. Discussion

Physiological changes in plant growth and development are a function of the plant’s ability to respond to internal signals and crop management practices such as pruning. Pruning significantly increases the elongation and weight of new plant shoots as well as yield and disease resistance. Matias et al. demonstrated that pruning is an effective method for controlling the development and shape of citrus trees (Citrus reticulata Blanco), improving fruit quality and yield, promoting pest and disease control, reducing production costs, and decreasing alternate fruiting. It can be seen that the study provides objective evidence for the benefits of pruning in citrus tree cultivation [26]. Another research from Song et al. has studied the effect of pruning to improve fruit yield and quality in densely planted ‘Red Fuji’ apple (Malus pumila Mill.) orchards [27]. Consistent with previous studies, this research demonstrates that pruning significantly promotes the growth of new shoots in tea plants. Pruning is an effective measure to increase tea yield as it promotes the growth and development of new shoots. The benefits of pruning may be due to increasing synthesis of useful metabolites that play an important role in branch growth and plant development.
After sensing and absorbing external signals, plants respond to these different environmental factors through the phytohormone signaling process, which modifies their developmental processes. Pruning is stressful for the tea plant, so genes participating in the relevant metabolic pathways must respond. Arkorful et al. found that pruning regulated indole-3-acetic acid synthesis in tea and promotes bud growth and development by stimulating shoot growth [24]. The study of Lu et al. also proved that phytohormones are crucial to the growth of tea plant. Then, they employed different time intervals and carried out different pruning treatments on tea plants, and the transcriptome results showed that the contents of phytohormones including IAA, GA1, GA3, and tZ in the spring buds of tea plant were significantly increased, and the depth of pruning could modulate the phytohormone signaling of tea plants, which could affect the development of the young buds of the tea plant [14]. Zhang et al. discovered that pruning tea plants enhance the accumulation and metabolism of sugar substances, accelerate the synthesis and transport of phytohormones and fatty acids, and thus improve the adaptive capacity of tea plants. It is beneficial for promoting tea plant growth and increasing tea yield [4]. In this study, the analyses of KEGG and GO revealed that DEGs significantly enriched in the pathways of plant–pathogen interaction, phytohormone signaling, and circadian rhythms in pruned tea plant spring buds. Differences in enzyme activity, terpene anabolism, and hormone signaling were also significant when compared with the control. Additionally, the genes related to the synthesis of phytohormones (such as IAA and GA) were also observed. The gene expression level was significantly up-regulated, which is consistent with the findings of previous studies.
We found that different tea varieties had significantly different growth forces after pruning. In this study, the growth of 20 different tea varieties was measured after five months since heavy pruning. By comparing the variability of data on branch length, diameter, tree height, tree width, and number of branches, the study identified ‘ZhongCha 302’ as more suitable for stronger pruning and ‘Emei Weichun’ as less suitable for pruning. It suggested that ‘Zhongcha 302’ exhibited more vigorous growth potential and might benefit more from pruning. In March of the following year, the growth of these two varieties was measured. From the data analysis of germination density, new shoot length, new shoot diameter, and the length of one bud and two leaves of the tea plant, the growth potential and re-generation ability of ‘Zhongcha 302’were superior to those of ‘Emei Wenchun’. This finding is consistent with previous studies, suggesting that ‘Zhongcha 302’ is more suitable for pruning. The reason for the variable growth of tea plant may be related to genes, and many genes are involved in plant growth, such as CYP450 family members and 9-cis epoxy carotenoid dioxygenase (NCED), etc. Overexpression of the At CYP79B2 gene in Arabidopsis thaliana showed phenotypes of dwarfism and sterility, which are also typical of the traits of growth hormone accumulation in large quantities, and it was further determined that At CYP79B2 is involved in catalyzing the growth hormone synthesis pathway [21]. NCED is a member of the family of carotenoid cleavage dioxygenases (CCDs) and considered a key enzyme in ABA biosynthesis [23]. In Arabidopsis, NCED genes belong to a multigene family in which At NCED3 is induced by drought stress, controlling the level of endogenous ABA in plants [22]. Transcriptome data analysis showed that the expression levels of CYP450 family members were significantly higher in ‘Zhongcha 302’ than those in ‘Emei Wenchun’, which may be one of the reasons for the faster growth of new shoots in ‘Zhongcha 302’. The NCED gene, which is involved in the synthesis of gibberellic acid, was expressed slightly higher in ‘Emei Wenchun’, suggesting that the content of gibberellin was higher in ‘Emei Wenchun’, which may be one of the reasons for the slow growth of ‘Emei Wenchun’ in the spring, and the exact mechanism needs to be further investigated.

5. Conclusions

In conclusion, this study revealed the contribution of pruning to the growth and development of tea plant and its mechanism. The transcriptome results suggest that tea plant responds to pruning by regulating changes in the content of phytohormones (IAA and GA, etc.), which promotes the development and growth of young tea plant shoots. According to the analysis of KEGG and GO results, the pathways of plant–pathogen interaction, phytohormone signaling and circadian rhythms were significantly enriched in pruned tea plant spring buds, and the differences in enzyme activities, terpene anabolism, and hormone signaling pathways were significant when compared with the control, and the expression of genes related to the phytohormones involved in their synthesis (IAA, GA, etc.) was significantly up-regulated. The growth force of different tea varieties after pruning varies significant. The data show that ‘Zhongcha 302’ has faster bud growth and growth rate after pruning, indicating a strong ability for new shoot regeneration. On the other hand, ‘Emei Wenchun’ has slower growth and growth rate after pruning, indicating a weaker ability for new shoot regeneration. Therefore, the higher the integrated index of new shoot growth after pruning and picking, the stronger the growth potential and regeneration ability of the variety, making it more suitable for pruning and picking. Then, tea plant varieties with high pruning and harvesting suitability can bring greater economic benefits to tea production. According to the pruning suitability characteristics of tea plants, various pruning and reshaping measures can be applied to rejuvenate the tree. In this study, the pruning suitability and regeneration ability of tea plants were studied, and the internal regulatory mechanism of the effect of pruning on the regeneration ability of new buds of different varieties of tea plants was initially revealed, which provided scientific guidance and theoretical basis for the selection of tea plant varieties suitable for pruning.

Author Contributions

Conceptualization, Q.T. and S.K.; Investigation, D.T., S.K. and L.F.; Data curation, visualization, writing—original draft preparation, S.K. and D.T.; The acquisition, analysis and validation of data, D.T., S.K. and Y.Z.; Project administration, funding acquisition, D.T. and Q.T.; Writing—review and editing, supervision, Q.T. and X.T. All authors have read and agreed to the published version of the manuscript.

Funding

This research was funded by Sichuan Science and Technology Department (2022NSFSC0180); the National Natural Science Foundation of China (32202538) and Yaan Science and Technology Program (22SXHZ0057).

Data Availability Statement

The data presented in this study are available on request from the corresponding author.

Conflicts of Interest

The authors declare no conflict of interest.

References

  1. Drew, L. The growth of tea. Nature 2019, 566, S2–S4. [Google Scholar] [CrossRef]
  2. Zhou, L.; Xu, H.; Mischke, S.; Meinhardt, L.W.; Zhang, D.; Zhu, X.; Li, X.; Fang, W. Exogenous abscisic acid significantly affects proteome in tea plant (Camellia sinensis) exposed to drought stress. Hortic. Res. 2014, 1, 14029. [Google Scholar] [CrossRef] [PubMed]
  3. Nhmrm, A.; Khh, B.; Msl, C.; Ehk, D.; Ysh, A. Metabolomic understanding of the difference between unpruning and pruning cultivation of tea (Camellia sinensis) plants—ScienceDirect. Food Res. Int. 2020, 104, 109978. [Google Scholar]
  4. Zhang, Q.; Zhang, Y.; Wang, Y.; Zou, J.; Lin, S.; Chen, M.; Miao, P.; Jia, X.; Cheng, P.; Pang, X.; et al. Transcriptomic Analysis of the Effect of Pruning on Growth, Quality, and Yield of Wuyi Rock Tea. Plants 2023, 12, 3625. [Google Scholar] [CrossRef] [PubMed]
  5. Zhang, L.; Li, M.; Li, X.; Yan, P.; Han, W. Summer pruning improves the branch growth and tea quality of tea plants (Camellia sinensis). Acta Physiol. Plant. 2021, 43, 65. [Google Scholar] [CrossRef]
  6. Maurin, V.; Desrochers, A. Physiological and growth responses to pruning season and intensity of hybrid poplar. For. Ecol. Manag. 2013, 304, 399–406. [Google Scholar] [CrossRef]
  7. Zhang, Q.; Zhang, Y.; Miao, P.; Chen, M.; Du, M.; Pang, X.; Ye, J.; Wang, H.; Jia, X. Effects of pruning on tea plant growth, soil enzyme activity and microbial diversity. Agronomy 2023, 13, 1214. [Google Scholar] [CrossRef]
  8. Liechti, R. The Jasmonate Pathway. Science 2002, 296, 1649–1650. [Google Scholar] [CrossRef]
  9. Kazan, K.; Manners, J.M. Jasmonate signaling: Toward an integrated view. Plant Physiol. 2008, 146, 1459–1468. [Google Scholar] [CrossRef]
  10. Koo, A.J.; Gao, X.; Jones, A.D.; Howe, G.A. A rapid wound signal activates the systemic synthesis of bioactive jasmonates in Arabidopsis. Plant J. 2010, 59, 974–986. [Google Scholar] [CrossRef]
  11. Li, L.; Zhao, Y.; McCaig, B.C.; Wingerd, B.A.; Wang, J.; Whalon, M.E.; Pichersky, E.; Howe, G.A. The tomato homolog of CORONATINE-INSENSITIVE1 is required for the maternal control of seed maturation, jasmonate-signaled defense responses, and glandular trichome development. Plant Cell Online 2004, 16, 126–143. [Google Scholar] [CrossRef] [PubMed]
  12. Javaid, M.H.; Khan, A.R.; Salam, A.; Neelam, A.; Azhar, W.; Ulhassan, Z.; Gan, Y. Exploring the adaptive responses of plants to abiotic stresses using transcriptome data. Agriculture 2022, 12, 211. [Google Scholar] [CrossRef]
  13. Zhang, S.; Li, C.; Si, J.; Han, Z.; Chen, D. Action mechanisms of effectors in plant-pathogen interaction. Int. J. Mol. Sci. 2022, 23, 6758. [Google Scholar] [CrossRef] [PubMed]
  14. Lu, L.; Luo, W.; Zheng, Y.; Jin, J.; Liu, R.; Lv, Y.; Ye, Y.; Ye, J. Effect of different pruning operations on the plant growth, phytohormones and transcriptome profiles of the following spring tea shoots. Beverage Plant Res. 2022, 2, 12. [Google Scholar] [CrossRef]
  15. Sun, M.; Zhang, C.; Lu, M.; Gan, N.; Chen, Z.; Deng, W.-W.; Zhang, Z.-Z. Metabolic Flux Enhancement and Transcriptomic Analysis Displayed the Changes of Catechins Following Long-Term Pruning in Tea plants (Camellia sinensis). J. Agric. Food Chem. 2018, 66, 8566–8573. [Google Scholar] [CrossRef] [PubMed]
  16. Chen, Z.Q.; Gong, X.; Chen, J.; Li, Q.Y.; Wang, L.J.; Zhou, Y.F. Research and analysis on optimal adjustment of planting tea varieties in guizhou. Seed 2014, 33, 97–100. [Google Scholar]
  17. Zhang, X.; Chen, S.; Shi, L.; Gong, D.; Zhang, S.; Zhao, Q.; Zhan, D.; Vasseur, L.; Wang, Y.; Yu, J.; et al. Haplotype-resolved genome assembly provides insights into evolutionary history of the tea plant Camellia sinensis. Nat. Genet. 2021, 53, 1250–1259. [Google Scholar] [CrossRef] [PubMed]
  18. Pertea, M.; Kim, D.; Pertea, G.M.; Leek, J.T.; Salzberg, S.A.-O. Transcript-level expression analysis of RNA-seq experiments with HISAT, StringTie and Ballgown. Nat. Protoc. 2016, 11, 1650–1667. [Google Scholar] [CrossRef] [PubMed]
  19. Love, M.I.; Huber, W.; Anders, S. Moderated estimation of fold change and dispersion for RNA-seq data with DESeq2. Genome Biol. 2014, 15, 1–21. [Google Scholar] [CrossRef]
  20. Yang, L.; Smyth, G.K.; Wei, S. Feature Counts: An efficient general purpose program for assigning sequence reads to genomic features. Bioinformatics 2014, 30, 923–930. [Google Scholar]
  21. Zhang, W.; Li, H.; Li, Q.; Wang, Z.; Zeng, W.; Yin, H.; Qi, K.; Zou, Y.; Hu, J.; Huang, B. Genome-wide identification, comparative anal-ysis and functional roles in flavonoid biosynthesis of cytochromeP450superfamily in pear (Pyruss spp.). BMC Genom. Data 2023, 24, 58. [Google Scholar] [CrossRef] [PubMed]
  22. Shohat, H.; Cheriker, H.; Cohen, A.; Weiss, D. Tomato ABA-IMPORTING TRANSPORTER 1.1 inhibits seed germi-nation under high salinity conditions. Plant Physiol. 2023, 191, 1404–1415. [Google Scholar] [CrossRef] [PubMed]
  23. Zhou, Y.; Zhao, C.; Du, T.; Li, A.; Qin, Z.; Zhang, L.; Dong, S.; Wang, Q.; Hou, F. Overexpression of 9-cis-Epoxycarotenoid Dioxygen-ase Gene, IbNCED1, Negatively Regulates Plant Height in Transgenic Sweet Potato. Int. J. Mol. Sci. 2023, 24, 10421. [Google Scholar] [CrossRef]
  24. Arkorful, E.; Yu, Y.; Chen, C.; Lu, L.; Hu, S.; Yu, H.; Ma, Q.; Thangaraj, K.; Periakaruppan, R.; Jeyaraj, A. Untargeted metabolomic anal-ysis using UPLC-MS/MS identifies metabolites involved in shoot growth and development in pruned tea plants (Camellia sinensis (L.) O. Kuntz). Sci. Hortic. 2020, 264, 109164. [Google Scholar] [CrossRef]
  25. Ashburner, M.M.; Ball, C.A.C.; Blake, J.A.J.; Botstein, D.D.; Sherlock, G. Gene Ontology: Tool for the unification of biology. The Gene Ontology Consortium. Nat. Genet. 2000, 25, 25–29. [Google Scholar] [CrossRef]
  26. Matias, P.; Barrote, I.; Azinheira, G.; Continella, A.; Duarte, A. Citrus Pruning in the Mediterranean Climate: A Review. Plants 2023, 12, 3360. [Google Scholar] [CrossRef] [PubMed] [PubMed Central]
  27. Song, K.; Wei, Q.P.; Yue, Y.L.; Wang, X.W.; Zhang, J.X. Effects of different pruning modes on the light distribution characters and fruit yield and quality in densely planted ‘Red Fuji’ apple orchard. Ying Yong Sheng Tai Xue Bao 2010, 21, 1224–1230. (In Chinese) [Google Scholar]
Figure 1. Box plots comparing the growth of 20 tea plant varieties after heavy pruning. (a) Length of branch, (b) stem diameter, (c) height of tree, (d) branch number, (e) crown diameter. All the parameters were measured at the stage in October 2022. A: CM28; B: ZZ; C: ZJ; D: HYZ; E: DG; F: CC3; G: ZC102; H: FD; I: MBL1; J: XSZ; K: ZC302; L: CM217; M: JHXC; N: CC2; O: HJG; P: ZC108; Q: TC2; R: ZY; S: EW; T: MK1.
Agronomy 14 01105 g001aAgronomy 14 01105 g001b
Figure 2. The effects of heavy pruning treatments on the spring shoots and buds in the following year.
Agronomy 14 01105 g002
Figure 3. Box plots comparing the growth of ZC302 and EW after heavy pruning. (a) Budding density, (b) shoot length, and (c) stem diameter, and (d) length of two leaves and one bud of young tea shoots in the following year after heavy pruning treatments. All the parameters were measured at the stage of two leaves and one bud in March 2023. A: ZC302; B: EW.
Agronomy 14 01105 g003
Figure 4. Sample gene expression distribution box chart, violin chart, and PCA analysis. Note: Different colors in the picture represent different samples. (a): In the figure, the abscissa represents different samples, and the ordinate represents the log value of sample expression quantity FPKM. (b): In the figure, the horizontal coordinate represents different samples, and the wide area indicates more data distribution. (c): In the figure, the abscissa represents PC1, and the ordinate represents PC2.
Agronomy 14 01105 g004
Figure 5. Cluster analysis of DEG. (a) DEG numbers, (b) Venn diagram of DEGs.
Agronomy 14 01105 g005
Figure 6. The transcriptome profiles of the buds of ‘ZC302’ and ‘EW’ in the spring of the following year after heavy pruning treatments. (a) Heatmap showing DEG expression, (b) significantly enriched KEGG pathways of DEGs. The number of replicates is three.
Agronomy 14 01105 g006
Figure 7. GO classification of differently expressed genes. (a) ZC vs. EW, (b) ZCCK vs. EWCK, (c) ZC vs. ZCCK, (d) EW vs. EWCK. Note: The horizontal axis represents the secondary GO entry, and the vertical axis represents the number of differently expressed genes.
Agronomy 14 01105 g007
Figure 8. Column chart of differential gene GO enrichment. (a) ZC vs. EW, (b) ZCCK vs. EWCK, (c) ZC vs. ZCCK, (d) EW vs. EWCK.
Agronomy 14 01105 g008aAgronomy 14 01105 g008b
Table 1. A comparison of the growth of 20 varieties of tea plants after heavy pruning treatment.
VarietyNumber of Branches (pcs)Branch Weight (kg)Branch Length (cm)Diamethickness (mm)Tree Height (cm)Tree Spread (cm)
Chunmu 2827.67 ± 4.84 cde27.67 ± 4.84 cde53.75 ± 713 def5.31 ± 0.11 abc84.33 ± 3.18 hr83.67 ± 5.55 cdef
Zizhu30.33 ± 2.33 cde0.75 ± 0.15 bcde51.52 ± 7.14 ef3.80 ± 0.30 d90.33 ± 0.67 fgh81.00 ± 3.61 def
Zijuan43.00 ± 1.53 ab0.73 ± 0.04 bcde58.58 ± 3.63 bcdef3.95 ± 0.26 d114.33 ± 2.60 bcd70.67 ± 5.21 fg
Huangyazao33.67 ± 4.33 abcde0.68 ± 0.07 bcde63.07 ± 3.23 bcdef4.99 ± 0.54 abcd93.00 ± 0.57 efgh78.00 ± 2.08 def
Dangui30.00 ± 2.08 cde0.70 ± 0.05 bcde56.13 ± 3.50 cdef4.44 ± 0.10 bcd82.67 ± 4.67 hr78.33 ± 3.53 def
Chuancha 338.00 ± 1.73 abc0.90 ± 0.05 bc69.68 ± 1.18 abc5.41 ± 0.07 ab134.00 ± 4.04 a109.33 ± 5.49 ab
Zhongcha 10231.33 ± 4.91 cde0.82 ± 0.04 bcde54.43 ± 5.50 def4.46 ± 0.40 bcd88.67 ± 3.38 gh91.00 ± 4.04 cd
Fudingdabaicha30.33 ± 4.18 cde0.60 ± 0.03 bcde60.65 ± 1.08 bcdef5.04 ± 0.13 abcd72.00 ± 2.65 r80.00 ± 3.51 def
Mabianlv 125.33 ± 3.18 de0.91 ± 0.2 bc78.55 ± 3.33 a4.99 ± 0.50 abcd109.00 ± 3.46 cd97.67 ± 7.45 bc
Xiangshanzao30.33 ± 1.67 cde0.91 ± 0.06 bc67.78 ± 3.59 abcd4.55 ± 0.24 bcd112.00 ± 4.58 bcd109.00 ± 5.29 ab
‘Zhongcha 302’33.67 ± 1.451.58 ± 0.06 a72.64 ± 5.99 ab5.59 ± 0.37 ab124.67 ± 0.88 ab108.00 ± 1.15 ab
Chunmu 21727.67 ± 4.10 cde0.65 ± 0.03 bcde64.50 ± 3.51 abcdef4.94 ± 0.24 abcd102.00 ± 1.73 def90.00 ± 5.68 cde
Jianhexiangcha28.33 ± 3.71 cde0.58 ± 0.02 cde50.40 ± 2.10 f4.82 ± 0.12 bcd75.00 ± 1.53 r69.67 ± 3.48
Chuancha 229.33 ± 2.96 cde0.53 ± 0.14 de65.71 ± 0.32 abcde5.41 ± 0.69 ab104.00 ± 5.69 de83.33 ± 5.46 cdef
Huangjingui32.33 ± 1.45 bcde0.78 ± 0.04 bcde71.10 ± 4.03 abc5.28 ± 0.26 abc112.67 ± 2.03 bcd88.33 ± 4.41 cde
Zhongcha 10845.00 ± 6.66 a0.95 ± 0.19 b65.04 ± 3.09 abcdef5.61 ± 0.63 ab118.67 ± 1.86 bc114.67 ± 2.96 a
Taicha 222.33 ± 0.88 e0.70 ± 0.06 bcde71.02 ± 5.80 abc5.38 ± 0.52 ab101.67 ± 6.01 defg80.00 ± 2.00 def
Ziyan36.00 ± 3.06 abcd0.67 ± 0.06 bcde51.25 ± 6.70 ef4.76 ± 0.40 bcd72.33 ± 4.41 r61.33 ± 2.90 gh
Emei wenchun27.33 ± 2.40 cde0.47 ± 0.03 e51.99 ± 3.96 ef4.02 ± 0.34 cd74.33 ± 8.97 r52.00 ± 5.03 h
Mingke 130.00 ± 5.77 cde0.88 ± 0.27 bcd64.54 ± 4.83 abcdef6.14 ± 0.51 a89.13 ± 7.05 fgh75.67 ± 5.81 ef
Note: Values are ’mean ± standard error’. Small letters in the same column indicate significant difference (p < 0.05).
Table 2. Summary Dataset of Transcriptome Assembly.
ZC302-1ZC302-2ZC302-3ZC302CK-1ZC302CK-2ZC302CK-3EW-1EW-2EW-3EWCK-1EWCK-2EWCK-3
Clean reads45,059,02251,229,95846,339,93245,227,99646,918,97441,608,16042,537,08048,000,79843,215,03647,478,84052,396,59847,933,588
GC content45.2645.3145.2945.6145.3345.545.4745.3345.2745.4245.345.26
Q3093.4293.2692.9392.5392.7592.792.6892.7492.9692.8992.2592.34
Mapped reads ratio91.08%90.64%90.64%89.29%91.45%90.86%91.20%90.52%90.34%90.73%91.02%90.52%
Disclaimer/Publisher’s Note: The statements, opinions and data contained in all publications are solely those of the individual author(s) and contributor(s) and not of MDPI and/or the editor(s). MDPI and/or the editor(s) disclaim responsibility for any injury to people or property resulting from any ideas, methods, instructions or products referred to in the content.

