Article

The Effects of Ammonium Phosphate with Different Sulfur Additions on Crop Yield and Nutrient Uptake in Calcareous Soil

1
College of Resources and Environmental Sciences, National Academy of Agriculture Green Development, China Agricultural University, Beijing 100193, China
2
Key Laboratory of Vegetable Biology of Yunnan Province, College of Landscape and Horticulture, Yunnan Agricultural University, Kunming 650201, China
*
Authors to whom correspondence should be addressed.
Agronomy 2024, 14(6), 1145; https://doi.org/10.3390/agronomy14061145
Submission received: 16 April 2024 / Revised: 15 May 2024 / Accepted: 26 May 2024 / Published: 27 May 2024
(This article belongs to the Section Soil and Plant Nutrition)

Abstract

:
Sulfur (S) deficiency is becoming increasingly prevalent, posing a serious threat to crop yield and quality. The incorporation of S fertilizers into macronutrient fertilizers such as ammonium phosphate represents a straightforward and economically efficient approach to alleviating S deficiency, strengthening S supply, and improving crop yield. However, limited research has been conducted to assess the effect of monoammonium phosphate (MAP) and diammonium phosphate (DAP) with different S additions on agronomic outcomes. In this study, ammonium sulfate and elemental S with S set at 3%, 6%, 9%, and 12% (ensuring a 1:1 ratio of SO4−S to elemental S) were granulated with MAP and DAP, respectively. Maize was used as the test crop to evaluate its yield, nutrient uptake, and apparent sulfur recovery. The results showed that S-fortified MAP treatment increased crop yield and S uptake by an average of 9.3% and 10.6%, respectively. A significant difference in crop yield and S uptake was observed when the S addition in MAP exceeded 9% S. Nevertheless, no statistical difference was found among the DAP-based treatments in calcareous soil. There was a strong relationship between S applied in fertilizers and S uptake by crops for MAP-based treatments. However, the apparent sulfur recovery drastically dropped from 44.2% to 7.19% with the increased addition level of S for MAP-based fertilizers. The results of this study indicate that the addition of S to MAP could be a simple, low-cost, and effective approach with great potential to promote S fertilizer application, minimize soil S deficiency, and improve crop yield in calcareous soil.

1. Introduction

Sulfur (S) is an essential element for crops and is vital to ensuring food security [1]. It plays a vital role in many physiological processes such as photosynthesis, enzyme regulation, protein and lipid synthesis, stress resistance, and other metabolic pathways [2,3,4,5,6]. S is also an essential dietary component for the health of humans and animals because of its ability to synthesize S-containing amino acids such as methionine and cysteine, which are primarily obtained from plant-derived foods [4,7]. However, an analysis of S-containing amino acids in various foods revealed that many plant-derived foods have relatively lower levels of methionine and cysteine in comparison to meat and eggs [8]. Unfortunately, soil S deficiency is increasingly becoming a critical challenge in agricultural production worldwide, especially in China and India, which, combined, represent 45% of the world’s total S deficiency [9], seriously limiting crop yield and quality and thus posing potential risks to animal and human health [10,11,12,13,14].
A reduction in atmospheric deposition due to stricter pollution control, an increased yield with high S removal from the soil, and a transition to highly analyzed fertilizers with no or little S are the main causes of soil S deficiency [15,16]. The application of S fertilizer is a simple and effective approach to increasing soil S levels, fulfilling the S requirements of crops, and improving crop yield and quality [15]. Over the past few decades, the response of crop yield and quality to S fertilization has been extensively studied. For example, in a study, more than 40 crops under field conditions in India responded to S fertilization with a yield increase of 14–74% [17]. A total of 535 field trials including more than 15 crops were conducted in China from 1997 to 2003, and the results indicated that sulfur fertilization significantly increased crop yields by 7% to 30% [10]. The results of another 155 field experiments conducted in China from 2008 to 2011 presented an average yield increase of 6.5% due to S fertilizer application [18]. However, the application of an S-only fertilizer is often not practiced in agricultural production due to the high handling costs involved and poor distribution in the field [19]. Adding S fertilizer into macronutrient fertilizers such as phosphate fertilizers could address these concerns and has gained widespread attention in the research field [20,21,22].
S fertilizers can be categorized into two types: sulfate-S (SO4−S)-based and elemental S-based. Elemental S is the most commonly used raw material added to phosphate fertilizers, primarily because it contains 100% S nutrients and will not reduce the N or P content of the fertilizers after being incorporated into highly analyzed granular fertilizers [23]. However, it can only be absorbed and utilized by crops after being oxidized to SO4−S. Although some studies demonstrated that the application of elemental S fertilizer can increase seasonal crop yield significantly [24,25,26,27,28], the oxidization process of elemental S to SO4−S often takes a considerable amount of time; this issue might be the main reason why elemental S fertilization usually presented marked yield increases in the second or third year [23,29,30,31]. SO4−S is soluble and can be absorbed by crops immediately, and the application of SO4−S fertilizer results in better agronomic effects in the seasonal crop [29,32,33]. However, sulfate is highly mobile in soil and easily subject to leaching, particularly in alkaline and sandy soils with high rainfall [34]. To better meet the S requirements of crops and reduce leaching losses and labor costs, the addition of the combination of SO4−S and elemental S into phosphate fertilizers has gained broad attention [15,23,29,32].
Phosphate fertilizers, especially MAP and DAP, are important carriers for adding S to soil due to their widespread application in agriculture, and they were found in studies to be able to improve crop yield and S uptake compared to the control (no S applied) [28,35,36]. In addition, different crops have varying S requirements, leading to different responses in the crop yield to various S fertilizer application rates. For example, Kulczycki [27] found in their study that the optimal S application rate for winter rape and winter wheat was 30 kg S ha−1 and 15 kg S ha−1, respectively, in a 4-year field trial. Yang et al. [37] evaluated the response of cabbage to S fertilization in the Beijing area and found that 15–30 kg S ha−1 was sufficient to achieve an optimum yield. Fan and Messick [10] found that crop yield increased when the S application rate was increased up to 60 kg S ha−1 for cereal crops and to 90 kg S ha−1 for vegetable crops, sugar, and oil in over 200 field trials in China. Khan et al. [38] revealed in their study that 60 kg S ha−1 of S fertilizer application produced the highest yield, and its application above 60 kg S ha−1 resulted in a decrease in maize yield. Similarly, the results of Karimizarchi et al.’s study [26] demonstrated that an adequate S fertilizer supply could significantly increase maize yield; however, the results showed that excessive use limited the growth of maize due to the toxic levels of Mn and Zn in the soil, which were induced by soil pH reduction due to the acidifying character of elemental S. Additionally, soil properties such as soil S concentration and climate conditions also affect the optimal S application rate [15,39,40]. However, few studies have reported the effects of MAP and DAP with different S additions on agronomy efficiency. It remains unclear what the appropriate S content to be added into MAP and DAP is, as well as which one is more suitable as a phosphate carrier for adding S fertilizers to calcareous soil.
In this study, MAP and DAP were granulated with varying levels of S fertilizers, and two pot experiments were conducted to evaluate their effects on crop yield and nutrient uptake. This study aims to provide a reference for the targeted addition of S to MAP and DAP and formulate an effective S-fortified phosphate fertilizer to address soil S deficiency. We hypothesized that the optimal S additions in MAP and DAP are different and that MAP is the preferred carrier for adding S to increase the crop yield and nutrient uptake in calcareous soil.

2. Materials and Methods

2.1. Fertilizer Manufacturing

Diammonium phosphate (DAP, P content of 18.3 wt% and N content of 15 wt%), monoammonium phosphate (MAP, P content of 20.5 wt% and N content of 8 wt%), ammonium sulfate ((NH4)2SO4, analytical reagent (AR), 99% min), and elemental S (99% min) were used as raw materials in this study. Ammonium sulfate and elemental S with S set at 3%, 6%, 9%, and 12% (ensuring a 1:1 ratio of SO4−S to elemental S) were granulated with MAP and DAP, respectively. Eight S-fortified fertilizers were produced with different S additions: MAP+3%S, MAP+6%S, MAP+9%S, MAP+12%S, DAP+3%S, DAP+6%S, DAP+9%S, and DAP+12%S. MAP and DAP were also produced as the control. The granulation method was as follows: the raw materials (<250 μm) of a total of 500 g were mixed completely and uniformly, and approximately 50 g of the mixture was first placed into a disc granulator, with deionized water used as a binder to facilitate granulation. Once a core with a diameter of 0.1–1 mm was formed, an additional mixture was added, and more of the binder was applied based on the moisture content of the granules. This process was repeated, with granules larger than 4 mm or smaller than 1 mm being ground and returned to the granulator [41]. The granulation time was 45–60 min, with 100–120 g of binder being consumed in total. After granulation, the fertilizer granules were dried in an air blast drying oven for 7 h at 50 °C and then cooled, placed in Ziplock bags, and stored in sealed plastic containers at room temperature [42]. The pH and N, P, and S contents of the fertilizers were measured and are presented in Table 1.

2.2. Pot Experiment

The pot experiment in this study was performed in a greenhouse using maize (Zea mays L. Zhengdan 958). The soil (0–10 cm) used was calcareous soil, obtained from Qvzhou County, Hebei Province, China. The soil was air-dried, sieved to <2 mm, and analyzed before use [42]. The basic soil properties were as follows: pH 7.97, organic matter 15.8 g kg−1, alkaline nitrogen 89.6 mg kg−1, available phosphorus 9.76 mg kg−1, available potassium 283 mg kg−1, exchangeable calcium 115 cmol(+) kg−1, exchangeable magnesium 5.47 cmol(+) kg−1, and available S 0.27 mg kg−1, which is less than the concentration considered deficient (<12 mg S kg−1) [43].
Each pot was filled with 3 kg of air-dried soil and fertilized at a rate of 75 mg P kg−1, with fertilizers added equidistantly at 5 cm below the soil surface [42]. Eleven treatments with four replicates of each treatment were included in this experiment: the control, MAP, MAP+3S%, MAP+6S%, MAP+9S%, MAP+12S%, DAP, DAP+3S%, DAP+6S%, DAP+9S%, and DAP+12S%. The pots were arranged in a randomized complete block design. The MAP and DAP fertilizers inherently contained a certain amount of sulfur; thus, the actual S application amount for each treatment was as follows: 0 mg S kg−1, 8.80 mg S kg−1, 20.5 mg S kg−1, 34.8 mg S kg−1, 50.4 mg S kg−1, 72.2 mg S kg−1, 9.15 mg S kg−1, 21.7 mg S kg−1, 37.2 mg S kg−1, 56.3 mg S kg−1, and 77.8 mg S kg−1, respectively. All pots except the control received basic nutrients: 85.3 mg N kg−1, 125 mg K kg−1, 2.30 mg Zn kg−1, 1.67 mg Mn kg−1, 0.77 mg Fe kg−1, 0.51 mg Cu kg−1, and 0.12 mg B kg−1 before sowing. Four uniformly growing maize seeds were transplanted into each pot at a depth of 2 cm below the soil surface, with the topsoil gently covered [42]. The soil was watered at regular intervals to maintain field capacity. The seedlings were thinned to two plants per pot after 1 week, and we harvested the shoots of maize 8 weeks after sowing by cutting at the base of the stem. Afterward, the maize shoots were dried in an oven and weighed. The N concentration was measured using the Kjeldahl method after digestion with sulfuric acid and hydrogen peroxide [44], and the P and S concentrations were determined using ICP-OES after digestion with a mixture of nitric acid and hydrogen peroxide [29,45].
Subsequently, a residual effect experiment of S-fortified fertilizers was also conducted. Initially, the root of the first season’s crop was removed, and then the soil was transferred into pots. Similarly, four maize seeds, selected for their uniform growth, were planted in the pots at a depth of 2 cm below the soil surface, with the topsoil gently covering them. The soil was watered at regular intervals to maintain field capacity. After 1 week, the seedlings were thinned to two plants per pot, and we harvested the shoots of maize by cutting at the base of the stem after 8 weeks. Following this step, the samples were dried and weighed.

2.3. Statistical Analysis

One-way ANOVA and a post hoc Duncan test for multiple comparisons at a significance level of 0.05 were conducted to evaluate the effect of different levels of S fertilizer added into MAP and DAP on shoot dry matter, nutrient uptake, and apparent sulfur recovery using IBM SPSS Statistics 20. Apparent sulfur recovery was calculated using the following equation: ((mg S in shoots in the fertilizer treatment − mg S in the control treatment)/mg S added in fertilizer) × 100 [46]. The relationship between the amount of S applied in the fertilizer and the uptake of S by the crops was analyzed via regression analysis in Microsoft Excel 2021.

3. Results

3.1. Effect of Different S Fertilizer Additions on Fertilizer Properties

The nutrient contents of S-containing MAP and DAP are detailed in Table 1. An increase in the S content of S-fortified fertilizers led to a rise in nitrogen levels and a decrease in phosphorus levels, primarily attributed to the inclusion of ammonium sulfate. The incorporation of 3–12% S into MAP and DAP did not significantly affect the pH of the fertilizers, with a pH range of 4.86–5.04 for S-fortified MAP and 7.21–7.26 for S-containing DAP. In the case of treatments involving MAP and S-fortified MAP, the total S content ranged from 2.39 to 13.5%, with the elemental S content ranging from 0.00 to 6.03% and the SO4−S content ranging from 2.39 to 7.47%. Regarding the treatments with DAP and S-fortified DAP, the total S content ranged from 2.32 to 13.6%, with the elemental S content ranging from 0.00 to 5.88% and the SO4−S content ranging from 2.32 to 7.73%.
Table 1. The pH and nitrogen, phosphorus, and sulfur concentrations in the monoammonium phosphate (MAP) and diammonium phosphate (DAP) without co-granulation or co-granulated with 3%S (1.5% SO4−S + 1.5% elemental S), 6%S (3% SO4−S + 3% elemental S), 9%S (4.5% SO4−S + 4.5% elemental S), and 12%S (6% SO4−S + 6% elemental S).
TreatmentN a (%)P2O5 b (%)SO4−S c (%) Elemental S d (%)Total S (%)pH e
MAP8.9345.52.390.002.394.81
MAP+3%S 9.3441.23.691.435.124.86
MAP+6%S 9.9538.14.982.997.974.98
MAP+9%S 10.634.86.094.4110.54.96
MAP+12%S 11.231.77.476.0313.55.04
DAP14.242.92.320.002.327.29
DAP+3%S 14.239.03.481.585.067.26
DAP+6%S14.636.45.052.917.967.24
DAP+9%S14.733.06.514.4110.97.23
DAP+12%S 14.929.77.735.8813.67.21
a measured according to the post-distillation titration method [47]. b measured via the gravimetric method using quinoline phosphomolybdate [47]. c measured via the gravimetric method with precipitated sulfate using barium chloride in an acid solution [47]. d extracted using carbon disulfide and measured using the gravimetric method [47]. e measured at a fertilizer: water ratio of 1:250 (weight: volume) [48].

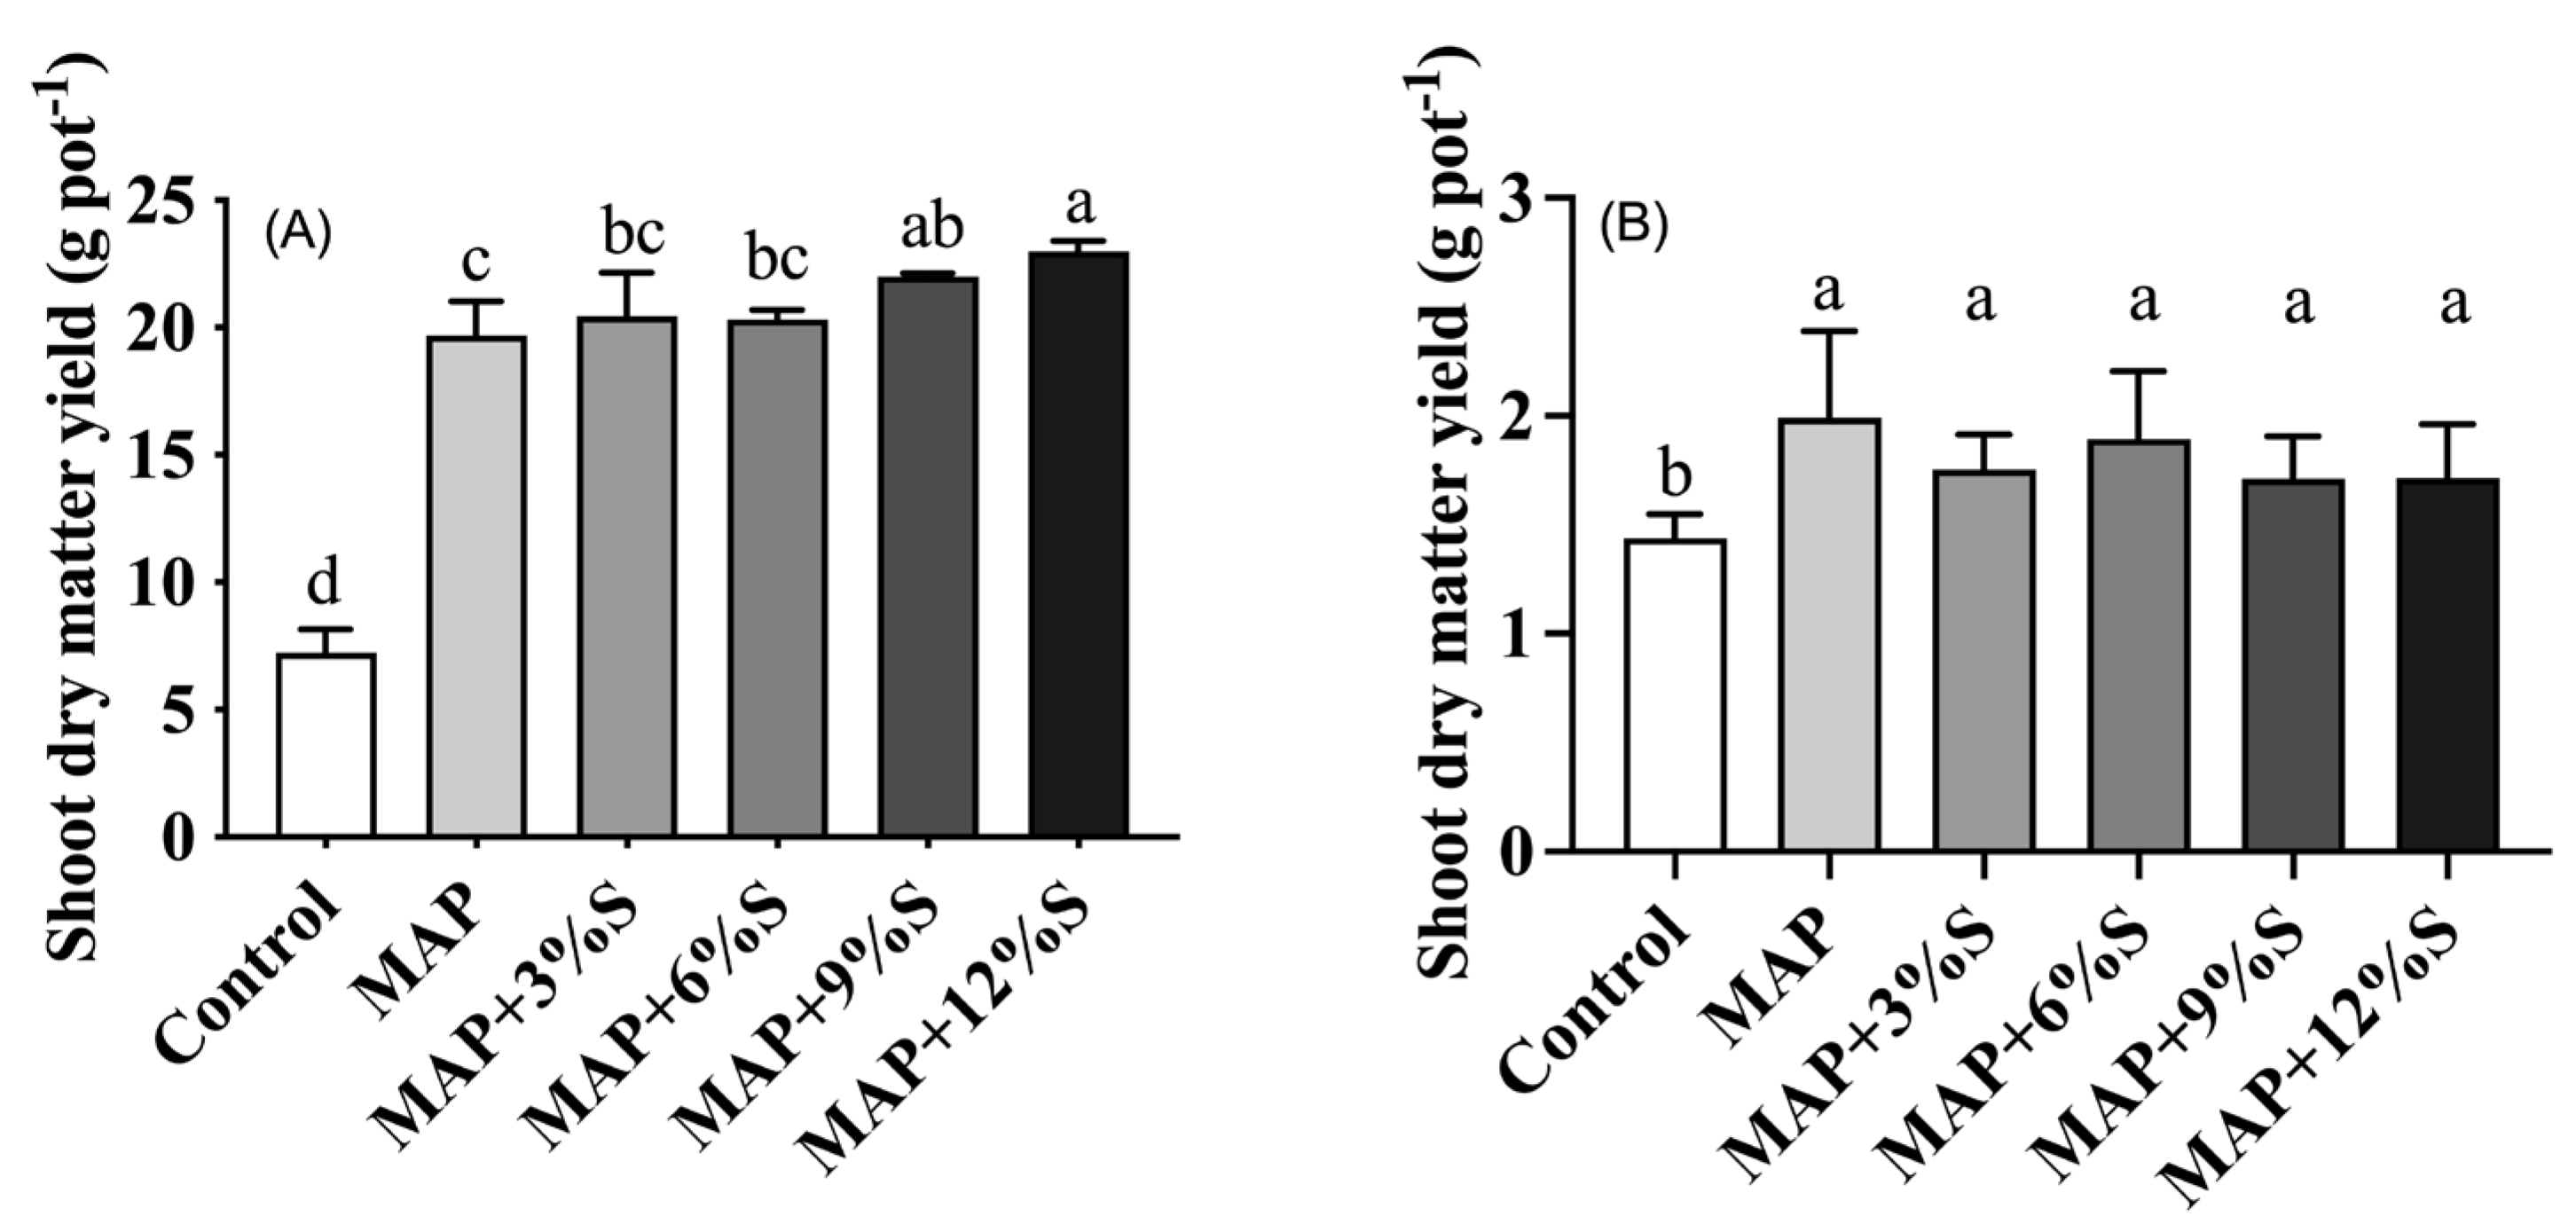
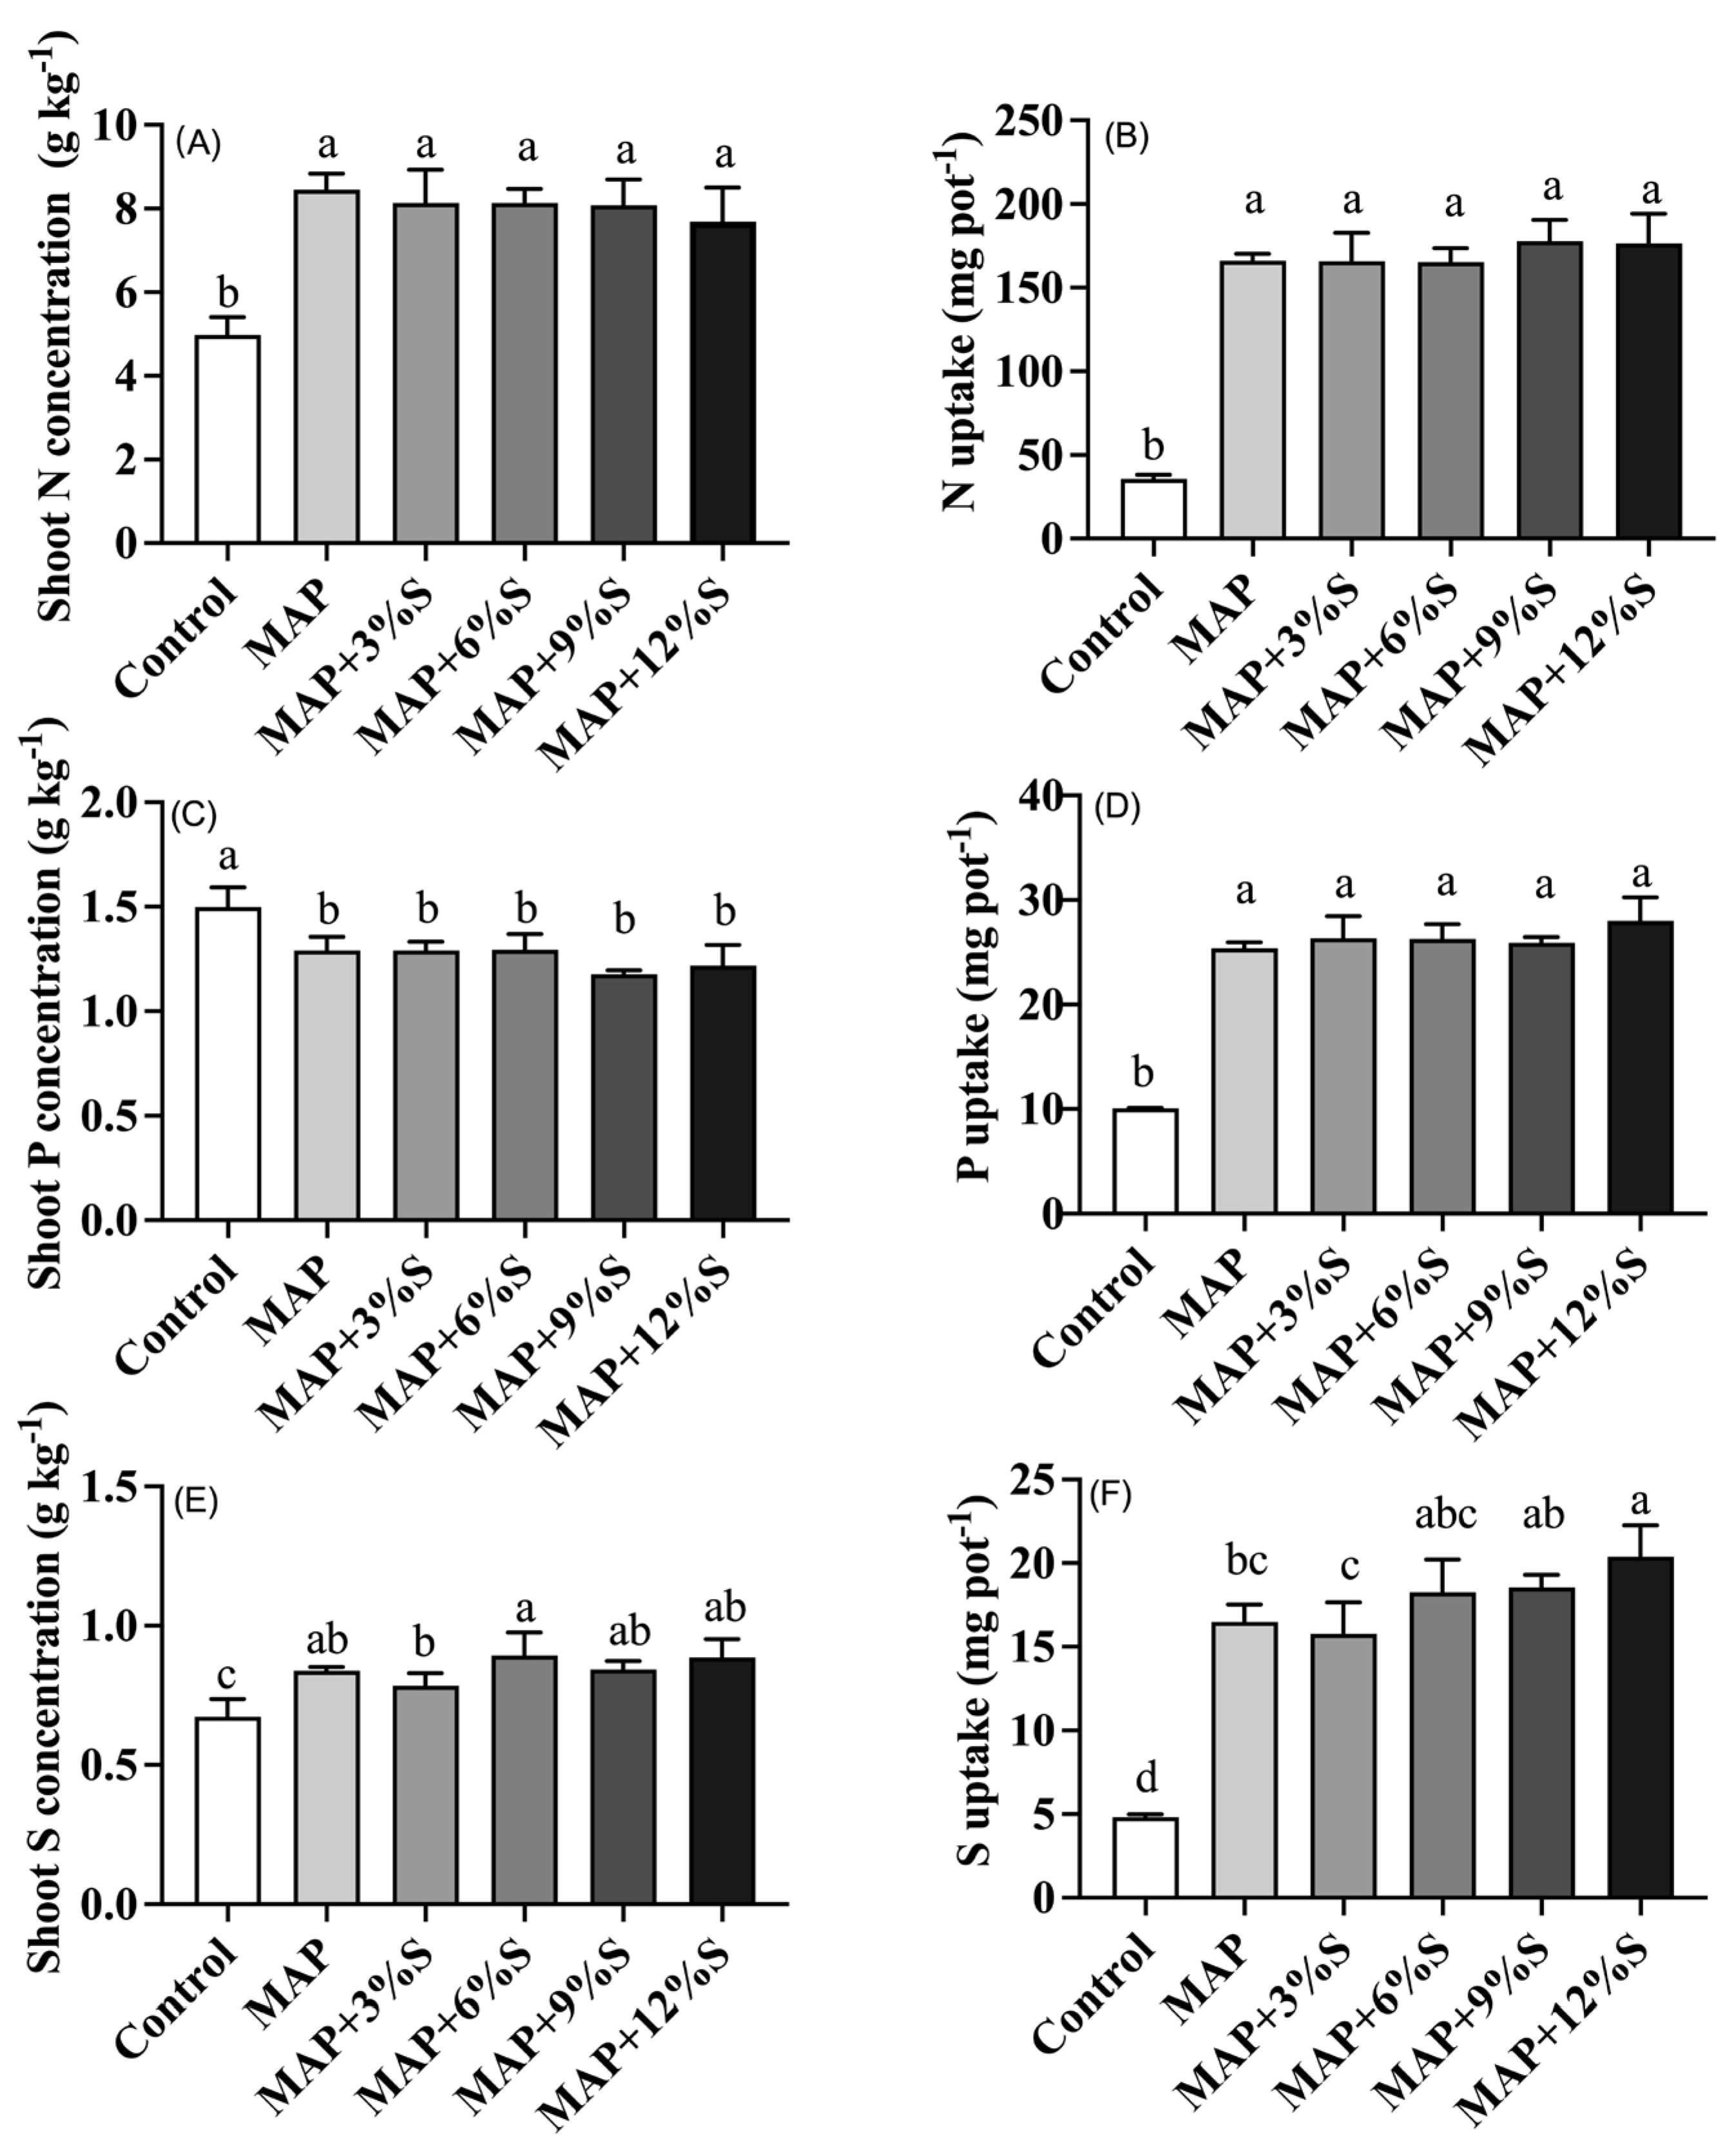
3.2. Effect of Different S Additions to MAP on Crop Yield and Nutrient Uptake

Significant differences in the shoot dry matter yield of the maize were observed among the treatments with varying sulfur additions in MAP (Figure 1A). Compared to the MAP treatment, the addition of 3% and 6% S resulted in increases of 3.84% and 3.21% in the shoot dry matter yield, respectively. When the S addition reached 9%, the shoot dry matter yield of the maize increased by 11.7%, and at 12% sulfur addition, it increased by 16.8% compared to the MAP treatment alone. However, there was no significant difference in the residual effect of the MAP-based treatments on the shoot dry matter yield (Figure 1B).
The concentration and uptake of N, P, and S in the maize shoots are shown in Figure 2. The results showed that the addition of varying S levels to MAP did not significantly affect N and P uptake by the maize shoots. However, a significant difference was found in the S uptake between MAP alone and the S-fortified MAP treatments with S addition exceeding 9%. The S uptake in the MAP+6%S, MAP+9%S, and MAP+12%S treatments was 10.7%, 12.4%, and 23.6% higher than that in the MAP treatment alone, respectively.

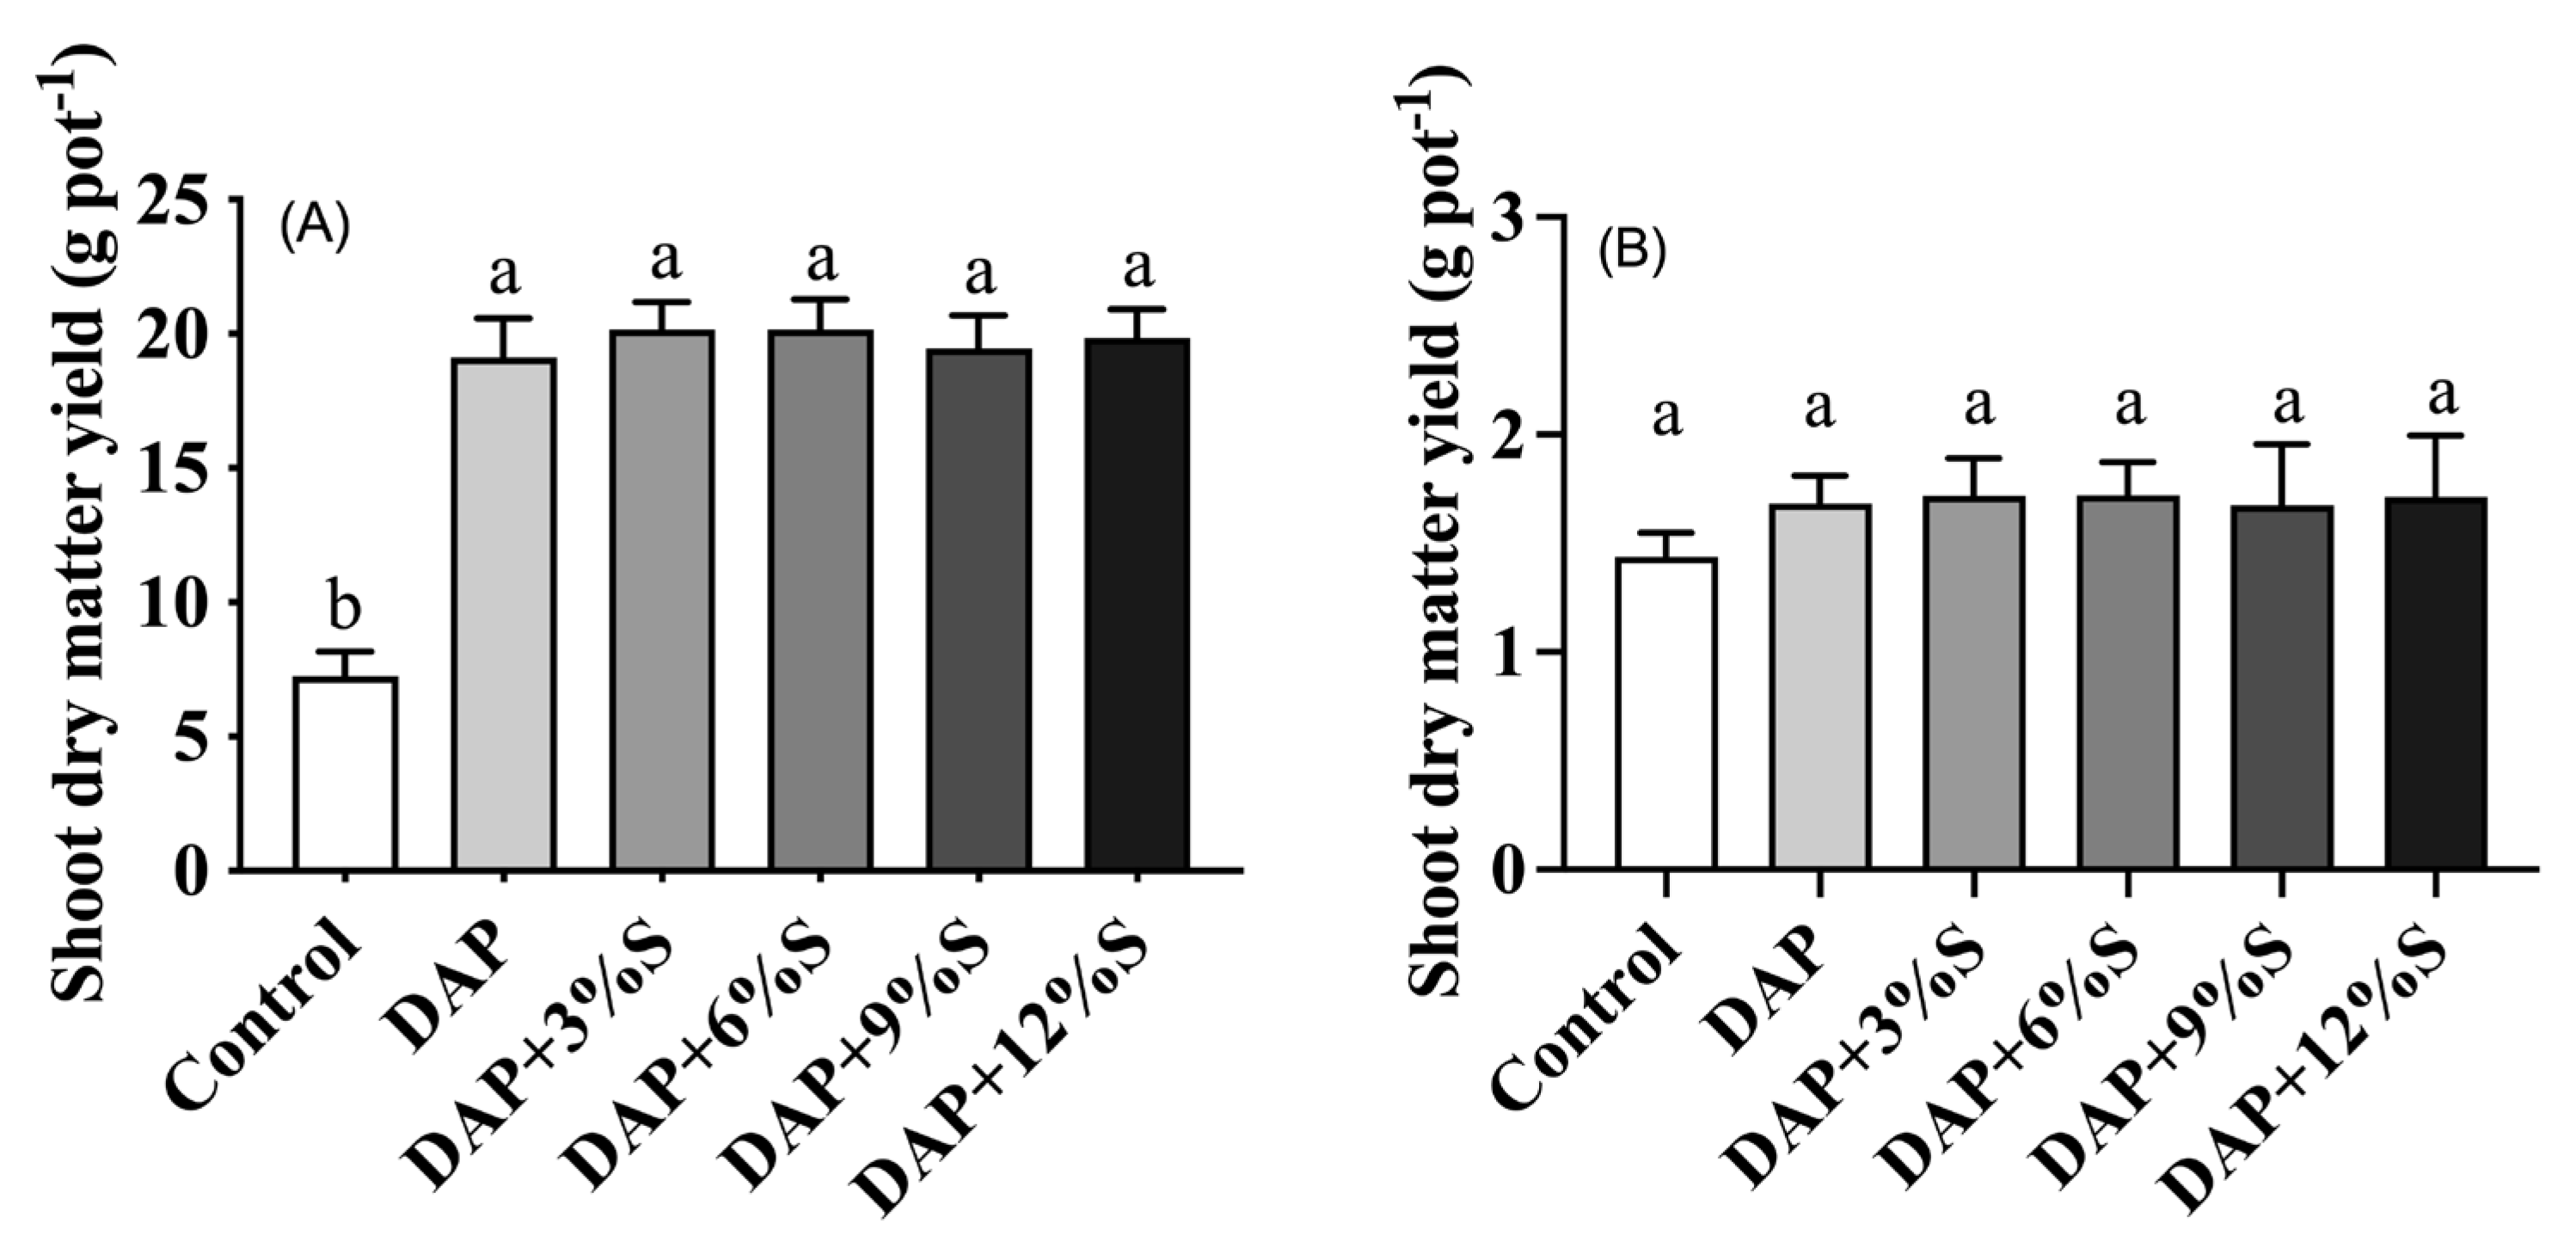
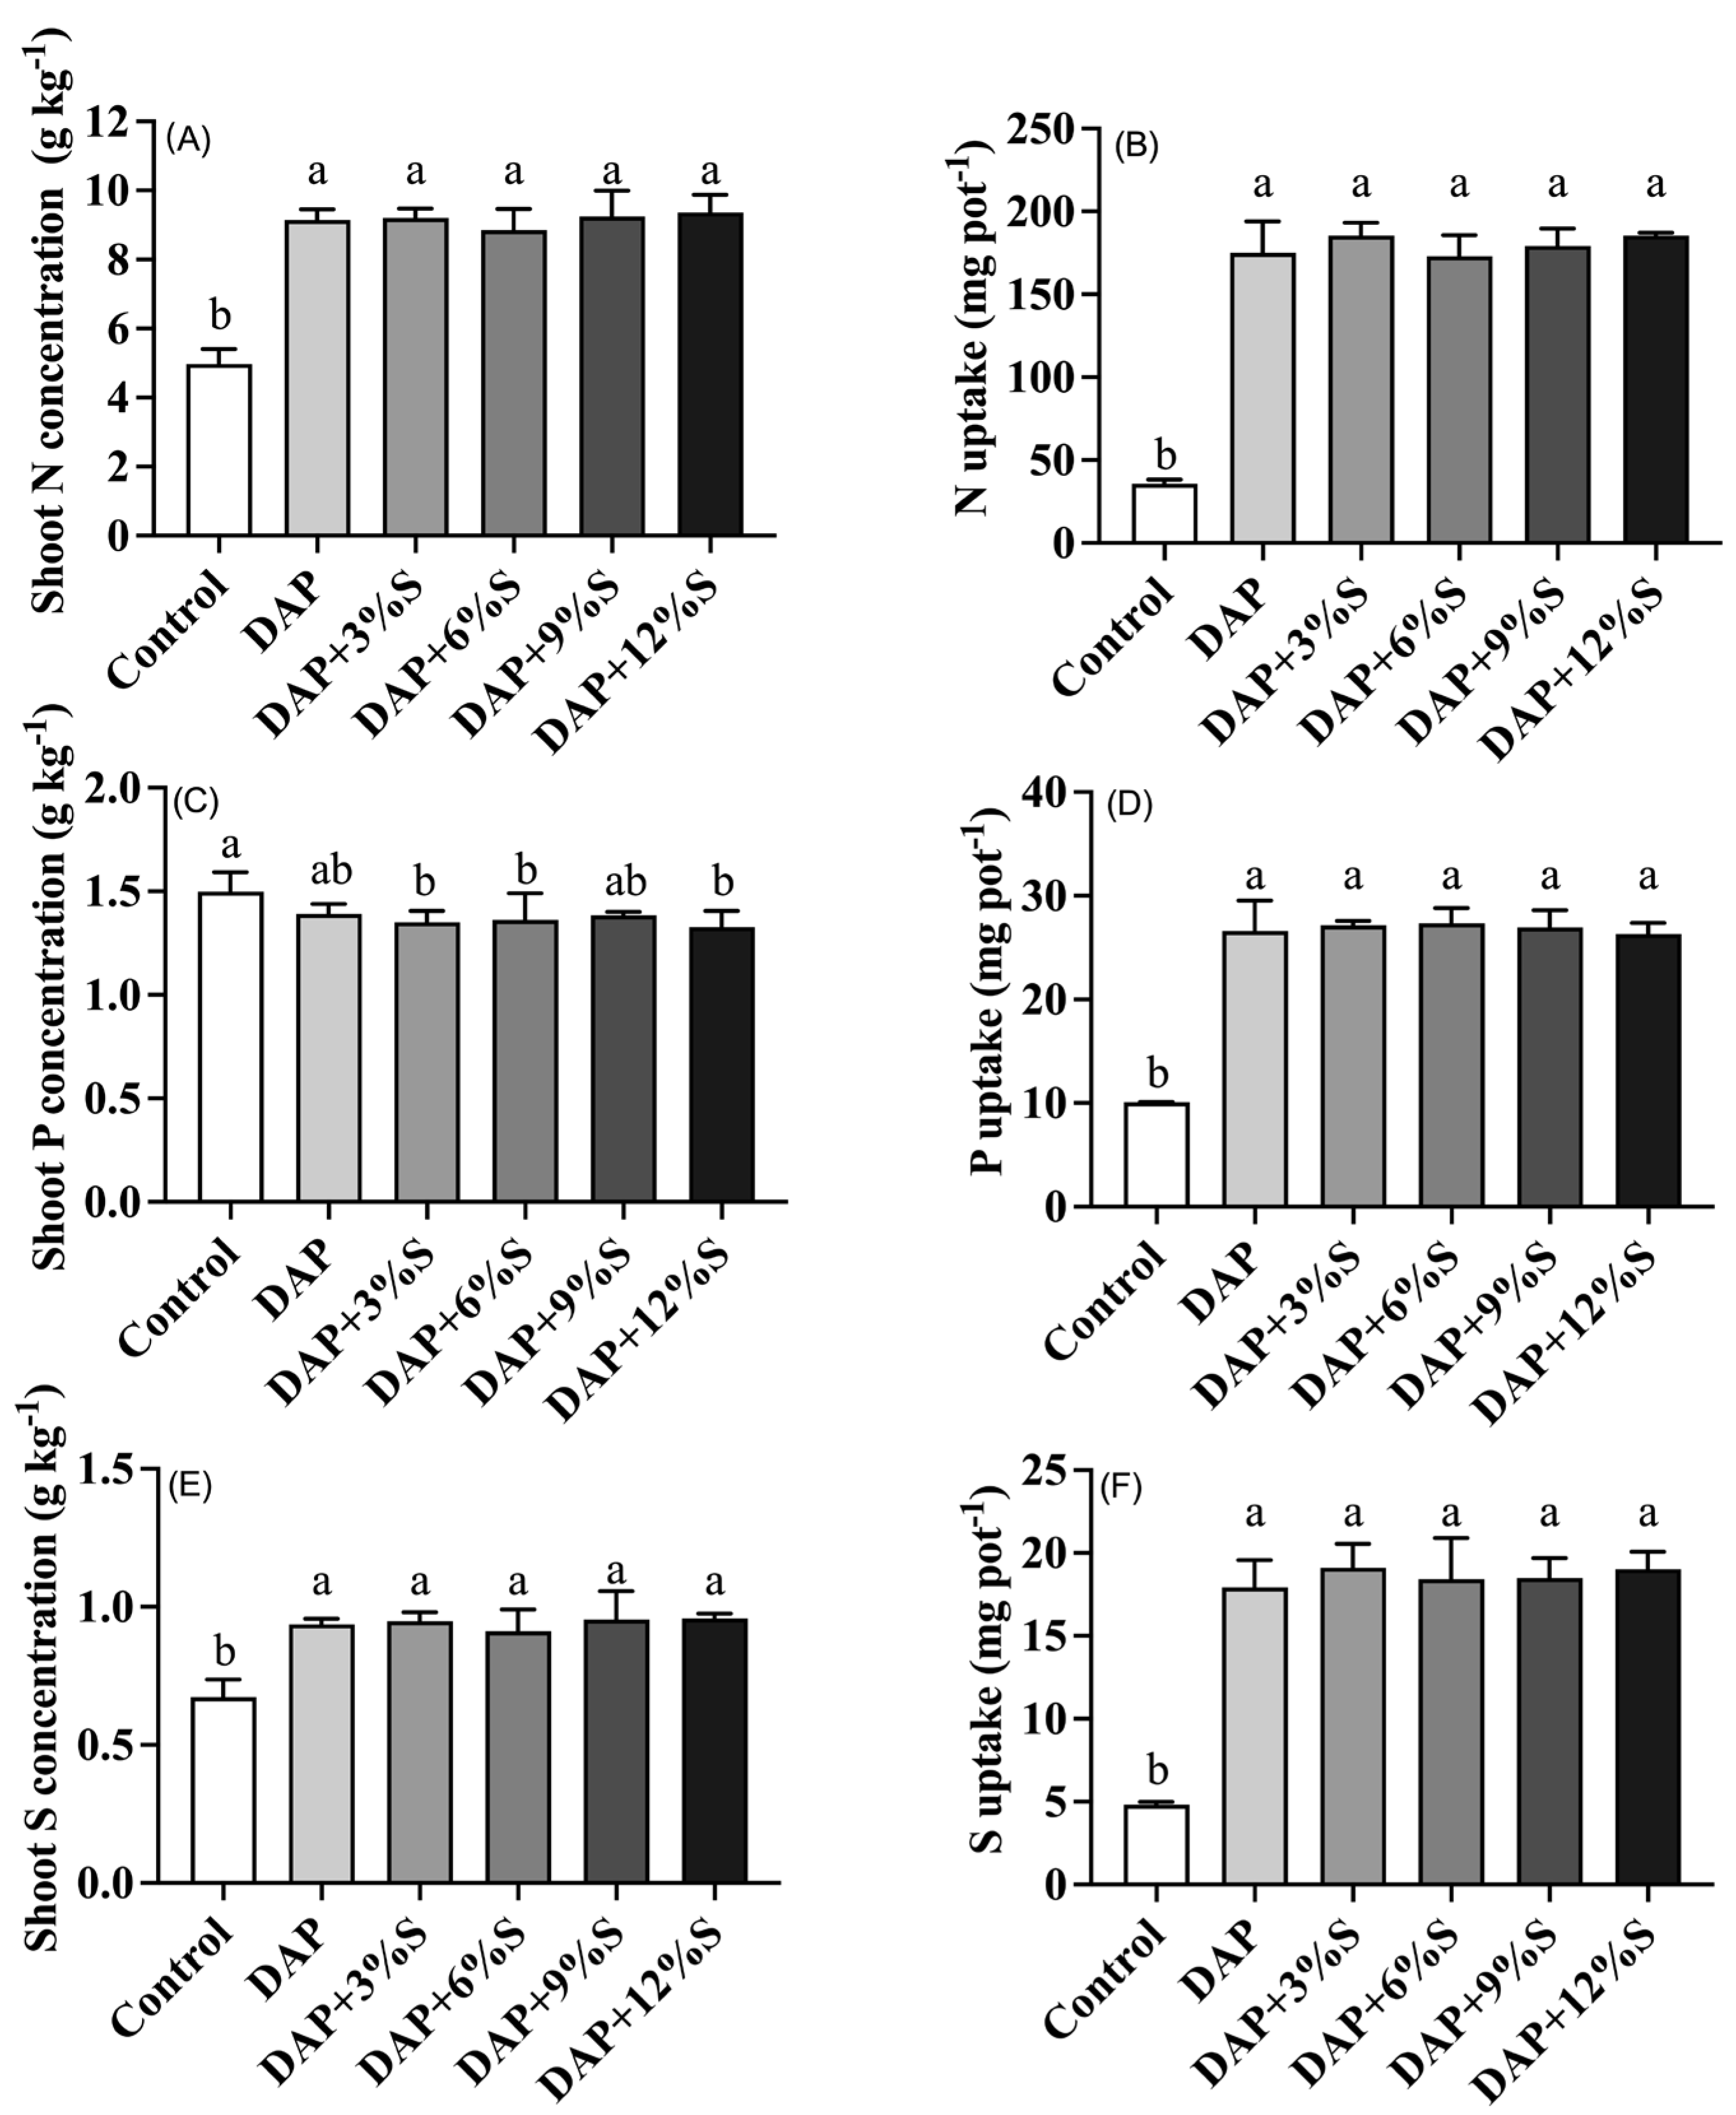
3.3. Effect of Different S Additions to DAP on Crop Yield and Nutrient Uptake

In contrast with MAP, the addition of varying S additions to DAP, even with 12% S addition, did not result in a significant difference between DAP treatment alone and the S-fortified DAP treatments. A similar phenomenon was also observed in the residual effect experiment, which assessed the effect of S-fortified DAP fertilizers on the shoot dry matter yield (Figure 3).
The concentration and uptake of N, P, and S in the maize shoots were also measured to assess the nutrient availability in the S-fortified DAP treatments (Figure 4). Moreover, no significant differences were found between DAP and the S-fortified DAP treatments in terms of the concentration and uptake of N, P, and S.

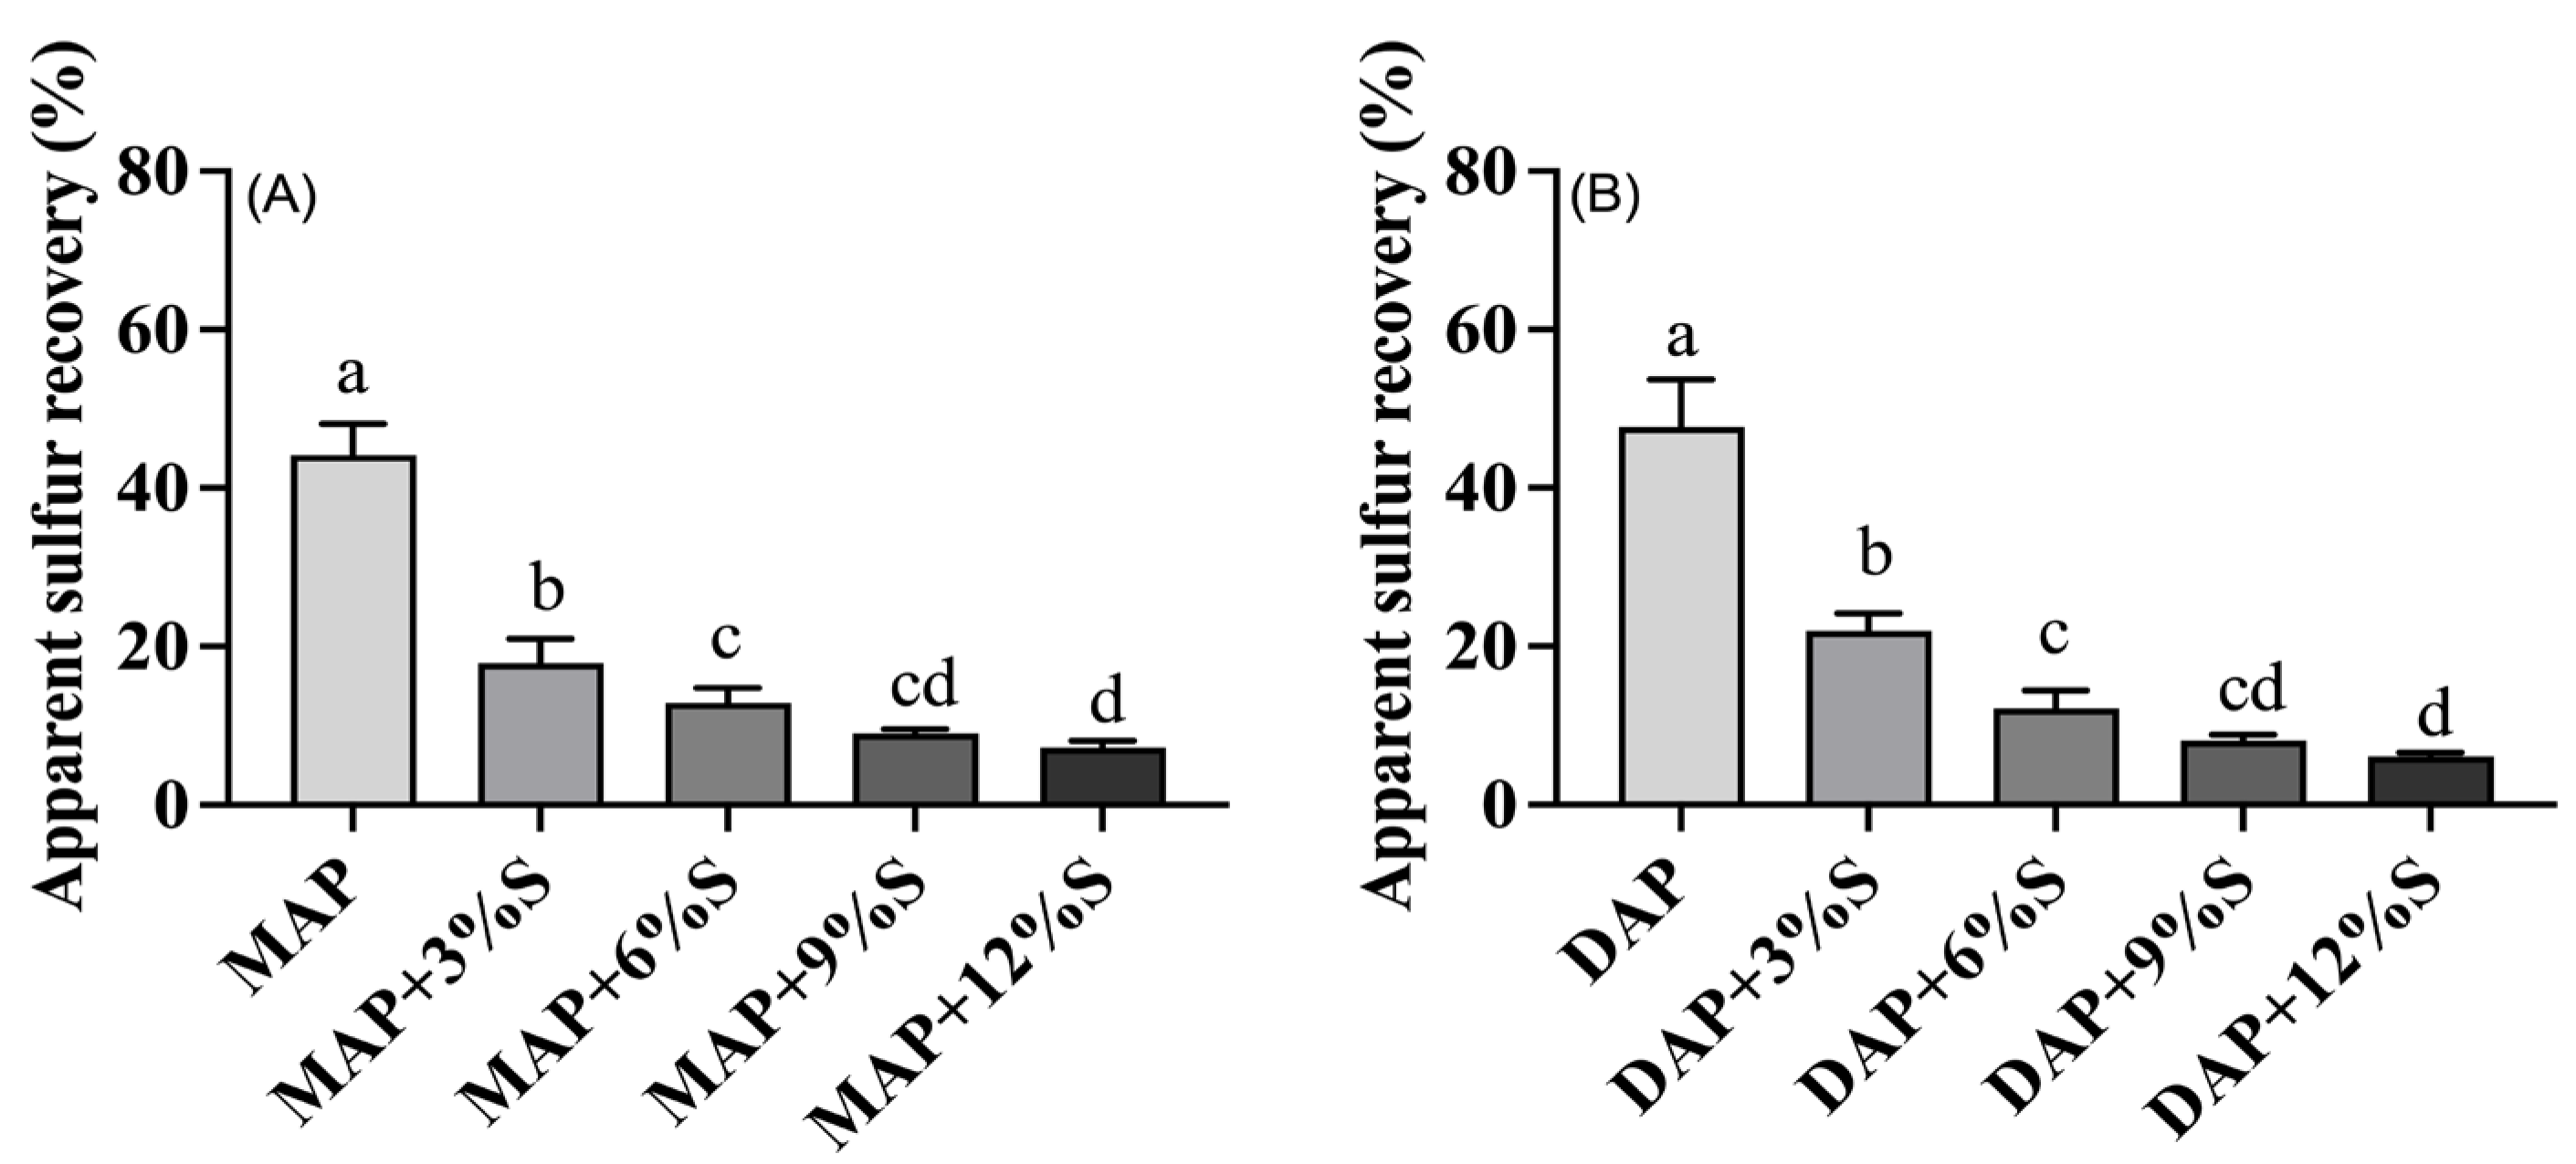
3.4. The Effect of Different S Additions to MAP and DAP on Apparent Sulfur Recovery

The effects of different S additions to MAP and DAP on apparent sulfur recovery were also evaluated. There was a strongly significant relationship between S applied in fertilizers and S uptake by maize for MAP alone or the S-fortified MAP treatments, and no significant relationship was found for DAP alone or the S-fortified DAP treatments (Figure 5). However, there was a significant decline in apparent sulfur recovery with increasing sulfur content in both MAP and DAP treatments (Figure 6). For instance, the apparent sulfur recovery rates of MAP and DAP alone were 44.2% and 47.7%, respectively. When 12% S was applied, the apparent sulfur recovery of MAP+12%S and DAP+12%S dropped to 7.19% and 6.09%, respectively.

4. Discussion

A considerable proportion of the industrialization work on adding S fertilizer into ammonium phosphate fertilizers has been undertaken by commercial companies, with molten elemental S spraying into granulators or, alternatively, elemental S added to phosphoric acid [46]. These processes facilitate elemental S’s presence in fertilizer particles in two ways: either coated on the fertilizer or incorporated into the fertilizer. However, in a study, no significant difference in crop yield and S uptake was found between coated or incorporated elemental S [46]. Therefore, in this study, we produced S-fortified MAP and DAP by incorporating elemental S and ammonium sulfate to evaluate the effect of S-fortified fertilizers on crop yield and nutrient uptake. The results showed that adding S fertilizers to MAP significantly improved the crop yield (Figure 1A) and S uptake (Figure 2F). Similarly, Degryse et al. [29] evaluated the effect of S-fortified MAP on canola yield and S uptake and found that S-fortified MAP could significantly increase the yield and S uptake compared to the control treatment (no S added). Compared with the elemental S–bentonite fertilizers, the application of the S-fortified NP fertilizers also demonstrated superior agricultural outcomes [29,33], probably because the environment for microorganisms was made more suitable due to the residual effects of P [33,49]. However, in this study, there was no significant improvement in yield (Figure 3) and S uptake (Figure 4F) for the S-fortified DAP treatments compared to DAP alone. Nevertheless, the results of Matamwa et al.’s study [46] demonstrated that the S-fortified MAP and DAP treatments all had higher yields and S uptake than the control. One possible reason for the difference was that the elemental S used had a smaller particle size (<75 μm) and, subsequently, the oxidation rate of elemental S to sulfate was faster [33,46,50]. Another potential reason might be the difference in soil pH. The soil used in Matamwa et al.’s study [46] was acidic, whereas the soil used in this study was calcareous. In the calcareous soil, the sulfate ions of S-fortified DAP could easily react with the calcium ions in the soil to form insoluble calcium sulfate precipitation [51,52], which could affect the absorption and utilization of S by crops. Moreover, in an acidic environment, the formation rate of calcium sulfate will be reduced to a certain extent [53], and the effectiveness of sulfate in plants will be improved. This may be the reason why it was more effective to add S fertilizer into the acidic MAP (Table 1) than the alkaline DAP in this study. In addition, in this study, we further compared the effect of DAP and MAP with equivalent S additions on crop yield. Our findings indicated that S-fortified MAP yielded a higher increase in crop yield compared to S-fortified DAP, with a particularly notable difference observed when S additions exceeded 9% (Figure S1). Wang et al. [54] also found that the application of DAP resulted in lower crop yields and nutrient uptake than the application of MAP and other acidic phosphate fertilizers in calcareous soil, mainly because of the reduced ability of DAP to acidify the rhizosphere effectively and the subsequent reduction in P availability. These results indicate that MAP could serve as the optimal phosphate carrier for incorporating S fertilizer to improve the crop yield in calcareous soil.
According to existing research, 30 to 90 kg S ha−1 is the commonly recommended application range [10,25,31,55]. Assuming that the application amount of MAP or DAP applied by farmers was an average of 450 kg ha−1, the S content of S-fortified ammonium phosphate of 6 to 20% could meet the recommended application range. This is in line with the S content of S-fortified phosphate fertilizers on the market. For instance, the S content of the fortified fertilizers produced by the OCP Group is from 5% to 10%; the MicroEssentials fertilizers, produced by Mosaic, typically contain 10% or 15 wt% S [32]. In this study, a significant increase in maize yield (Figure 1A) was observed when the S addition of S-fortified MAP was above 9% compared to MAP treatment alone, due to the higher S uptake for the treatments with higher S additions (Figure 2F). However, no significant difference was found in maize yield (Figure 3) and S uptake (Figure 4F) between the DAP treatment alone and the S-fortified DAP treatments in calcareous soil, even though 12% S (6% elemental S and 6% SO4−S) was incorporated into the DAP, probably because that SO4−S reacts with the calcium ions in calcareous soil to form insoluble calcium sulfate precipitation, limiting the absorption and utilization of S by crops [51,52]. Sattar et al. [56] compared the effect of elemental S and bioactive-S (elemental sulfur inoculated with S-oxidizing bacteria)-coated DAP on maize yield and found that there was no significant difference in yield and S uptake between DAP alone and S-fortified DAP treatments when the S content of S-fortified DAP was below 4%. Nevertheless, a significant difference was observed when the S additions exceeded 6% in sandy loam soil, with this effect being induced by the soil pH reduction and increased P availability [56]. In this study, the results showed that it did not improve the P uptake with the increased S additions for S-fortified DAP treatments (Figure 4D), possibly because of the reduced ability of elemental S to acidify the calcareous soil effectively and the subsequent reduction in P availability. However, further research is needed to explain the difference in S addition between MAP and DAP in calcareous soil. In addition, the S fertilizer type was also a key factor affecting the agronomic effects. Many studies indicate that a higher SO4−S portion of S-fortified fertilizer results in a higher crop yield and S uptake, mainly because SO4−S is soluble and can be absorbed by crops immediately, and Elemental S can only be absorbed and utilized by crops after being oxidized to SO4−S, the process of which often takes a considerable amount of time and makes it relatively difficult to meet the sulfur requirements of crops [23,25]. Consequently, fertilizers should be formulated with the appropriate S content and types based on different crop–soil–climate conditions.
The application of S fertilizer improved the yield and quality of crops; however, we also encountered the issue of low sulfur use efficiency (SUE). Aula et al. [57] found in their study an average SUE of 18% at a global scale for cereal crops from 2005 to 2014. Lower SUE values have also been reported in other studies [58,59,60,61]. Several factors were found to contribute to the low SUE, such as S leaching, retention in crop residues, immobilization, and absorption into the soil [57,60]. Another factor that cannot be ignored is the application rate of the S fertilizer. In this study, with the increase in S application, SUE decreased from an average of 46.0% to 6.64% (Figure 6). This result was similar to the findings of Singh Shivay et al. [62], who demonstrated that SUE decreased from 41.3% to 29.8% with the increase in the S application level from 15 to 45 kg S ha−1. However, Bharathi and Poongothai [58] found in their study that SUE increased with increasing levels of S application up to 30 kg S ha−1 but then decreased at levels of 40 kg S ha−1. Gupta and Jain [59] indicated in their study that SUE increased from 18.6% to 21.4% when the level of S application was increased from 15 kg S ha−1 to 45 kg S ha−1. It is well known that the soil’s initial S concentration directly affected the SUE of S-fortified fertilizers. When the soil’s initial S concentration was low, crops would absorb more S from fertilizers. Within an optimal range of S application, SUE tended to increase with higher rates of S application. However, if S application surpassed the optimal amount, the SUE declined [59]. In addition, the S fertilizer type also had an important effect on SUE. Matamwa et al. [46] compared the effect of SO4−S and elemental S on SUE in their study and found that the application of SO4−S, such as single superphosphate and gypsum, results in higher SUE values than the application of elemental S, due to the slow oxidation of elemental S to SO4−S [50,63,64]. In this study, elemental S accounted for half of the S application, which was also a significant factor contributing to the reduced SUE. To accelerate the rate of elemental S oxidation, the use of elemental S with a smaller particle size or inoculated with S-oxidizing bacteria has gained broad attention [56,65,66]. The application of elemental S combined with organic amendments such as poultry and farmyard manure could also increase S oxidation and availability due to improved microbial activity [34]. However, with growing populations and an increasing demand for food, S fertilizers may be applied more frequently in the future [57]. Therefore, innovative and integrated strategies for minimizing S deficiency, improving crop yield, and maximizing SUE are worthy of further attention.

5. Conclusions

In this study, we found that MAP with S addition above 9% could significantly improve the shoot dry matter yield of maize owing to the higher S uptake compared to that of MAP treatment alone. Unfortunately, there was no significant difference between DAP alone and the S-fortified DAP treatments in calcareous soil. There was a strong relationship between S applied in fertilizers and S uptake by maize for MAP-based fertilizers. However, the apparent sulfur recovery declined with the increase in the level of S application for both MAP-based and DAP-based fertilizers. Our results suggest that the addition of S to MAP could be a simple and effective approach with great potential to minimize soil S deficiency, improve the crop yield in calcareous soil, and contribute to global food security. However, further research is needed to explain the difference in S addition between MAP and DAP in calcareous soil, and innovative and integrated strategies are worth considering to realize the synergies of a high crop yield and high SUE.

Supplementary Materials

The following supporting information can be downloaded at: https://www.mdpi.com/article/10.3390/agronomy14061145/s1, Figure S1. Shoot dry matter yield of maize on soil fertilized with diammonium phosphate (DAP) or monoammonium phosphate (MAP) without co-granulation or co-granulated with 3%S, 6%S, 9%S and 12%S.

Author Contributions

Z.L., Y.W. and C.H. designed the experiments. Z.L. wrote the manuscript. Z.L., J.L. and Y.Z. performed the experiments and analyzed the data. All authors have read and agreed to the published version of the manuscript.

Funding

This work received financial support from the National Key Research and Development Program of China (2023YFD1700203) and the Yunnan Provincial Major Science and Technology Special Project (202102AE090030).

Data Availability Statement

The data presented in this study are available in the article.

Conflicts of Interest

The authors declare no conflicts of interest.

References

  1. Feinberg, A.; Stenke, A.; Peter, T.; Hinckley, E.L.S.; Driscoll, C.T.; Winkel, L.H. Reductions in the deposition of sulfur and selenium to agricultural soils pose risk of future nutrient deficiencies. Commun. Earth Environ. 2021, 2, 101. [Google Scholar] [CrossRef]
  2. Bouranis, D.L.; Malagoli, M.; Avice, J.C.; Bloem, E. Advances in plant sulfur research. Plants 2020, 9, 256. [Google Scholar] [CrossRef]
  3. Droux, M. Sulfur assimilation and the role of sulfur in plant metabolism: A survey. Photosynth. Res. 2004, 79, 331–348. [Google Scholar] [CrossRef] [PubMed]
  4. Li, Q.; Gao, Y.; Yang, A. Sulfur homeostasis in plants. Int. J. Mol. Sci. 2020, 21, 8926. [Google Scholar] [CrossRef] [PubMed]
  5. Narayan, O.P.; Kumar, P.; Yadav, B.; Dua, M.; Johri, A.K. Sulfur nutrition and its role in plant growth and development. Plant Signal. Behav. 2023, 18, 2030082. [Google Scholar] [CrossRef]
  6. Kopriva, S.; Malagoli, M.; Takahashi, H. Sulfur nutrition: Impacts on plant development, metabolism, and stress responses. J. Exp. Bot. 2019, 70, 4069–4073. [Google Scholar] [CrossRef]
  7. Hill, C.R.; Shafaei, A.; Balmer, L.; Lewis, J.R.; Hodgson, J.M.; Millar, A.H.; Blekkenhorst, L.C. Sulfur compounds: From plants to humans and their role in chronic disease prevention. Crit. Rev. Food Sci. 2023, 63, 8616–8638. [Google Scholar] [CrossRef]
  8. Jez, J.M.; Fukagawa, N.K. Plant sulfur compounds and human health. In Sulfur: A Missing Link between Soils, Crops, and Nutrition; John Wiley & Sons: Hoboken, NJ, USA, 2008; Volume 50, pp. 281–291. [Google Scholar]
  9. Pasricha, N.S.; Abrol, Y.P. Food Production and Plant Nutrient Sulphur. Sulphur in Plants; Springer: Dordrecht, The Netherlands, 2003; pp. 29–44. [Google Scholar]
  10. Fan, M.X.; Messick, D.L. Advances in sulfur fertilizer requirement and research for Chinese agriculture: Summary of field trial data from TSI’s China project from 1997 to 2003. Landbauforsch. Völkenrode FAL Agric. Res. 2005, 283, 23–27. [Google Scholar]
  11. Hawkesford, M.J. Plant responses to sulphur deficiency and the genetic manipulation of sulphate transporters to improve S-utilization efficiency. J. Exp. Bot. 2000, 51, 131–138. [Google Scholar] [CrossRef] [PubMed]
  12. Ingenbleek, Y.; Kimura, H. Nutritional essentiality of sulfur in health and disease. Nutr. Rev. 2013, 71, 413–432. [Google Scholar] [CrossRef]
  13. Raffan, S.; Oddy, J.; Halford, N.G. The sulphur response in wheat grain and its implications for acrylamide formation and food safety. Int. J. Mol. Sci. 2020, 21, 3876. [Google Scholar] [CrossRef]
  14. Zenda, T.; Liu, S.T.; Dong, A.Y.; Duan, H.J. Revisiting sulphur—The once neglected nutrient: It’s roles in plant growth, metabolism, stress tolerance and crop production. Agriculture 2021, 11, 626. [Google Scholar] [CrossRef]
  15. Degryse, F.; Baird, R.; da Silva, R.C.; Holzapfel, C.B.; Kappes, C.; Tysko, M.; McLaughlin, M.J. Sulfur uptake from fertilizer fortified with sulfate and elemental S in three contrasting climatic zones. Agronomy 2020, 10, 1035. [Google Scholar] [CrossRef]
  16. Hinckley, E.L.S.; Crawford, J.T.; Fakhraei, H.; Driscoll, C.T. A shift in sulfur-cycle manipulation from atmospheric emissions to agricultural additions. Nat. Geosci. 2020, 13, 597–604. [Google Scholar] [CrossRef]
  17. Aulakh, M.S. Crop Responses to Sulphur Nutrition. Sulphur in Plants; Springer: Dordrecht, The Netherlands, 2003; pp. 341–358. [Google Scholar]
  18. The Sulphur Institute. Sulphur—A Dynamic Nutrient in Chinese Agriculture. 2015. Available online: https://www.sulphurinstitute.org (accessed on 12 April 2024).
  19. Samreen, T.; Degryse, F.; Baird, R.; Da Silva, R.C.; Zahir, Z.A.; Nazir, M.Z.; Wakeel, A.; Muntaha, S.T.; McLaughlin, M.J. Development and testing of improved efficiency boron-enriched diammonium phosphate fertilizers. J. Soil Sci. Plant Nutr. 2021, 21, 1134–1143. [Google Scholar] [CrossRef]
  20. Carciochi, W.D.; Salvagiotti, F.; Pagani, A.; Calvo, N.I.R.; Eyherabide, M.; Rozas, H.R.S.; Ciampitti, I.A. Nitrogen and sulfur interaction on nutrient use efficiencies and diagnostic tools in maize. Eur. J. Agron. 2020, 116, 126045. [Google Scholar] [CrossRef]
  21. Guelfi, D.; Nunes, A.P.P.; Sarkis, L.F.; Oliveira, D.P. Innovative phosphate fertilizer technologies to improve phosphorus use efficiency in agriculture. Sustainability 2022, 14, 14266. [Google Scholar] [CrossRef]
  22. Mustafa, A.; Athar, F.; Khan, I.; Chattha, M.U.; Nawaz, M.; Shah, A.N.; Mahmood, A.; Batool, M.; Aslam, M.T.; Jaremko, M.; et al. Improving crop productivity and nitrogen use efficiency using sulfur and zinc-coated urea: A review. Front. Plant Sci. 2022, 13, 942384. [Google Scholar] [CrossRef] [PubMed]
  23. Chien, S.H.; Teixeira, L.A.; Cantarella, H.; Rehm, G.W.; Grant, C.A.; Gearhart, M.M. Agronomic effectiveness of granular nitrogen/phosphorus fertilizers containing elemental sulfur with and without ammonium sulfate: A review. Agron. J. 2016, 108, 1203–1213. [Google Scholar] [CrossRef]
  24. Bouranis, D.L.; Gasparatos, D.; Zechmann, B.; Bouranis, L.D.; Chorianopoulou, S.N. The effect of granular commercial fertilizers containing elemental sulfur on wheat yield under mediterranean conditions. Plants 2018, 8, 2. [Google Scholar] [CrossRef]
  25. Degryse, F.; Da Silva, R.C.; Baird, R.; Beyrer, T.; Below, F.; McLaughlin, M.J. Uptake of elemental or sulfate-S from fall-or spring-applied co-granulated fertilizer by corn—A stable isotope and modeling study. Field Crop Res. 2018, 221, 322–332. [Google Scholar] [CrossRef]
  26. Karimizarchi, M.; Aminuddin, H.; Khanif, M.Y.; Radziah, O. Elemental sulphur application effects on nutrient availability and sweet maize (Zea mays L.) response in a high pH soil of Malaysia. Malay. J. Soil Sci. 2014, 18, 75–86. [Google Scholar]
  27. Kulczycki, G. The effect of elemental sulfur fertilization on plant yields and soil properties. Adv. Agron. 2021, 167, 105–181. [Google Scholar]
  28. Yasmin, N.; Blair, G.; Till, R. Effect of elemental sulfur, gypsum, and elemental sulfur coated fertilizers, on the availability of sulfur to rice. J. Plant Nutr. 2007, 30, 79–91. [Google Scholar] [CrossRef]
  29. Degryse, F.; Ajiboye, B.; Baird, R.; Da Silva, R.C.; McLaughlin, M.J. Availability of fertiliser sulphate and elemental sulphur to canola in two consecutive crops. Plant Soil. 2016, 398, 313–325. [Google Scholar] [CrossRef]
  30. Francisco, E.A.; Chien, S.H.; Ono, F.; Gearhart, M.M.; Cruz, A.P. Comparing various sulfur sources for soybean grown on an acid Oxisol in Brazil. Agron. J. 2022, 114, 3420–3428. [Google Scholar] [CrossRef]
  31. Solberg, E.D.; Malhi, S.S.; Nyborg, M.; Henriquez, B.; Gill, K.S. Crop response to elemental S and sulfate-S sources on S-deficient soils in the parkland region of Alberta and Saskatchewan. J. Plant Nutr. 2007, 30, 321–333. [Google Scholar] [CrossRef]
  32. Degryse, F.; Baird, R.; Andelkovic, I.; McLaughlin, M.J. Long-term fate of fertilizer sulfate-and elemental S in co-granulated fertilizers. Nutr. Cycl. Agroecosystems 2021, 120, 31–48. [Google Scholar] [CrossRef]
  33. Friesen, D.K. Influence of co-granulated nutrients and granule size on plant responses to elemental sulfur in compound fertilizers. Nutr. Cycl. Agroecosystems 1996, 46, 81–90. [Google Scholar] [CrossRef]
  34. Malik, K.M.; Khan, K.S.; Billah, M.; Akhtar, M.S.; Rukh, S.; Alam, S.; Munir, A.; Aulakh, A.M.; Rahim, M.; Qaisrani, M.M.; et al. Organic amendments and elemental sulfur stimulate microbial biomass and sulfur oxidation in alkaline subtropical soils. Agronomy 2021, 11, 2514. [Google Scholar] [CrossRef]
  35. Maharjan, B.; Das, S.; Shapiro, C.A. Effects of fused and blended fertilizers on maize yield and soil properties. Agron. J. 2022, 114, 3429–3444. [Google Scholar] [CrossRef]
  36. Wang, Y.; Fang, J.W.; Li, Z.X. Production and development trends of phosphate and compound fertilizer industry in China in 2022. Phosphate Comp. Fert. 2023, 38, 1–8. (In Chinese) [Google Scholar]
  37. Yang, L.; Stulen, I.; De Kok, L.J. Sulfur status of Chinese soils and response of Chinese cabbage to sulfur fertilization in the Beijing area. Landbauforsch. Völkenrode FAL Agric. Res. 2005, 283, 163–170. [Google Scholar]
  38. Khan, M.J.; Khan, M.H.; Khattak, R.A.; Jan, M.T. Response of maize to different levels of sulfur. Commun. Soil Sci. Plan. 2006, 37, 41–51. [Google Scholar] [CrossRef]
  39. Wainwright, M.; Nevell, W.; Grayston, S.J. Effects of organic matter on sulphur oxidation in soil and influence of sulphur oxidation on soil nitrification. Plant Soil. 1986, 96, 369–376. [Google Scholar] [CrossRef]
  40. Kovar, J.L. Maize response to sulfur fertilizer in three Iowa soils. Commun. Soil Sci. Plan. 2021, 52, 905–915. [Google Scholar] [CrossRef]
  41. Lu, Z. The Development and Evaluation of Magnesium-fortified Compound Fertilizer. Ph.D. Thesis, China Agricultural University, Beijing, China, 2021. [Google Scholar]
  42. Lu, Z.; Wang, Y.; Degryse, F.; Huang, C.; Hou, C.; Wu, L.; Mclaughlin, M.; Zhang, F. Magnesium-fortified phosphate fertilizers improve nutrient uptake and plant growth without reducing phosphorus availability. Pedosphere 2022, 32, 744–751. [Google Scholar] [CrossRef]
  43. Zhao, T.K.; Zhang, G.Y.; Ma, L.M.; Sun, Z.Y. The contents, forms and distribution of sulfur in soils of Hebei. Plant Nutr. Fert. Sci. 2001, 7, 178–182. (In Chinese) [Google Scholar]
  44. Jones, J. Laboratory Guide for Conducting Soil Tests and Plant Analysis; CRC Press: Boca Raton, FL, USA, 2001. [Google Scholar]
  45. Everaert, M.; Duboc, O.; Willems, E.; Soja, G.; Pfeifer, C.; Van Velthoven, N.; de Oliveira-Silva, R.; Sakellariou, D.; Santner, J. Thermochemical processing of boron-impregnated cellulose insulation waste for upcycling to slow-release boron fertilizers. J. Clean. Prod. 2023, 399, 136684. [Google Scholar] [CrossRef]
  46. Matamwa, W.; Blair, G.; Guppy, C.; Yunusa, I. Plant availability of sulfur added to finished fertilizers. Commun. Soil. Sci. Plan. 2018, 49, 433–443. [Google Scholar] [CrossRef]
  47. Regulation (EC) No 2003/2003 of the European Parliament and of the Council of 13 October 2003 Relating to Fertilisers; Office for Official Publications of the European Communities: Luxembourg, 2003.
  48. Ministry of Agriculture of the People’s Republic of China. Water-Soluble Fertilizers Determination of Water Insoluble Matter and pH; China Agriculture Press: Beijing, China, 2011. [Google Scholar]
  49. Sample, E.; Soper, R.; Racz, G. Reactions of phosphate fertilizer in soils. In Role of Phosphorus in Agriculture; Khasawneh, F.E., et al., Eds.; SSSA: Madison, WI, USA, 1980; pp. 263–310. [Google Scholar]
  50. Degryse, F.; Da Silv, R.C.; Baird, R.; McLaughlin, M.J. Effect of cogranulation on oxidation of elemental sulfur: Theoretical model and experimental validation. Soil Sci. Soc. Am. J. 2016, 80, 1244–1253. [Google Scholar] [CrossRef]
  51. Li, S.; Li, C.; Fu, X. Characteristics of soil salt crust formed by mixing calcium chloride with sodium sulfate and the possibility of inhibiting wind-sand flow. Sci. Rep. 2021, 11, 9746. [Google Scholar] [CrossRef]
  52. Li, W.; Wang, T.; Yang, Y.; Fang, M.; Gao, X. Calcium recovery from waste carbide slag via ammonium sulfate leaching system. J. Clean. Prod. 2022, 377, 134308. [Google Scholar] [CrossRef]
  53. Wang, Y.; Mao, X.; Chen, C.; Wang, W.; Dang, W. Effect of sulfuric acid concentration on morphology of calcium sulfate hemihydrate crystals. Mater. Res. Express 2020, 7, 105501. [Google Scholar] [CrossRef]
  54. Wang, L.Y. Effects of Different Phosphorus Supplies on the Root-Soil-Microbe Interactions and Rhizosphere Regulation Mechanisms for Improving Phosphorus Use Efficiency by Maize. Ph.D. Thesis, China Agricultural University, Beijing, China, 2022. (In Chinese). [Google Scholar]
  55. Bhattarai, D.; Kumar, S.; Nleya, T. Nitrogen and sulfur fertilizers effects on growth and yield of Brassica carinata in South Dakota. Agron. J. 2021, 113, 1945–1960. [Google Scholar] [CrossRef]
  56. Sattar, B.; Ahmad, S.; Daur, I.; Hussain, M.B.; Ali, M.; Ul Haq, T.; Arif, M.; Bakhtawer, M. Bioactive-sulfur coated diammonium phosphate improves nitrogen and phosphorus use efficiency and maize (Zea mays L.) yield. J. Environ. Agr. Sci. 2021, 23, 23–29. [Google Scholar]
  57. Aula, L.; Dhillon, J.S.; Omara, P.; Wehmeyer, G.B.; Freeman, K.W.; Raun, W.R. World sulfur use efficiency for cereal crops. Agron. J. 2019, 111, 2485–2492. [Google Scholar] [CrossRef]
  58. Bharathi, C.; Poongothai, S. Direct and residual effect of sulphur on growth, nutrient uptake, yield and its use efficiency in maize and subsequent greengram. Res. J. Agr. Biol. Sci. 2008, 4, 368–372. [Google Scholar]
  59. Gupta, A.K.; Jain, N.K. Sulphur fertilization in a pearl millet (Pennisetum glaucum)-Indian mustard (Brassica juncea) cropping system. Arch. Agron. Soil Sci. 2008, 54, 533–539. [Google Scholar] [CrossRef]
  60. Singh, S.P.; Singh, R.; Singh, M.P.; Singh, V.P. Impact of sulfur fertilization on different forms and balance of soil sulfur and the nutrition of wheat in wheat-soybean cropping sequence in tarai soil. J. Plant Nutr. 2014, 37, 618–632. [Google Scholar] [CrossRef]
  61. Haque, M.M.; Saleque, M.A.; Shah, A.L.; Biswas, J.C.; Kim, P.J. Long-term effects of sulfur and zinc fertilization on rice productivity and nutrient efficiency in double rice cropping paddy in Bangladesh. Commun. Soil Sci. Plant Anal. 2015, 46, 2877–2887. [Google Scholar] [CrossRef]
  62. Singh Shivay, Y.; Prasad, R.; Pal, M. Effect of levels and sources of sulfur on yield, sulfur and nitrogen concentration and uptake and S-use efficiency in basmati rice. Commun. Soil Sci. Plant Anal. 2014, 45, 2468–2479. [Google Scholar] [CrossRef]
  63. Blair, G.J.; Lefroy, R.B.; Dana, M.; Anderson, G.C. Modelling of sulfur oxidation from elemental sulfur. Plant Soil 1993, 155, 379–382. [Google Scholar] [CrossRef]
  64. Fontaine, D.; Eriksen, J.; Sørensen, P.; McLaughlin, M.J.; Degryse, F. Application method influences the oxidation rate of biologically and chemically produced elemental sulfur fertilizers. Soil Sci. Soc. Am. J. 2021, 85, 746–759. [Google Scholar] [CrossRef]
  65. Goyal, D.; Franzen, D.W.; Chatterjee, A. Do crops’ responses to sulfur vary with its forms? Agrosyst. Geosci. Environ. 2021, 4, e20201. [Google Scholar] [CrossRef]
  66. Mattiello, E.; da Silva, R.; Degryse, F.; Baird, R.; Gupta, V.; Mclaughlin, M. Sulfur and zinc availability from co-granulated Zn-enriched elemental sulfur fertilizers. J. Agric. Food Chem. 2017, 65, 1108–1115. [Google Scholar] [CrossRef]
Figure 1. Shoot dry matter yield of maize on the control soil (no fertilizer added) or soil fertilized with monoammonium phosphate (MAP) without co-granulation or co-granulated with 3%S (1.5% SO4−S + 1.5% elemental S), 6%S (3% SO4−S + 3% elemental S), 9%S (4.5% SO4−S + 4.5% elemental S), and 12%S (6% SO4−S + 6% elemental S) in the seasonal crop (A) and the second crop (B). The bars represent the standard errors of four replicated pots. Different letters above the bars indicate significant differences (p ≤ 0.05).
Agronomy 14 01145 g001
Figure 2. The concentration and uptake of nitrogen (A,B), phosphorus (C,D), and sulfur (E,F) in maize shoots on the control soil (no fertilizer added) or soil fertilized with monoammonium phosphate (MAP) without co-granulation or co-granulated with 3%S (1.5% SO4−S + 1.5% elemental S), 6%S (3% SO4−S + 3% elemental S), 9%S (4.5% SO4−S + 4.5% elemental S), and 12%S (6% SO4−S + 6% elemental S) in the seasonal crop. The bars represent the standard errors of four replicated pots. Different letters above the bars indicate significant differences (p ≤ 0.05).
Agronomy 14 01145 g002
Figure 3. Shoot dry matter yield of maize on the control soil (no fertilizer added) or soil fertilized with diammonium phosphate (DAP) without co-granulation or co-granulated with 3%S (1.5% SO4−S + 1.5% elemental S), 6%S (3% SO4−S + 3% elemental S), 9%S (4.5% SO4−S + 4.5% elemental S), and 12%S (6% SO4−S + 6% elemental S) in the seasonal crop (A) and the second crop (B). The bars represent the standard errors of four replicated pots. Different letters above the bars indicate significant differences (p ≤ 0.05).
Agronomy 14 01145 g003
Figure 4. The concentration and uptake of nitrogen (A,B), phosphorus (C,D), and sulfur (E,F) in maize shoots on the control soil (no fertilizer added) or soil fertilized with diammonium phosphate (DAP) without co-granulation or co-granulated with 3%S (1.5% SO4−S + 1.5% elemental S), 6%S (3% SO4−S + 3% elemental S), 9%S (4.5% SO4−S + 4.5% elemental S), and 12%S (6% SO4−S + 6% elemental S) in the seasonal crop. The bars represent the standard errors of four replicated pots. Different letters above the bars indicate significant differences (p ≤ 0.05).
Agronomy 14 01145 g004
Figure 5. The relationship between the amount of S applied in monoammonium phosphate (MAP) (A) and diammonium phosphate (DAP) (B) without co-granulation or co-granulated with 3%S (1.5% SO4−S + 1.5% elemental S), 6%S (3% SO4−S + 3% elemental S), 9%S (4.5% SO4−S + 4.5% elemental S), and 12%S (6% SO4−S + 6% elemental S) and S uptake by maize shoots in the seasonal crop. (* p ≤ 0.05).
Agronomy 14 01145 g005
Figure 6. The apparent sulfur recovery in monoammonium phosphate (MAP) (A) and diammonium phosphate (DAP) (B) without co-granulation or co-granulated with 3%S (1.5% SO4−S + 1.5% elemental S), 6%S (3% SO4−S + 3% elemental S), 9%S (4.5% SO4−S + 4.5% elemental S), and 12%S (6% SO4−S + 6% elemental S) in the seasonal crop. The bars represent the standard errors of four replicated pots. Different letters above the bars indicate significant differences (p ≤ 0.05).
Agronomy 14 01145 g006
Disclaimer/Publisher’s Note: The statements, opinions and data contained in all publications are solely those of the individual author(s) and contributor(s) and not of MDPI and/or the editor(s). MDPI and/or the editor(s) disclaim responsibility for any injury to people or property resulting from any ideas, methods, instructions or products referred to in the content.

