Article

Disentangling the Physiological Responses of Sweet Orange Citrus Trees to Optimize the Design of Deficit Irrigation Strategies

by
Alfredo Emilio Rubio-Casal
1,*,†,
Víctor Hugo Durán-Zuazo
2 and
Iván Francisco García-Tejero
3,†
1
Plant Biology and Ecology Department, Faculty of Biology, University of Seville, 41080 Sevilla, Spain
2
Andalusian Institute for Agricultural and Fisheries Research and Training (IFAPA), Research Center “Camino de Purchil” s/n, 18004 Granada, Spain
3
Andalusian Institute of Teaching and Agricultural Research (IFAPA), Research Center “Las Torres”, Ctra. Sevilla-Cazalla Km 12.2, 41200 Alcalá del Río, Spain
*
Author to whom correspondence should be addressed.
These authors contributed equally to this work.
Agronomy 2024, 14(6), 1149; https://doi.org/10.3390/agronomy14061149
Submission received: 12 April 2024 / Revised: 16 May 2024 / Accepted: 23 May 2024 / Published: 27 May 2024
(This article belongs to the Section Water Use and Irrigation)

Abstract

:
Climate change scenarios and water restrictions are key challenges for Mediterranean citriculture, requiring sustainable deficit irrigation (DI) strategies to ensure sustainable yields. Further research on the physiological pathways that regulate crop responses to water stress is necessary. This work describes the physiological limitations induced under drought conditions in young Navelina orange trees, including the crop’s capability to recuperate its physiological status upon rewatering and after water withholding. A trial was conducted in two-year-old trees subjected to three irrigation treatments: a full irrigation treatment (FI) and two different DI strategies. The results show significant decreases in gas exchange rates for stem water potential (ΨStem) values below −1.5 MPa, evidencing diffusive limitations from drought stress. Additionally, there was evidence of increased osmolyte synthesis, a preventative response to oxidative damage. Significantly increased levels of proline (Pro) and malondialdehyde (MDA) were observed with higher levels of water stress (ΨStem < −1.8 MPa), which leads us to assume that this threshold signals the presence of oxidative damage with no capacity for subsequent recovery, probably affecting the final yield.

1. Introduction

Citrus (Citrus sinensis L. Osb.) represents one of the most important woody crops in Spain, occupying 306,000 ha, and it is the third most important crop in Andalusia in terms of surface area, occupying 94,400 ha. Sweet orange is the most representative citrus species, covering 64,300 ha [1].
The citrus sector faces an increasingly uncertain scenario regarding the availability of natural resources due to the limitations of water resources and their management [2]. The main challenge is the development of an adequate irrigation water management strategy to adapt to water scarcity scenarios and adverse climatic conditions. Several works have described the potential effects of climate change on ecosystems and how these scenarios could affect crops, especially in response to water scarcity and air temperature increases [3]. Few works have modeled the responses of citrus species to different water and heat stress scenarios, especially those concerning the physiological changes that occur under drought conditions and how these responses affect plant growth and crop productivity [4].
Citrus trees are classified as C3 evergreen plants and have hypo-stomatal leaves covered with a fine cuticle and relatively low CO2 assimilation and stomatal conductance (gs) rates under well-irrigated conditions. Their leaves have an average lifespan of one year, although they can live up to three years under optimal conditions. This crop has a high capacity for acclimatization to seasonal changes, such as those in incident radiation or air temperature. The leaf area index (LAI, m2 leaf area / m2 ground area) of citrus trees can be high, even higher than nine, when grown under optimum management conditions [5]. This is due to the marked gs reduction when the air vapor pressure deficit (VPD) increases and the high diffusive resistance to CO2 in the stomata and mesophyll [6]. Although these characteristics could represent a productive disadvantage for the crop, they contribute to avoiding dehydration situations and embolism in severe drought conditions.
Deficit irrigation (DI) strategies for perennial crops, including citrus crops, in semiarid areas of southern Spain are mandatory under current water scarcity scenarios. When implementing these strategies, it is crucial to define the threshold values of drought stress that could cause several types of crop damage (i.e., affecting their potential growth and survival capability, and significantly reducing their final yields and fruit quality [7,8]). All of these major responses result from the physiological traits affected by a water deficit, with holistic changes encompassing physiological, biochemical, and metabolic routes [9].
Water stress negatively impacts a crop’s physiological status, affecting different response routes (depending on the level and duration of water stress), which can produce yield losses [10]. The yield response is determined by the phenological stage in which water stress is imposed [11], the crop responses induced, and the drought intensity [9]. In addition, a tree’s capacity to adapt to moderate and/or severe situations of water stress greatly varies with its age. Therefore, young trees may have a more limited response capacity than adult trees, with a smaller margin for recovery and cumulative effects on production, tree growth, and bud development in subsequent seasons.
In physiological terms, drought conditions affect a crop’s potential to keep water in its tissues, which affects the relative water content (RWC) [12]. This response is related to the crop’s capability to regulate gas exchange rates under water stress conditions. According to [13], abscisic acid (ABA) plays an important role in citrus crops subjected to drought, with significantly increased levels detected under water stress in leaves and roots. Additionally, the roles of ABA, salicylic acid (SA), and jasmonic acid (JA) in the physiological response to combined water and heat stress have been highlighted [12,14]. These studies verified that SA levels significantly increased in response to water and thermal stress situations, and the combination of both stresses exerted an additive effect. An affected RWC intensifies chlorophyll degradation. Chlorophyll degradation reduces a crop’s fluorescence emission capacity. As light radiation cannot be used in the electron transport chain or be reflected as fluorescence, the excess radiation, therefore, increases the reactive oxygen species (ROS) level, causing significant oxidative damage to the plant tissues and proline (Pro) accumulation as an osmoprotectant species [15]. ROS accumulation can promote cell destruction, causing lipid peroxidation, damage to the membrane, proteins, chlorophyll, and nucleic acids, and cell death [16,17]. Thus, a crop’s capability to increase ROS reduction signals its water stress tolerance [18]. These damages highly depend on the water stress intensity and duration. Crops have different mechanisms to avoid oxidative damage under increased ROS levels (i.e., synthesizing antioxidative enzymes and other antioxidants to protect cells). Different chemical markers indicate the oxidative damage degree, such as the content of malondialdehyde (MDA), a subproduct of the lipid peroxidation of biological membranes [19]. A significant increase in MDA levels signals the existence of oxidative damage [20,21].
Plants’ first response to drought stress is to close the stomata to avoid transpiration losses [22]. Thus, the concentration of available CO2 is reduced, which leads to the overproduction of electron transport chain components [23]. The water loss generated under intense water stress leads to tissue damage and wilting. To avoid this process, plants reduce their osmotic potential by accumulating solutes in the cytoplasm, promoting the movement of water into the cells and preserving tissue turgor. Proline is one of the most accumulated amino acids in prolonged drought stress situations [24]; it acts as an osmolyte whose synthesis is related to abiotic stress situations [25].
Considering the different response routes to drought stress in citrus trees, this work aimed to describe the main metabolic routes induced in young sweet orange trees to avoid damage under drought conditions and to determine the threshold values indicating moderate-to-severe damage that will affect the trees’ growth, canopy development, and entry into production.

2. Materials and Methods

2.1. Experimental Site and Irrigation Treatments

The trial was conducted during two consecutive months (July and August, coinciding with the fruit growth period) in the experimental farm “Las Torres” of the Andalusian Institute of Teaching and Agricultural Research (37°30′38.55″ N; 05°57′44.98″ W) in Spain in two-year-old sweet orange trees (Citrus sinensis L. Osb. cv. Navelina) grafted onto Citrange Carrizo (Citrus sinensis Osb. × Poncirus trifoliata Raf.). The trees were planted outdoors in 40 L pots with a 46 cm diameter and 35.4 cm height. These pots were filled with the same soil from the experimental farm, a fluvisol (USDA, 2010) with a typical clayey-loam texture and a field capacity (−0.033 MPa) and permanent wilt point (−1.5 MPa) of 0.42 and 0.17 m3/m3, respectively.
The trees had an average height and canopy diameter of approximately 50 cm and 1 m, respectively. The trees were irrigated with two emitters per pot, with a flow rate of 2.3 L/h, following an irrigation scheduling procedure based on the reference evapotranspiration (ET0) values estimated using the modified Penman equation [26] and the information from a weather station located in the same experimental orchard. The crop evapotranspiration (ETC) values were estimated daily using a crop coefficient (KC) of 0.7 and assuming a crop surface per tree of ~1 m2.
Three irrigation treatments were arranged:
-
A full irrigation (FI) treatment, where trees received 100% of the irrigation requirements (IRs).
-
A low-frequency deficit irrigation (LFDI) treatment, which subjected trees to irrigation restriction cycles. This treatment kept the crops within a previously defined range of physiological threshold values; hence, its application required crop water monitoring. During restriction periods, irrigation was suppressed until reaching stem water potential (ΨStem) values between −1.8 and −2.0 MPa (the threshold values for mature citrus trees presented by García-Tejero et al. [11]). Then, irrigation withholding was finished, and the trees were irrigated with the same frequency as in the FI treatment until reaching similar ΨStem values. The length of the irrigation restriction cycles varied depending on the weather conditions, ranging between 8 and 10 days on average, with 4–5 days of water restriction and a similar period for recovery.
-
A sustained deficit irrigation (SDI) treatment, where trees were irrigated at 75% of the FI treatment.

2.2. Physiological Measurements

2.2.1. Stem Water Potential and Stomatal Conductance

Stem water potential (ΨStem) readings were recorded using a Scholander pressure chamber with an external nitrogen source (3000 Plant Water Status Console, Soil-moisture Equipment Corp., Santa Barbara, CA, USA) [27]. The measurements were performed on two leaves per tree and four trees per treatment. The readings were carried out at noon (solar time), with a periodicity of 48–72 h, depending on the evolution observed in the previous measurements. The selected leaves (mature, healthy, and well developed) were covered with aluminum bags at least 30 min before the readings to achieve an equilibrium between the leaf and stem water potentials.
In the same trees, the stomatal conductance to water vapor (gs) was measured in two sunny leaves per tested tree using a SC-1 porometer (Decagon Devices, Inc., WA, USA).

2.2.2. Canopy Temperature

The canopy temperature (Tc) was measured simultaneous to the ΨStem readings using a ThermaCam (Flir SC660, Flir Systems, USA, 7–13 μm, 640 × 480 pixels) with the emissivity (ε) set at 0.96. Images were taken on the sunlit sides of four trees per irrigation treatment, with the imager placed 0.5 m from the canopy. The background temperature was determined by measuring the temperature of a crumpled sheet of aluminum foil placed close to the leaves of interest using ε = 1 [28]. To analyze these images further, a cooled white screen was used as the background, placed behind each monitored tree to simplify the isolation of the canopy surface via image processing. Finally, the thermal images at tree level were analyzed with the software developed by García-Tejero et al. [29].

2.2.3. Chlorophyll Fluorescence Measurements

Additionally, chlorophyll fluorescence (ChF) measurements were performed during both the restriction–recovery cycles. Two measurements per monitored tree were performed in four trees per treatment (n = 4) during each sample period using a modulated fluorimeter (FMS-2; Hansatech Instrument Ltd., England). This instrument ensured the light saturation of the photosystem (PS) reaction centers with an actinic light pulse of 15,000 µE m−2 s−1 for 0.7 s, allowing us to calculate the fluorescence quenching by combining the light- and dark-adapted fluorescence measurements. The same leaf area used for the dark-adapted measurements was exposed to ambient light for 30 min, and the steady-state fluorescence yield (Fs) was recorded. Then, the leaves were exposed to a saturating actinic light pulse of 15,000 µE m−2 s−1 for 0.7 s to produce the maximum fluorescence yield (Fm′) by temporarily inhibiting PSII photochemistry. The following parameters were calculated using the fluorescence parameters determined in light- and dark-adapted conditions: the PSII quantum efficiency, ΦPSII = (Fm′ − Fs)/Fm′; the photochemical quenching, qP = (Fm′ − Fs)/(Fm′ − F0); and the nonphotochemical quenching, NPQ = (FmFm′)/Fm′ [30].

2.2.4. Proline and Malondialdehyde Content Determination

Coinciding with the chlorophyll fluorescence measurements, sample leaves were collected from each monitored tree (n = 4) during the second restriction–recovery cycle and kept at −20 °C until processing in the laboratory. The Pro content was quantified via extraction with sulfosalicylic acid and subsequent incubation in ninhydrin and glacial acetic acid at 100 °C for 1 h according to the methodology proposed by [31]. The MDA content was determined via extraction in an acidic medium with thiobarbituric acid + tricloracetic acid and subsequent incubation at 95 °C for 30 min [32]. The Pro and MDA contents were analyzed using a Hitachi U-1900 spectrophotometer (Gemini, BV, Güeldres, The Netherlands). The results are expressed in µmol gFW−1 and nmol gFW−1, respectively.

2.3. Measurement Timetable

Table 1 summarizes the different monitoring days during both restriction–recovery cycles, indicating the physiological parameters measured and the water stress situation, taking the LFDI treatment as a reference. Measurements of ΨStem, gs, and TC were carried out during the experiment at different periods of water stress, which were defined by the irrigation-withholding periods in the LFDI treatment.

2.4. Statistical Analysis

Data recording of the different traits over time (DOY) was performed on the same individuals. The daily data were checked for their normality and homoscedasticity. A repeated measures ANOVA was performed, additional applying a Tukey post hoc test for means separation with a p < 0.05 significance level for the different physiological variables. Sigma Plot Software 15.0 (Sigma Plot, 2479 E. Bayshore Rd, Suite 195 Palo Alto, CA, USA) was used for statistical analysis.

3. Results and Discussion

3.1. Water Potential, Stomatal Conductance, and Canopy Temperature Readings

Table 2 and Table 3 show the average values for ΨStem, gs, and TC in each treatment and measuring day. The stem water potential was the most sensitive physiological variable for detecting moderate–severe water stress during the first cycle of water stress and recovery. Thus, differences in the static conductance were only evident for potential values below −1.7 MPa. Differences in the TC between treatments were only appreciable when a significant drop in the conductance values was detected, corresponding to very severe stress situations. The two stress treatments showed a good recovery capacity in terms of tissue rehydration after a 96 h recovery period, evidencing that the crop’s hydraulics were unaffected. The variation in the physiological data between the different measurement days was remarkable. The potential values on the first measurement days (203 DOY) were considerably more negative than those detected on the last, whereas the opposite was true for temperature. This shows that these variables responded to the hydration levels and existing climatic conditions (mainly the VPD, air temperature, and radiation) on the sampling days.
The pattern of the physiological variables during the second cycle of water stress and recovery was very similar to that observed in the previous one. Accordingly, the first differences in the gs were observed when the ΨStem reached values below −1.7 MPa. Additionally, these differences were accompanied by higher TC values because of the reduction in the evaporative cooling process. Tissue rehydration was observed after 96 h of rewatering.

3.2. Chlorophyll Fluorescence

No significant differences in the maximum quantum efficiency of PSII photochemistry (Fv/Fm), nor the quantum efficiency of PSII electron transport in the light (ϕPSII), at midday were observed during the first irrigation restriction cycle (Table 4). Thus, the Fv/Fm values were similar between the treatments during the cycle, at approximately 0.72. Similarly, regarding the ϕPSII, no significant reductions in the electron transport efficiency for PSII were observed. By contrast, significant differences in the nonphotochemical quenching (NPQ) between treatments were observed. These values were higher in the RDI and LFDI treatments compared with the FI treatment, with a sensible reduction after the recovery period.
Similar results were observed during the second water stress cycle. Thus, no significant differences in the chlorophyll fluorescence parameters were observed, obtaining similar values to those detected in the previous cycle (Table 5).
The chlorophyll fluorescence allows us to analyze the possible damage to the electron transport chain that prevents the use of light radiation for ATP and NADPH synthesis, whereby this excess radiation is dissipated as fluorescence. The biochemical limitations caused by drought stress are associated with moderate–severe stress, including changes or loss of efficiency in the electron transport chain. Regarding the results observed, we cannot affirm that a reduction in the electronic transport capacity, a decrease in the maximum photochemical efficiency, or a significant increase in the nonphotochemical quenching occurred in any of the deficit irrigation treatments. However, greater radiation dissipation was observed while under maximum stress in the RDI and LFDI treatments in both cycles. This situation was reversed after the rehydration process. This indicates the absence of cumulative damage throughout the stress period. Therefore, the crop was capable of managing these stress situations, at least for the water potential values measured. As discussed by [8], a reduction in stomatal conductance usually occurs just before or alongside a reduction in mesophyll conductance, an inhibition of CO2 metabolism, RuBisCO inactivation, and, hence, PSII downregulation and a decreased PSII quantum yield.

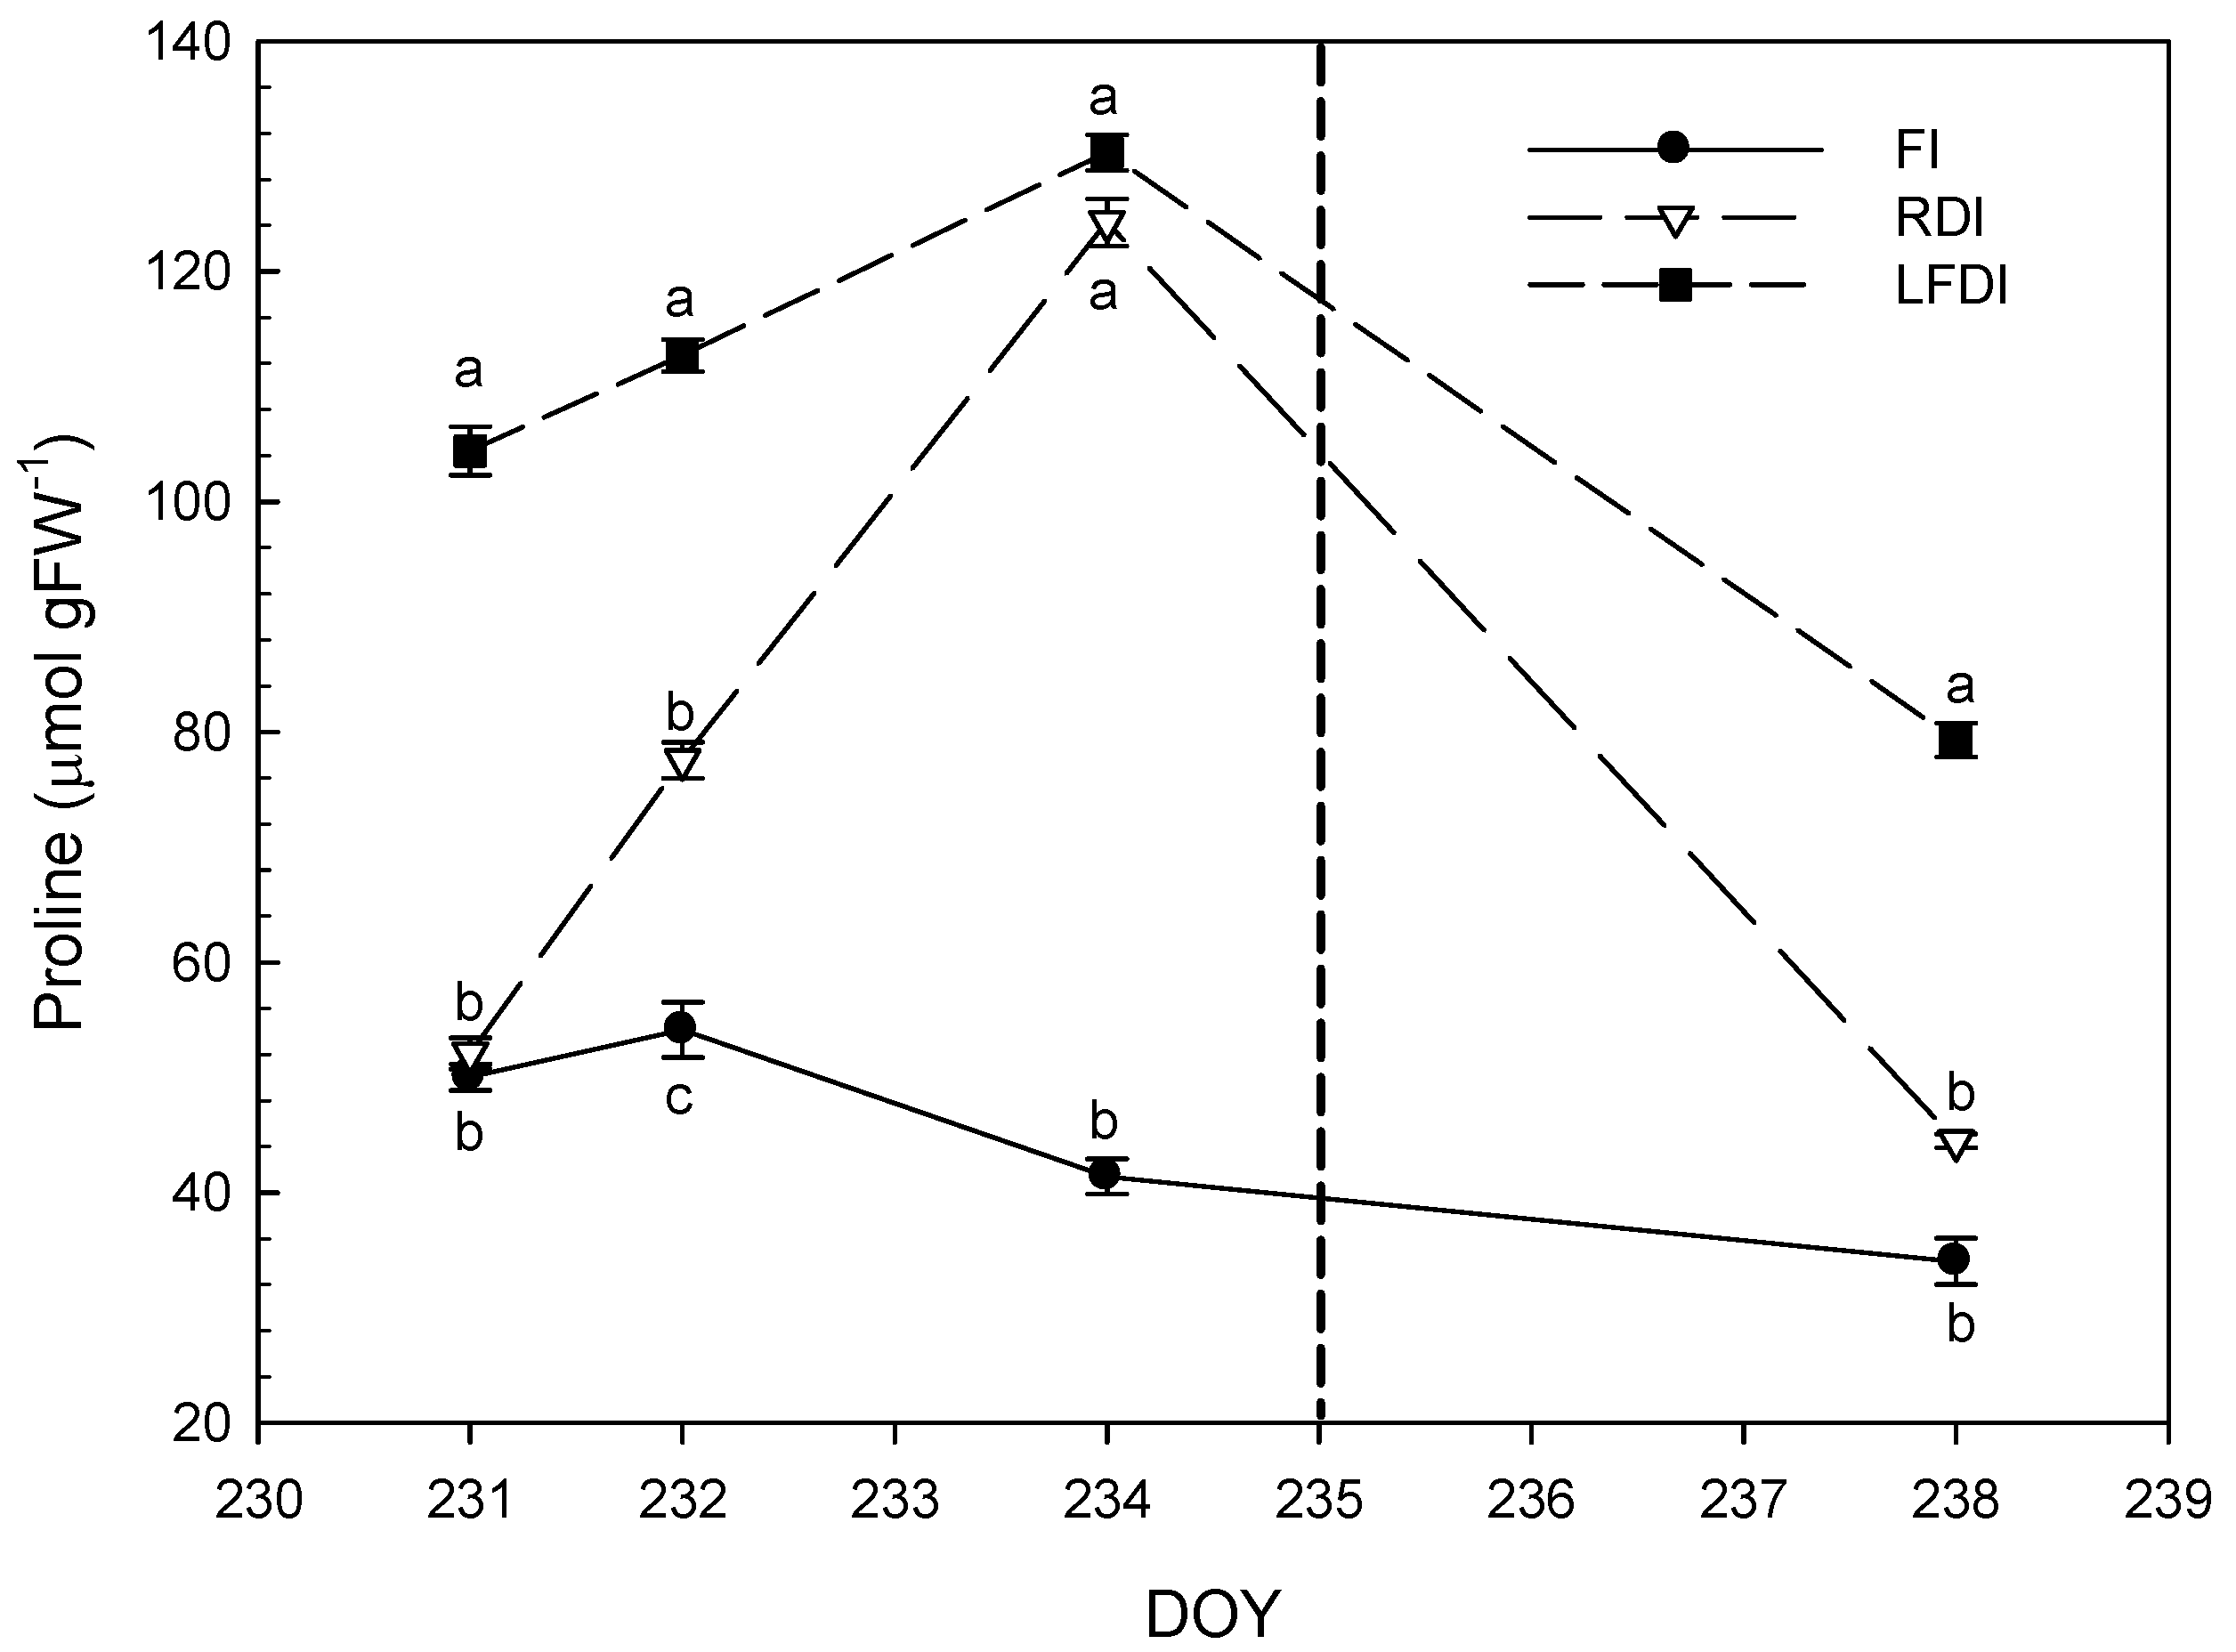
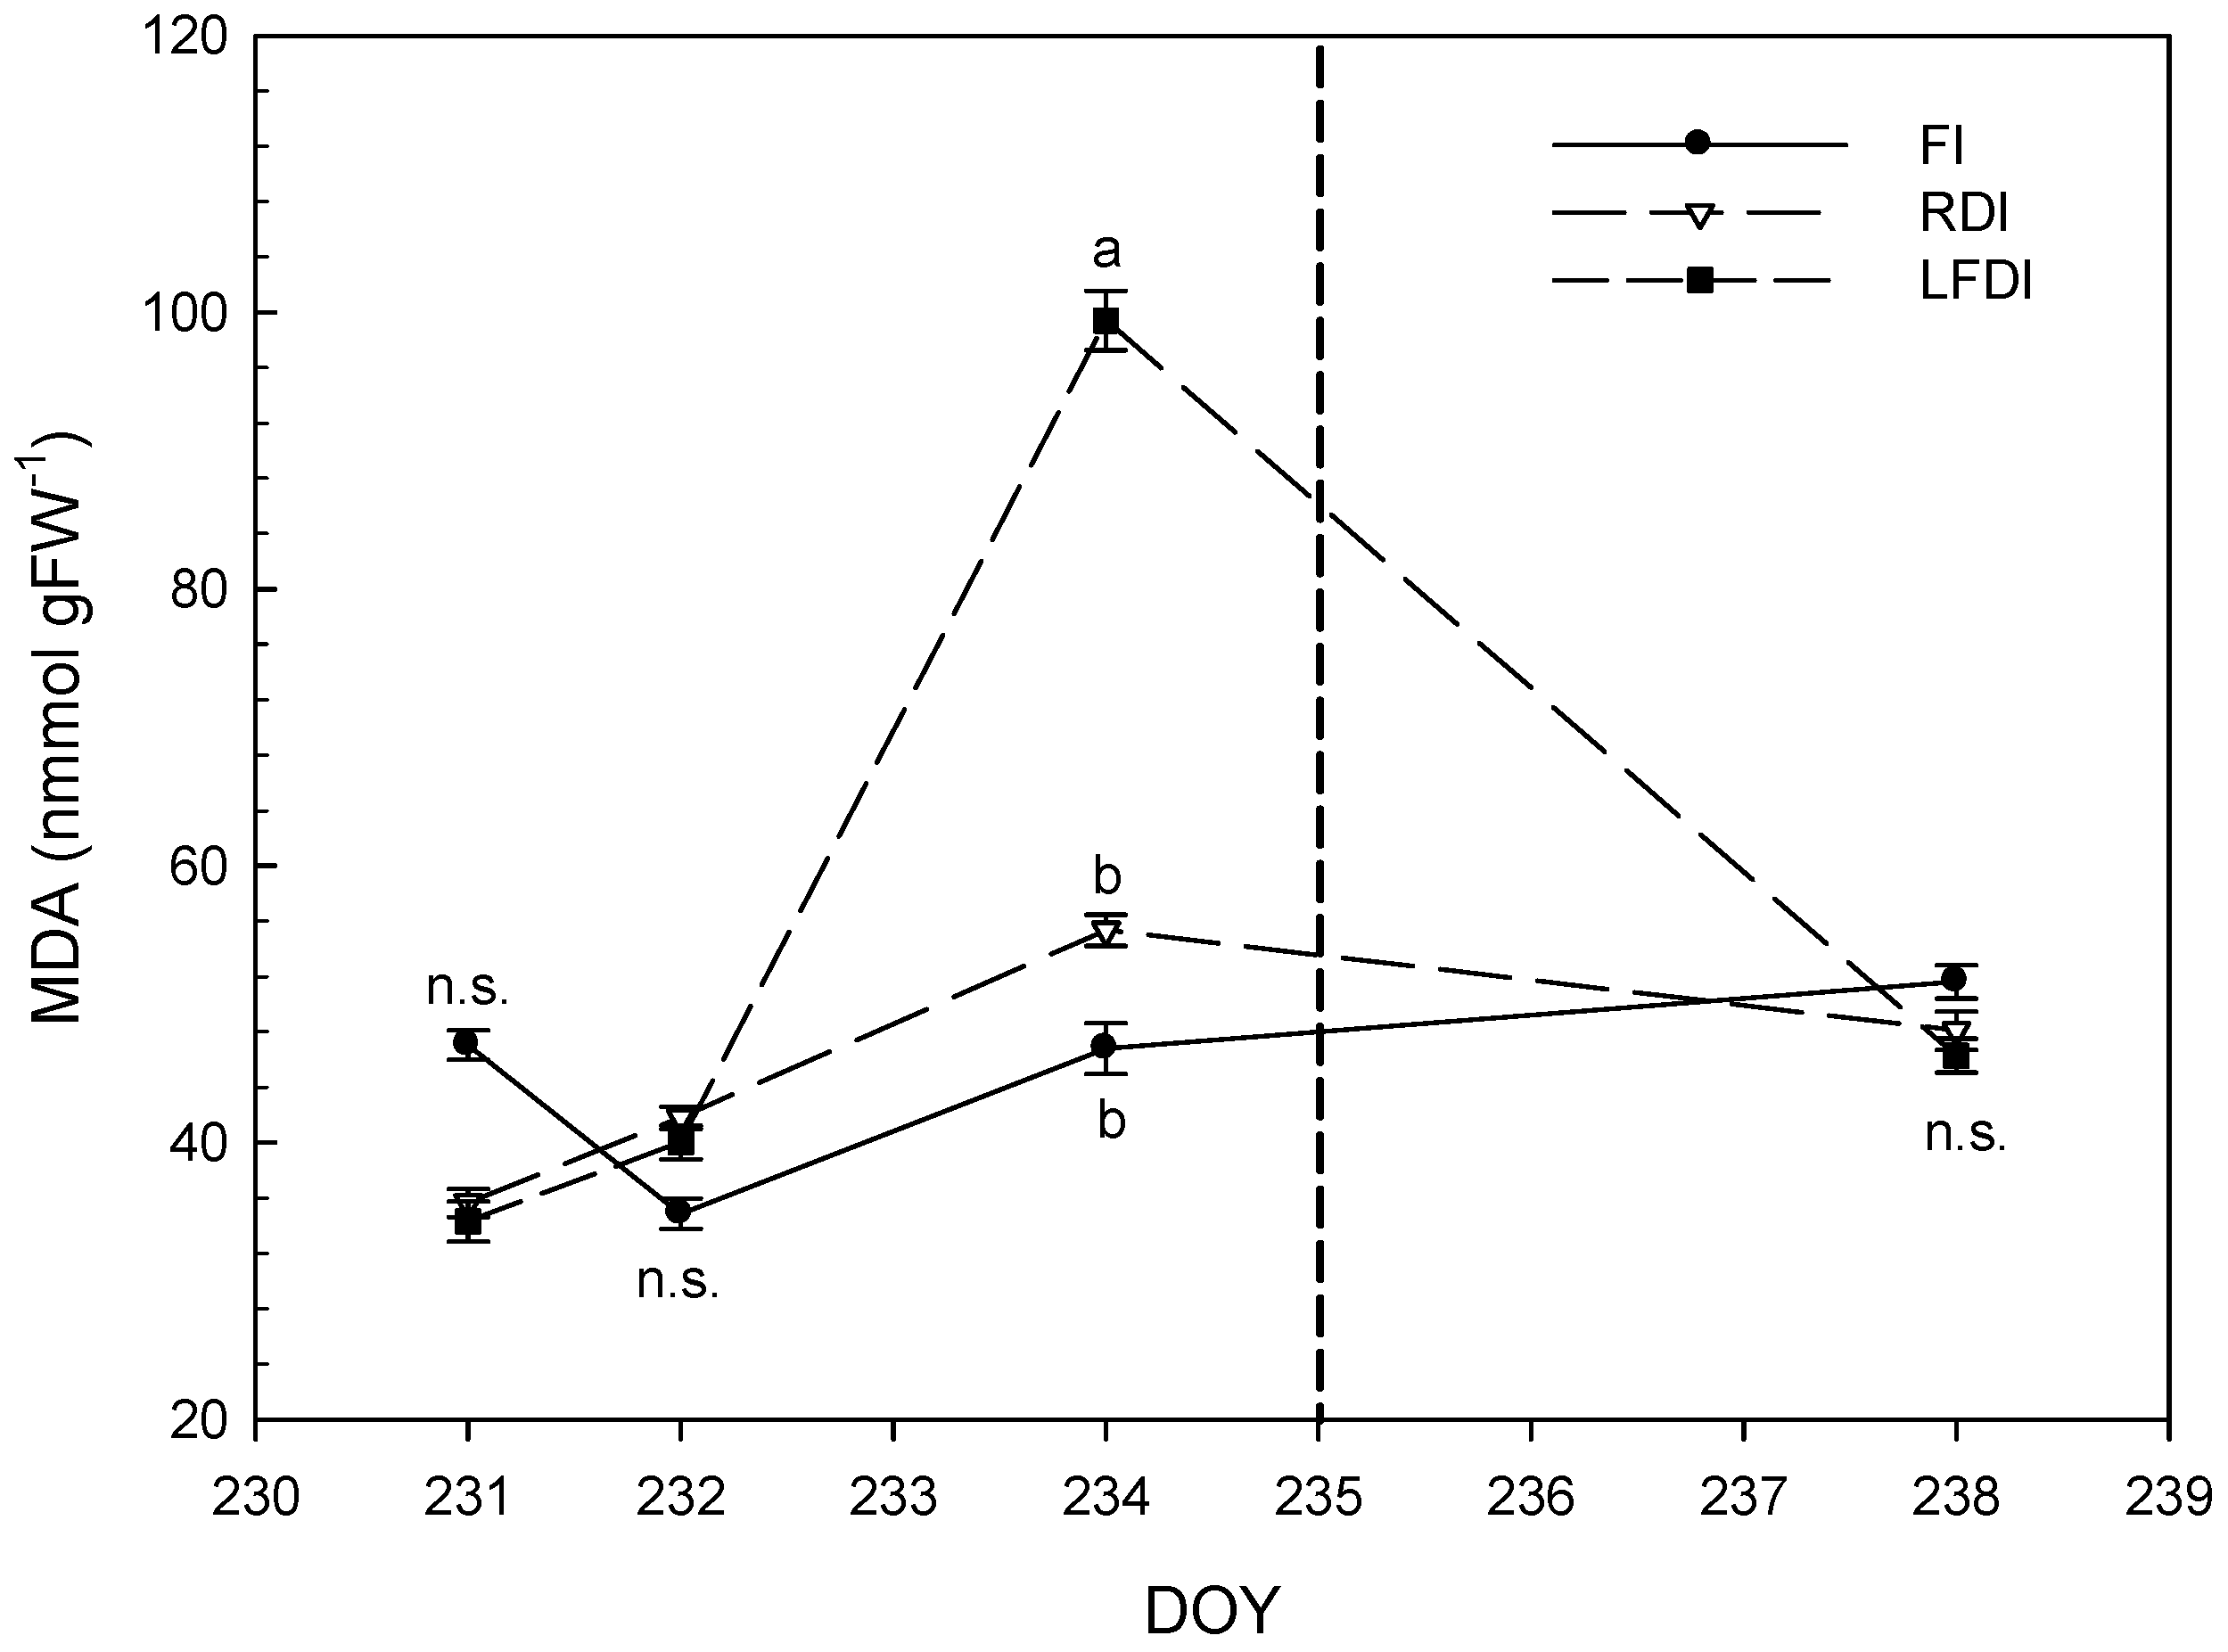
3.3. Proline and Malondialdehyde Contents

During the second stress–recovery cycle (from 231 to 234 DOY, RDI and LFDI plants were stressed, and from 235 to 238 DOY, plants were recovered), the leaf samples were analyzed for their proline and malondialdehyde contents to determine possible oxidative damage in response to severe drought stress (Figure 1 and Figure 2). The proline content in the control treatment remained fairly stable throughout the second cycle. On the contrary, the RDI treatment showed increasing levels throughout the stress cycle, with a total recovery of proline levels after the rehydration period, matching the values observed in the FI treatment (Figure 1). The proline content values observed during the second stress cycle in the LFDI treatment were notable (Figure 1). This treatment already showed significantly higher proline content values than those detected in the control and RDI treatments at the beginning of the stress cycle, further increasing during the restriction period. Moreover, the peak values at the end of the cycle and after rehydration did not substantially differ from those recorded at the beginning of the second stress cycle and were much higher than those detected in the other irrigation treatments. This behavior indicates the existence of differential mechanisms regarding osmotic adjustment between plants from LFDI treatments and those exposed to sustained deficit irrigation, and suggests that plants under the LFDI strategy might have a better capacity to adapt and respond to hypothetical future stress situations.
The malondialdehyde contents in the RDI and LFDI treatments were similar to those detected in the FI treatment (Figure 2). As the stress cycle progressed, these contents increased in the LFDI treatment but not in the RDI treatment, which maintained constant values similar to those recorded in the control treatment. Finally, the MDA contents in LFDI treatment after the rehydration period equaled those recorded in the control and RDI treatments.
This behavior aligns with the increased lipid peroxidation at the highest stress levels in the LFDI treatment, but with good recovery after the rehydration period.
Solute accumulation is among the main responses of citrus crops to moderate-to-severe water stress situations [33]. This response is typical of species with a good response to drought conditions [34], being an adequate water stress indicator in biochemical terms [35]. According to a recently published work by Balfagon et al. [24], proline contents significantly increase in citrus crops even after short periods of moderate stress, which allows citrus plants to maintain appropriate levels of gas exchange, allowing them to maintain photosynthesis rates similar to those recorded without water stress. This response regarding proline synthesis explains the crop’s capacity to recover water potential values after the recovery period and the few differences in stomatal conductance detected in the first moments of the restriction cycles. Good correlations between the leaf proline content and stem potential values in citrus crops were found in both sunny and shaded leaves. This is a good indicator of water stress levels in citrus trees [36].
The results obtained for the MDA contents suggest that oxidative damage was only incurred at the peak of stress, with full recovery after the rehydration period. These results follow the adequate response of sweet orange trees to LFDI treatments stated by [10].
Figure 3 shows a no exhaustive classification of the different responses of sweet young orange trees subjected to drought conditions. According to this, the first stomatal limitations were detected for ΨStem values below −1.4 MPa, identified as the point at which the CO2 intake was affected alongside a reduction in water losses through the stomata, as evidenced by an increase in the canopy temperature due to a decrease in the evaporative cooling process.
Moreover, the results show that an increase in proline levels was detected even before observing a gs reduction, related to the osmotic adjustment before the reduction in the gs values. These increases in Pro levels may have increased the chlorophyll fluorescence levels. This shows a coupling between the first diffusive limitations and the plant’s preparation for a future situation derived from biochemical limitations that became evident with the oxidative damage at potential values below −1.8 MPa, as shown in the MDA values observed during the second stress cycle. Thus, the results show that the first stress threshold was observed when the stem water potential at midday reached values of approximately −1.3 MPa. The synthesis and accumulation of osmolytes that helped to preserve the tissues’ hydration levels increased thereafter, avoiding a greater loss of water vapor through the stomata. However, the buffering effect observed with proline synthesis was insufficient, and the partial closure of the stomata began at midday stem potential values below −1.6 MPa. The increase in the proline content was accompanied by the dissipation of excess light radiation as fluorescence to avoid oxidative damage. The second threshold was established at potential values below approximately −1.6 MPa, corresponding to the appearance of diffusive limitations at the stomata and an increase in the leaf temperature. This boundary might be characterized by a decrease in the CO2 input to the parenchyma, alongside a potential decrease in the photosynthetic rate. The block in the Calvin cycle was accompanied by a build-up in ATP and NADPH levels, followed by a drop in the electron transport rate. At this point, energy dissipation in the form of fluorescence was insufficient to prevent the production of reactive oxygen species and the accumulation of oxidative damage in the plant. Thus, a third stress threshold started at stem water potential values below approximately −1.8 MPa, when oxidative damage became evident and osmolyte synthesis levels were maintained after recovery, indicating that exceeding these thresholds could damage the crop’s hydraulics. Thus, according to these water stress thresholds defined in this work, when a DI is applied, it is it is essential to be able to maintain a level of knowledge about the stress situations encountered by the crop. Thus, for moderate DI strategies, in no case should the threshold of −1.6 MPa be exceeded, as this is related to significant decreases in gas exchange rates and, therefore, to potential reductions in final production. Moreover, in more restrictive scarcity scenarios, it would be logical to avoid, in any case, reaching the potential levels of −1.8 MPa, which would entail significant damage to plant tissues, and the effects on production could even be carried over to future seasons.

4. Conclusions

The design of deficit irrigation strategies depends on the amount of water available and the exhaustive knowledge of the eco-physiological responses of a crop in different stress situations. It is impossible to elucidate the variations in the available water allocations or the climatic conditions throughout an irrigation campaign despite having an adequate deficit irrigation strategy design. Therefore, a good knowledge of the crop’s water stress thresholds and the eco-physiological consequences of exceeding these thresholds can help to avoid subsequent damage to the final production values. This work allowed us to study the changes that occur at the physiological level in depth, determining the thresholds that could come with losses in production and irreversible damage to the plant tissues. Sweet orange trees exhibit important mechanisms in response to stress situations. The crop maintained its maximum gas exchange capacity up to midday stem water potential values of approximately −1.3 MPa, avoiding damage due to dehydration via osmotic adjustment. Between −1.3 and −1.6 MPa, the crop reached an accompanying phase with the progressive appearance of diffusive limitations and the first signs of significant biochemical limitations, until reaching a threshold close to −1.8 MPa, where oxidative damage was guaranteed. The results of this work can help to define the threshold values of water stress tolerance when applying deficit irrigation strategies.

Author Contributions

Conceptualization, I.F.G.-T. and A.E.R.-C.; methodology, I.F.G.-T. and A.E.R.-C.; validation, I.F.G.-T., A.E.R.-C., and V.H.D.-Z.; formal analysis, I.F.G.-T. and A.E.R.-C.; investigation, I.F.G.-T. and A.E.R.-C.; resources, I.F.G.-T. and A.E.R.-C.; data curation, I.F.G.-T., A.E.R.-C., and V.H.D.-Z.; writing—original draft preparation, I.F.G.-T. and A.E.R.-C.; writing—review and editing, I.F.G.-T., A.E.R.-C., and V.H.D.-Z.; visualization, I.F.G.-T., A.E.R.-C., and V.H.D.-Z.; supervision, I.F.G.-T., A.E.R.-C., and V.H.D.-Z. All authors have read and agreed to the published version of the manuscript.

Funding

This research received no external funding.

Data Availability Statement

The data are contained within this article.

Conflicts of Interest

The authors declare no conflicts of interest.

References

  1. ESYRCE 2023. Encuesta Sobre Superficies y Rendimientos Cultivos (ESYRCE). Encuesta de Marco de Áreas de España. Available online: https://www.mapa.gob.es/es/estadistica/temas/estadisticas-agrarias/agricultura/esyrce/ (accessed on 1 March 2024).
  2. EEA 2019. Climate Change Adaptation in the Agriculture Sector in Europe. EEA Report 4/2019. p. 112. Available online: https://www.eea.europa.eu/publications/cc-adaptation-agriculture/ (accessed on 1 March 2024).
  3. Iglesias, A.; Garrote, L. Local and collective actions for adaptation to use less water for agriculture in the Mediterranean region. In Water Scarcity and Sustainable Agriculture in Semiarid Environment: Tools, Strategies and Challenges for Woody Crops; García-Tejero, I.F., Durán-Zuazo, V.H., Eds.; Academic Press: London, UK, 2018; pp. 73–86. [Google Scholar] [CrossRef]
  4. Ziogas, V.; Tanou, G.; Morinau, G.; Kourgialas, N. Drought and salinity in citriculture: Optimal practices to alleviate salinity and drought stress. Agronomy 2021, 11, 1283. [Google Scholar] [CrossRef]
  5. Syvertsen, J.P.; Lloyd, J. CO2 assimilation of citrus leaves: From mesophyll conductance to gross primary productivity of trees in different climates. International symposium on computer modelling in fruit research and orchard management. Acta Hortic. 1995, 416, 147–154. [Google Scholar]
  6. Syvertsen, J.P.; Lloyd, J.; Mcconchie, C.; Kriedemann, P.E.; Farquhar, G.D. On the relationship between leaf anatomy and CO2 diffusion through the mesophyll of hypostomatous leaves. Plant Cell. Environ. 1995, 18, 149–157. [Google Scholar] [CrossRef]
  7. Berger, J.; Palta, J.; Vadez, V. Review: An integrated framework for crop adaptation to dry environments: Responses to transient and terminal drought. Plant Sci. 2016, 253, 58–67. [Google Scholar] [CrossRef]
  8. Pérez-Pérez, J.G.; Robles, J.M.; García-Sánchez, F.; Botía, P. Comparison of deficit and saline irrigation strategies to confront water restriction in lemon trees grown in semi-arid regions. Agric. Water Manag. 2016, 164, 46–57. [Google Scholar] [CrossRef]
  9. Ningombam, L.; Hazarika, B.N.; Singh, S.; Yumkhaibam, T. Drought stress in Citrus and its related genera: A review. Environ. Ecol. 2022, 40, 2459–2466. [Google Scholar]
  10. Fahad, S.; Bajwa, A.A.; Nazir, U.; Anjum, S.A.; Ayesha, F. Crop production under drought and heat stress: Plant responses and management options. Front. Plants Sci. 2017, 8, 1147. [Google Scholar] [CrossRef] [PubMed]
  11. García-Tejero, I.; Durán-Zuazo, V.H.; Muriel-Fernández, J.L.; Jiménez-Bocanegra, J.A. Linking canopy temperature and trunk diameter fluctuations with other physiological water status tools for irrigation scheduling in citrus orchards. Funct. Plant Biol. 2011, 38, 106–117. [Google Scholar] [CrossRef] [PubMed]
  12. Zandalinas, S.I.; Rivero, R.M.; Martínez, V.; Gómez-Cadenas, A.; Arbona, V. Tolerance of citrus plants to the combination of high temperatures and drought is associated to the increase in transpiration modulated by a reduction in abscisic acid levels. BMC Plant Biol. 2016, 16, 105. [Google Scholar] [CrossRef]
  13. De Ollas, C.; Hernando, B.; Arbona, V.; Gómez-Cadenas, A. Jasmonic acid transient accumulation is needed for abscisic acid increase in citrus roots under drought stress conditions. Physiol. Plant. 2013, 147, 296–306. [Google Scholar] [CrossRef]
  14. Zandalinas, S.I.; Balfagón, D.; Arbona, V.; Gómez-Cadenas, A. Modulation of antioxidant defense system is associated with combined drought and heat stress tolerance in citrus. Front. Plant Sci. 2017, 8, 953. [Google Scholar] [CrossRef]
  15. Hayat, S.; Hayat, Q.; Alymeni, M.N.; Wani, A.S.; Pichtel, J.; Ahmad, A. Role of proline under changing environments: A review. Plant Signal. Behav. 2012, 7, 1456–1466. [Google Scholar] [CrossRef] [PubMed]
  16. Smirnoff, N. The role of active oxygen in the response of plants to water deficit and desiccation. New Phytol. 1993, 125, 24–58. [Google Scholar] [CrossRef] [PubMed]
  17. Noctor, G.; Mhamdi, A.; Foyer, C.H. The Roles of Reactive Oxygen Metabolism in Drought: Not So Cut and Dried. Plant Physiol. 2014, 164, 1636–1648. [Google Scholar] [CrossRef] [PubMed]
  18. Hernandez, S.; Deleu, C.; Larher, F. Proline accumulation by tomato leaf tissue in response to salinity. C. R. Acad. Sci. III 2000, 323, 551–557. [Google Scholar] [CrossRef]
  19. Wong, S.H.; Knight, J.A.; Hopfer, S.M.; Zaharia, O.; Leach, C.N., Jr.; Sunderman, W., Jr. Lipoperoxides in plasma as measured by liquid-chromatographic separation of malondialdehide-thiobarbituric acid adduct. Clin. Chem. 1987, 32, 214–220. [Google Scholar] [CrossRef]
  20. Arbona, V.; Hossain, Z.; López-Climent, M.F.; Pérez-Clemente, M.R.; Gómez-Cadenas, A. Antioxidant enzymatic activity is l inked to waterlogging stress tolerance in citrus. Physiol. Plant. 2008, 132, 452–466. [Google Scholar] [CrossRef] [PubMed]
  21. Hossain, Z.; López-Climent, M.F.; Arbona, V.; Pérez-Clemente, M.R.; Gómez-Cadenas, A. Modulation of the antioxidant system in citrus under waterlogging and subsequent drainage. J. Plant Physiol. 2009, 166, 1391–1404. [Google Scholar] [CrossRef] [PubMed]
  22. Gómez-Cadenas, A.; Tadeo, F.R.; Talón, M.; Primo-Millo, E. Leaf abscission induced by ethylene in water stressed intact seedlings of Cleopatra mandarin requires previous abscisic acid acumulation in roots. Plant Physiol. 1996, 112, 401–408. [Google Scholar] [CrossRef]
  23. Brakke, M.; Allen, L.H. Gas-exchange of citrus seedlings at different temperatures, vapor-pressure deficits and soil water contents. J. Am. Soc. Hort. Sci. 1995, 120, 497–504. [Google Scholar] [CrossRef]
  24. Balfagon, D.; Zandalinas, S.I.; Muriach, M.; Gomez, C.A. Involvent of ascorbate peroxidase and heat shock proteins on citrus tolerance to combine conditions of drought and high temperatures. Plant Physiol. Biochem. 2018, 127, 194–199. [Google Scholar]
  25. Carvalho, L.M.; Araújo, S.B.; Carvalho, H.W.L.; Girardi, E.A.; Soares Filho, W.S. Leaf proline accumulation and fruit yield of ‘Pera’ sweet orange trees under natural water stress. Bragantia 2021, 80, e1121. [Google Scholar] [CrossRef]
  26. Allen, R.G.; Pereira, L.; Raes, D.; Smith, M. Crop Evapotranspiration: Guidelines for Computing Crop Water Requirements; FAO Irrigation and Drainage Paper 56; FAO: Rome, Italy, 1998. [Google Scholar]
  27. Scholander, P.F.; Hammel, H.T.; Bradstreet, E.D.; Hemmingsen, E.A. Sap pressure in vascular plants. Science 1964, 148, 339–345. [Google Scholar] [CrossRef] [PubMed]
  28. Jones, H.G.; Stoll, M.; Santos, T.; Sousa, C.; Chaves, M.M.; Grant, O.M. Use of infrared thermography for monitoring stomatal closure in the field: Application to grapevine. J. Exp. Bot. 2002, 53, 2249–2260. [Google Scholar] [CrossRef] [PubMed]
  29. García-Tejero, I.; Durán-Zuazo, V.H.; Arriaga, J.; Hernández, A.; Vélez, L.M.; Muriel Fernádez, J.L. Approach to assess infrared thermal imaging of almond trees under water-stress conditions. Fruits 2012, 67, 463–474. [Google Scholar] [CrossRef]
  30. Schreiber, U.; Schliwa, U.; Bilger, W. Continuous recording of photochemical and nonphotochemical chlorophyll fluorescence quenching with a new type of modulation fluorometer. Photosynth. Res. 1986, 10, 51–62. [Google Scholar] [CrossRef] [PubMed]
  31. Bates, L.S.; Waldren, R.P.; Teare, I.D. Rapid determination of free proline for water-stress studies. Plant Soil 1973, 39, 205–207. [Google Scholar] [CrossRef]
  32. Velikova, V.; Yordanov, I.; Edreva, A. Oxidative stress and some antioxidant systems in acid rain-treated bean plants Protective role of exogenous polyamines. Plant Sci. 2000, 151, 59–66. [Google Scholar] [CrossRef]
  33. García-Sánchez, F.; Syvertsen, J.P.; Gimeno, V.; Botía, P.; Perez-Perez, J.G. Responses to flooding and drought stress by two citrus rootstock seedlings with different water use efficiency. Physiol. Plant. 2007, 130, 532–542. [Google Scholar] [CrossRef]
  34. Gonçalves, L.P.; Alves, T.F.O.; Martins, C.P.S.; Souza, A.O.; Santos, I.C.; Pirovani, C.P.; Almeida, A.A.F.; Coelho Filho, M.A.; Gesteira, A.S.; Soares Filho, W.S.; et al. Rootstock-induced physiological and biochemical mechanisms of drought tolerance in sweet orange. Acta Physiol. Plant. 2016, 38, 174. [Google Scholar] [CrossRef]
  35. Zaher-Ara, T.; Boroomand, N.; Sadat-Hosseini, M. Physiological and morphological response to drought stress in seedlings of ten citrus. Trees 2016, 30, 985–993. [Google Scholar] [CrossRef]
  36. Syvertsen, J.P.; Smith, M.L. Environmental-stress and seasonal-changes in proline concentration of citrus tree tissues and juice. J. Am. Soc. Hortic. Sci. 1983, 108, 861–866. [Google Scholar] [CrossRef]
Figure 1. Evolution of proline content (µmol gFW−1) during the second stress–recovery cycle (from 231 to 234 DOY, RDI and LFDI plants were stressed, and from 235 to 238 DOY, these plants were recovered). The vertical dashed line represents the day rewatering was applied in both deficit irrigation treatments. Different letters represent significant differences between treatments (p < 0.05 in Tukey’s test) within the same sampling date. Data are represented as means (means ± error bars; n = 4).
Agronomy 14 01149 g001
Figure 2. Evolution of MDA content (µmol gFW−1) during the second stress–recovery cycle (from 231 to 234 DOY, RDI and LFDI plants were stressed, and from 235 to 238 DOY, these plants were recovered). The vertical dashed line represents the day rewatering was applied in both deficit irrigation treatments. Different letters represent significant differences between treatments (p < 0.05 in Tukey’s test) within the same sampling date. Data are represented as means (means ± error bars; n = 4). n.s. no significant differences.
Agronomy 14 01149 g002
Figure 3. No exhaustive classification based on the different physiological responses observed during the restriction–recovery cycles imposed in the irrigation treatments. Blue, yellow, and orange colors represent optimum conditions, low, moderate, and severe water stress, respectively.
Agronomy 14 01149 g003
Table 1. Physiological variables monitored in each measurement cycle.
DOYDateDWWΨStemgsTCChFProMDA
Cycle I
20322/70
20524/72
20625/73
21029/70
Cycle II
23119/80
23220/81
23321/82
23422/83
23826/80
DOY, day of the year; DWW, day of water withholding; ΨStem, stem water potential; gs, stomatal conductance to water vapor; TC, canopy temperature; ChF, chlorophyll fluorescence; Pro, proline; MDA, malondialdehyde. 0 corresponds to the days on which total recovery was reached in the LFDI treatment; 1, 2, and 3 correspond to 24, 48, and 72 h after water suppression in the LFDI treatment, the third being the day on which the maximum water stress was reached. • Each point indicates the physiological measurements performed on each monitoring day.
Table 2. Average values of stem water potential (ΨStem), stomatal conductance (gs), and canopy temperature (TC) at midday during the first measurement cycle.
DOYTreatmentΨStem (MPa)gs (mmol m−2 s−1)TC (°C)
FI−1.28 a71.8 a39.8 a
203RDI−1.27 a71.6 a40.5 a
LFDI−1.19 a50.4 a40.1 a
FI−1.05 a68.4 a38.6 a
204RDI−1.35 b58.8 a38.6 a
LFDI−1.28 ab76.2 a38.4 a
FI−1.14 a74.9 a34.5 a
205RDI−1.23 a70.6 a34.5 a
LFDI−1.68 b43.1 b35.5 b
FI−1.15 a82.5 a31.6 a
206RDI−1.33 b74.0 a33.1 b
LFDI−2.19 c35.1 b33.9 c
FI−0.83 a70.9 a25.2 a
210RDI−0.84 a70.6 a24.7 a
LFDI−0.89 a66.8 a24.8 a
DOY, day of the year; FI, full irrigation treatment; RDI, regulated deficit irrigation treatment; LFDI, low-frequency deficit irrigation treatment. Different letters show significant differences between treatments within the same sampling date (p < 0.05 in Tukey’s test).
Table 3. Average values of stem water potential (ΨStem), stomatal conductance (gs), and canopy temperature (TC) at midday during the second measurement cycle.
DOYTreatmentΨStem (MPa)gs (mmol m−2 s−1)TC (°C)
FI−1.28 a89.4 a33.9 a
231RDI−1.43 a77.5 a33.4 a
LFDI−1.34 a84.9 a32.9 a
FI−1.16 a65.6 a35.3 a
232RDI−1.30 ab62.8 a34.3 a
LFDI−1.51 b62.9 a34.8 a
FI−1.25 a64.4 a38.5 a
233RDI−1.23 a59.1 a38.8 a
LFDI−1.58 b60.1 a39.2 a
FI−1.15 a78.2 a37.00 a
234RDI−1.41 b70.4 a37.5 a
LFDI−1.76 c47.2 b39.2 b
FI−1.33 a76.99 a38.2 a
238RDI−1.51 b51.80 a38.9 a
LFDI−1.34 a58.20 a38.0 a
DOY, day of the year; FI, full irrigation treatment; RDI, regulated deficit irrigation treatment; LFDI, low-frequency deficit irrigation treatment. Different letters show significant differences between treatments within the same sampling date (p < 0.05 in Tukey’s test).
Table 4. Average values of maximum quantum efficiency of PSII photochemistry (Fv/Fm), quantum efficiency of PSII electron transport in the light (ϕPSII), and nonphotochemical quenching (NPQ) at midday during the first cycle of water stress and recovery.
DOYTreatmentFv/FmϕPSIINPQ
FI0.715 a0.150 a1.864 a
203RDI0.726 a0.186 a 2.353 a
LFDI0.729 a 0.186 a 2.241 a
FI0.742 a 0.165 a 1.226 a
204RDI0.734 a 0.204 a 2.019 b
LFDI0.717 a 0.134 a 2.044 b
FI0.710 a 0.143 a 1.705 a
206RDI0.716 a 0.188 a 2.259 b
LFDI0.726 a 0.199 a 2.383 b
FI0.731 a 0.188 a 1.778 a
210RDI0.726 a 0.216 a 1.837 a
LFDI0.762 a 0.182 a 1.604 a
DOY, day of the year; FI, full irrigation treatment; RDI, regulated deficit irrigation treatment; LFDI, low-frequency deficit irrigation treatment. Different letters show significant differences between treatments within the same sampling date (p < 0.05 in Tukey’s test).
Table 5. Average values of maximum quantum efficiency of PSII photochemistry (Fv/Fm), quantum efficiency of PSII electron transport in the light (ϕPSII), and nonphotochemical quenching (NPQ) at midday during the second cycle of water stress and recovery.
DOYTreatmentFv/FmϕPSIINPQ
FI0.755 a 0.172 a 1.699 a
231RDI0.739 a 0.163 a 1.767 a
LFDI0.767 a 0.191 a 1.907 a
FI0.737 a 0.195 a 2.109 a
232RDI0.757 a 0.188 a 2.031 a
LFDI0.750 a 0.157 a 2.552 a
FI0.666 a 0.272 a 2.006 a
234RDI0.712 a 0.238 a 2.352 a
LFDI0.666 a 0.252 a 2.579 a
FI0.699 a 0.290 a 0.887 a
238RDI0.683 a 0.302 a 0.930 a
LFDI0.638 a 0.229 a 0.725 a
DOY, day of the year; FI, full irrigation treatment; RDI, regulated deficit irrigation treatment; LFDI, low-frequency deficit irrigation treatment. Different letters represent significant differences between treatments within the same sampling date (p < 0.05 in Tukey’s test).
Disclaimer/Publisher’s Note: The statements, opinions and data contained in all publications are solely those of the individual author(s) and contributor(s) and not of MDPI and/or the editor(s). MDPI and/or the editor(s) disclaim responsibility for any injury to people or property resulting from any ideas, methods, instructions or products referred to in the content.

