Article

Monitoring Land Management Practices Using Vis–NIR Spectroscopy Provides Insights into Predicting Soil Organic Carbon and Limestone Levels in Agricultural Plots

by
Juan E. Herranz-Luque
1,*,
Javier Gonzalez-Canales
2,3,
Juan P. Martín-Sanz
2,
Omar Antón
2,
Ana Moreno-Delafuente
2,
Mariela J. Navas-Vázquez
4,
Rubén Ramos-Nieto
2,
Ramón Bienes
2,
Andrés García-Díaz
2,
Maria Jose Marques
1 and
Blanca Sastre
2
1
Geology and Geochemistry Department, Universidad Autónoma de Madrid (UAM), Calle Francisco Tomás y Valiente, 7, 28049 Madrid, Spain
2
Madrid Institute for Research and Rural Development in Food and Agriculture (IMIDRA), Finca El Encín, Carretera A-2, km 38.2, 28805 Alcalá de Henares, Spain
3
Doctorate School, University of Alcalá (UAH), 28801 Alcalá de Henares, Spain
4
Chemical Farmaceutic Department, Farmacy Faculty, Universidad Complutense de Madrid (UCM), Pza. Ramón y Cajal S/N, 28040 Madrid, Spain
*
Author to whom correspondence should be addressed.
Agronomy 2024, 14(6), 1150; https://doi.org/10.3390/agronomy14061150
Submission received: 26 April 2024 / Revised: 20 May 2024 / Accepted: 26 May 2024 / Published: 28 May 2024

Abstract

:
This study aimed to establish sound relationships between soil properties of agricultural land in central Spain and their spectral attributes to contribute to deriving an indicator for sustainable farm management. Sixteen plots, managed under various conditions, eight with traditional tillage and eight with other alternative managements, were selected to gather soil samples representing three predominant soil orders (Leptosols, Cambisols, and Luvisols). Soil sampling was conducted from depths ranging from 0 to 30 cm (0–50; 5–10, 10–20, and 20–30 cm), ensuring a broad spectrum of sample variability across different times and locations. The reflectance of soil 64 soil samples was measured within the range of 400 to 900 nm, and the corresponding concentrations of soil organic carbon and majoritarian minerals, calcium carbonate, quartz, phyllosilicates, K-Feldspar, and plagioclase were determined for each sample. Partial least squares analysis was employed to construct prediction models using a calibration dataset comprising 66% of randomly selected samples. The remaining 33% of samples were utilized for model validation. The prediction models for the measured soil chemical properties yielded R2 values ranging from 0.14 to 0.79. Only SOC and limestone provided accurate prediction models. These findings hold promise for developing a soil health indicator tailored for site-specific crop management. However, the complex composition of soil organic carbon and calcium carbonate in certain soils underscores the importance of careful interpretation and validation of remote sensing data, as well as the need for advanced modeling approaches that can account for the interactions between multiple soil constituents.

1. Introduction

Agricultural soils often exhibit signs of degradation characterized by weak structure, low organic carbon content, and nutrient scarcity. In Mediterranean semi-arid environments, these conditions are exacerbated by erosion processes and dryness, especially during spring and summer. The frequent tillage practiced in land management has been identified as a contributing factor to soil degradation, ultimately hindering optimal crop production. Recognizing the urgent need for soil protection [1], avoiding intensive tillage, and implementing soil conservation measures such as cover cropping have emerged as crucial strategies [2,3]. By preventing soil erosion and maintaining soil fertility, these measures not only enhance crop yields but also bolster the resilience of agricultural systems against climate variability and extreme weather events common in Mediterranean semi-arid environments. Moreover, they help preserve other ecosystem services provided by healthy soils, as emphasized by the Food and Agriculture Organization (FAO). These circumstances are especially concerning when considering woody crops like olive groves.
If more sustainable land management practices enhance soil conditions, an efficient and cost-effective monitoring of land conditions is the next imperative step in response to changes in land management practices. Classical methods for monitoring land status across extensive areas may be impractical due to economic and timing constraints. In recent decades, numerous authors have explored various methods for assessing land degradation, including soil erosion modeling and remote sensing techniques, particularly in Mediterranean semi-arid environments. Such research endeavors aim to identify indicators that can effectively track the impacts of soil degradation or soil recovery on agricultural land. Near-infrared reflectance spectroscopy (Vis–NIR) has been seen as a cost-effective and accurate tool for soil quality assessment [4]. The accurate, widespread adoption of spectroscopy for soil monitoring can be achieved through the establishment of standard protocols for collecting laboratory soil spectra to facilitate the sharing of spectral libraries and sharing scanning existing soil archives, which would minimize the necessity for expensive sampling campaigns. Particularly, by analyzing the Vis–NIR spectra and correlating them with soil properties such as mineral composition and organic carbon content, researchers can develop predictive models and spectral indices to estimate soil attributes non-destructively and rapidly. This approach is widely used in soil science, remote sensing, and precision agriculture for monitoring soil health, assessing land degradation, and optimizing agricultural management practices [5,6,7].
Correlations between the depth of spectral features and soil organic carbon or carbonate concentration have been established [8]. High soil organic carbon (SOC) levels lead to a decrease in albedo throughout the visible, shortwave infrared, and near-infrared (Vis–NIR–SWIR) reflectance spectrum [9,10]. Nonetheless, it has been observed that a threshold of 2% organic carbon exists, below which the impact of SOC on soil reflectance diminishes significantly [11].
The identification of soil carbonate poses challenges due to its absorption feature, which shifts to longer or shorter wavelengths depending on the presence of impurities [12]. Moreover, the depths of these spectral features are also influenced by particle size and porosity [13].
Correlations have been found between soil carbonate concentration and reflectance spectra, discerned through alterations in color and albedo [8,14].
In this research, we investigated the characteristics of agricultural areas in semi-arid environments by comparing the soil conditions under different land management practices, which have an effect on the spectral signature of soils. Specifically, we focused on traditional soil-intensive tillage methods, and we compared them to similar soils used for cropping but managed in an alternative way. We examined how various soil characteristics, including soil organic carbon content, bulk density, and mineral composition, affect the visible and infrared response observed in the Vis-NIR spectra. By doing so, we aim to increase knowledge and enrich existing databases for monitoring and tracking alterations in soil compositions over both temporal and spatial scales to enhance the precision of soil data for local and regional inventories and also encompass an examination of the divergent impacts of soil organic carbon and calcium carbonate on soil spectra. This investigation aims to elucidate the nuanced interactions between these variables and their influence on spectral signatures.

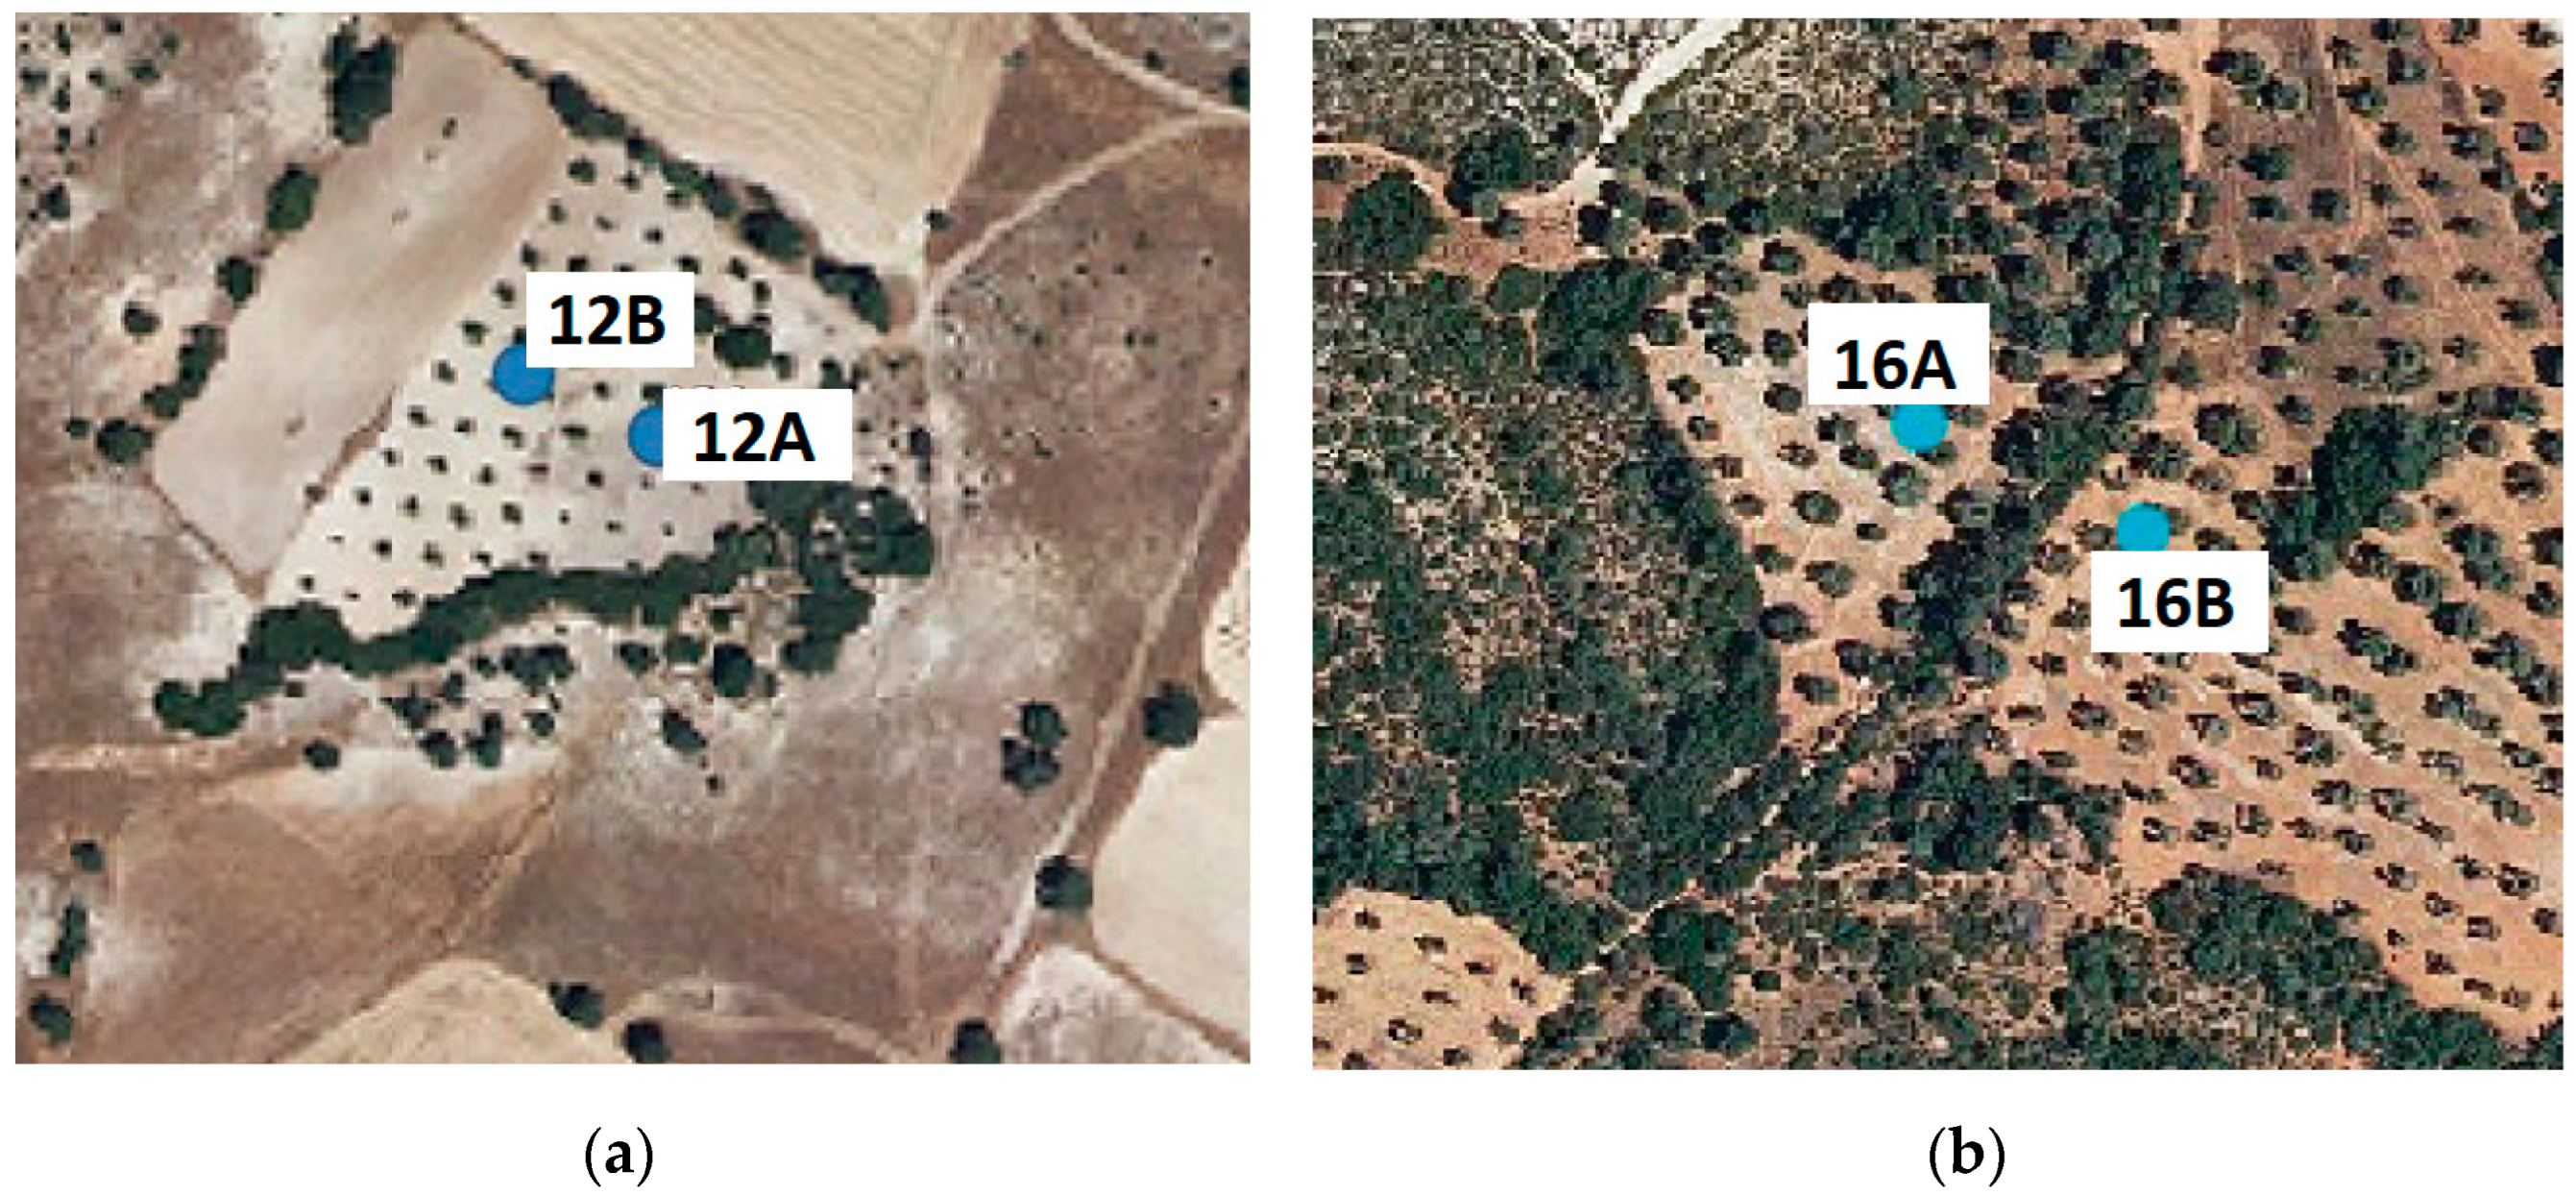
2. Materials and Methods

The study area is located in central Spain (municipalities: Chinchón, Valdelaguna, Perales de Tajuña, Belmonte del Tajo, Arganda del Rey, Torres de la Alameda, and Villarejo de Salvanés). The area has a semi-arid Mediterranean climate, with average annual temperatures of 14.5 °C, 473 mm annual accumulated precipitation, and 1112 mm potential evapotranspiration. The altitude of sampling points was between 550 m and 560 masl. The aforementioned municipalities are dedicated to agricultural use, which is also one of the most important land uses in the country. Of Spain’s total area of 50.59 million hectares, agriculture constitutes a significant portion. Of this, 32% is agricultural land, and 5.5%, or 2.77 million hectares, is dedicated specifically to olive orchards, which is the focus of this paper. The remaining areas are classified as forest or shrublands, grazing lands, urban or industrial areas, and inland waters, totaling 33.77 million hectares.
According to the FAO soil classification map for the study region, which pertains to the Community of Madrid [15], Cambisols occupy approximately 34% of the area, Luvisols around 21%, and Leptosols about 19%.
Sixteen crop fields, eight pairs of fields, were selected to study and compare two different soil management types in each field (Table 1). On the one hand, eight of them have management A, or alternative to tillage management, involving typically no-till or vegetative cover. These plots had soil covered by spontaneous vegetation that comprised a diverse array of plant species. This includes grasses such as Avena spp., Lolium spp., and Poa spp., as well as leguminous plants like Trifolium spp. Additionally, it encompasses annual broadleaf weeds such as Papaver rhoeas, Sinapis arvensis, Amaranthus spp., and Diplotaxis spp., along with perennial weeds like Carduus nutans. Other common species found in spontaneous vegetation are Bromus spp. and Chenopodium spp.
On the other hand, the rest eight plots with management B, or conventional tillage, were used as a reference for business-as-usual management (Figure 1). Traditional tillage consists of labor passes usually three to four times a year to a depth of 15–20 cm. Samples were gathered from a single geographical area to evaluate the prediction of soil properties across a naturally diverse range, aiming to offer predictions relevant to regional image analysis.
For each sampling point, four composite-samples of soil were obtained randomly to collect 1 kg at four established depths: 0 to 5 cm, 5 to 10 cm, 10 to 20 cm, and, finally, 20 to 30 cm. This resulted in a total of 64 soil samples (8 × 8 × 4). These samples were air-dried and sieved (2 mm mesh) to remove coarser fractions.
Texture was determined through particle size analyses utilizing the hydrometer method [16].
The soil organic matter (SOM) content was measured using the Walkley–Black method, in which the soil undergoes an oxidation reaction with a standardized potassium dichromate solution. For these measurements, soil samples were previously milled [17]. The bulk density (g/cm3) was determined at each sampling point using the cylinder method [18]. Differences in SOM were measured in different soils and depths.
The mineral composition of samples was estimated by XR diffraction using SIEMENS D-5000 equipment with a scanning speed of 1° 2θ/min and Cu-Kα radiation (40 kV, 20 mA). XR analysis was carried out on randomly oriented samples (bulk samples). Powdered whole-rock samples were scanned from 5° to 31° 2θ. The mineral intensity factors (MIFs) method was applied to XRD peak intensity ratios normalized to 100% with calibration constants for the quantitative estimation of mineral contents [19,20,21].
The air-dried soil sieved samples’ reflectance was determined using an Analytical Spectral Device ASD FieldSpecPro Vis-NIR spectroradiometer in the laboratory, measuring wavelengths from 350 nm to 1100 nm with a spectral resolution of 3 nm. Following the recommendations of the Global Soil Laboratory Network Initiative on Soil spectroscopy (GLOSOLAN-Spec) of the Global Soil Partnership [22], the samples used for this process were sieved and air-dried but not crushed, as the sample reflectance is influenced by their size and would increase the reflectance by brightening the samples, making them appear lighter than in their initial conditions. Spectroradiometry allows for the recording of spectral signatures of various surfaces with high spectral resolution [23]. The scanning of the samples was conducted in a dark room, connecting it via fiber optics to an ASD contact probe along with a halogen bulb at a temperature of 2900 K. The setup was positioned vertically on a tripod, with the probe placed 5 cm above the sample, aiming to minimize lighting differences. Black plastic plates with a diameter of 5 cm were filled with soil samples with 1 cm thickness of soil. An average of 10 internal scans were performed to reduce random noise in the entire spectrum and obtain accurate results; noise was present at extremes of the wavelength range; noisy segments of spectra were eliminated prior to analysis, resulting in a final range from 400 nm to 900 nm. A spectrum on the standard panel was used to obtain the white reference. The spectrometer was calibrated every 10 min.
Statistical analyses were performed to find significant differences between different agricultural soil management practices regarding soil organic carbon (SOC) concentration, estimated as 58% of SOM [24], bulk density and mineral composition in the different soil layers, were performed using the IBM® SPSS® Statistics 26 software. A factorial analysis of variance (ANOVA) with repeated measures was conducted to identify significant differences between variables. To understand the interaction between depth and management while considering the locations, the locations were grouped according to their soil type to increase the robustness of the ANOVA. The normal distribution of variables was assessed using the Shapiro–Wilk test [25] (see Supplemental Data).
Quantitative analysis of reflectance spectra was conducted using Partial Least Squares Regression (PLSR) with ParLeS version 3.1 software [26]. This procedure addressed collinearity issues arising from numerous highly correlated variables and a limited number of samples. The matrix of 66 samples was randomly split into two sets; the first one consisted of 2/3 of the samples to perform model calibration, and the second group, which consisted of the remaining 1/3 of the samples, was used to validate the model. Data conforming to the soil diffuse reflectance spectra were transformed previously as preprocessing to produce more robust models being standardized to sum 1, and they were also mean-centered prior to the multivariate modeling.
Subsequently, cross-validation, which is intended to assess whether a statistical model can be generalized to an independent dataset, was performed to determine the optimal factors for the regression model [27]. The validation accuracy was assessed using the root mean square error (RMSE; Equation (1)).
R M S E = i = 1 N y i ^ y i 2 N ,
where, y i ^ is the predicted value, and yi is the observed value.
To estimate the predictive capability of the model, the value of R2 should fall within the range (0 < R2 < 1), with 1 indicating a perfect prediction or goodness of fit [28]. The residual predictive deviation (RPD) represents the ratio between the standard deviation of the Y data, denoted as SD, and the RMSE of cross-validated predictions. RPD is used to determine the quality of predictions: the consensus holds that values below 1.5 signify a deficient predictive model when applied to soil property prediction, while values between 1.5 and 2.0 are deemed acceptable, and those exceeding 2.0 are considered satisfactory [29,30].

3. Results

Soils under study exhibit alkaline characteristics, with a high content of calcium carbonate, which exceeds 20% (Table 2). The pH for all the sets of locations ranged from 7.3 to 8.4; low electrical conductivity was found, ranging from 0.3 to 1 dS/m. From a classification standpoint according to the WRB [31], they are Calcic Leptosols (O-11, O-16, and O-24), Calcic Luvisols (O-18, O-19, and O-22), Luvic Calcisols (O-12), and Cambisols (O-3). The mineralogical composition explained in Table 2 aims to characterize the soil from 0 to 30 cm depth as a whole.

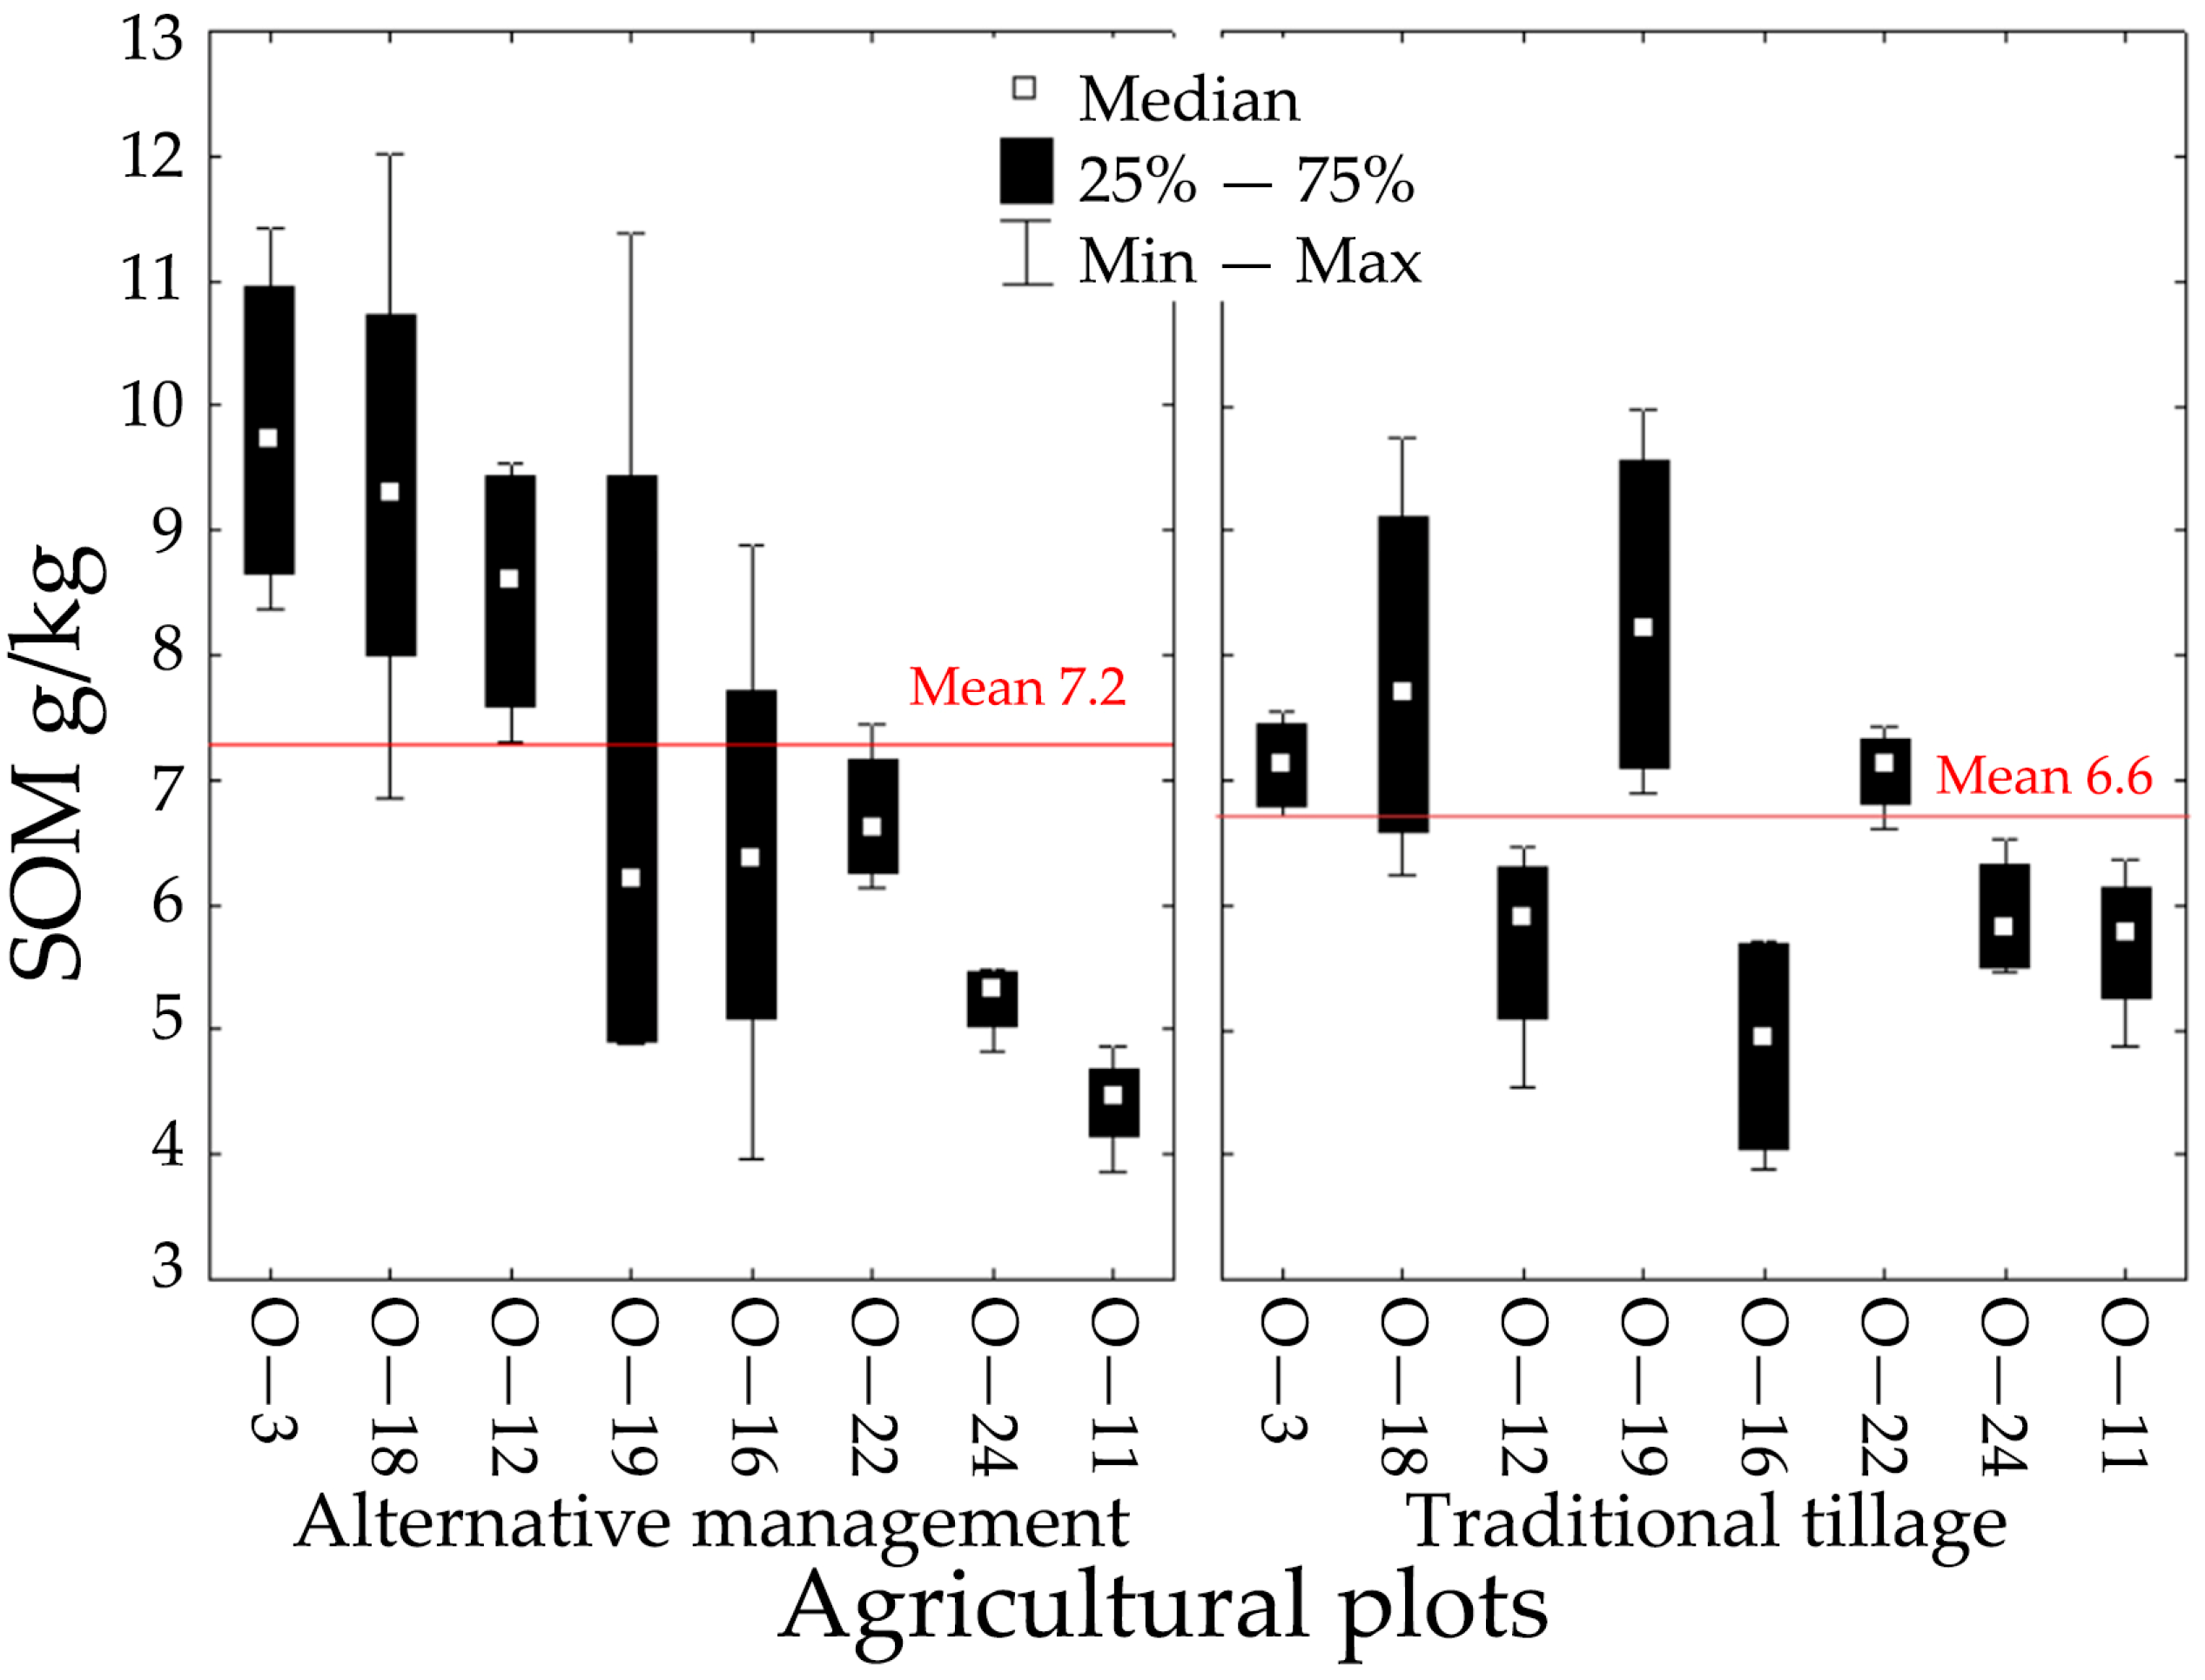
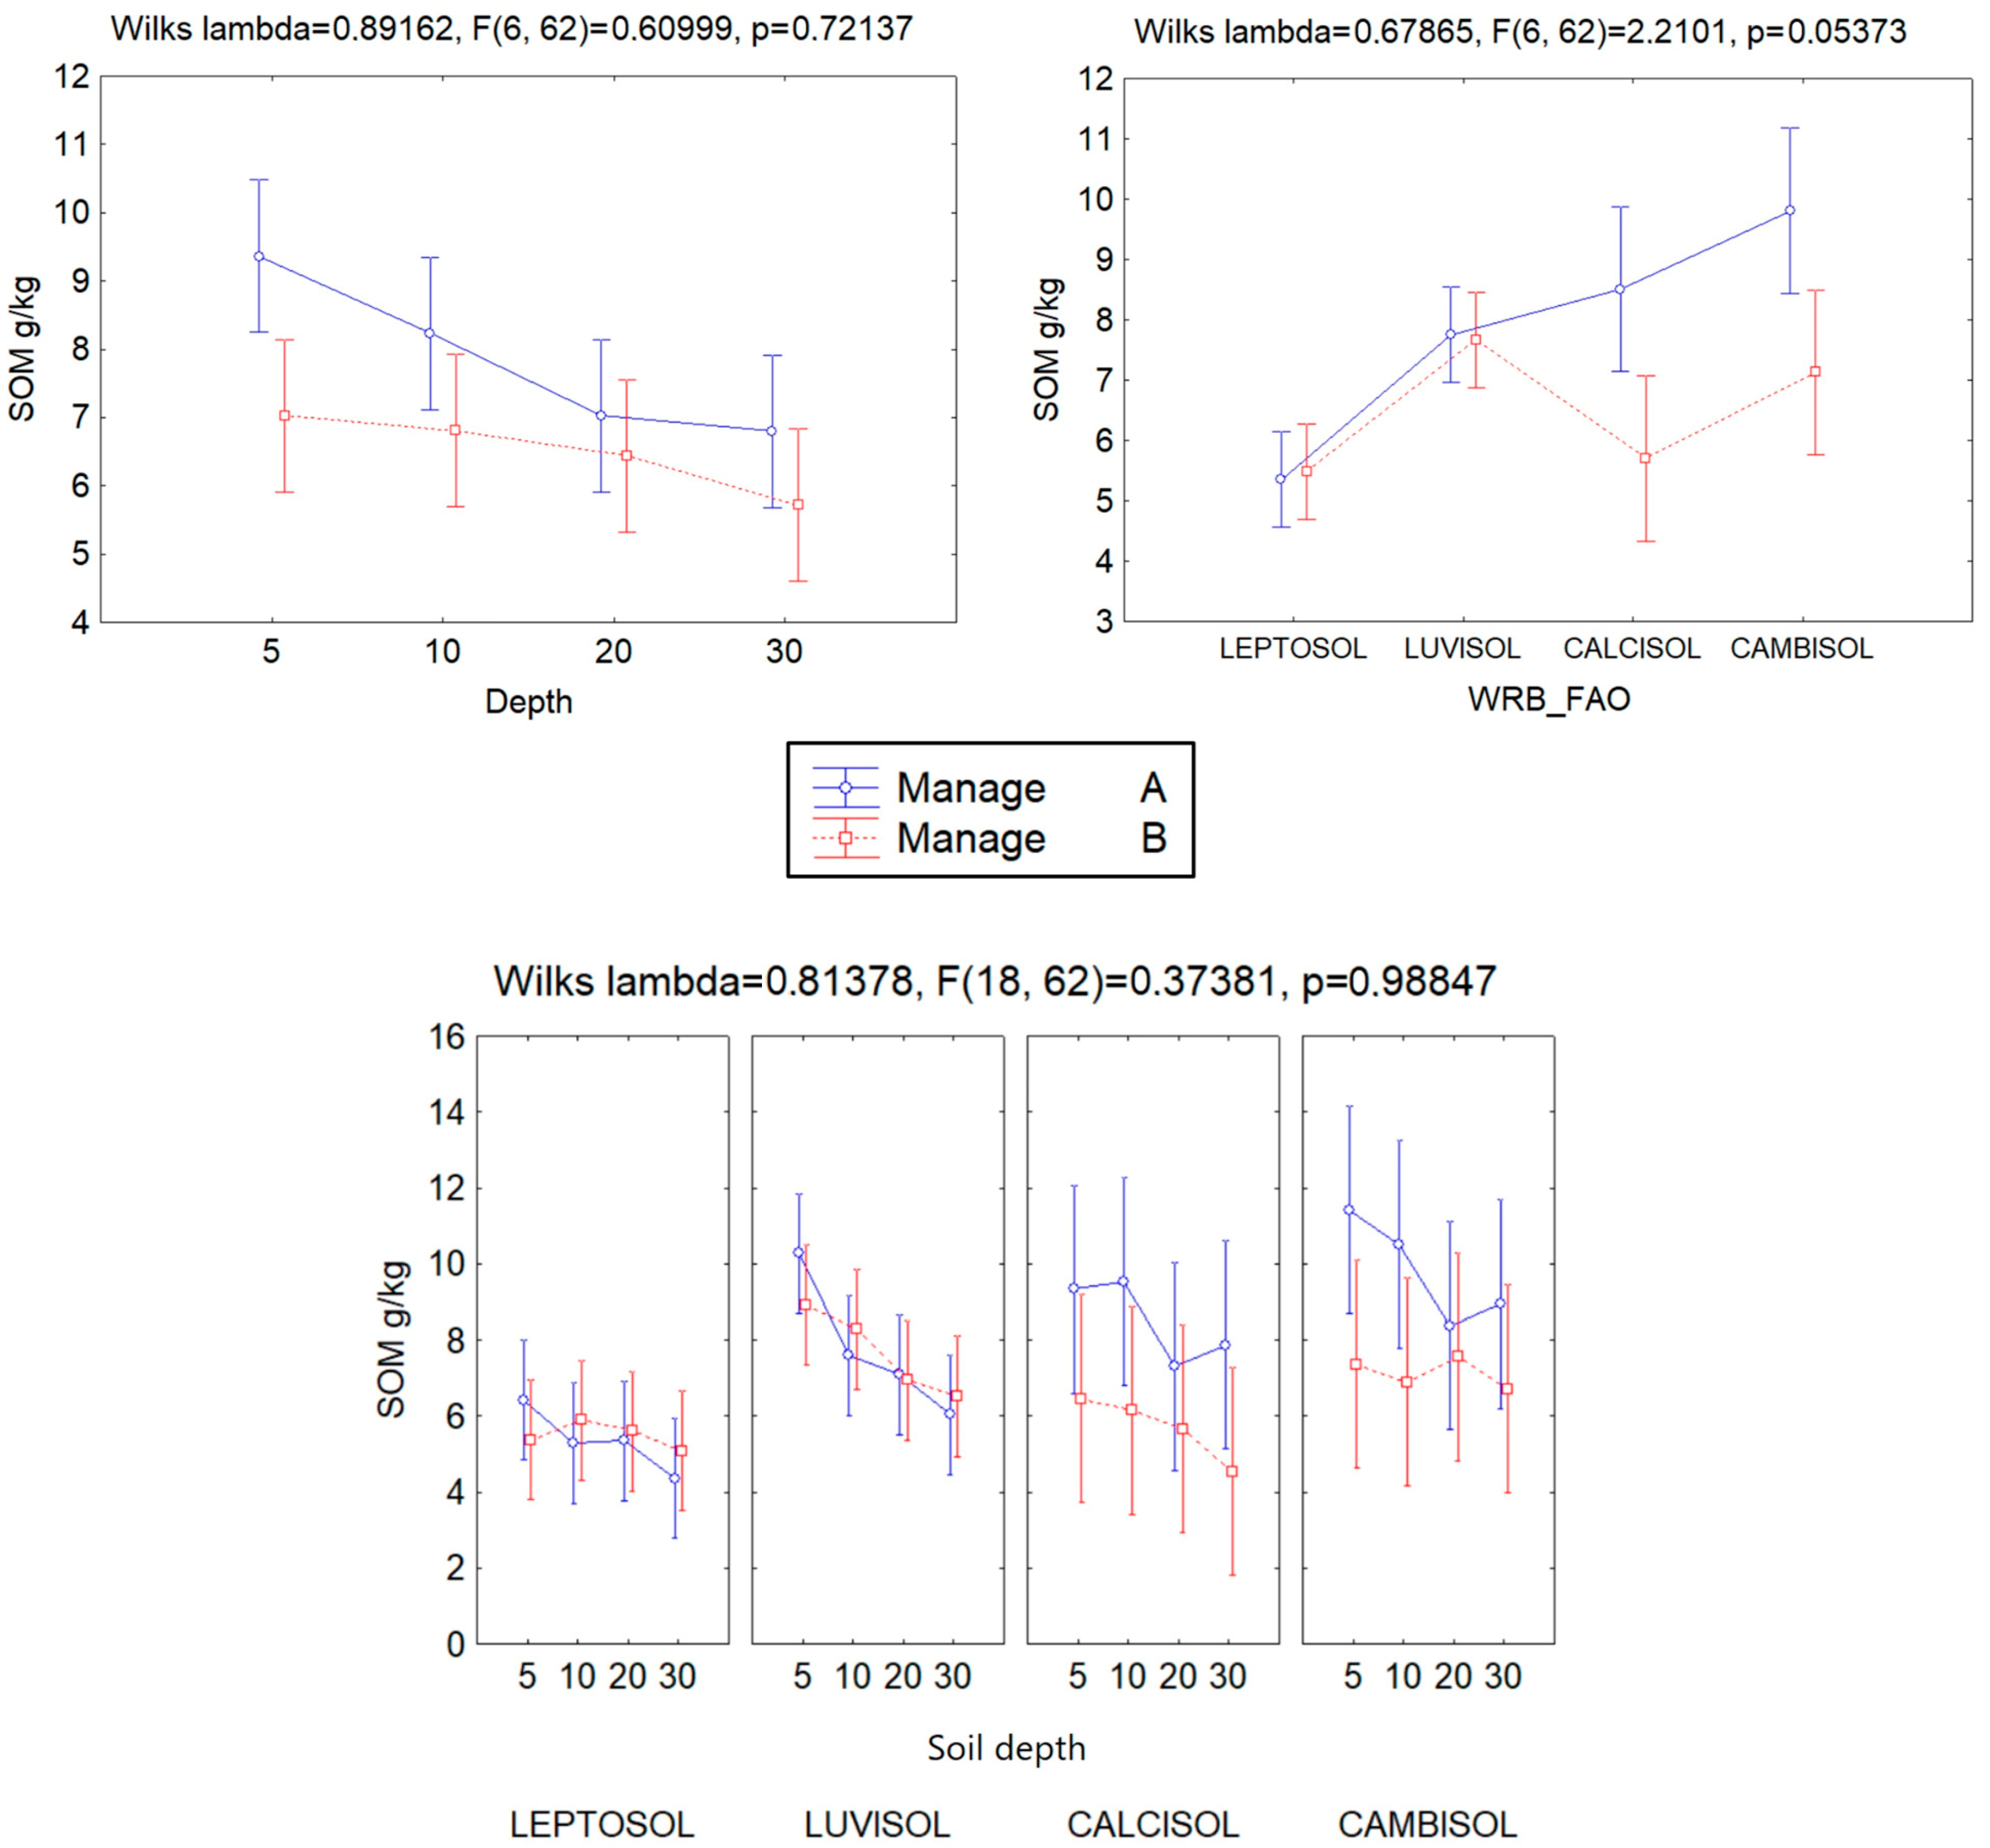
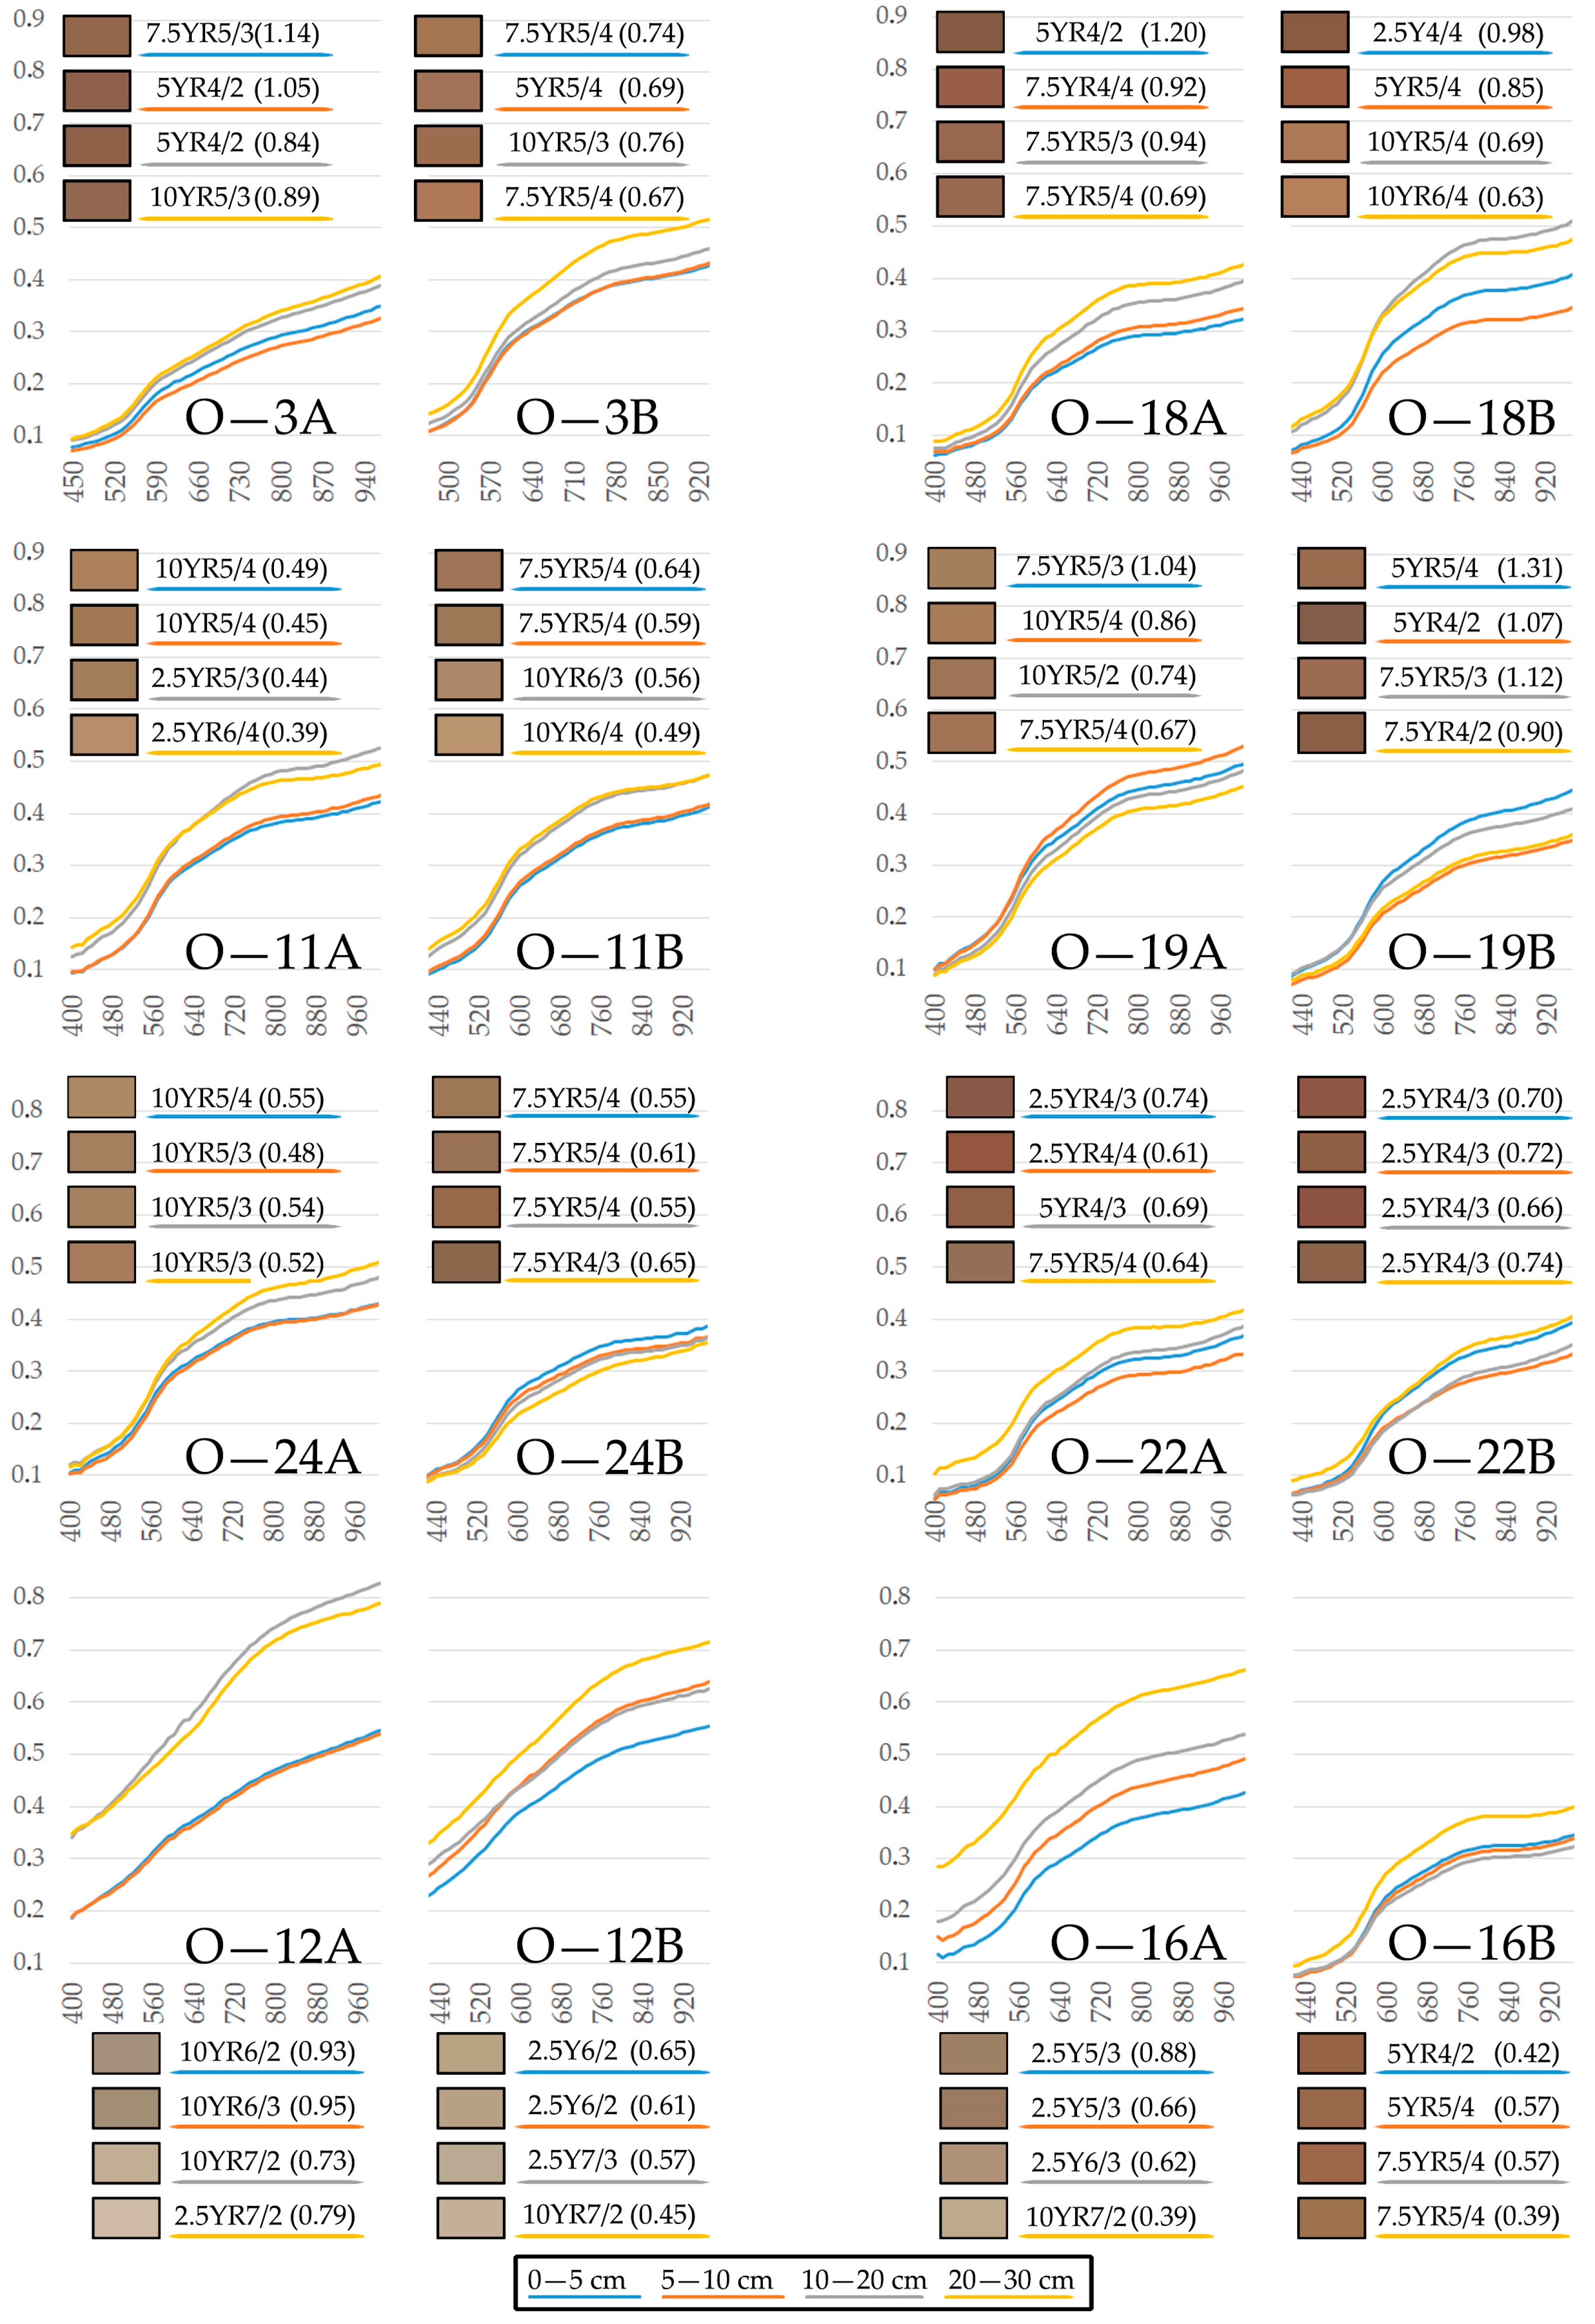
3.1. Soil Organic Matter Comparing Tillage and Alternative Management

There is a wider variation in the median values of SOM in soils under alternative management; this is because alternative management does not experience the homogenization that tillage provides to the soil properties, considering the soil depth (Figure 2). These agricultural soils are situated within an area spanning approximately 60 square kilometers; the highest values of SOM are around 10 g/kg and the lowest around 4 g/kg. There were significant differences (p < 0.05) between traditional tillage (SOM 6.6 ± 1.4 g/kg) and alternative managements (7.2 ± 2.3 g/kg) considering all the different layers (0 to 30 cm depth). The most vulnerable soils, classified as Leptosols, showed a lower concentration for SOC, below average, for both managements.
The general pattern of SOM distribution throughout the soil profile is shown in Figure 3, where the average of soil organic carbon in the different layers changes over depth. In this case, as expected, there are no differences between managements in the deepest layers, but there is a difference in the upper layer. Moreover, tillage leads to similar SOM content, which is not statistically different, ranging from 7.1% in the topsoil to 5.9% at 30 cm; this was caused by the abovementioned homogenization of soil materials due to plow.
The factorial analysis of variance (Table 3) shows that the three main variables considered alone—management, depth, and type of soil—have a significant effect on SOM. Both management and type of soil are also significant. However, other combinations of variables cannot explain the variance in SOM; however, in Figure 3, we can observe that Calcisols and Cambisols experience an increase in SOM, and there is a tendency to increase SOM up to 30 cm depth in both soil types.
Taking into account only SOM and limestone, we can find several differences in their relationship in the different soils of study. In Figure 4, we observe that, except for Cambisols, where there is a significant negative correlation between SOM content and calcium carbonate content, in the rest of the samples, this relationship is not clear from different soils. This fact can lead to false predictions of SOM content masked by the reflectance of calcium carbonate.

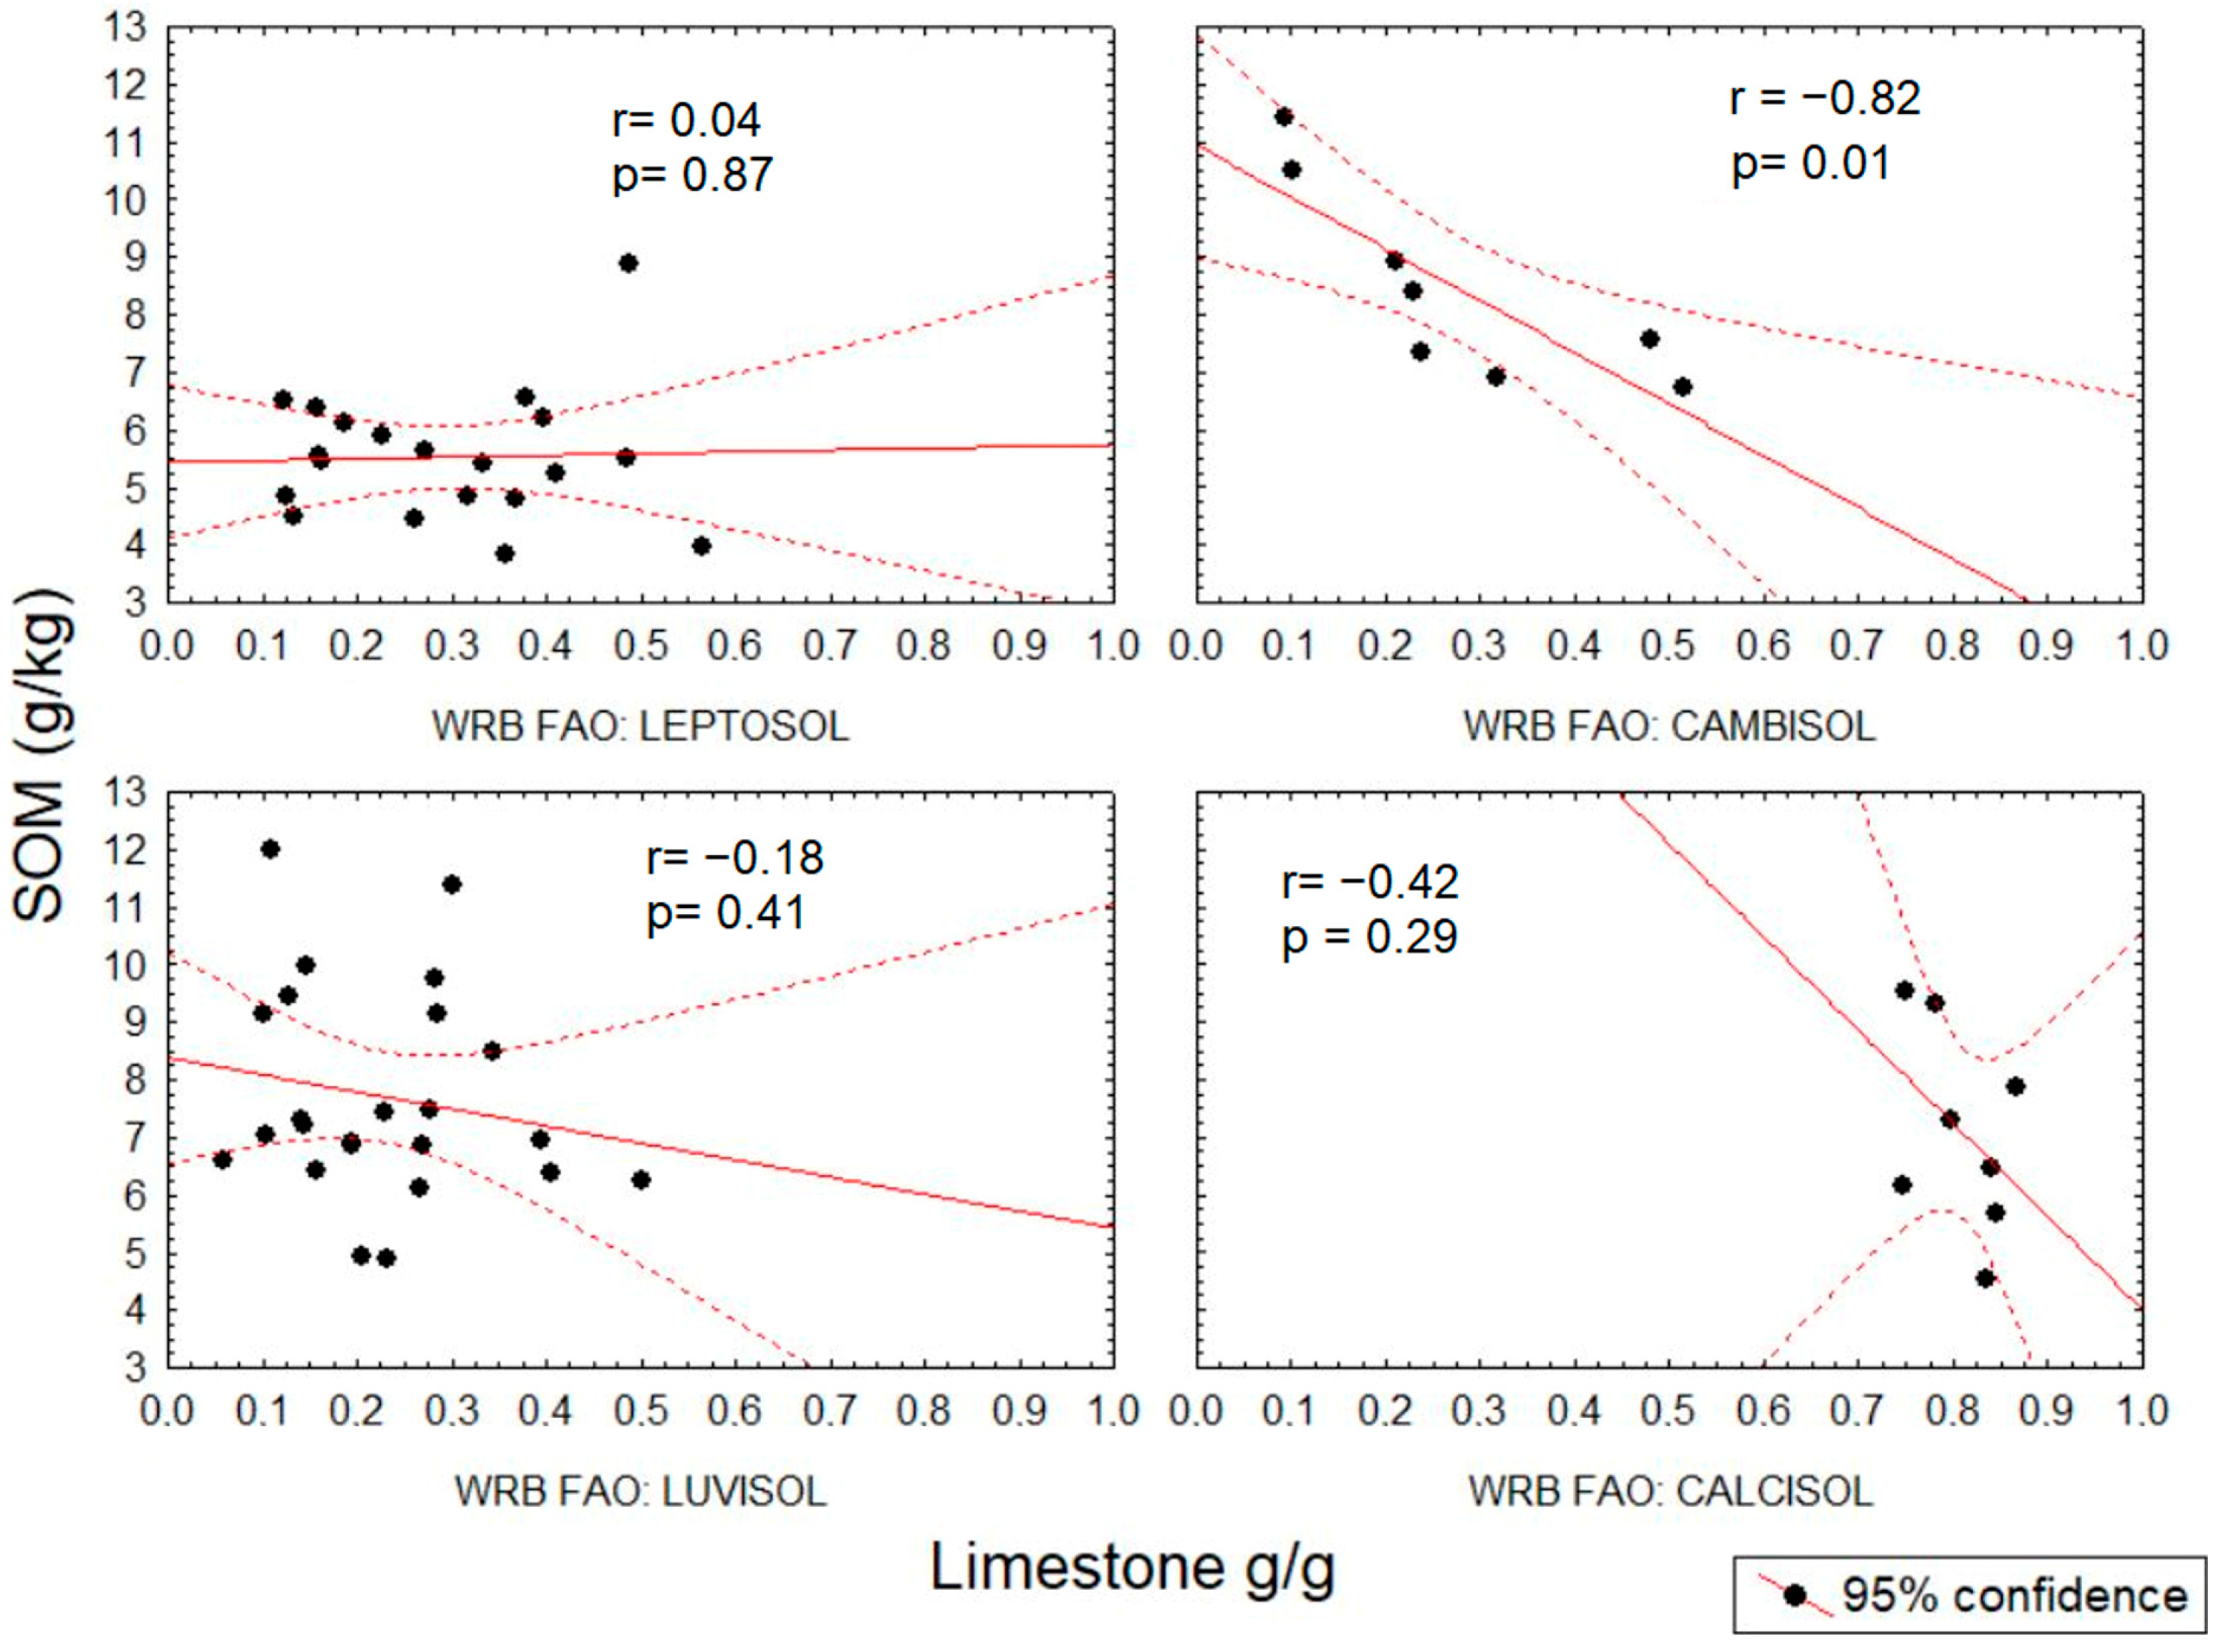
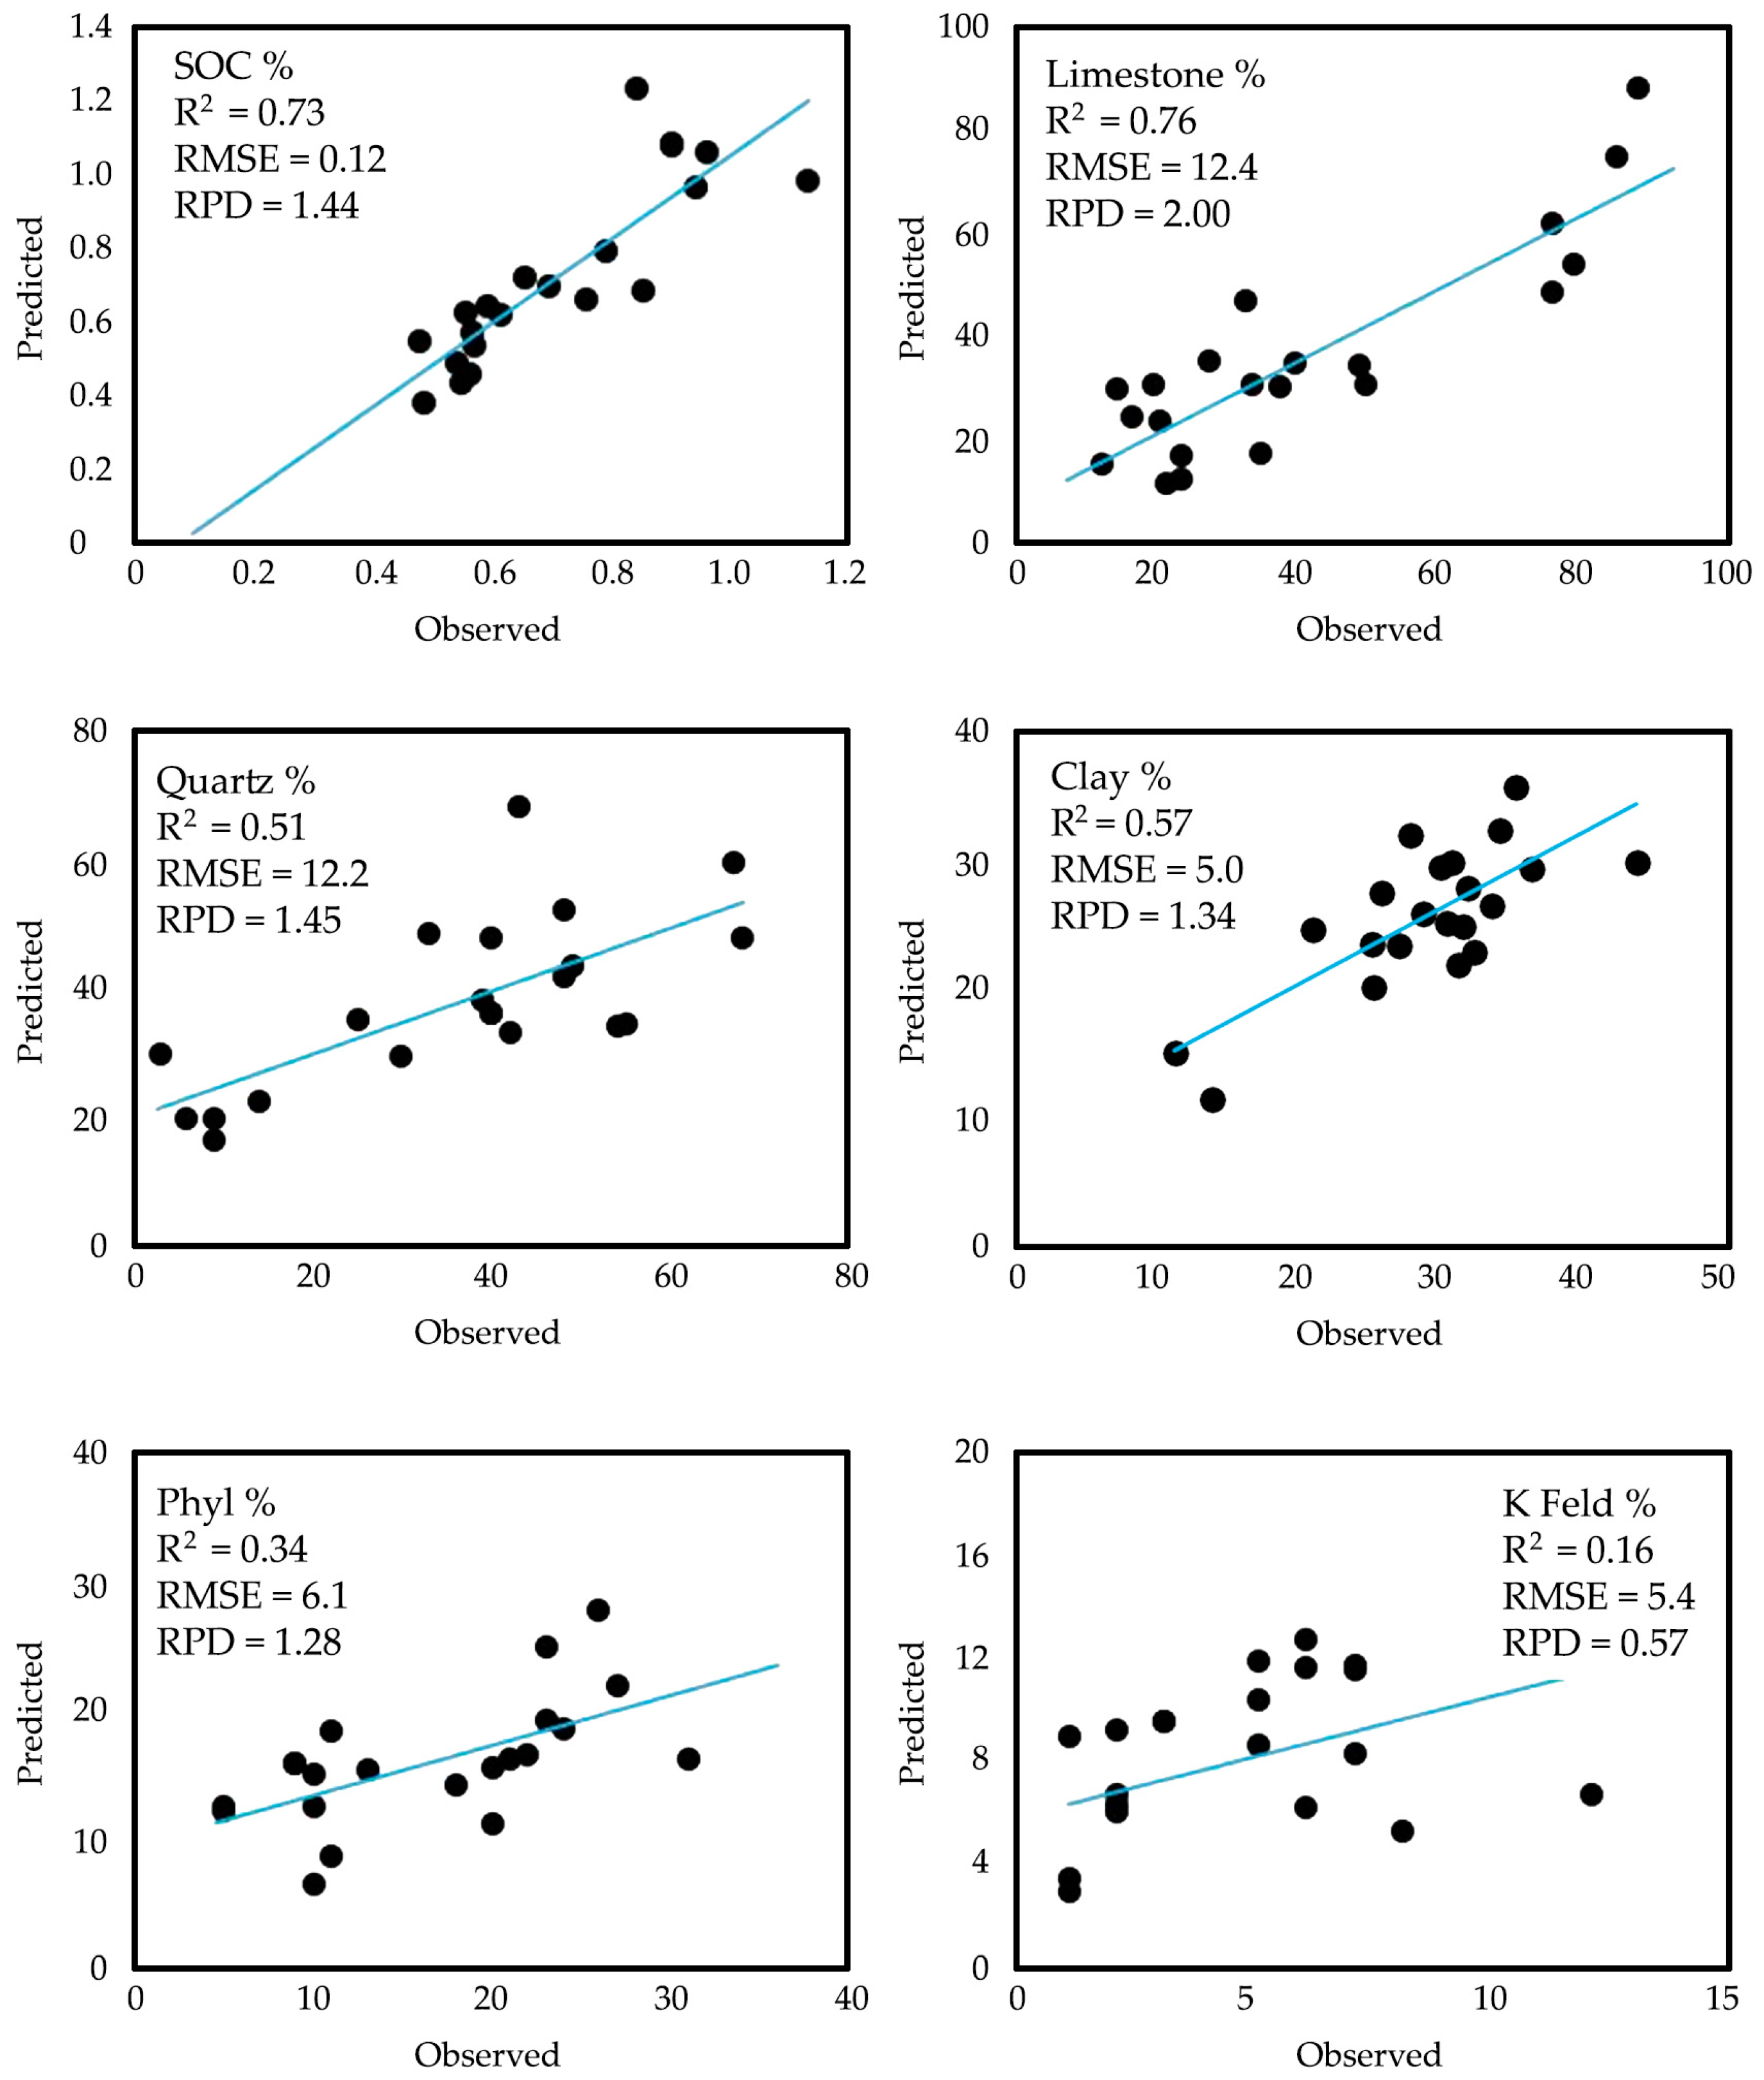
3.2. Prediction of Soil Characteristics Based on Spectral Data

The variations observed in the SOM for the different managements can also be noticed in the variations of the Vis–NIR spectra (400–900 nm) of samples (Figure 5). The colors and, therefore, the spectral features of soils are related to the magnitude of organic matter and minerals present in soils [32].
In Figure 5, we can observe the different patterns of soil reflectance caused by management in which each soil shows its unique spectral signature; on the right position at each site, tilled soils usually exhibit narrow spectra, indicating similar reflectance for soils coming from different depths. When there is a difference between spectra, soils coming from the deepest layers, shown in grey or orange line colors, usually show higher reflectance. On the left columns, in the charts corresponding to the alternative managements (A), different depths of soils exhibited higher scattering than the corresponding similar soil managed by tillage. We hypothesize that these patterns indicate less SOC, high content of lime, or both. At the same time, the absence of the disturbance of soil intensifies the different reflectance of soil layers.
The increase of SOC content or decrease of lime content are associated with a significant decrease in the reflectance, usually ranging over the entire wavelength, from 400 to 900 nm, in the study. This is based on the effects of the dark soil produced by the increase of SOC [33].
Exploratory analyses were conducted on all samples to identify outliers before constructing the PLRS model [34]; eliminating outliers can enhance prediction accuracy; therefore, they were excluded [35]. The number of outliers eliminated for each variable is provided in Table 4 (N out). The PLSR models were able to explain 85%, 87%, 79%, and 75% of the variance in SOC, limestone, clay, and quartz, respectively. The variations of the rest of the parameters did not contribute to the explanation of the variance within the dataset.
For the PLSR calibration set, R2 values ranged between 0.14 and 0.79. The best predictive models were obtained for SOC (R2 = 0.79, RMSE = 0.09, RPD = 2.05), and limestone (R2 = 0.70, RMSE = 11.1, RPD = 1.75), and an acceptable prediction was found for quartz (R2 = 0.56, RMSE = 10.2, RPD = 1.5). The rest of the variables would yield inaccurate predictions due to their low R2, high RMSE, or RPD lower than 1.5. The variability of the sample set, like the colors shown in Figure 5, may affect the accuracy of PLSR calibration models developed for the rest of the minerals: quartz, phyllosilicate, feldspar, and plagioclase, which in this study do not provide significant information.
In PLSR, distinct wavelengths were identified as highly responsive to changes in the concentration of soil organic carbon (SOC) within the range of 850–860 nm. Additionally, separate wavelengths were found to be sensitive to variations in the concentration of lime (720–730 nm).
In order to establish the accuracy of the prediction models of SOC, limestone, or the rest of the variables considered in this study, with 66% of samples, the model was subjected to cross-validation. Samples for the validations were not used in the model. Figure 6 shows the correlations obtained between the values of variables predicted by the Vis–NR models and the corresponding values observed in the laboratory in the set of the rest of the 33% of samples used for the validation of models, which were not included in the set for calibration.

4. Discussion

The different patterns of soil reflectance and unique spectral signature over depth caused by management indicate the vertical distribution of soil organic carbon or limestone and highlight the importance of incorporating vertical dimension into models of SOC dynamics, as demonstrated by other soil research on the distribution of SOC over depth [25,26]. These soils, which often exhibit lighter-colored subsurface layers due to higher concentrations of calcium carbonate, are particularly susceptible to erosion induced by tillage practices. As a consequence of erosion, subsurface layers are frequently exposed to the surface. One of the primary objectives of this study is to establish soil characteristics, based on their reflectance properties, as indicators of soil erosion. Reflectance measurements are conducted across different layers to capture variations in soil color, as deeper layers tend to be lighter in color compared to uppermost layers.
Soil management alternatives to tillage have demonstrated an increase in SOC, confirming that management practices can significantly improve soil characteristics, even in the least developed soils like Leptosols.
Understanding the benefits of sustainable land management practices extends beyond merely assessing the concentration of SOM; evaluating its quality and stability is paramount. Previous research conducted in this region on cover crops in vineyards revealed contrasting characteristics between soils managed with tillage and those managed with cover crops. Soils subjected to tillage exhibited little but well-humified SOM, with a higher proportion of large, complex, and more humified organic molecules. Conversely, soils managed with cover crops showed a greater presence of fresh SOM [36]. While this pool of fresh SOM may not directly contribute to carbon sequestration, it plays a crucial role in enhancing soil aggregation, water infiltration, water holding capacity, erosion reduction, and the promotion of root and microbial activity. Consequently, the next step involves a further examination of the nature of SOM in subsequent projects.
As has been frequently reported in the scientific literature, visible–near-infrared reflectance spectra used with soil samples can be used to predict certain soil properties. In our study, we observed that the prediction of soil organic carbon (SOC) levels can be influenced by the presence of calcium carbonate in the soil. This is because calcium carbonate has the tendency to increase the reflectance of soils, regardless of the actual SOC content. As a result, even in cases where the SOC levels are high, the presence of calcium carbonate can artificially elevate the reflectance readings, leading to potentially misleading predictions. This phenomenon poses a challenge in accurately assessing SOC levels using reflectance spectroscopy, as the influence of calcium carbonate must be carefully accounted for to avoid misinterpretation of results. Therefore, it is imperative to perform complementary chemical analyses to directly measure SOC and calcium carbonate content or any relevant minerals, which can then validate and refine our spectral predictions to develop robust calibration models that effectively account for the impact of calcium carbonate on soil reflectance in order to improve the accuracy of SOC predictions. Our study demonstrates the feasibility of predicting soil organic carbon, lime content, and, less accurately, quartz content using reflectance data obtained with a high-resolution laboratory spectrometer. It is important to highlight that the recalibration of Partial Least Squares (PLS) predictive functions would be necessary for other soil types and mineral compositions.
Soil organic carbon and calcium carbonate contents exhibited the most accurate predictions, followed by quartz. The validation R2 for these analyses exceeded 0.5, and the RPD (Ratio of Performance to Deviation) was satisfactory. We found the effectiveness of specific spectral regions within the 400–900 nm spectrum for predicting carbon content (at 850–860 nm), which is consistent with the spectral regions contributing to the prediction of SOC in other regions [37] and carbonate (720–730 nm), although other authors found absorption bands by 2250 to 2465 [38]. This underscores the potential of this methodology as a tool for swift and dependable soil mapping. However, the presence of both soil organic carbon and calcium carbonate can lead to overlapping spectral signatures, making it challenging to accurately differentiate between the two components based solely on remote sensing data. This can result in spectral confounding, where the contributions of each constituent to the overall reflectance spectrum are difficult to discern. Soils with complex compositions may exhibit spectral mixing effects, where the spectral signature observed remotely is a combination of the spectral characteristics of multiple soil constituents. This can complicate the interpretation of remote sensing data and make it challenging to isolate the contributions of individual soil properties or monitor soil health.
In this research, soils with higher levels of organic carbon often exhibit reduced reflectance values in their spectra. The prediction accuracy for SOC has been found to be high in different studies, with R2 by 0.9 and RPD higher than 3 in the scientific literature. Samples coming from different depths are arguably increasing the heterogeneity of the set of data [39]. This type of study, including samples from different depths, shows moderate predictions, like in those found by Morgan et al. [40], R2 was 0.82 and RPD = 1.5, and in Brown et al. [41], R2 ranged from 0.68 to 0.86 and RPD from 1.73 to 2.62.
Calcium carbonate is a highly reflective mineral, particularly in the near-infrared region of the electromagnetic spectrum. As a result, soils with elevated calcium carbonate content often display increased reflectance in their spectra. The prediction of calcium carbonate content on soils by PLSR is not so successful: e.g., Summers et al., Volkan Bilgili et al., and Khayamim et al. reported R2 values of 0.69, 0.64, and 0.54 in soils of dry environments in Australia [42], Turkey [43], and Iran [44], respectively. In this study, the R2 was 0.70 for Calcisols in semi-arid environments in central Spain.
Due to soil erosion caused by unsustainable land management practices in agricultural areas, monitoring soil conditions has become increasingly important. In the soils considered in this study, sustainable practices improved SOC content and reduced the reflectance of topsoil layers. It is well known that erosion can expose sub-surface layers that are often lighter in color [45] due to minerals like calcium carbonate and gypsum, especially in semi-arid areas [46]. This increased reflectance complicates the prediction of SOC, as these white minerals can mask the darker colors associated with high SOC content. Therefore, remote sensing studies should consider the spectra of sub-surface layers to improve monitoring where indicators of soil erosion are critical. By doing so, this research will lay the foundations for future studies in soil monitoring soil erosion processes in soils with different management.
In this study, reflectance spectroscopy was effective in providing a good prediction for calcium carbonate, even when its relationship with SOC is complex and challenging for soil monitoring. It is essential to continue developing an extensive and diverse database of spectra encompassing various soil types, conditions, and geographical regions. In this case, we are using different layers as well. Such a database enables robust calibration and validation models, enhancing the accuracy and reliability of predictions. The information included in this research (in supplemental data) improves the databases and enables robust calibration and validation models, enhancing the accuracy and reliability of predictions.

Supplementary Materials

The following supporting information can be downloaded at: https://www.mdpi.com/article/10.3390/agronomy14061150/s1.

Author Contributions

Conceptualization, J.E.H.-L., J.G.-C., R.B. and M.J.M.; methodology, J.E.H.-L., O.A. and J.G.-C.; software, R.R.-N. and M.J.N.-V.; validation, J.G.-C., J.E.H.-L. and J.P.M.-S.; formal analysis, J.P.M.-S. and O.A.; investigation, all; resources, B.S.; data curation, A.M.-D. and M.J.N.-V.; writing—original draft preparation, J.E.H.-L. and M.J.M.; writing—review and editing, all; supervision, B.S.; funding acquisition, B.S. and A.G.-D. All authors have read and agreed to the published version of the manuscript.

Funding

This research was carried out under the Project ACCION, GO Leñosost, (2018.2021) funded by IMIDRA.

Data Availability Statement

Spectra and soil analysis will be made available under request to the authors.

Conflicts of Interest

The authors declare no conflicts of interest.

References

  1. Montanarella, L.; Pennock, D.J.; McKenzie, N.; Badraoui, M.; Chude, V.; Baptista, I.; Mamo, T.; Yemefack, M.; Singh Aulakh, M.; Yagi, K.; et al. World’s soils are under threat. SOIL 2016, 2, 79–82. [Google Scholar] [CrossRef]
  2. Gómez, J. Sustainability using cover crops in Mediterranean tree crops, olives and vines—Challenges and current knowledge. Hung. Geogr. Bull. 2017, 66, 13–28. [Google Scholar] [CrossRef]
  3. Gómez, J.A.; Llewellyn, C.; Basch, G.; Sutton, P.B.; Dyson, J.S.; Jones, C.A. The effects of cover crops and conventional tillage on soil and runoff loss in vineyards and olive groves in several Mediterranean countries. Soil Use Manag. 2011, 27, 502–514. [Google Scholar] [CrossRef]
  4. Cécillon, L.; Barthès, B.G.; Gomez, C.; Ertlen, D.; Génot, V.; Hedde, M.; Stevens, A.; Brun, J.J. Assessment and monitoring of soil quality using near-infrared reflectance spectroscopy (NIRS). Eur. J. Soil Sci. 2009, 60, 770–784. [Google Scholar] [CrossRef]
  5. Dematte, J.A.M.; Campos, R.C.; Alves, M.C.; Fiorio, P.R.; Nanni, M.R. Visible-NIR reflectance: A new approach on soil evaluation. Geoderma 2004, 121, 95–112. [Google Scholar] [CrossRef]
  6. Leone, A.P.; Viscarra-Rossel, R.A.; Amenta, P.; Buondonno, A. Prediction of Soil Properties with PLSR and vis-NIR Spectroscopy: Application to Mediterranean Soils from Southern Italy. Curr. Anal. Chem. 2012, 8, 283–299. [Google Scholar] [CrossRef]
  7. Gomez, C.; Rossel, R.A.V.; McBratney, A.B. Soil organic carbon prediction by hyperspectral remote sensing and field vis-NIR spectroscopy: An Australian case study. Geoderma 2008, 146, 403–411. [Google Scholar] [CrossRef]
  8. Ben-Dor, E.; Banin, A. Near-Infrared Analysis as a Rapid Method to Simultaneously Evaluate Several Soil Properties. Soil Sci. Soc. Am. J. 1995, 59, 364–372. [Google Scholar] [CrossRef]
  9. Brown, D.J.; Shepherd, K.D.; Walsh, M.G.; Mays, M.D.; Reinsch, T.G. Global soil characterization with VNIR diffuse reflectance spectroscopy. Geoderma 2006, 132, 273–290. [Google Scholar] [CrossRef]
  10. Daniel, K.W.; Tripathi, N.K.; Honda, K. Artificial neural network analysis of laboratory and in situ spectra for the estimation of macronutrients in soils of Lop Buri (Thailand). Aust. J. Soil Res. 2003, 41, 47–59. [Google Scholar] [CrossRef]
  11. Baumgardner, M.F.; Silva, L.F.; Biehl, L.L.; Stoner, E.R. Reflectance Properties of Soils. In Advances in Agronomy; Brady, N.C., Ed.; Academic Press: Cambridge, MA, USA, 1986; Volume 38, pp. 1–44. [Google Scholar] [CrossRef]
  12. Clark, R.N. Spectroscopy of rocks and minerals and principles of spectroscopy. In Remote Sensing for the Earth Sciences: Manual of Remote Sensing; Rencz, N., Ed.; Johng Wiley & Sons: New York, NY, USA, 1999; Volume 3. [Google Scholar]
  13. Van Der Meer, F. Spectral reflectance of carbonate mineral mixtures and bidirectional reflectance theory: Quantitative analysis techniques for application in remote sensing. Remote Sens. Rev. 1995, 13, 67–94. [Google Scholar] [CrossRef]
  14. Ben-Dor, E.; Irons, J.R.; Epema, G.F. Soil reflectance. In Remote Sensing for the Earth Sciences: Manual of Remote Sensing; Rencz, N., Ed.; John Wiley & Sons: New York, NY, USA, 1999; Volume 3. [Google Scholar]
  15. CSIC. Cartografía Edafológica y Capacidad de Uso del Suelo de la Subregión de Madrid, 1:100,000. 1975-990. Instituto de Edafología y Biología Vegetal del Consejo Superior de Investigaciones Científicas, Madrid, 1990. Available online: https://datos.comunidad.madrid/catalogo/dataset/spacmsuelosfao1990 (accessed on 15 March 2024).
  16. Gee, G.W.; Bauder, J.W. Particle-size Analysis. In Methods of Soil Analysis; in SSSA Book Series; American Society of Agronomy, Inc.; Soil Science Society of America, Inc.: Madison, WI, USA, 1986; pp. 383–411. [Google Scholar] [CrossRef]
  17. Walkley, A.; Black, I.A. An examination of the Degtjareff method for determining soil organic matter, and a proposed modification of the chromic acid titration method. Soil Sci. 1934, 37, 29–38. [Google Scholar] [CrossRef]
  18. FAO. Standard Operating Procedure for Soil Bulk Density, Cylinder Method; FAO: Rome, Italy, 2023.
  19. Chung, F.H. Quantitative interpretation of X-ray diffraction patterns of mixtures. III. Simultaneous determination of a set of reference intensities. J. Appl. Crystallogr. 1975, 8, 17–19. [Google Scholar] [CrossRef]
  20. Schultz, L.G. Quantitative Interpretation of Mineralogical Composition from X-ray and Chemical Data for the Pierre Shale; Geological Survey: Washington, DC, USA, 1964. [Google Scholar]
  21. van der Marei, H.W. Quantitative analysis of clay minerals and their admixtures. Contrib. Mineral. Petrol. 1966, 12, 96–138. [Google Scholar] [CrossRef]
  22. FAO. A Primer on Soil Analysis Using Visible and Near-Infrared (Vis-NIR) and Mid-Infrared (MIR) Spectroscopy; Revision; FAO: Rome, Italy, 2024. [CrossRef]
  23. Shepherd, K.D.; Walsh, M.G. Development of reflectance spectral libraries for characterization of soil properties. Soil Sci. Soc. Am. J. 2002, 66, 988–998. [Google Scholar] [CrossRef]
  24. Allison, L.E. Organic Carbon. In Methods of Soil Analysis: Part 2. Chemical and Microbiological Properties. Agronomy Monograph; Black, C.A., Ed.; American Society of Agronomy, Soil Science Society of America: Madison, WI, USA, 1973; pp. 1367–1376. [Google Scholar]
  25. Shapiro, S.S.; Wilk, M.B.; Chen, H.J. A comparative study of various tests of normality. J. Am. Stat. Assoc. 1968, 63, 1343–1372. [Google Scholar] [CrossRef]
  26. Rossel, R.A.V. ParLeS: Software for chemometric analysis of spectroscopic data. Chemom. Intell. Lab. Syst. 2008, 90, 72–83. [Google Scholar] [CrossRef]
  27. Reeves, J.B.; McCarty, G.W.; Reeves, V.B. Mid-infrared diffuse reflectance spectroscopy for the quantitative analysis of agricultural soils. J. Agric. Food Chem. 2001, 49, 766–772. [Google Scholar] [CrossRef]
  28. Wold, H. Systems Analysis by Partial Least Squares, IIASA Collaborative Paper; IIASA: Laxenburg, Austria, 1983; Available online: http://pure.iiasa.ac.at/2336/ (accessed on 20 March 2024).
  29. Janik, L.J.; Merry, R.H.; Forrester, S.T.; Lanyon, D.M.; Rawson, A. Rapid Prediction of Soil Water Retention using Mid Infrared Spectroscopy. Soil Sci. Soc. Am. J. 2007, 71, 507–514. [Google Scholar] [CrossRef]
  30. Dunn, B.W.; Beecher, H.G.; Batten, G.D.; Ciavarella, S. The potential of near-infrared reflectance spectroscopy for soil analysis—A case study from the Riverine Plain of south-eastern Australia. Aust. J. Exp. Agric. 2002, 42, 607–614. [Google Scholar] [CrossRef]
  31. International Union of Soil Sciences Working Group World Reference Base. Reference Base for Soil Resources (WRB) 2014, update 2015. International soil classification system for naming soils and creating legends for soil maps. In World Soil Resources Report; No. 106; FAO: Rome, Italy, 2015. [Google Scholar]
  32. Krishnan, P.; Alexander, J.D.; Butler, B.J.; Hummel, J.W. Reflectance Technique for Predicting Soil Organic Matter. Soil Sci. Soc. Am. J. 1980, 44, 1282–1285. [Google Scholar] [CrossRef]
  33. Bartholomeus, H.M.; Schaepman, M.E.; Kooistra, L.; Stevens, A.; Hoogmoed, W.B.; Spaargaren, O.S.P. Spectral reflectance based indices for soil organic carbon quantification. Geoderma 2008, 145, 28–36. [Google Scholar] [CrossRef]
  34. Wu, Y.; Chen, J.; Wu, X.; Tian, Q.; Ji, J.; Qin, Z. Possibilities of reflectance spectroscopy for the assessment of contaminant elements in suburban soils. Appl. Geochem. 2005, 20, 1051–1059. [Google Scholar] [CrossRef]
  35. Murray, I. Aspects of interpretation of NIR spectra. In Analytical Application of Spectroscopy; Creaser, C.S., Davies, A.M.C., Eds.; Royal Society of Chemistry: London, UK, 1988; pp. 9–21. [Google Scholar]
  36. Jiménez-González, M.A.; López-Romano, H.; Carral, P.; Álvarez-González, A.M.; Herranz-Luque, J.E.; Sastre-Rodríguez, B.E.; García-Díaz, A.; Muñoz-Organero, G.; Marques, M.J. Ten-Year Impact of Cover Crops on Soil Organic Matter Quantity and Quality in Semi-Arid Vineyards. Land 2023, 12, 2143. [Google Scholar] [CrossRef]
  37. Cambou, A.; Allory, V.; Cardinael, R.; Vieira, L.C.; Barthès, B.G. Comparison of soil organic carbon stocks predicted using visible and near infrared reflectance (VNIR) spectra acquired in situ vs. on sieved dried samples: Synthesis of different studies. Soil Secur. 2021, 5, 100024. [Google Scholar] [CrossRef]
  38. Farifteh, J.; Farshad, A.; George, R.J. Assessing salt-affected soils using remote sensing, solute modelling, and geophysics. Geoderma 2006, 130, 191–206. [Google Scholar] [CrossRef]
  39. Brunet, D.; Barthès, B.G.; Chotte, J.L.; Feller, C. Determination of carbon and nitrogen contents in Alfisols, Oxisols and Ultisols from Africa and Brazil using NIRS analysis: Effects of sample grinding and set heterogeneity. Geoderma 2007, 139, 106–117. [Google Scholar] [CrossRef]
  40. Morgan, C.L.S.; Waiser, T.H.; Brown, D.J.; Hallmark, C.T. Simulated in situ characterization of soil organic and inorganic carbon with visible near-infrared diffuse reflectance spectroscopy. Geoderma 2009, 151, 249–256. [Google Scholar] [CrossRef]
  41. Brown, D.J.; Bricklemyer, R.S.; Miller, P.R. Validation requirements for diffuse reflectance soil characterization models with a case study of VNIR soil C prediction in Montana. Geoderma 2005, 129, 251–267. [Google Scholar] [CrossRef]
  42. Summers, D.; Lewis, M.; Ostendorf, B.; Chittleborough, D. Visible near-infrared reflectance spectroscopy as a predictive indicator of soil properties. Ecol. Indic. 2011, 11, 123–131. [Google Scholar] [CrossRef]
  43. Bilgili, A.V.; van Es, H.M.; Akbas, F.; Durak, A.; Hively, W.D. Visible-near infrared reflectance spectroscopy for assessment of soil properties in a semi-arid area of Turkey. J. Arid Environ. 2010, 74, 229–238. [Google Scholar] [CrossRef]
  44. Khayamim, F.; Wetterlind, J.; Khademi, H.; Robertson, A.H.J.; Cano, A.F.; Stenberg, B. Using Visible and near Infrared Spectroscopy to Estimate Carbonates and Gypsum in Soils in Arid and Subhumid Regions of Isfahan, Iran. J. Near Infrared Spectrosc. 2015, 23, 155–165. [Google Scholar] [CrossRef]
  45. Vrieling, A. Satellite remote sensing for water erosion assessment: A review. Catena 2006, 65, 2–18. [Google Scholar] [CrossRef]
  46. Escadafal, R. Remote sensing of arid soil surface color with Landsat thematic mapper. Adv. Space Res. 1989, 9, 159–163. [Google Scholar] [CrossRef]
Figure 1. Example of the election of sampling points among plots having close locations, so similar soil but different land management. (a) sample O-12, (b) sample O-16. A = Alternative to Tillage; B = Traditional tillage.
Agronomy 14 01150 g001
Figure 2. Soil organic matter (SOM) in the agricultural plots considered in the study. Values are considering the whole profile from the surface to 30 cm depth.
Agronomy 14 01150 g002
Figure 3. Soil organic matter (SOM, g/kg) change over depth in alternative (A) and traditional tillage management (B). The effect of management is shown over depth (upper left chart), between soil types (upper right chart), and considering both depth and soil type (down chart). Vertical lines denote 0.95 confidence intervals.
Agronomy 14 01150 g003
Figure 4. Correlations between soil organic matter content (SOM g/kg) and calcium carbonate (Limestone g/g) in the different groups of soils.
Agronomy 14 01150 g004
Figure 5. Vis–NIR spectra of soil samples (from O-3 to O-24 agricultural plots) at different depths. In blue, the samples are in the topsoil (0–5 cm depth); in orange, the layers are 5–10 cm, in grey, 10 to 20 cm, and in yellow, 20 to 30 cm. The samples corresponding to the alternative management are labeled with the letter A (on the left), while those associated with traditional tillage end with B (on the right). Additionally, each sample is presented with scanned soil colors in the Vis range (boxes with a black frame), color code according to the Munsell scale and the average (in brackets) for soil organic carbon (%).
Agronomy 14 01150 g005
Figure 6. Comparison between measured and cross-validation predicted values of soil contents in soil organic carbon, limestone, quartz, clay, phyllosilicates, and K-feldspars.
Agronomy 14 01150 g006
Table 1. Location and management of sampling points.
Location SiteManagement and History of PlotsCoordinates
O-11A7 yr without tillage. Spontaneous vegetation. Supplementary irrigationX: 462910,60 Y: 4457309,26
O-11BTraditional tillageX: 462891,19 Y: 4457338,22
O-12A15 yr without tillage, very scarce spontaneous veg. X: 474610,20 Y: 4440945,56
O-12BTraditional tillageX: 474577,02 Y: 4440961,21
O-16A6 yr without tillage. Spontaneous veg. soil amended with fertilizers or organic matterX: 469401,64 Y: 4470425,69
O-16BTraditional tillageX: 469433,79 Y: 4470398,92
O-18A6 yr without tillage. Spontaneous veg. mowed 2–4 times/yrX: 470004,44 Y: 4470247,88
O-18BTraditional tillageX: 470038,42 Y: 4470255,51
O-19A6 yr without tillage. Spontaneous vegetation X: 470143,77 Y: 4470065,28
O-19BTraditional tillage X: 470176,83 Y: 4470054,05
O-22A7 yr without tillage. Spontaneous vegetationX: 468746,05 Y:4456035,20
O-22BTraditional tillageX: 468522,19 Y: 4455989,51
O-24A5 yr without tillage. Very scarce spontaneous vegetation, abundant stones, and no need for mowing. X: 463752,42 Y: 4457488,32
O-24BTraditional tillageX: 463744,95 Y: 4457527,20
O-3ATime unknown. Shallow-depth tillage and incorporation of wood pruning residuesX: 468841,07 Y: 4451822,38
O-3BTraditional tillageX: 468779,75 Y: 4451721,48
Table 2. Mineral composition, bulk density, and texture of soils in the areas studied. Median and 25 and 75 quartiles (Q25-75). Soil depth of 0 to 30 cm, N = 8.
Title 1O-11O-12O-16O-18O-19O-22O-24O-3
Phyllosil.9%10%24%25%23%23%19%12%
%8.6–15.69.2–10.219.3–26.720.6–26.120.5–24.321.6–25.417.1–21.77–19.5
Quartz50.8%7.5%42.8%39.9%43.8%44.0%39.4%46.9%
%48.1–54.84.4–9.230.9–5726.9–49.539.6–49.134.8–54.831.7–45.441.7–66.1
K-Feldsp.6.8%1.2%6.6%4.8%8.4%9.0%6.5%5.2%
%3–13.80.8–1.73.5–11.62.8–6.95.6–10.36.5–12.33.9–7.52.8–7.2
Limestone24.4%81.7%44.3%23.9%21.8%19.3%25.9%23.4%
%14.5–29.576.6–84.338.8–52.611.8–36.917–28.212.4–26.716.1–38.815.6–39.9
Bulk dens 1.44 1.19 1.55 1.47 1.51 1.44 1.49 1.32
g cm−31.3–1.51.2–1.21.5–1.61.4–1.51.5–1.51.3–1.61.3–1.61.2–1.4
Sand39.437.351.528.442.541.232.044.4
%36.6–4234.7–39.637.5–6125.4–32.730.8–50.239.6–47.329.9–34.242.5–48
Silt33.330.631.059.431.526.436.330.9
%30.3–36.327.2–31.619.8–41.255.9–61.326.1–38.323.4–28.235.7–37.128.3–33.5
Clay27.333.219.712.526.832.330.224.1
%25.9–29.630–33.918.5–21.210.3–13.923.3–30.824.6–37.528.6–34.522.7–24.7
TextureLoamClay loamSandy loamSilt loamLoamClay loamClay loamLoam
Table 3. Effects of management (tillage or alternative), depth, and soil type (FAO, WRB) on soil organic matter. Significant differences (p < 0.05) are marked with *.
EffectWilks ValueFEffect dfError dfp
Management0.6916.932310.003 *
Depth0.6312.676620.023 *
FAO soil0.18913.416620.000 *
Manage & FAO soil0.6792.216620.05 *
Manage & depth0.8920.616620.72
Depth & FAO soil0.5801.0818620.40
Manage & depth & FAO soil0.8140.3718620.99
Table 4. Performance of Vis–NIR spectroscopy-based predictive models for the soil variables, including statistical parameters obtained for calibration and cross-validation. Var Y is the variance explained.
PLRS Calibration Set
VariableMeanSDMedianR2RMSERPDN OutVar Y
SOC0.710.230.670.790.092.05285%
Limestone28.819.5230.7011.11.75187%
Clay 24.77.724.90.614.81.60179%
Quartz41.515.3450.5610.21.50175%
Phyllosilicate19.27.8210.357.31.26234%
K Feldspar8.97.770.147.11.09120%
Plagioclase2.92.720.322.21.17262%
PLRS validation set
MeanSDMedianR2RMSERPD
SOC0.710.180.650.730.121.44
Limestone40.324.8330.7612.42.00
Clay 27.97.029.50.575.01.34
Quartz36.319.2400.5113.21.45
Phyllosilicate16.67.7180.346.11.28
K Feldspar4.42.950.165.40.57
Plagioclase3.44.920.034.90.78
Disclaimer/Publisher’s Note: The statements, opinions and data contained in all publications are solely those of the individual author(s) and contributor(s) and not of MDPI and/or the editor(s). MDPI and/or the editor(s) disclaim responsibility for any injury to people or property resulting from any ideas, methods, instructions or products referred to in the content.

