Article

HPPEM: A High-Precision Blueberry Cluster Phenotype Extraction Model Based on Hybrid Task Cascade

1
College of Information Engineering, Dalian University, Dalian 116622, China
2
Institute of Modern Agricultural Research, Dalian University, Dalian 116622, China
*
Author to whom correspondence should be addressed.
Agronomy 2024, 14(6), 1178; https://doi.org/10.3390/agronomy14061178
Submission received: 26 April 2024 / Revised: 25 May 2024 / Accepted: 28 May 2024 / Published: 30 May 2024
(This article belongs to the Section Precision and Digital Agriculture)

Abstract

:
Blueberry fruit phenotypes are crucial agronomic trait indicators in blueberry breeding, and the number of fruits within the cluster, maturity, and compactness are important for evaluating blueberry harvesting methods and yield. However, the existing instance segmentation model cannot extract all these features. And due to the complex field environment and aggregated growth of blueberry fruits, the model is difficult to meet the demand for accurate segmentation and automatic phenotype extraction in the field environment. To solve the above problems, a high-precision phenotype extraction model based on hybrid task cascade (HTC) is proposed in this paper. ConvNeXt is used as the backbone network, and three Mask RCNN networks are cascaded to construct the model, rich feature learning through multi-scale training, and customized algorithms for phenotype extraction combined with contour detection techniques. Accurate segmentation of blueberry fruits and automatic extraction of fruit number, ripeness, and compactness under severe occlusion were successfully realized. Following experimental validation, the average precision for both bounding boxes (bbox) and masks stood at 0.974 and 0.975, respectively, with an intersection over union (IOU) threshold of 0.5. The linear regression of the extracted value of the fruit number against the true value showed that the coefficient of determination (R2) was 0.902, and the root mean squared error (RMSE) was 1.556. This confirms the effectiveness of the proposed model. It provides a new option for more efficient and accurate phenotypic extraction of blueberry clusters.

1. Introduction

The northern highbush blueberries (a group of different horticultural varieties resulting from mutations of the wild corymb bilberry and their interspecific crosses) are the earliest cultivated species of blueberries. This group of blueberries has the highest economic value of all blueberry species, and nearly 100 varieties are currently in production [1]. Blueberry fruit is rich in anthocyanins, organic acids, vitamins and other biologically active substances, which have antioxidant, vision protection, anti-cancer and anti-inflammatory effects [2]. As consumers are becoming more and more concerned about the health benefits of blueberries, the market demand for fresh blueberries has surged and the production of blueberries is rising rapidly. The global blueberry production rose from 622,900 tons in 2016 to 850,900 tons by 2020 [3,4]. The traditional harvesting of highbush blueberries is completed by hand in batches, which generally lasts for three to four weeks, thus requiring a large amount of labor during the harvest season [5]. With the surge in global blueberry production, labor costs are rising rapidly. As a result, more and more blueberry growers are seeking alternative harvesting options [6]. Currently, there are two main alternatives, the “granular” mechanical harvesting model and the “bunch” whole-crop harvesting model.
The “granular” mode of mechanical harvesting is suitable for blueberry varieties with loose clusters. Breeding blueberry varieties for mechanical harvesting has been underway since the mid-1990s [5]. According to blueberry breeders, in order to develop varieties suitable for mechanical harvesting, the following factors should be taken into account: narrow upright bush structure, relatively concentrated ripening of fruits, and loose clusters. Wang et al. [7] pointed out that the principle of mechanical harvesting of blueberries is to vibrate the fruits by inertia around the stalks. This vibration overcomes the bonding force with the stalks and sheds the fruits. For blueberries with very dense clusters, the fruits are so closely adjacent to each other that it is difficult to produce vibration around the stalk. In addition, mechanical harvesting can realize selective harvesting according to the different binding force between mature and immature fruits and fruit stalks. However, in the case of tightly clustered blueberries, the mature and immature fruits squeeze each other. This makes it difficult to realize selective harvesting of mature fruits.
The “bunch” mode of whole cluster harvesting is suitable for blueberry varieties with dense clusters and uniform maturity onset. In addition to granular picking, with the continuous development of breeding work, there are also new blueberry varieties suitable for spike harvesting, such as “morning snow” [8]. Pellet harvesting of blueberries brings about the wound of the fruit tip scar, which causes the blueberries to be easy to soften and rot. The “bunch” whole-ear picking mode solves the problem of claw marks caused by granular picking. It also has the advantages of saving time and labor and shortening the picking cycle. When cultivating blueberry varieties suitable for the “bunch” picking mode, blueberry breeders take the main direction of cultivating blueberry varieties with dense clusters, consistent ripening period, good productivity and uniform fruit size.
Different picking patterns place different demands on the traits of blueberry clusters. Granular mechanical picking requires blueberries with loose clusters, while spike harvesting requires blueberries with compact clusters. Xu et al. [9] pointed out that breeding blueberry varieties suitable for mechanical picking is one of the future trends in blueberry breeding. Meanwhile, in response to the diversification of the blueberry market, breeding new blueberry varieties with dense clusters and suitable for spike picking mode will also be an important direction for future breeding. Therefore, evaluating the cluster compactness of different blueberry varieties can help in selecting genotypes for specific harvesting patterns in blueberry breeding efforts. In addition, although blueberries are similar to grapes in that they hang in clusters, they differ considerably in their ripening process. Fruit on the same cluster of blueberries vary widely in maturity, with fruit at the front end of the cluster ripening first, followed by successive ripening later. Therefore, evaluating the maturity of blueberry clusters can help determine picking time, as well as provide assistance in breeding blueberries with consistent onset of ripening. Information on the number of fruits within a cluster is also important for yield estimation. Therefore, a method that automatically extracts these three traits from images would be of great interest to blueberry breeding efforts.
There are few studies on blueberry cluster compactness. Brightwell et al. [10] categorized blueberry cluster compactness into three classes by subjective observation. Compact clusters were defined as all fruits being in contact with each other, and the first ripe fruit was difficult to pick. Moderately compact clusters were defined as most of the fruits being in contact with at least two fruits, and the first ripe fruit was difficult to pick. Loose clusters were defined as the fruits might or might not be in contact with each other and were easy to pick. However, this subjective definition is difficult to extract quantitatively. Ni et al. [11] used Mask R-CNN to segment blueberry fruits and quantified cluster compactness as the ratio of the area of the blueberry mask within the cluster to the area of the smallest bounding box enclosing the blueberry. This method realizes the quantization and automatically extracts the cluster compactness, but the model detection accuracy is not high due to the serious occlusion problem in the image. The average precision on the test set with IOU threshold of 0.5 is 71.6%, which makes it difficult to accurately detect and segment the blueberry fruits. Therefore, it is very meaningful to find a method to realize accurate detection of blueberry fruits and automatically extract the compactness.
Shi et al. [12] showed that color attributes are one of the most important indicators of blueberry maturity and quality. The harvest time and stage of the fruit is based on the color and firmness of the fruit. Lobos et al. [13] defined the optimal harvest maturity of blueberries as a peel color that achieves 100% blue coverage, which suggests that the surface color can be representative of the ripeness of the blueberry fruit. Among the traditional methods used for blueberry detection and classification, a favored approach is to utilize the spectral properties of blueberries. Ma et al. [14] performed blueberry fruit ripeness recognition in complex backgrounds based on hyperspectral image processing techniques. The model achieved 96.1%, 94.7% and 91.2% accuracy for ripe, nearly ripe and green fruits, respectively. However, the application of this method is limited by the fact that the target spectra are susceptible to environmental variations, so the study needs to be conducted indoors under ideal conditions of uniform illumination and no wind. Compared to multispectral cameras, the amount of data generated using digital camera shots is much less and the imaging time is greatly reduced [15]. Consequently, there is a growing focus in research on utilizing visible light data for inspection while also showcasing its effectiveness in identifying blueberry ripening stages. One of our objects is detection of blueberry fruit ripeness in RGB images taken in the field and extracting cluster ripeness information.
Deep learning, renowned for its robust feature learning ability, has led to numerous applications in RGB images in recent decades. By encoding various low-level features into more discerning high-level representations, it enables the resolution of intricate problems with enhanced accuracy [16]. Compared with traditional texture analysis methods, deep learning models have stronger feature extraction and higher nonlinear representation capabilities. The global structure and background information of the image can be better understood. This is especially important for target segmentation in complex scenes. Deep learning models find primary application in three key areas: object classification, detection, and image segmentation [17]. Presently, research concerning the utilization of deep learning techniques for blueberry fruit primarily centers around object classification and detection. Some object detection models have been used for blueberry fruit detection. Wang et al. [18] realized the recognition and detection of blueberry fruits with different ripeness in a natural environment. They introduced a convolutional attention module on the basis of the original YOLOv4-Tiny deep convolutional detection network structure. The model achieved an average precision of 96.24%. In blueberry phenotyping studies, achieving precise pixel regions is often necessary, a task not fully addressed solely through bounding box detection, but rather through segmentation methods. In order to quantify the number of blueberry fruits, Gonzalez et al. [19] proposed a Mask R-CNN based instance segmentation method for detecting, segmenting, and quantifying captured blueberry images. They tested it using different backbones such as ResNet101, ResNet50, and MobileNetV1. The best detection results were obtained using the ResNet50 backbone, with average precision of 0.759 and 0.909 for bbox and mask, respectively, at an IOU threshold of 0.5. Mask R-CNN [20] uses a single IOU threshold for positive and negative sample selection, which can produce mismatch problems during training and testing, and it is not possible to improve the IOU thresholds to obtain more accurate predictions. Mixing and cascading ideas is a powerful strategy for improving task performance [21,22,23]. Our goal is to solve the mismatch problem and produce more accurate predictions by gradually increasing the IOU threshold through a hybrid cascade structure [24,25,26] for stage-by-stage refinement.
In order to realize the automatic extraction of phenotypic traits of blueberry clusters, we propose a high-precision blueberry cluster phenotype extraction model (HPPEM) based on hybrid task cascade, and make the following contributions:
(1)
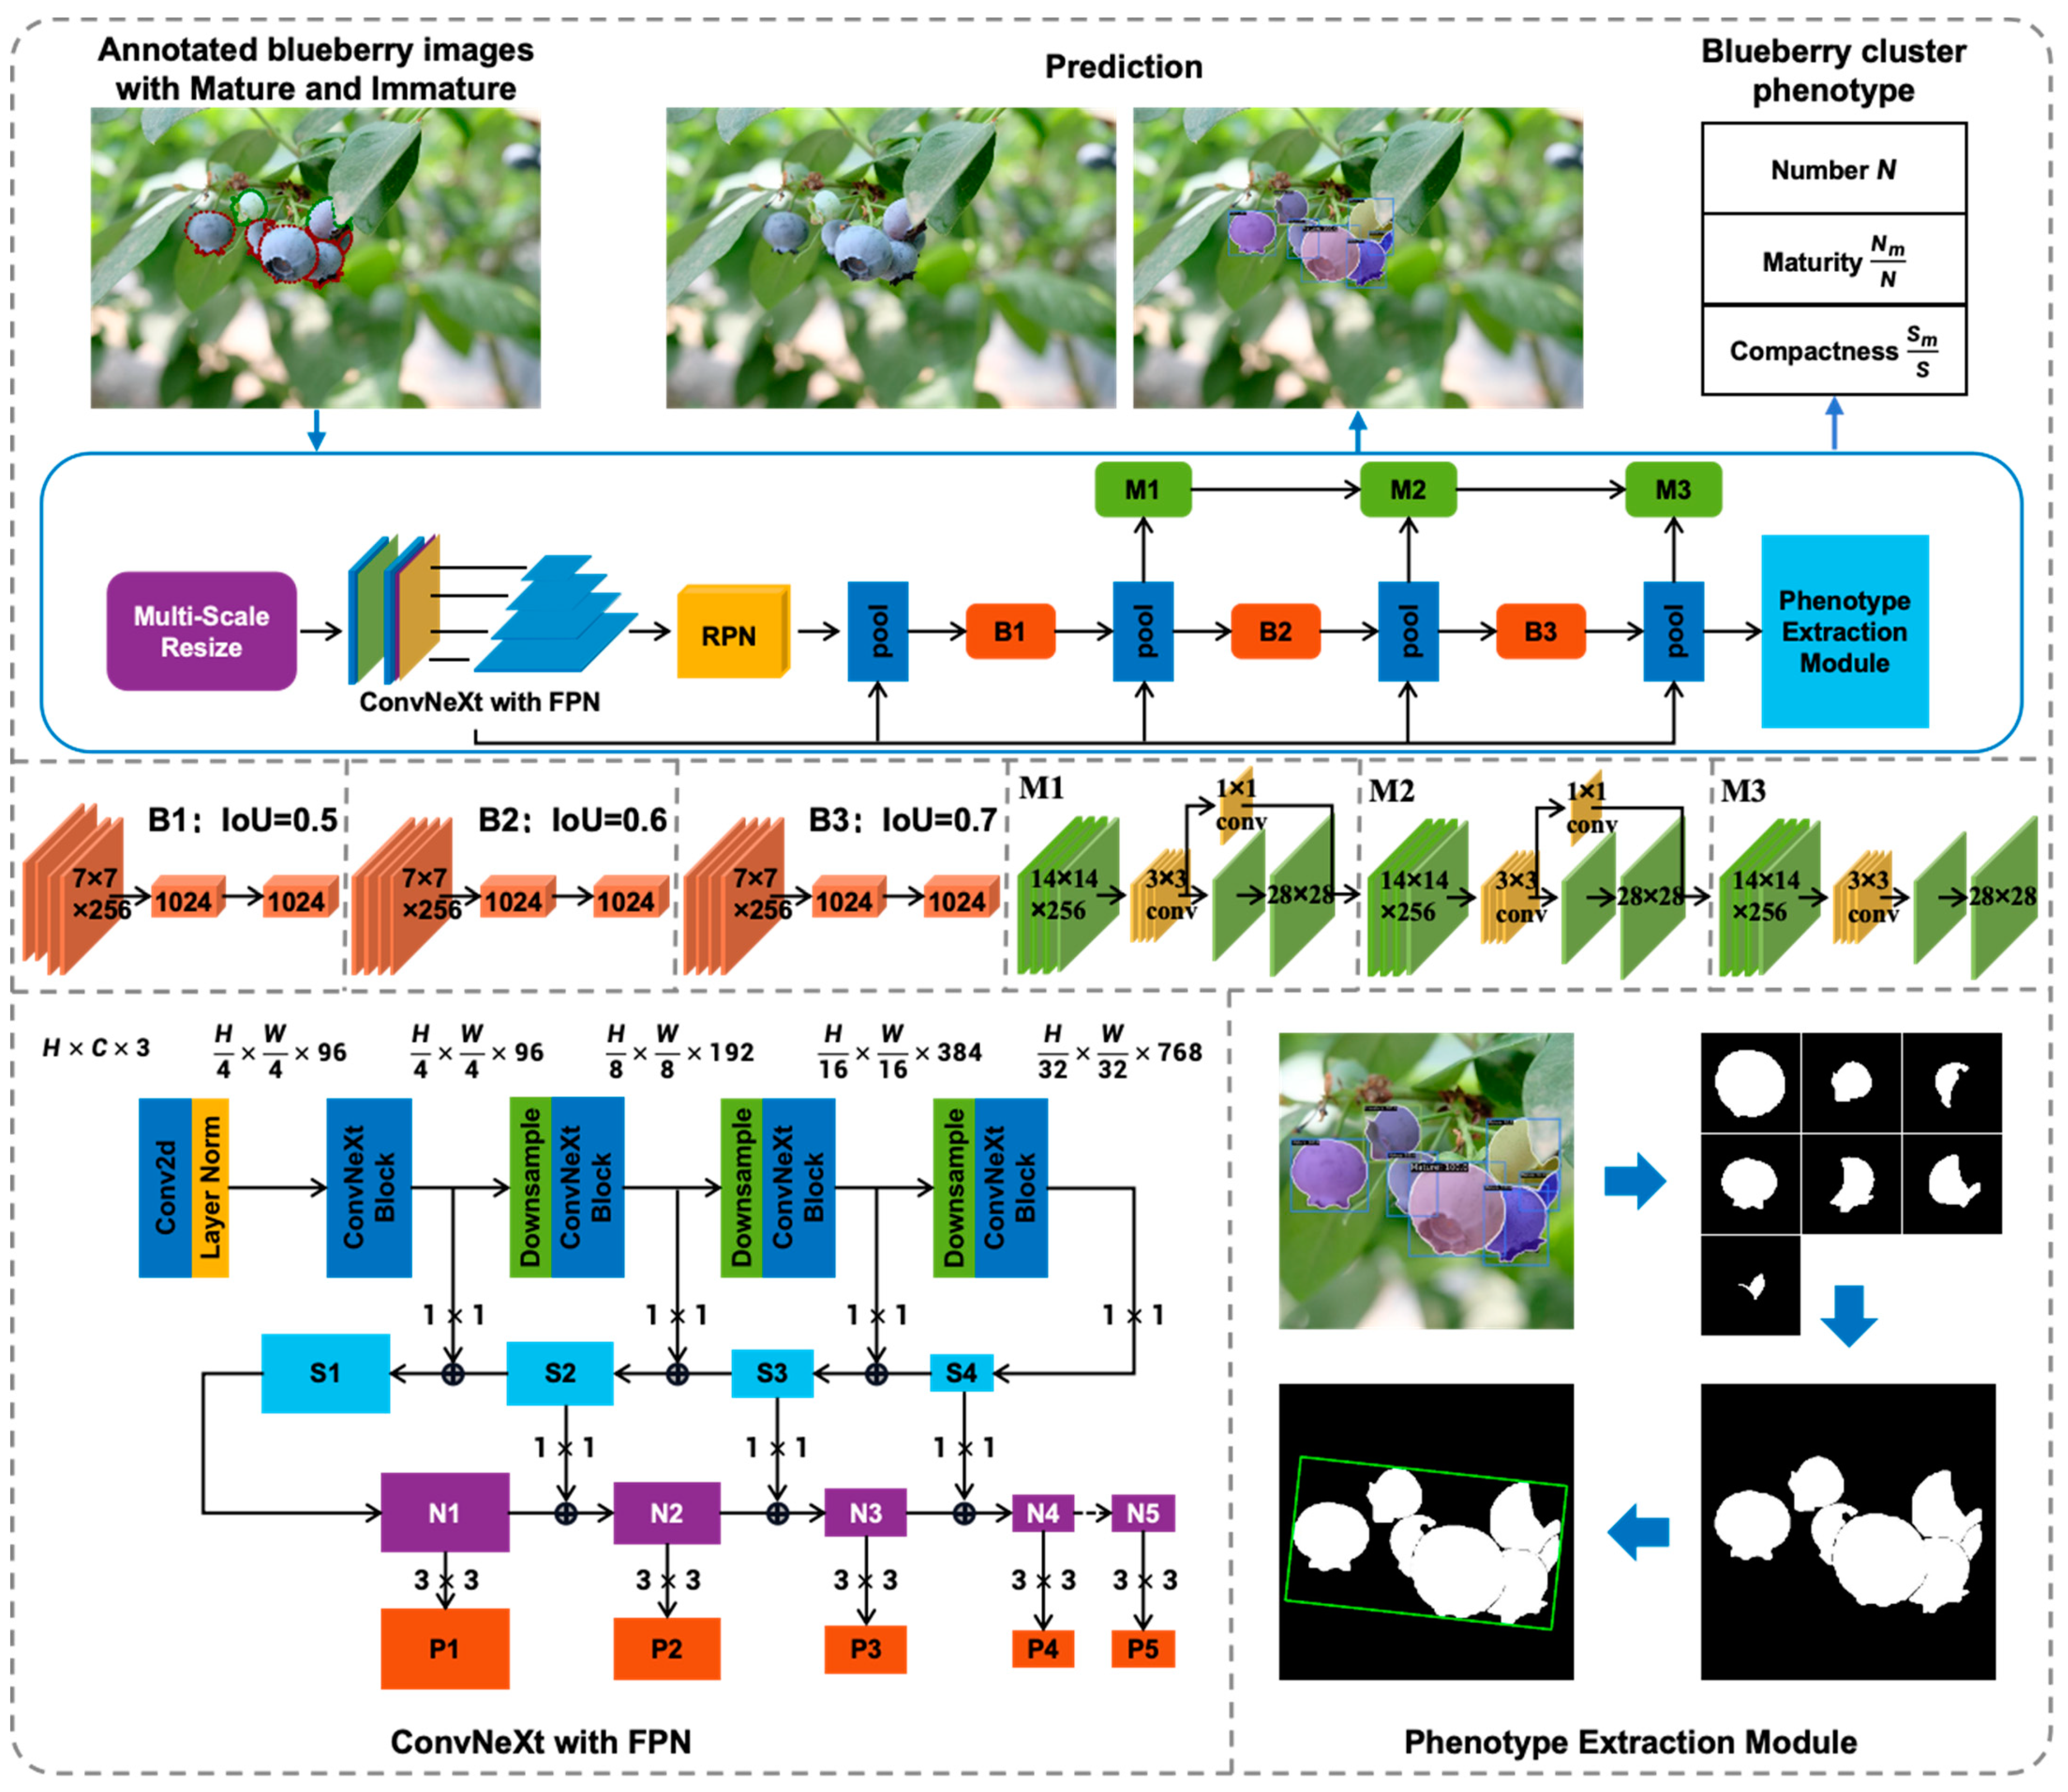
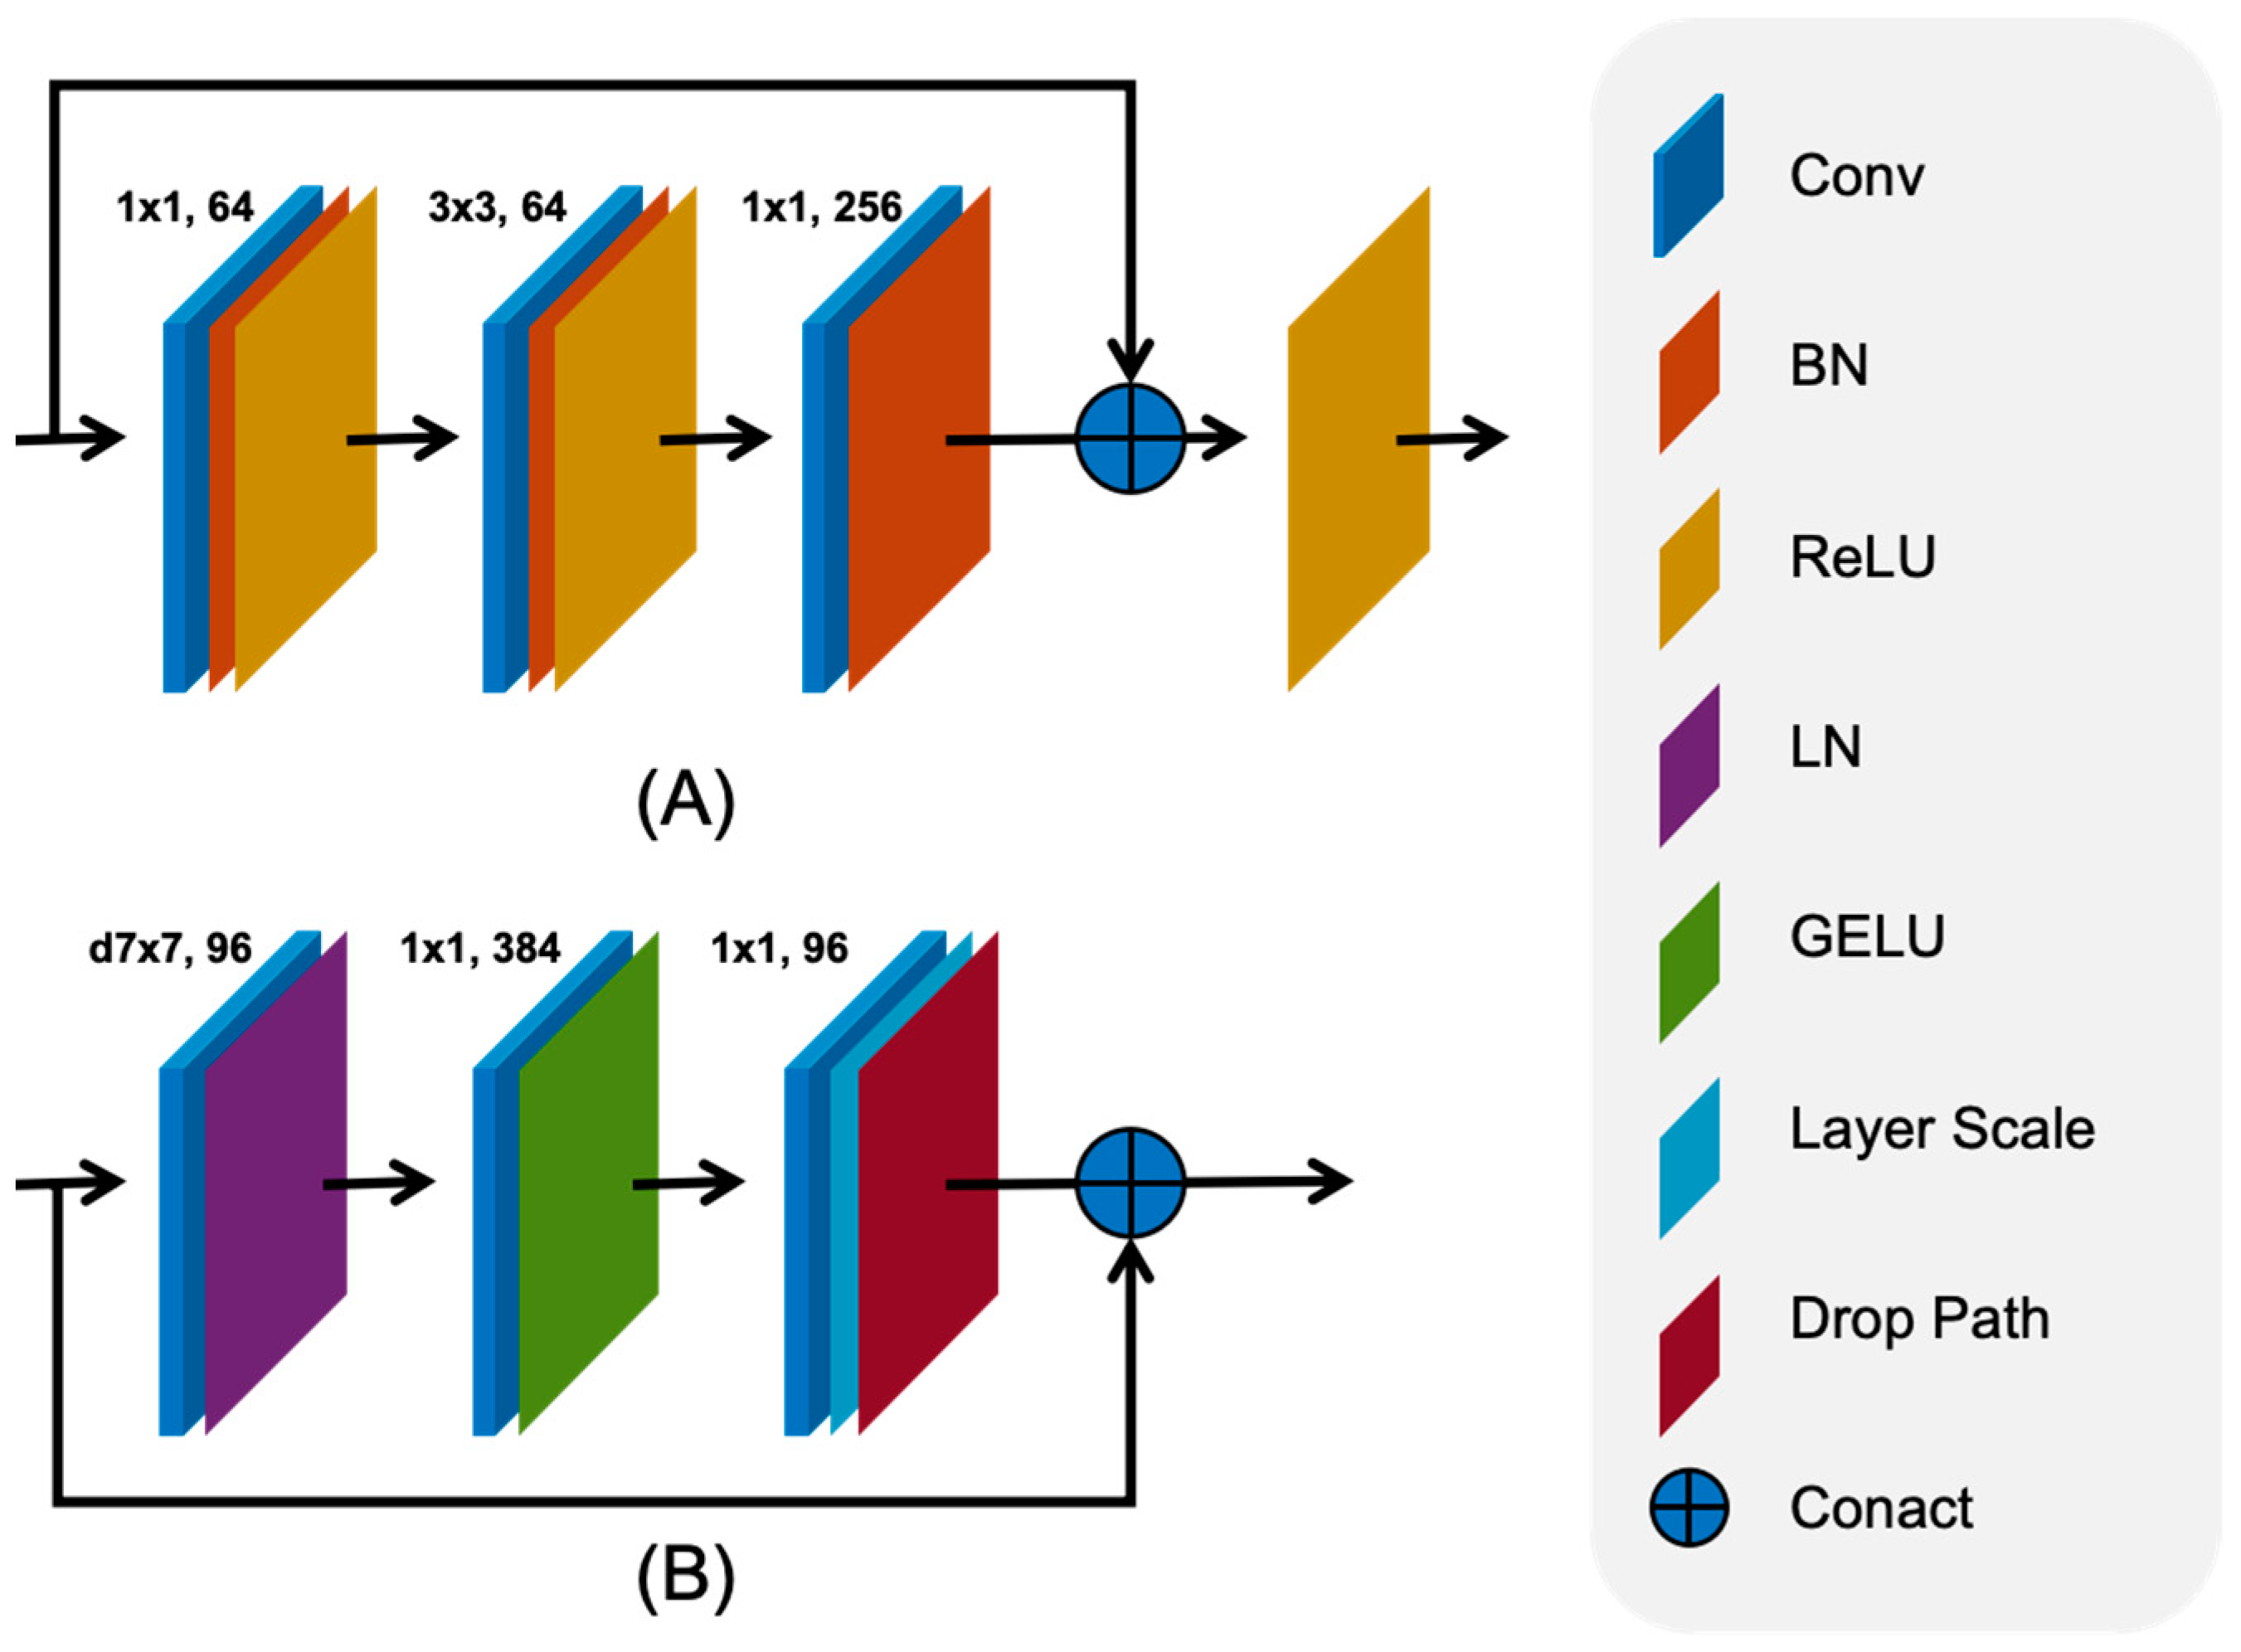
Aiming at the problem of low accuracy of blueberry detection under severe occlusion, we adopt the ConvNeXt [27] backbone, hybrid cascade structure, and multi-scale training to strengthen the feature extraction capability and realize the accurate segmentation of blueberry fruits.
(2)
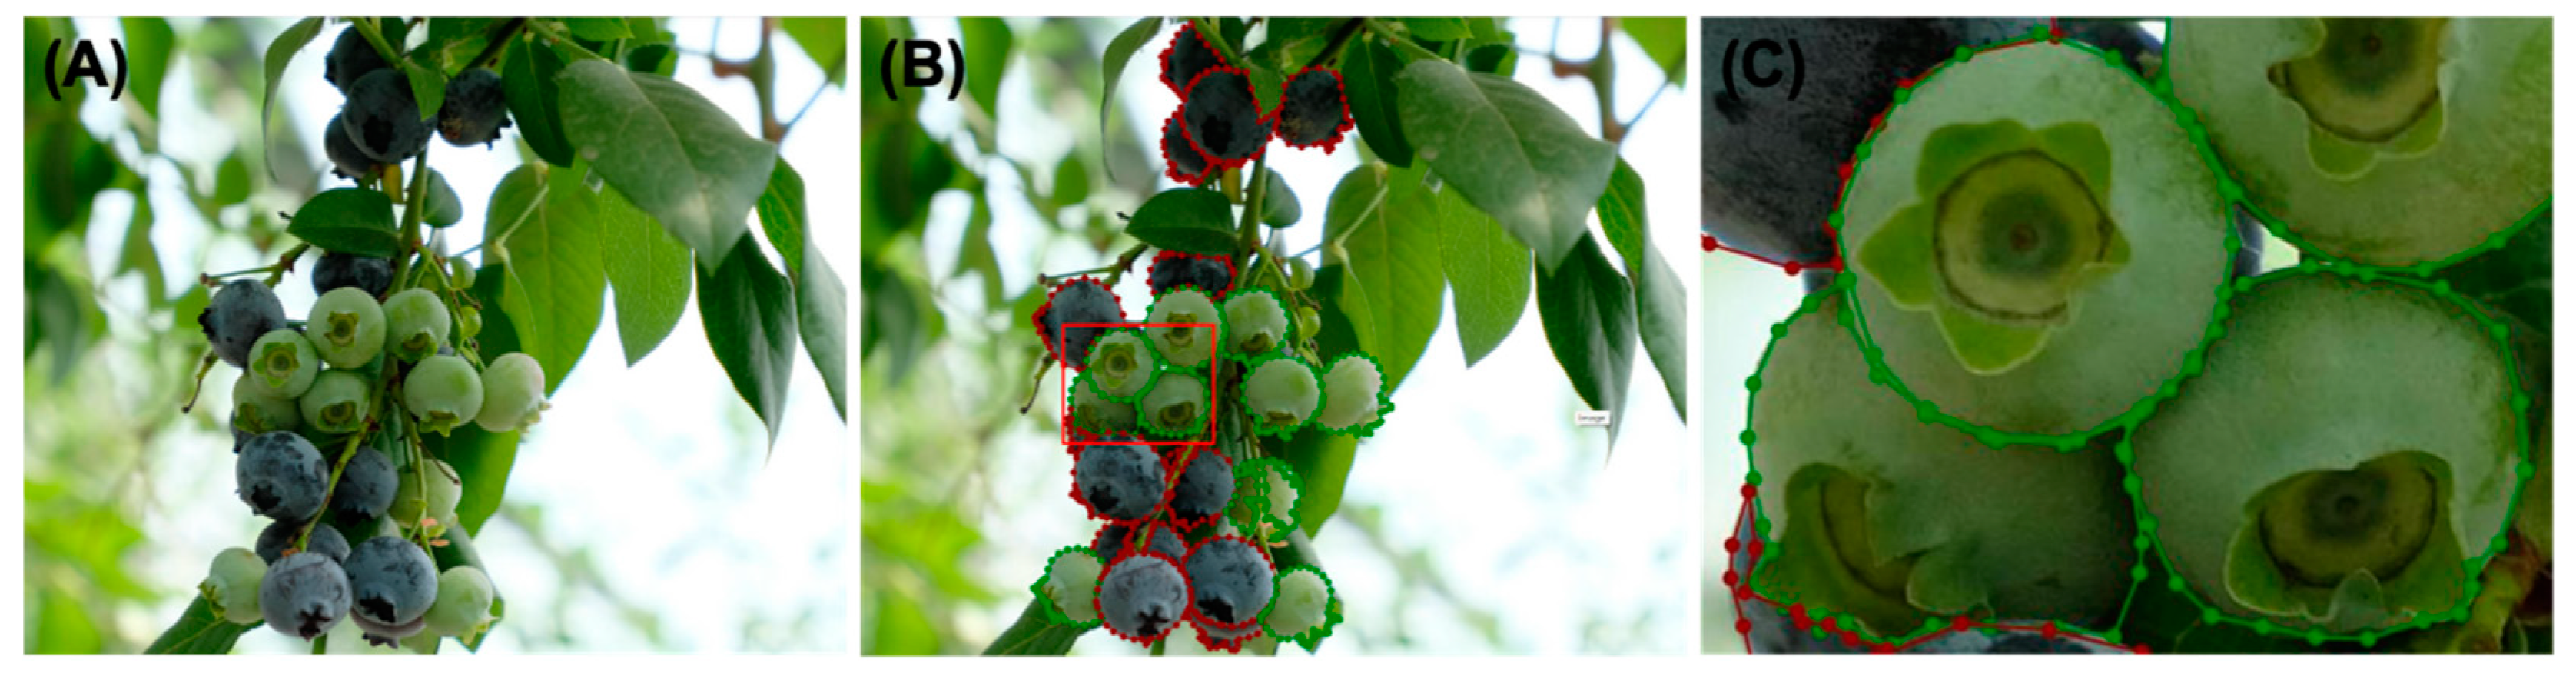
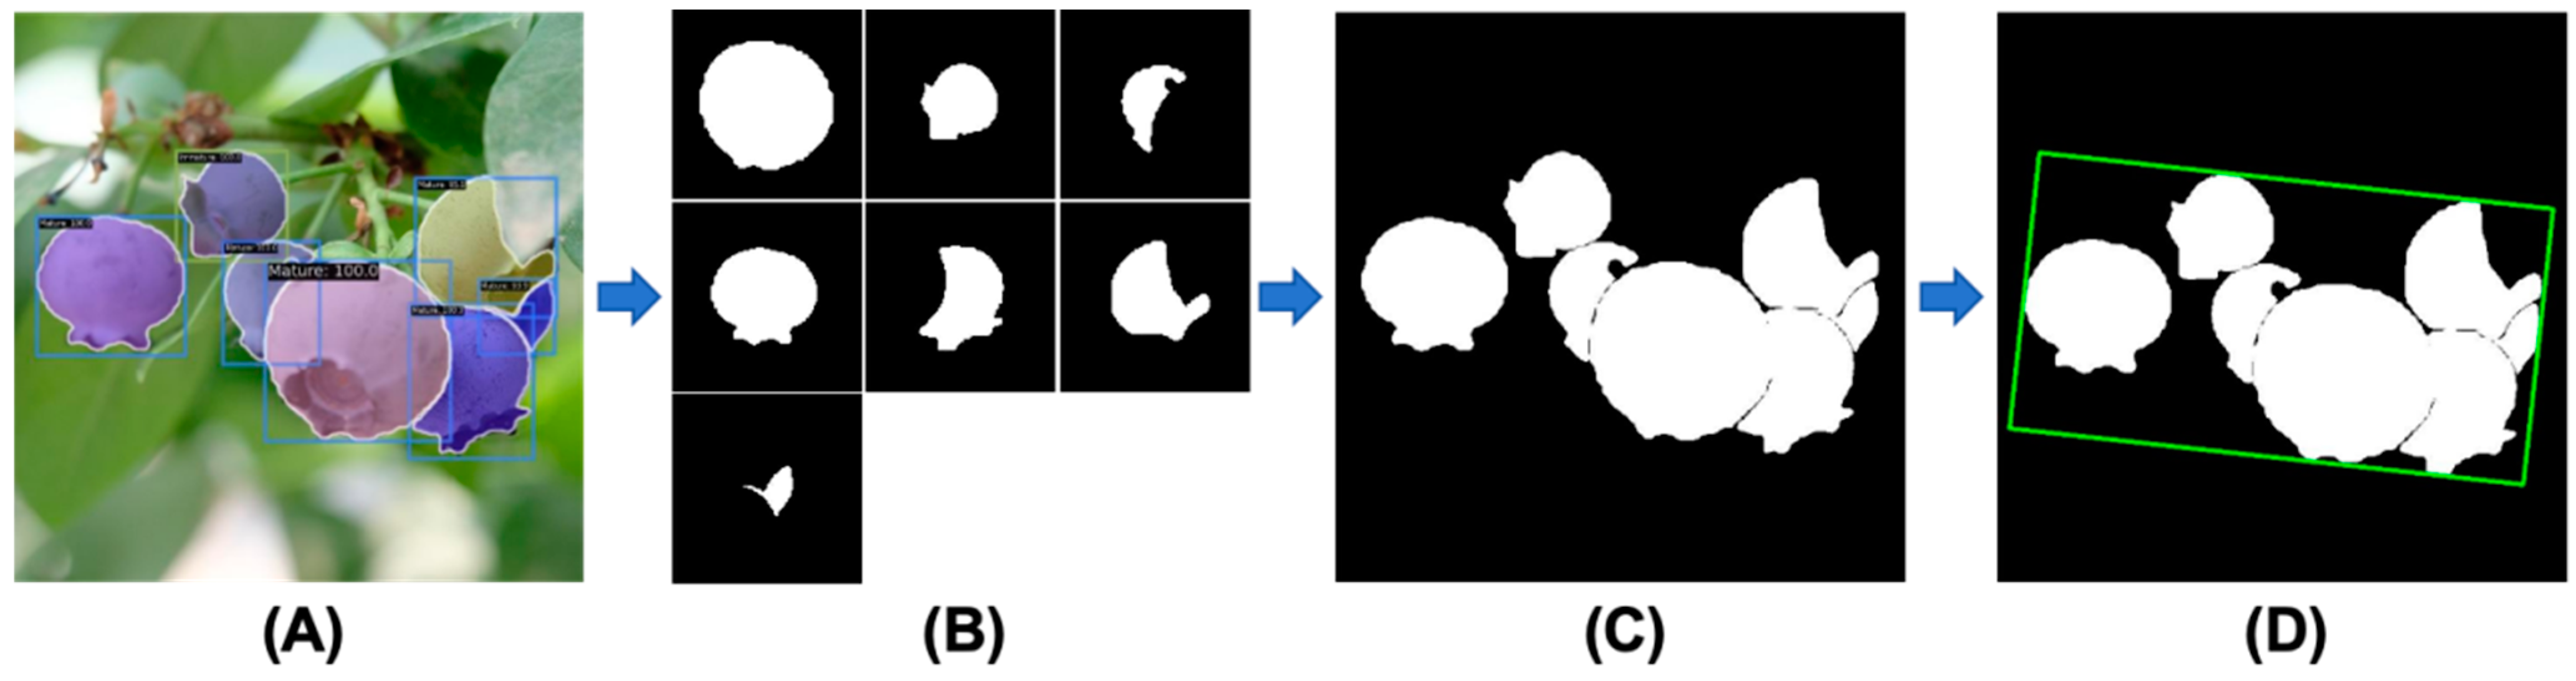
Combining contour detection, convex packet algorithm, and rotary caliper technology to design algorithm modules to realize the automatic extraction of the number of fruits, ripeness, and compactness within blueberry clusters.
(3)
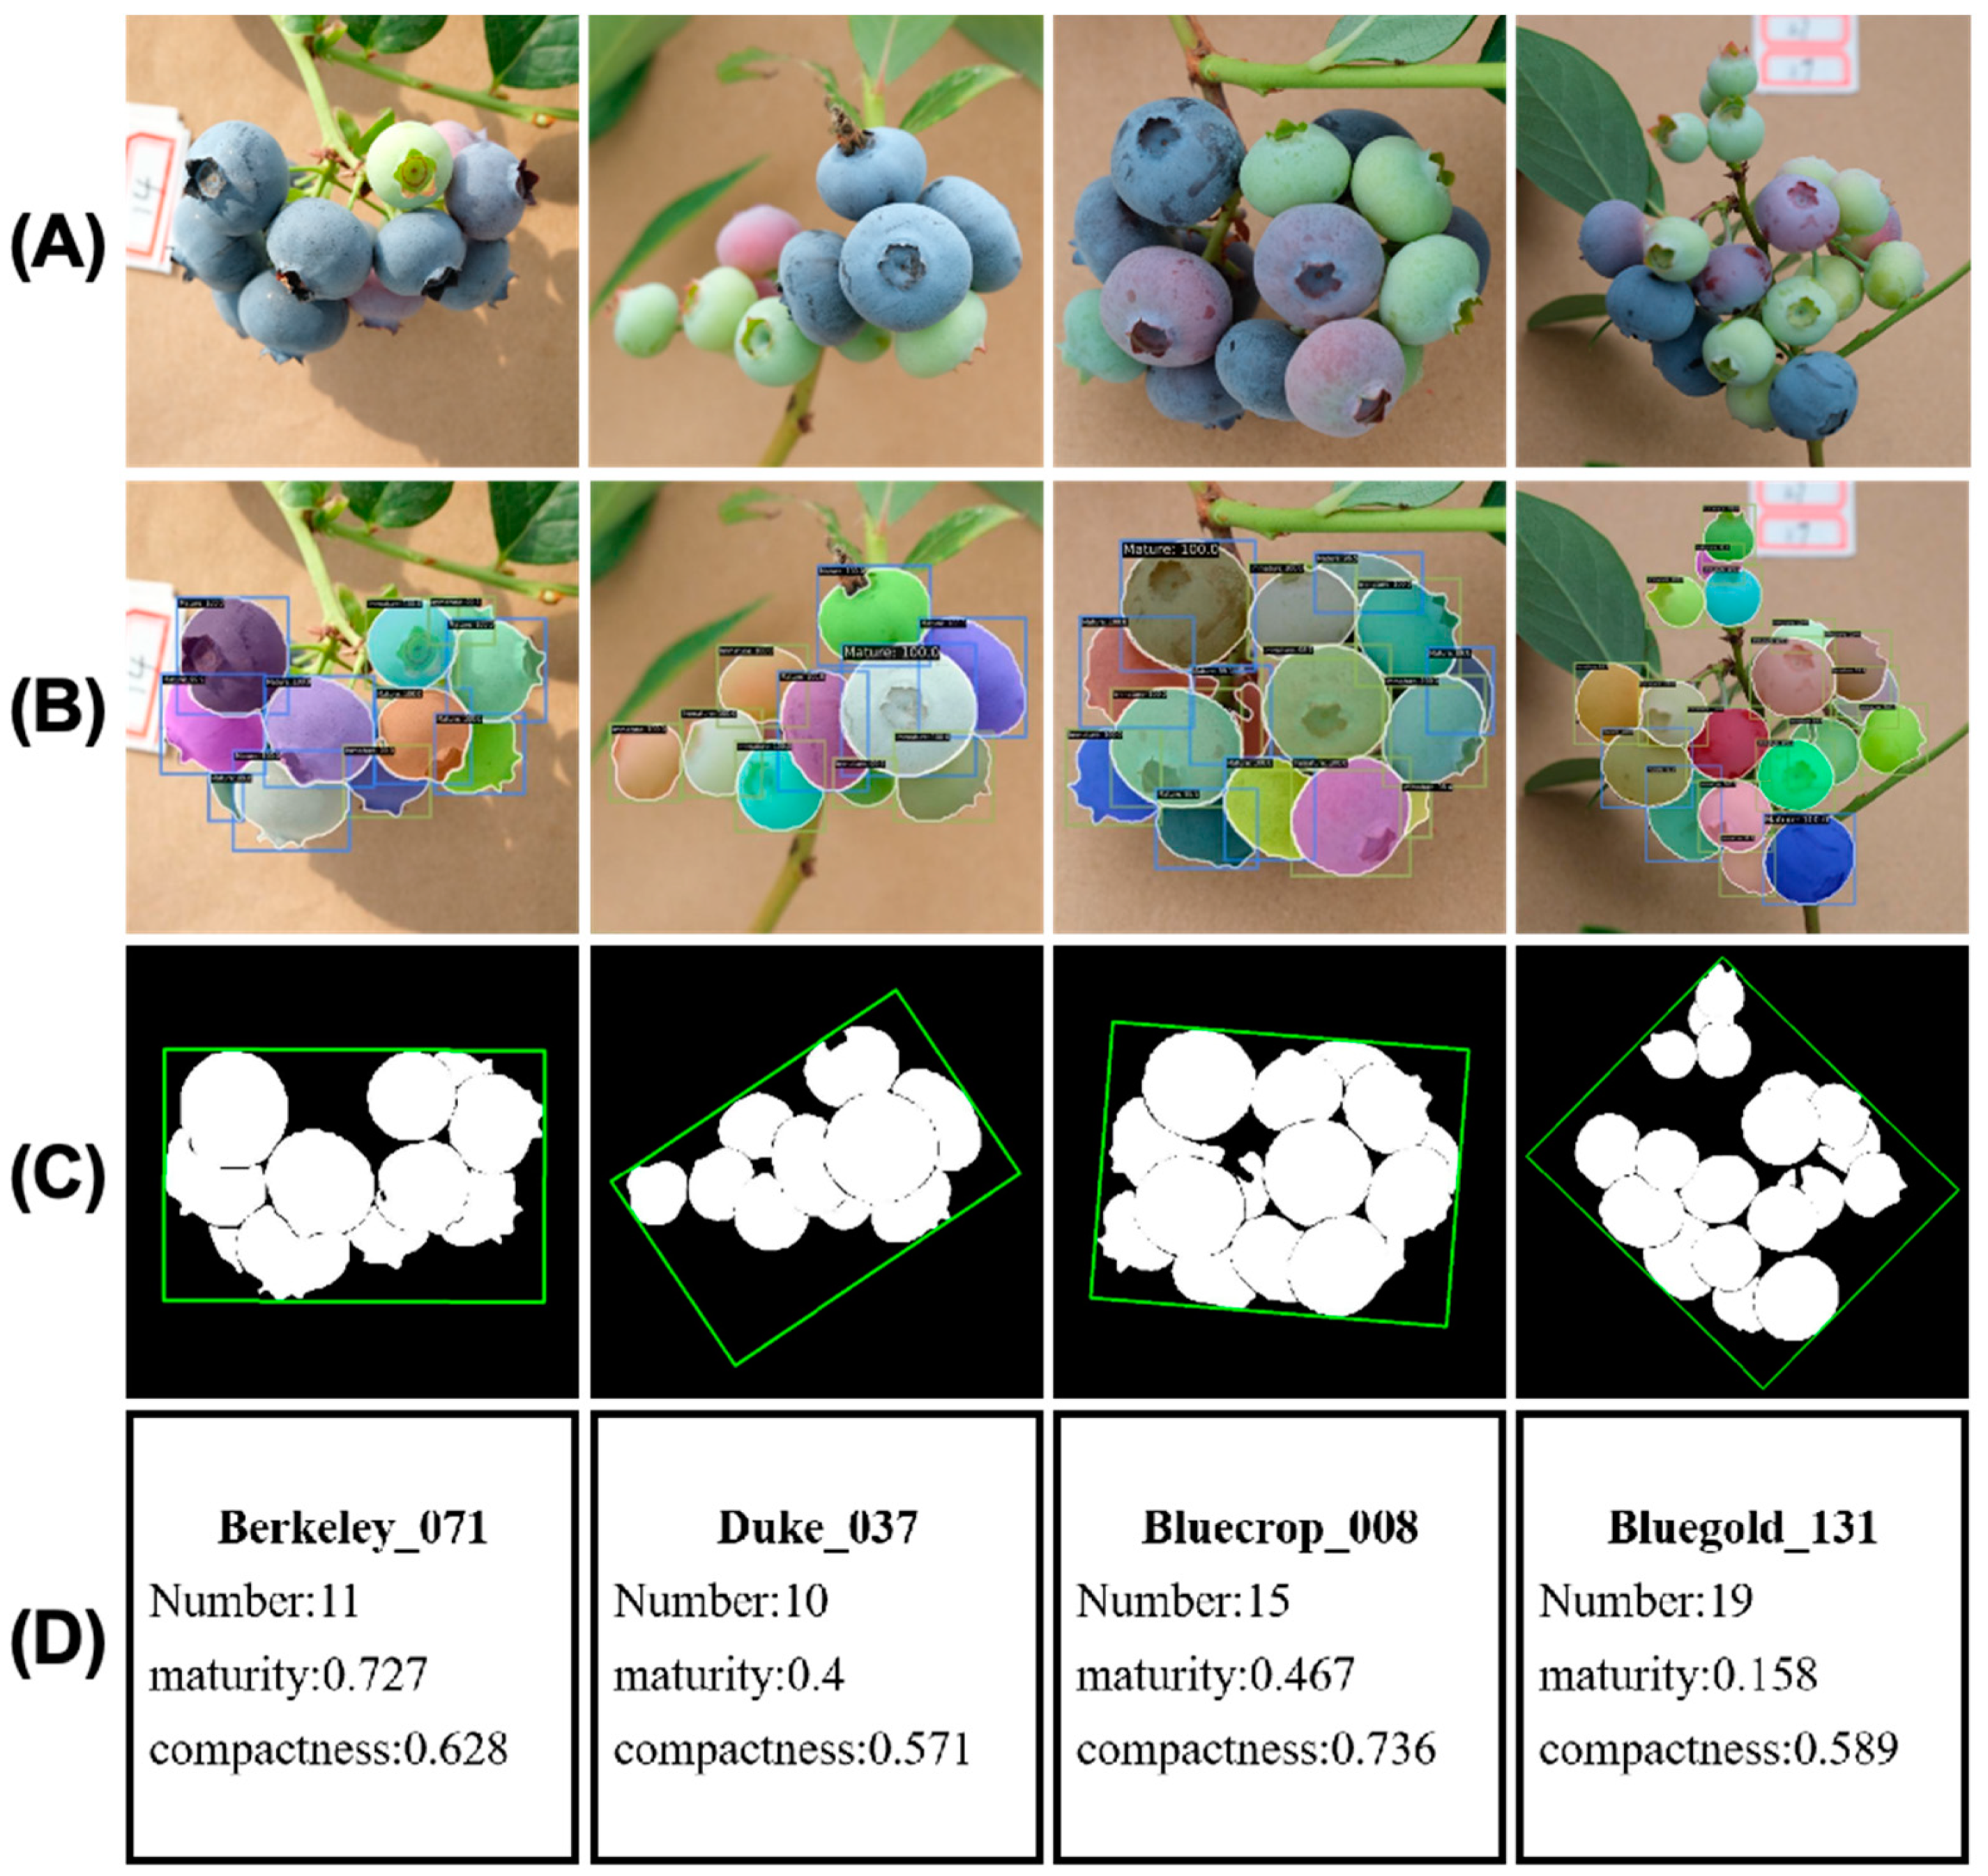
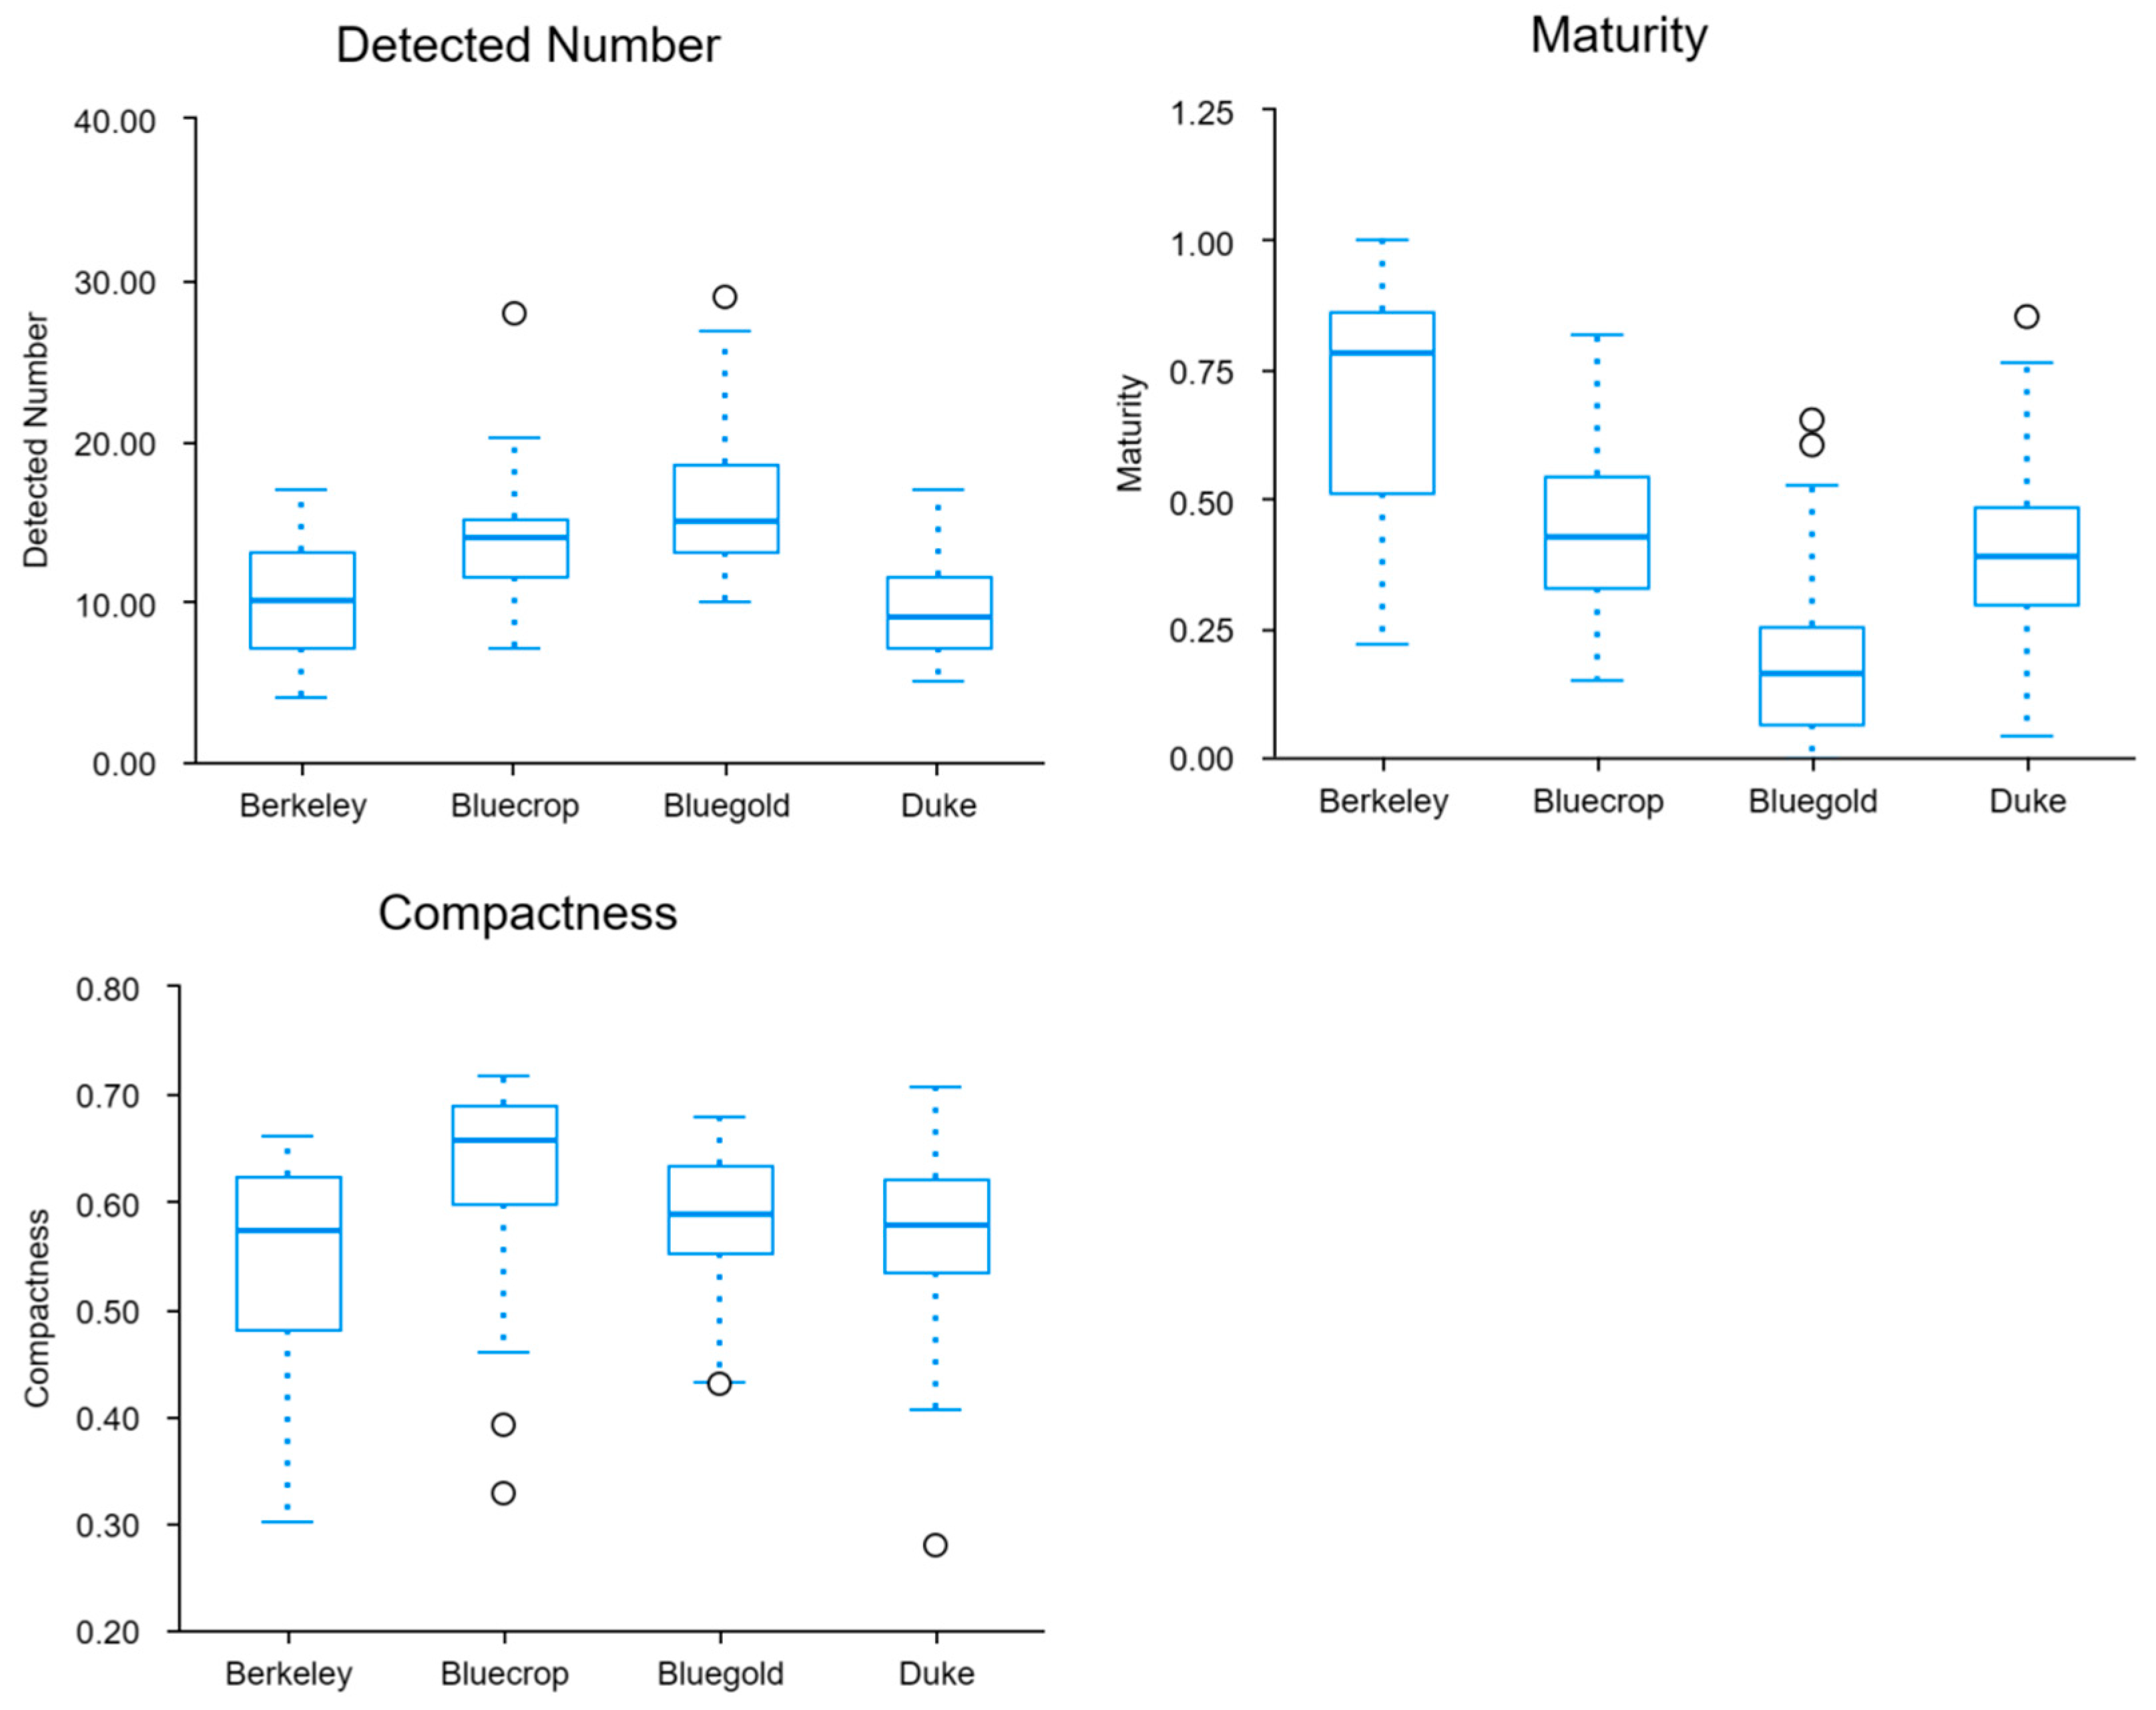
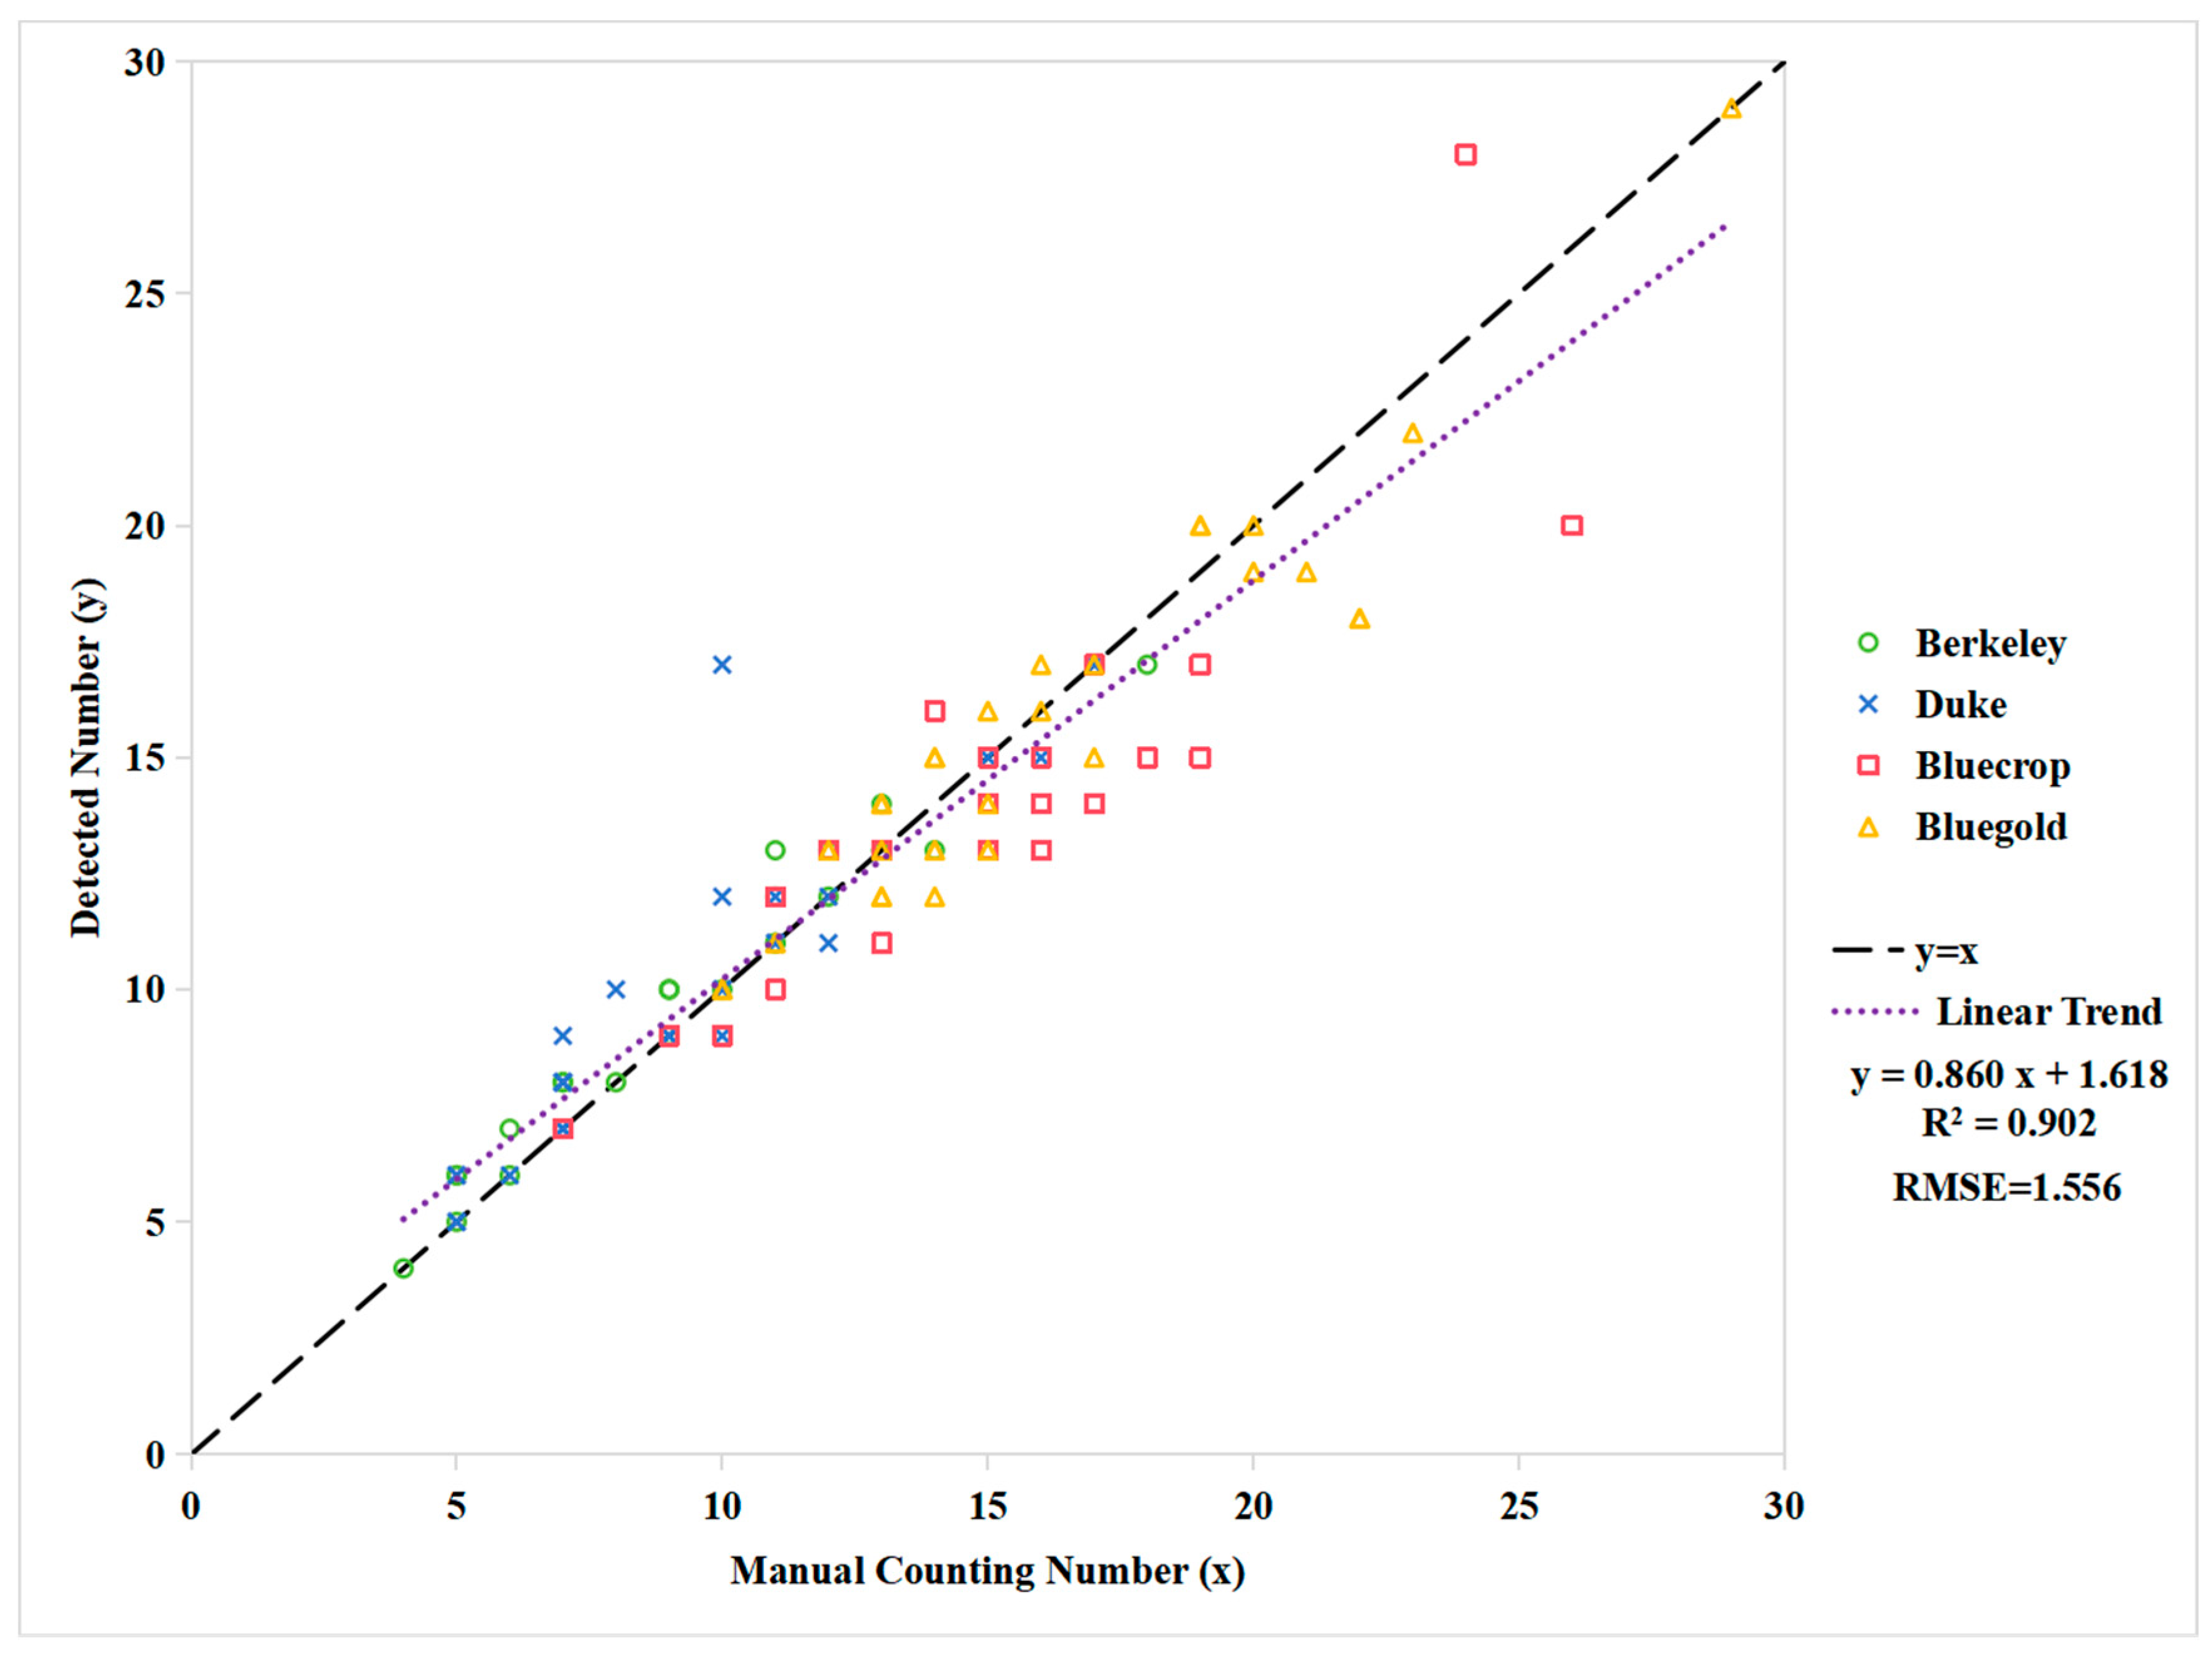
Use HPPEM to extract cluster phenotypes of four varieties of blueberries, compare the trait differences between different varieties, and analyze the detection error and quantity extraction error.

2. Materials and Methods

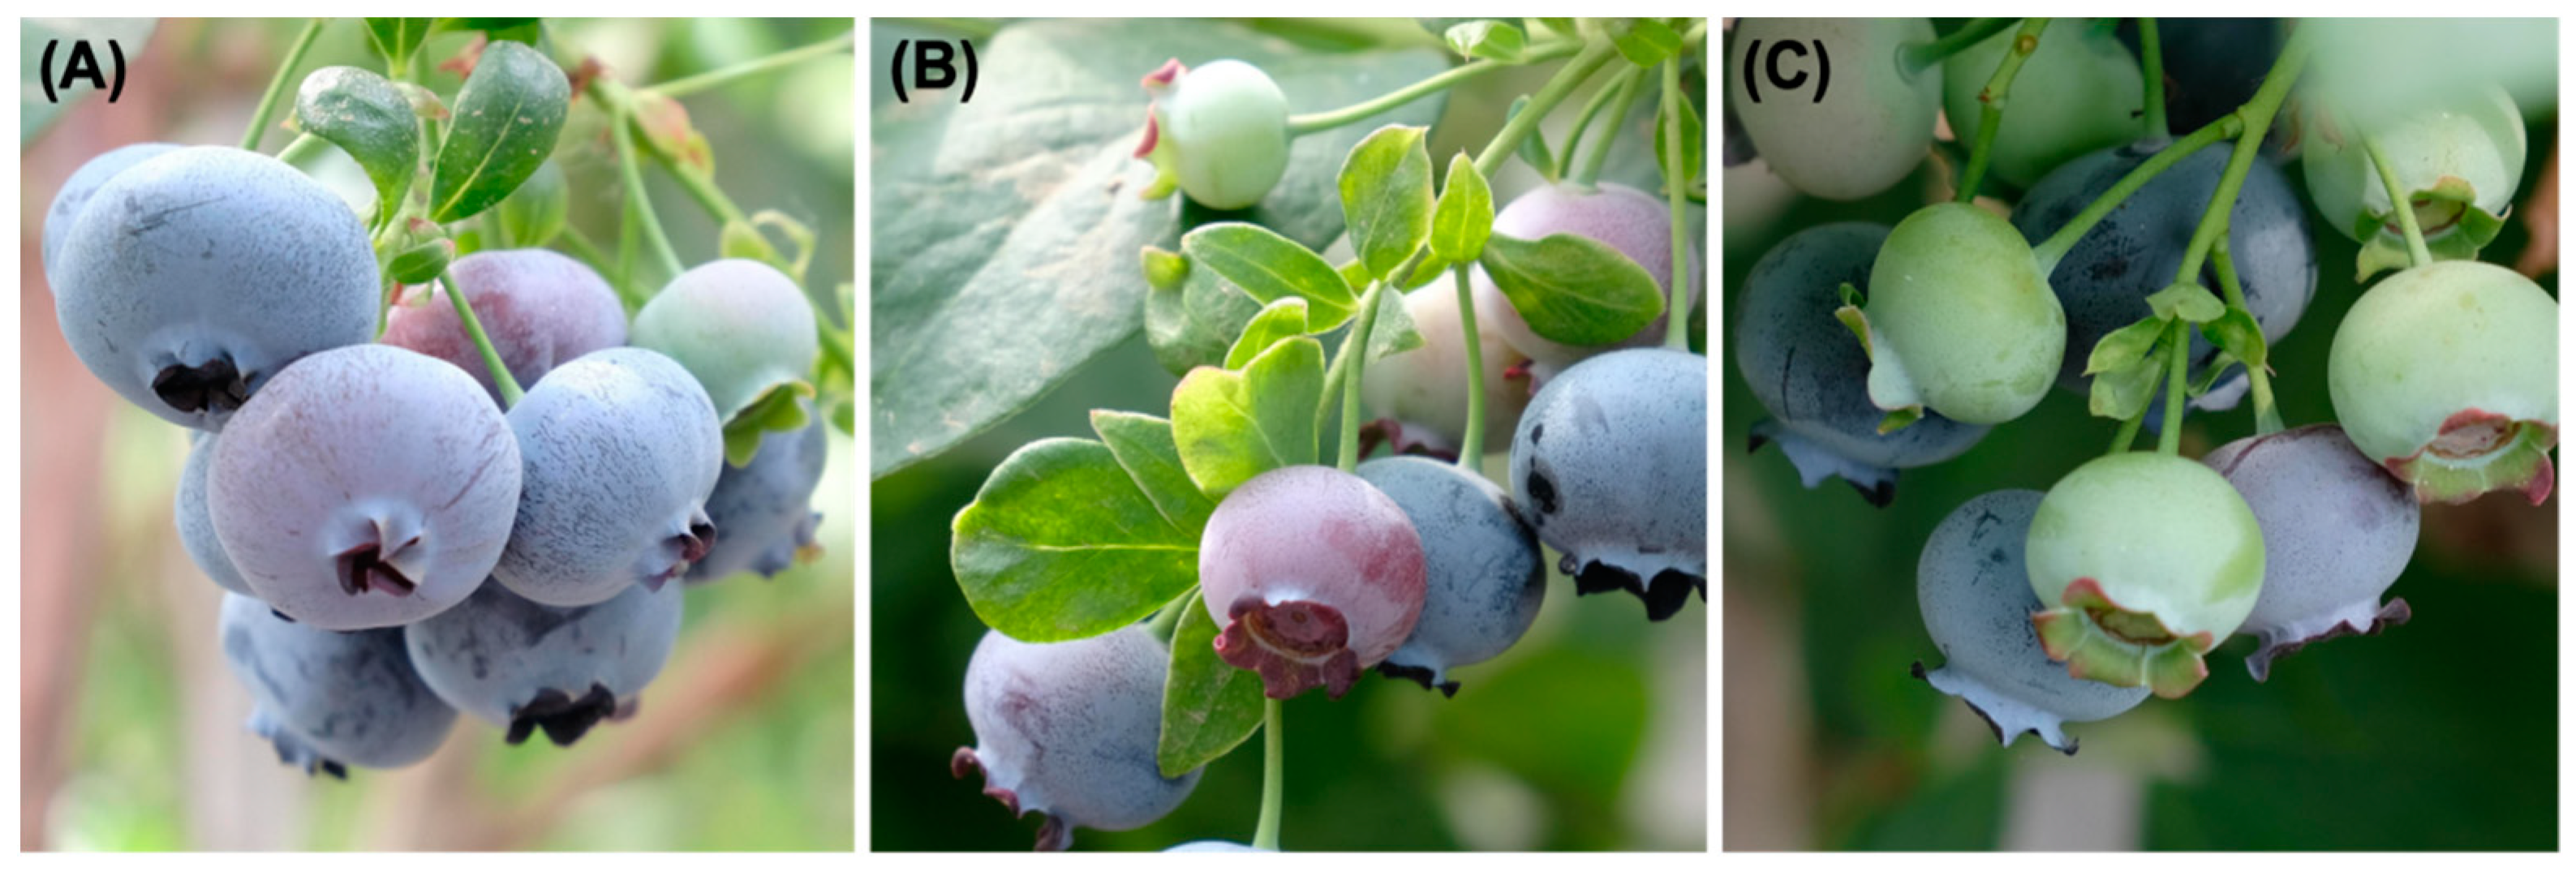
2.1. Data Collection

In June 2023, we collected images of different blueberry varieties from the field at a commercial blueberry farm in Jinzhou District, Dalian City, Liaoning Province, China. We used a digital SLR camera (Fujifilm X-S10, Tokyo, Japan) with a resolution of 6240×4160 pixels to capture the images at different times (09:00–16:00). The object distance was approximately 1–2 m. The captured images of blueberries were categorized into two types: (1) natural background under outdoor light (Figure 1A), and (2) artificial background (brown filet bag) under outdoor light (Figure 1B).
Occlusion of blueberry fruits in images is a serious problem because blueberry fruits grow in clusters and different fruits within the same blueberry cluster are very close to each other. This includes various cases such as fruits occluding each other (Figure 2A), fruits being occluded by leaves (Figure 2B), and fruits being occluded by branches (Figure 2C). Although the occlusion problem greatly increases the difficulty of segmentation, it is consistent with the real blueberry growth situation and helps to improve the robustness of the model.
The high complexity of images makes manual annotation a great challenge. We use the image annotation tool LabelMe [28] (v5.2.1) for image annotation. Figure 3 illustrates the image annotation process described in this paper. To ensure a high-quality annotated dataset, the images were magnified approximately twice or more, and the boundaries of each blueberry were delineated manually using polygonal contours. The annotations are divided into two categories: mature blueberries and immature blueberries. The blue-violet fruits were labeled as mature blueberries and the green, red, or crimson fruits were labeled as immature blueberries. Our team has dedicated substantial effort to the labeling process, and we anticipate that this dataset will facilitate more comprehensive blueberry phenotyping endeavors. These labeled images were used in model training to calculate losses and optimize model parameters. The dataset consists of 707 images, including 508 images in the training set (466 natural backgrounds and 42 artificial backgrounds), 128 images in the validation set (118 natural backgrounds and 10 artificial backgrounds), and 71 images in the test set (62 natural backgrounds and 9 artificial backgrounds).
In addition, in order to compare and analyze the differences in phenotypic traits of blueberry clusters from different varieties, images of four blueberry varieties (Berkeley, Duke, Bluecrop, and Bluegold) were captured and datasets were created. The image dataset consisted of 580 images with 29 blueberry clusters per variety, and 5 views (360 degrees) were taken of each blueberry cluster. All images were taken with an artificial background (brown paper bag) to avoid interference from other blueberries in the environment, and the number of blueberry fruit was manually recorded while the images were taken in order to later evaluate the model extraction effect. Figure 4 shows five views of one blueberry cluster from each species. It can be seen that the Berkeley variety has the loosest clusters while the other three varieties have relatively firm clusters.

2.2. HPPEM

We constructed a high-precision blueberry cluster phenotype extraction model (HPPEM), a novel cascade architecture for instance segmentation and automatic extraction of fruit number, ripeness, and compactness, based on hybrid task cascade (HTC) by enhancing feature extraction, improving the network structure, adding direct information flow, and designing a specific phenotype extraction module. HTC, a cutting-edge two-stage image instance segmentation algorithm, employs a robust cascade structure to boost performance across multiple tasks, addressing the challenge of inadequate information flow among mask branches at distinct stages in Cascade Mask RCNN. HTC successfully incorporates the cascade idea into instance segmentation tasks by interweaving the detection and segmentation steps in order to achieve joint multi-stage processing, and demonstrated excellent performance on the COCO dataset [29]. HPPEM (Figure 5) cascades three Mask R-CNN networks. The mask branches were made to utilize the updated bbox information by interleaving the box and mask branches (arrow of pool pointing to Mi in Figure 5). In blueberry fruit instance segmentation, bbox information holds significant importance. When the bbox identifies two adjacent fruits as one object, segmentation becomes challenging. Hence, the integration of box and mask branches facilitates more precise blueberry fruit segmentation. Direct information flow has been incorporated between mask branches to maximize the utilization of mask features obtained from the preceding stage (the arrow of Mi pointing to Mi+1 in Figure 5). Enabling direct information flow enables the model to assimilate a broader spectrum of multi-scale details from intricate images, thereby enhancing the precision of blueberry fruit segmentation.

2.2.1. Feature Extraction

The initial hybrid task cascade leverages ResNet for feature extraction. Yet, with the swift advancement of the transformer in image processing, the conventional residual network is gradually supplanted or enhanced by the attention mechanism. While maintaining the original CNN structure, the ConvNeXt network is derived, adjusting stage calculation ratios, activation functions, data processing methods, and network structures, drawing insights from the design of Swin-Transformer.
As shown in Figure 5, the model uses ConvNeXt as the backbone network for feature extraction. The concept of group convolution is introduced, alongside the utilization of depth-separable convolution, which offers benefits such as fewer parameters and reduced computational load compared to the standard convolutional calculations of ResNet. Additionally, the incorporation of the inverse bottleneck layer structure enhances the overall model performance while partially decreasing the model parameter size. A large convolutional kernel is used for 7 × 7 convolutional operations, GELU is used as the activation function, BN in the residual network is replaced with LN, and one LN is added before and after downsampling and after global mean pooling to maintain the stability of the model. Figure 6B illustrates the specific ConvNeXt Block.
In order to maximize the performance of the ConvNeXt network and adapt it to the needs of HTC, we have made some specific adjustments and improvements to ConvNeXt. First, to balance performance and computational resources, we use ConvNeXt’s tiny architecture as the backbone network and choose appropriate Drop Path rate and layer scale initialization values to improve regularization and stability. Second, HTC relies on a feature pyramid network (FPN) to handle multi-scale features. Therefore, it is necessary to integrate the FPN structure on top of ConvNeXt. Multiscale feature maps suitable for FPN inputs are generated by adjusting the outputs of each layer of ConvNeXt, specifying the output levels as [0, 1, 2, 3] and matching the corresponding number of output channels [96, 192, 384, 768]. These improvements allow ConvNeXt to be more effectively combined with FPN to handle multi-scale features and improve the overall performance of the model.

2.2.2. Multi-Scale Training

The input size of an image has a significant impact on model performance. Our dataset covers images taken at a variety of shooting distances and angles, with images of blueberries of varying sizes and many with only a small portion of the blueberry visible due to occlusion issues. These blueberries are labeled as ground truth to better approximate the actual situation. Due to the small feature maps generated by the network relative to the original image, the model struggles to capture the features of the blueberry fruits, resulting in failure to detect them. Such an approach could potentially hinder model performance. To address this challenge, we adopted a multi-scale training strategy. This method predefines multiple fixed scales and randomly selects one for training during each training cycle.
Recent studies [30] have shown that a set of modern training techniques can significantly improve model performance. We borrow a training technique from the transformer architecture [31] and set up a list of scales as shown in Table 1. The short side is randomly sampled from between 480–800, and the long side is fixed to 1333. A scale is randomly selected from this list for each iteration during training. This enhanced training method effectively improves the performance of our model and increases the accuracy of the model under different target sizes.

2.2.3. Phenotype Extraction Module

This module realizes automatic extraction of blueberry cluster phenotypic information by parsing the results of instance segmentation, obtaining the scores, labels, and counts of all instances in the image, calculating the number of mature and immature fruits, the area of the cluster mask and the area of its smallest rotated outer rectangle, and then calculating the number of fruits, maturity, and compactness within the clusters. Among them, cluster maturity was defined as the ratio of the number of mature fruits (Nm) to the total number of fruits in the cluster (N), and cluster compactness was defined as the ratio of cluster mask area (Sm) to the minimum rotated outer rectangular area of the cluster (S).
c l u s t e r m a t u r i t y = N m N
c l u s t e r c o m p a c t n e s s = S m S
The calculation process of cluster mask area and minimum rotated outer rectangle area is shown in Figure 7. The mask matrix is obtained by performing Run-Length Decode on the counts value in the segmentation result. The matrices of all instances in the image are merged, and the binary conversion is performed on the merged matrix using threshold to obtain the binary map. Contour detection and contour merging are performed on the binary map. The Sklansky algorithm is used to find the convex packet of the contour point set and the rotating calipers algorithm is used to find the minimum outer rectangle of the convex packet. Count the number of pixels in the cluster mask and the minimum rotating outer rectangle of the cluster, respectively. Since the minimum rotating outer rectangle is rotationally invariant and its area does not change due to the rotation of the graph, the compactness values extracted from its area are consistent.

2.3. Evaluation Metrics

We use F1-score and average precision (AP) to evaluate the performance of the model. F1-score is the reconciled average of precision and recall. It provides a more comprehensive assessment of model performance by combining precision and recall and is an effective metric for evaluating the performance of classification models. Average precision, which is the area under the precision (P)-recall (R) curve, is now the most commonly used metric due to its simplicity and representativeness. Average precision is calculated using the rubric (Equation (7)) from the coco dataset [29] by interpolating each value of recall to obtain maximum precision. A high AP value indicates a model achieving both high precision and recall levels. The performance of the model was evaluated using the average precision at IOU = 0.5 and IOU = 0.5 to 0.95, which are common thresholds used by researchers to evaluate instance segmentation models. The definitions of each evaluation metric are as follows:
P r e c i s i o n = T P T P + F P
R e c a l l = T P T P + F N
F 1 s c o r e = 2 × P r e c i s i o n × R e c a l l P r e c i s i o n + R e c a l l
p i n t e r p ( r n + 1 ) = max r ~ : r ~ r n + 1 p ( r ~ )
A P = n = 0 ( r n + 1 r n ) p i n t e r p ( r n + 1 )
I o U ( A , B ) = | A B A B |
where TP indicates the correct detection of blueberry fruit, FP is the wrong detection of blueberry fruit, and FN represents the ground truth of blueberry fruit not detected. Precision indicates the proportion of blueberry fruits identified by the model that are actually genuine blueberries, while recall signifies the proportion of all actual blueberry fruits detected by the model. p ( r ~ ) represents the precision measured at a recall rate of ( r ~ ) . IOU refers to the intersection over union ratio between two bounding boxes, where A denotes the manually labeled bounding box and B denotes the model-generated bounding box.

3. Results

3.1. Experimental Results

This paper employed the PyTorch (v2.0.1) deep learning framework for data analysis, utilizing an Intel(R) Core(TM) i9-10900k (Intel, Santa Clara, CA, USA) processor, accompanied by a 64 GB RAM, and a NVIDIA GeForce RTX 3090 (NVIDIA, Santa Clara, CA, USA) graphics card for the modeling process. The model achieves an AP of 0.974 and 0.975 for bbox and mask on the test set, respectively, which indicates that 97.4% of the bboxes and 97.5% of the masks in the test dataset match the real situation.
The trained model was used to detect and segment blueberry fruits and extract phenotypic traits (number of fruits within the cluster, cluster maturity and cluster compactness). Figure 8 shows the experimental results of four test images from one blueberry sample from each of the four varieties (Berkeley, Duke, Bluecrop, and Bluegold), and the results show the blueberry fruit bounding box, the mask, the smallest rectangular box enclosing the cluster, and the phenotypic metrics. The bounding box and mask accurately labeled the blueberry fruit, including some that were heavily shaded. The number of fruits detected in Berkeley_071 and Duke_037 were both one less than in the original image, and the two undetected fruits had severe occlusion problems, with the visible portion being extremely small and very similar to the occluded object. The number of fruits detected in Bluecrop_008 and Bluegold_131 was the same as in the original image. All fruit ripeness was correctly detected. For the compactness metrics, although there were no real data to assess the accuracy of the values extracted from the images, the differences in compactness among the four varieties were consistent with our visual observations.
We used HPPEM to phenotypically extract 116 clusters (580 images in total) of the 4 blueberry varieties collected. All phenotypic metrics were extracted using five different viewpoint images of each blueberry cluster, where the maximum of the five viewpoints was used for the number of fruits within the cluster, and the average of the five viewpoints was used for cluster maturity and cluster compactness. The average phenotypic metrics for each of the four varieties are shown in Table 2.
Of the four varieties, Bluegold had the highest average number of fruits in the cluster, followed by Bluecrop. Bluecrop had about two fewer fruits than Bluegold. Berkeley and Duke had the lowest number of fruits, averaging about nine. Berkeley had the highest average cluster maturity while Bluegold had the lowest. Duke and Bluecrop had similar maturity levels, both slightly below 0.5, which means that less than half of the fruit was ripe within the cluster. Berkeley had the lowest average cluster compactness and Bluecrop had the highest, which means that Bluecrop had the most compactness between fruits in the clusters and the fruits were less likely to fall off, whereas Berkeley’s fruits were the most likely to fall off. From the above analysis, it can be concluded that Berkeley has the loosest and most ripe fruit in the clusters for harvesting. However, the average of the phenotypic indexes of each variety cannot represent the situation of each blueberry cluster, so we also need to statistically analyze the situation of individuals.
As shown in Figure 9, the box plots show the differences in phenotypic metrics among the four blueberry varieties. In terms of the number of fruits in the cluster, Bluecrop and Bluegold were significantly higher than Berkeley and Duke, and Berkeley and Duke had similar numbers of fruits. The analysis of cluster maturity showed that Berkeley had the highest maturity, which indicated that there were more blue or dark blue mature fruits in the clusters, while Bluegold had the lowest maturity, and Bluecrop and Duke had similar fruit maturity. In terms of cluster compactness, Bluecrop had the highest compactness, Berkeley had the lowest compactness while Bluegold and Duke had similar compactness, which indicated that Berkeley had the loosest fruit in the clusters, which made it easier to dislodge the fruit during harvest and facilitated selective harvesting of the mature fruits, making it suitable for mechanical harvesting.

3.2. Ablation Study

To assess the efficacy of each module in the enhanced method, we conducted an ablation study, as outlined in Table 3. The ablation study tested the effect of a specific module on the overall model performance by removing that module from the model. The results of the experiments show that compared to the baseline model (hybrid task cascade), the AP of both bbox and mask with an IOU of 0.5 improved by 2.6%, the AP of bbox and mask with an IOU of 0.5 to 0.95 improved by 3.5% and 1%, respectively, and the amount of model parameters was reduced by about 16 M. All metrics showed significant improvements. Figure 10 shows the AP changes during model training in the ablation experiments, including the AP changes of bbox and mask for an IOU of 0.5 and for an IOU of 0.5 to 0.95.
Accurate detection and segmentation of blueberries under heavy occlusion is a prerequisite for feature extraction. The initial HTC employed a ResNet combined with a Feature Pyramid Network (FPN) structure for object detection and segmentation. By using the ConvNeXt network instead of the ResNet network, we successfully improved the accuracy of detection and segmentation, with a 1.2% increase in AP for both bbox and mask at IOU = 0.5. This effectively demonstrates that ConvNeXt has significant improvement in blueberry fruit detection and segmentation under occlusion. The mask branch delineates target boundaries, while object detection forms the basis for drawing the object’s mask. The accuracy of subsequent calculations for blueberry cluster area and the smallest rectangular box area heavily relies on the precision of the mask drawing. The AP of mask at IOU = 0.5 and IOU = 0.5~0.95 was significantly improved using the multi-scale training method.

3.3. Comparative Study

Instance segmentation technique possesses the capability to identify image content and location while also distinguishing individuals within the same category, facilitating more precise extraction of phenotypic information. To compare the detection effectiveness of different state-of-the-art algorithms on the blueberry dataset, we tested two-stage instance segmentation algorithms (including Mask R-CNN, Cascade Mask R-CNN [32], and Hybrid Task Cascade [26]), which are the better performers in the current stage, as well as one-stage instance segmentation algorithms (including Yolact [33], SOLOv2 [34,35], CondInst [36], QueryInst [37], Mask2Former [38], and YOLO V8). In each algorithm, we used pre-trained weights and ensured that the experimental environment remained consistent.
Table 4 shows the results of the evaluation of the model’s ability to detect and segment blueberries. The HPPEM proposed in this study has higher APs for bbox and mask than other models at IOU = 0.5 and IOU = 0.5~0.95. The F1-score value of HPPEM is 0.938, which is higher than other one-stage instance segmentation models and slightly higher than other two-stage models. This indicates that it strikes a better balance between precision and recall. HPPEM adopts a hybrid cascade structure to decompose the detection task into a series of subtasks thus fully utilizing the rich box and mask information. It uses ConvNeXt as the backbone network and employs multi-scale training to learn feature information at different scales. Based on this method, it solves the problem of difficult blueberry segmentation under severe occlusion and complex backgrounds and meets the demand for precise pixel regions in blueberry phenotyping research, which helps to promote blueberry production and management.

4. Discussion

4.1. Detection Error

The model’s instance segmentation errors fall into four main categories: missed detection, misclassification of two blueberries as one, misclassification of one blueberry as two, and partial detection. In Figure 11A, an immature blueberry is occluded by leaves, stems, and other blueberries, resulting in unsuccessful detection. In Figure 11B, a ripe blueberry is occluded by three equally ripe blueberries, only a very small portion of which is visible, and the occluded objects are so similar to each other that they are difficult to distinguish even with the naked eye. In Figure 11C, a blueberry is occluded and its visible portion is divided into two disconnected regions, resulting in a small portion of the blueberry being incorrectly recognized as a separate blueberry. For partial detection, as shown in Figure 11D, the upright sepals of an unripe blueberry were misidentified as background. As a result of these misidentifications, the accuracy of segmentation decreases. Despite some detection errors due to the occlusion problem in the image, overall, as shown in Figure 8, from the segmentation results we can effectively extract the phenotypic traits of the clusters of different varieties of blueberries.

4.2. Quantity Extraction Error

To assess the difference between the number of fruits within blueberry clusters extracted by the model and the true value, we manually recorded the number of fruits within the clusters as we photographed the blueberry samples. To analyze the cause of the error, we used linear regression to compare the difference between the extracted and true values and calculated the coefficient of determination (R2) and root mean square error (RMSE). R2 reflects how well the model fits the actual data. A high R2 means that the model fits the data well and the extracted values of fruit counts are close to the actual counts. The RMSE is the square root of the sum of squared errors (SSE), which provides a standardized measure of error that is easy to interpret. A low RMSE value indicates that the model extracts a small error in the number of fruits.
S S E = i = 1 n ( y i y i ~ ) 2
R 2 = 1 S S r e s S S t o t
R M S E = S S E / n
where y i is the actual value, y i ~ is the predicted value, n is the number of samples, S S r e s is the residual sum of squares, and S S t o t is the total sum of squares.
As shown in Figure 12, as a whole, the number of blueberry fruits detected by the model is slightly lower than the number counted manually, and the error gradually increases as the number of fruits in the cob increases. This is due to the fact that more fruits in the 2D image are occluded by the fruits in the foreground. The few cases where the number of detections was higher than the manual counts were due to the occlusion of the fruits, where the visible portion was divided into multiple disjointed regions, resulting in one fruit being incorrectly detected as more than one. A linear model was obtained using the number of manual counts versus the number detected by the model (y = 0.860x + 1.618) with a coefficient of determination (R2) of 0.902 and a root mean square error (RMSE) of 1.556.
In the four varieties’ separate linear models (Table 5), Berkeley’s R2 was the largest and RMSE was the smallest, which indicated that Berkeley’s linear model predicted the number of blueberries better and with the smallest error, whereas Bluecrop’s R2 was the smallest and RMSE was the largest, which implied that Bluecrop’s linear model had the largest error. The RMSE of the linear models for each of the three varieties were smaller than the RMSE of the combined linear model, and Berkeley’s linear model had a higher R2 than the combined linear model which indicated that the linear model for a single variety fitted the relationship between the number of hand counts and the number of detections better than the linear model for the four varieties combined.

5. Conclusions

In this study, a high-precision blueberry cluster phenotypic extraction model was proposed for automated extraction of fruit number, maturity, and compactness. The bbox and mask AP of the model reached 0.974 and 0.975, respectively, at an IOU threshold of 0.5. Phenotypic traits extracted from the model for four blueberry varieties showed that Berkeley had the highest ripeness and the lowest compactness at the beginning of June, Bluecrop had the lowest ripeness but the highest number of fruits, and Bluegold had a higher number of fruits compared to the other two varieties. The model proposed in this paper detects and segments blueberry fruits with high average precision, which improves the efficiency and accuracy of blueberry phenotyping. Fruit number, maturity, and compactness analyses of blueberries could be incorporated into breeding programs to screen genotypes that are more suitable for mechanical or spike picking. In conclusion, the results of this study provide technical support for the automatic extraction and analysis of blueberry cluster phenotypes, which is of great significance for blueberry breeding. Meanwhile, the design idea and improvement of HPPEM proposed in this paper can provide a reference for designing automated phenotype extraction models for other crops in the future. In future research, in order to further enhance the phenotype extraction, we can consider combining multimodal data, such as infrared images, hyperspectral images, etc., and fusing them with visible light images to extract richer phenotypic features and improve the accuracy of the model. Alternatively, three-dimensional reconstruction of blueberry spikes through point cloud segmentation can be considered to obtain more accurate phenotypic information.

Author Contributions

R.G.: Conceptualization, methodology, software, resources, writing—review and editing, supervision, project administration, funding acquisition. J.G.: validation, formal analysis, data curation, writing—original draft preparation, visualization. G.X.: validation, investigation. All authors have read and agreed to the published version of the manuscript.

Funding

This work was supported by Dalian Science and Technology Innovation Fund (2022JJ12SN052) and Dalian University (DLUXK-2023-YB-004).

Data Availability Statement

Some of the datasets that were used and analyzed in this study have been uploaded to the website https://github.com/20171758/HPPEM (accessed on 29 May 2024). In addition, all the homemade datasets in this study (1432 sheets in total) can be obtained by contacting the corresponding author.

Conflicts of Interest

The authors declare no conflicts of interest.

References

  1. Qian, Y.P.L.; Zhou, Q.; Magana, A.A.; Qian, M.C. Comparative study of volatile composition of major Northern Highbush blueberry (Vaccinium corymbosum) varieties. J. Food Compos. Anal. 2022, 110, 104538. [Google Scholar] [CrossRef]
  2. Yang, W.; Guo, Y.; Liu, M.; Chen, X.; Xiao, X.; Wang, S.; Gong, P.; Ma, Y.; Chen, F. Structure and function of blueberry anthocyanins: A review of recent advance. J. Funct. Foods 2022, 88, 104864. [Google Scholar] [CrossRef]
  3. Duan, Y.; Tarafdar, A.; Chaurasia, D.; Singh, A.; Bhargava, P.C.; Yang, J.; Li, Z.; Ni, X.; Tian, Y.; Li, H.; et al. Blueberry fruit valorization and valuable constituents: A review. Int. J. Food Microbiol. 2022, 381, 109890. [Google Scholar] [CrossRef]
  4. Yang, H.; Wu, Y.; Zhang, C.; Wu, W.; Lyu, L.; Li, W. Growth and physiological characteristics of four blueberry cultivars under different high soil pH treatments. Environ. Exp. Bot. 2022, 197, 104842. [Google Scholar] [CrossRef]
  5. Sargent, S.A.; Takeda, F.; Williamson, J.G.; Berry, A.D. Harvest of Southern Highbush Blueberry with a Modified, Over-the-Row Mechanical Harvester: Use of Soft-Catch Surfaces to Minimize Impact Bruising. Agronomy 2021, 11, 1412. [Google Scholar] [CrossRef]
  6. Brondino, L.; Borra, D.; Giuggioli, N.R.; Massaglia, S. Mechanized Blueberry Harvesting: Preliminary Results in the Italian Context. Agriculture 2021, 11, 1197. [Google Scholar] [CrossRef]
  7. Wang, H.; Guo, Y.; Bao, Y.; Gen, L. Mechanism analysis and simulation of blueberry harvest by vibration mode. Trans. Chin. Soc. Agric. Eng. (Trans. CSAE) 2013, 29, 40–46. [Google Scholar] [CrossRef]
  8. Xu, G.; An, Q.; Zhao, L.; Liu, G.; Lou, X.; Wang, H. A new blueberry cultivar‘Morning Snow’suitable for cluster harvesting. Acta Hortic. Sin. 2021, 48, 2795–2796. [Google Scholar] [CrossRef]
  9. Xu, G.; Lei, L.; An, Q.; Luo, L.; Wang, H. Utilization and development trend analysis of Vaccinium of America in blueberry breeding. J. Fruit Sci. 2021, 38, 1173–1189, (In Chinese with English Abstract). [Google Scholar]
  10. Brightwell, W.T. A Comparison of the Ethel and Walker Varieties as Parents in Blueberry Breeding; The Ohio State University: Columbus, OH, USA, 1956. [Google Scholar]
  11. Ni, X.; Li, C.; Jiang, H.; Takeda, F. Deep learning image segmentation and extraction of blueberry fruit traits associated with harvestability and yield. Hortic. Res. 2020, 7, 110. [Google Scholar] [CrossRef]
  12. Shi, J.; Xiao, Y.; Jia, C.; Zhang, H.; Gan, H.; Li, X.; Yang, M.; Yin, Y.; Zhang, G.; Hao, J.; et al. Physiological and biochemical changes during fruit maturation and ripening in highbush blueberry (Vaccinium corymbosum L.). Food Chem. 2023, 410, 135299. [Google Scholar] [CrossRef] [PubMed]
  13. Lobos, T.E.; Retamales, J.B.; Hanson, E.J. Early preharvest calcium sprays improve postharvest fruit quality in “Liberty” highbush blueberries. Sci. Hortic. 2021, 277, 109790. [Google Scholar] [CrossRef]
  14. Ma, H.; Zhang, K.; Jin, X.; Ji, J.; Zhu, X. Identification of Blueberry Fruit Maturity Using Hyperspectral Images Technology. J. Agric. Sci. Technol. 2020, 22, 80–90. [Google Scholar] [CrossRef]
  15. Wu, Z.; Jiang, X. Extraction of Pine Wilt Disease Regions Using UAV RGB Imagery and Improved Mask R-CNN Models Fused with ConvNeXt. Forests 2023, 14, 1672. [Google Scholar] [CrossRef]
  16. Dong, S.; Wang, P.; Abbas, K. A survey on deep learning and its applications. Comput. Sci. Rev. 2021, 40, 100379. [Google Scholar] [CrossRef]
  17. Yazdinejad, A.; Dehghantanha, A.; Parizi, R.M.; Epiphaniou, G. An optimized fuzzy deep learning model for data classification based on NSGA-II. Neurocomputing 2023, 522, 116–128. [Google Scholar] [CrossRef]
  18. Wang, L.; Qin, M.; Lei, J.; Wang, X.; Tan, K. Blueberry maturity recognition method based on improved YOLOv4-Tiny. Trans. Chin. Soc. Agric. Eng. (Trans. CSAE) 2021, 37, 170–178. [Google Scholar] [CrossRef]
  19. Gonzalez, S.; Arellano, C.; Tapia, J.E. Deepblueberry: Quantification of Blueberries in the Wild Using Instance Segmentation. IEEE Access 2019, 7, 105776–105788. [Google Scholar] [CrossRef]
  20. He, K.; Gkioxari, G.; Dollár, P.; Girshick, R. Mask R-CNN. In Proceedings of the IEEE International Conference on Computer Vision (ICCV), Venice, Italy, 22–29 October 2017; pp. 2961–2969. [Google Scholar]
  21. Yazdinejad, A.; Dehghantanha, A.; Srivastava, G.; Karimipour, H.; Parizi, R.M. Hybrid Privacy Preserving Federated Learning Against Irregular Users in Next-Generation Internet of Things. J. Syst. Archit. 2024, 148, 103088. [Google Scholar] [CrossRef]
  22. Yazdinejad, A.; Dehghantanha, A.; Srivastava, G. AP2FL: Auditable Privacy-Preserving Federated Learning Framework for Electronics in Healthcare. IEEE Trans. Consum. Electron. 2024, 70, 2527–2535. [Google Scholar] [CrossRef]
  23. Namakshenas, D.; Yazdinejad, A.; Dehghantanha, A.; Srivastava, G. Federated Quantum-Based Privacy-Preserving Threat Detection Model for Consumer Internet of Things. IEEE Trans. Consum. Electron. 2024, 1. [Google Scholar] [CrossRef]
  24. Zhang, J.; Min, A.; Steffenson, B.J.; Su, W.; Hirsch, C.D.; Anderson, J.; Wei, J.; Ma, Q.; Yang, C. Wheat-Net: An Automatic Dense Wheat Spike Segmentation Method Based on an Optimized Hybrid Task Cascade Model. Front. Plant Sci. 2022, 13, 834938. [Google Scholar] [CrossRef]
  25. Deng, R.; Zhou, M.; Huang, Y.; Tu, W. Hybrid Task Cascade-Based Building Extraction Method in Remote Sensing Imagery. Remote Sens. 2023, 15, 4907. [Google Scholar] [CrossRef]
  26. Chen, K.; Pang, J.; Wang, J.; Xiong, Y.; Li, X.; Sun, S.; Feng, W.; Liu, Z.; Shi, J.; Ouyang, W.; et al. Hybrid Task Cascade for Instance Segmentation. In Proceedings of the IEEE/CVF Conference on Computer Vision and Pattern Recognition (CVPR), Long Beach, CA, USA, 15–20 June 2019; pp. 4974–4983. [Google Scholar]
  27. Liu, Z.; Mao, H.; Wu, C.Y.; Feichtenhofer, C.; Darrell, T.; Xie, S. A ConvNet for the 2020s. In Proceedings of the IEEE/CVF Conference on Computer Vision and Pattern Recognition (CVPR), New Orleans, LA, USA, 18–24 June 2022; pp. 11976–11986. [Google Scholar]
  28. Russell, B.C.; Torralba, A.; Murphy, K.P.; Freeman, W.T. LabelMe: A Database and Web-Based Tool for Image Annotation. Int. J. Comput. Vis. 2007, 77, 157–173. [Google Scholar] [CrossRef]
  29. Lin, T.Y.; Maire, M.; Belongie, S.; Hays, J.; Perona, P.; Ramanan, D.; Dollár, P.; Zitnick, C.L. Microsoft COCO: Common Objects in Context. In Computer Vision—ECCV 2014; Springer: Cham, Switzerland, 2014; Volume 8693, pp. 740–755. [Google Scholar] [CrossRef]
  30. Bello, I.; Fedus, W.; Du, X.; Cubuk, E.D.; Srinivas, A.; Lin, T.-Y.; Shlens, J.; Zoph, B. Revisiting resnets: Improved training and scaling strategies. Adv. Neural Inf. Process. Syst. 2021, 34, 22614–22627. [Google Scholar]
  31. Carion, N.; Massa, F.; Synnaeve, G.; Usunier, N.; Kirillov, A.; Zagoruyko, S. End-to-end object detection with transformers. In Computer Vision—ECCV 2020; Springer International Publishing: Cham, Switzerland, 2020; pp. 213–229. [Google Scholar]
  32. Cai, Z.; Vasconcelos, N. Cascade R-CNN: High Quality Object Detection and Instance Segmentation. IEEE Trans. Pattern Anal. Mach. Intell. 2019, 43, 1483–1498. [Google Scholar] [CrossRef]
  33. Bolya, D.; Zhou, C.; Xiao, F.; Lee, Y.J. YOLACT: Real-Time Instance Segmentation. In Proceedings of the IEEE/CVF International Conference on Computer Vision (ICCV), Seoul, Republic of Korea, 27 October–2 November 2019; pp. 9157–9166. [Google Scholar]
  34. Wang, X.; Zhang, R.; Kong, T.; Li, L.; Shen, C. SOLOv2: Dynamic and Fast Instance Segmentation. Neural Inf. Process. Syst. 2020, 33, 17721–17732. [Google Scholar]
  35. Wang, X.; Kong, T.; Shen, C.; Jiang, Y.; Li, L. SOLO: Segmenting Objects by Locations. In Computer Vision–ECCV 2020: 16th European Conference, Glasgow, UK, August 23–28, 2020, Proceedings, Part XVIII 16; Springer International Publishing: Cham, Switzerland, 2020; pp. 649–665. [Google Scholar] [CrossRef]
  36. Tian, Z.; Shen, C.; Chen, H. Conditional Convolutions for Instance Segmentation. In Computer Vision–ECCV 2020: 16th European Conference, Glasgow, UK, August 23–28, 2020, Proceedings, Part I 16; Springer International Publishing: Cham, Switzerland, 2020; pp. 282–298. [Google Scholar] [CrossRef]
  37. Fang, Y.; Yang, S.; Wang, X.; Li, Y.; Fang, C.; Shan, Y.; Feng, B.; Liu, W. Instances As Queries. In Proceedings of the IEEE/CVF International Conference on Computer Vision (ICCV), Montreal, QC, Canada, 10–17 October 2021; pp. 6910–6919. [Google Scholar]
  38. Cheng, B.; Misra, I.; Schwing, A.G.; Kirillov, A.; Girdhar, R. Masked-Attention Mask Transformer for Universal Image Segmentation. In Proceedings of the IEEE/CVF Conference on Computer Vision and Pattern Recognition (CVPR), New Orleans, LA, USA, 18–24 June 2022; pp. 1290–1299. [Google Scholar]
Figure 1. Images of blueberries on two different backgrounds. (A) Natural background. (B) Artificial background.
Agronomy 14 01178 g001
Figure 2. Examples of different shading situations. (A) Fruits shading each other. (B) Fruits shading by leaves. (C) Fruits shading by stems.
Agronomy 14 01178 g002
Figure 3. Labeling of blueberry images. Red polygon outlines are labeled with mature blueberries, green polygon outlines are labeled with immature blueberries. (A) Original image. (B) Blueberry image with manual labeling. (C) Labeling details.
Agronomy 14 01178 g003
Figure 4. Images of five different views of four varieties of blueberries.
Agronomy 14 01178 g004
Figure 5. HPPEM structure.
Agronomy 14 01178 g005
Figure 6. Structures of ResNet and ConvNeXt. (A) ResNet Block. (B) ConvNeXt Block.
Agronomy 14 01178 g006
Figure 7. Mask and minimum rotation outer rectangle extraction process. (A) Original image. (B) Biplot for each instance. (C) Merged biplot. (D) Minimally rotated outer rectangle.
Agronomy 14 01178 g007
Figure 8. (A) Original image of blueberry clusters. (B) Instance segmentation results. (C) minimum rectangular box. (D) Feature extraction results.
Agronomy 14 01178 g008
Figure 9. Statistical analysis of blueberry traits of different varieties.
Agronomy 14 01178 g009
Figure 10. AP curves of the training process in the ablation experiment.
Agronomy 14 01178 g010
Figure 11. Examples of different detection errors. The red circle marks the location of the detection error. (A) Missed inspection. (B) Misclassifying two blueberries as one. (C) Misclassification of one blueberry as two. (D) Partial detection.
Agronomy 14 01178 g011
Figure 12. Linear regression of the number of fruits detected versus manual count values for all varieties of blueberries.
Agronomy 14 01178 g012
Table 1. Scale Selection.
Scales
(480, 1333), (512, 1333), (544, 1333), (576, 1333), (608, 1333), (640, 1333),(672, 1333), (704, 1333), (736, 1333), (768, 1333), (800, 1333)
Table 2. Average phenotypic indexes of each of the four varieties obtained by extraction.
CultivarAverage Number of Fruits in ClusterAverage Cluster MaturityAverage Cluster Compactness
Berkeley9.8280.6960.548
Duke9.6550.4070.567
Bluecrop13.6900.4390.626
Bluegold15.7590.1800.584
Table 3. Results of ablation experiments.
ConvNeXtMulit-ScaleAP (IOU = 0.5)AP (IOU = 0.5~0.95)Params (M)
BboxMaskBboxMask
--0.9480.9490.8420.84596.148
1-0.960.9610.8460.84980.855
110.9740.9750.8770.85580.855
1 √ indicates that the module is used.
Table 4. Comparative test results.
TypeF1-ScoreAP (IOU = 0.5)AP (IOU = 0.5~0.95)
BboxMaskBboxMask
Mask R-CNN0.8890.9400.9370.7850.790
Cascade Mask R-CNN0.9190.9420.9330.8140.793
Hybrid Task Cascade0.9310.9480.9490.8420.845
Yolact0.8370.8690.8500.2950.497
SOLOv2--0.907-0.700
CondInst0.9060.9050.9110.8110.781
QueryInst0.8830.7970.8100.6200.664
Mask2Former0.9150.9020.9140.7910.836
YOLO V80.8980.9110.9110.7890.752
HPPEM0.9380.9740.9750.8770.855
Table 5. Linear regression for each of the four varieties.
CultivarLinear ModelR2RMSE
Berkeleyy = 1.023 + 0.932x0.9590.627
Dukey = 1.311 + 0.920x0.8061.429
Bluecropy = 1.406 + 0.838x0.7981.759
Bluegoldy = 1.412 + 0.885x0.8951.313
Disclaimer/Publisher’s Note: The statements, opinions and data contained in all publications are solely those of the individual author(s) and contributor(s) and not of MDPI and/or the editor(s). MDPI and/or the editor(s) disclaim responsibility for any injury to people or property resulting from any ideas, methods, instructions or products referred to in the content.

