Article

Low-Cadmium Wheat Cultivars Limit the Enrichment, Transport and Accumulation of Cadmium

1
Environment Research Institute, Shandong University, Qingdao 266237, China
2
Yantai Agricultural Technology Extension Center, Yantai 264001, China
3
Zibo City Digital Agriculture and Rural Development Center, Zibo 255000, China
*
Authors to whom correspondence should be addressed.
Agronomy 2024, 14(6), 1191; https://doi.org/10.3390/agronomy14061191
Submission received: 19 April 2024 / Revised: 12 May 2024 / Accepted: 27 May 2024 / Published: 1 June 2024
(This article belongs to the Section Agroecology Innovation: Achieving System Resilience)

Abstract

:
Low-cadmium (Cd) accumulating wheat cultivars (LAWC-Cds) can effectively reduce the total Cd content in wheat grains (Grain-Cd). Thirteen LAWC-Cds were planted in three fields to study the enrichment, transport, and accumulation patterns of Cd in LAWC-Cds. Compared with the soil properties before planting, the soil pH and the total Cd content in the soil decreased, while the Cd content in the diethylenetriaminepentaacetic acid extract, soil conductivity, and soil organic matter increased at wheat maturity. The Cd enrichment capacity of the different organs of wheat decreased in the following order: root > leaf > rachis > stem > glume > grain. The dynamics of Cd accumulation in roots affected Grain-Cd, and these factors were negatively correlated. The Cd content and Cd accumulation in all organs of LAWC-Cds showed strong negative correlations with the lengths of the first and second internodes and highly significant positive correlations with both grains per spike and awn length. Structural equation modeling showed that the Cd content of wheat organs had the most direct effect (0.639) in determining Grain-Cd, and soil properties had the largest effect (0.744) in influencing Grain-Cd. This study is important for screening wheat cultivars with stable low Cd-accumulation characteristics.

1. Introduction

Cadmium (Cd) pollution in agricultural fields has been exacerbated by processes such as atmospheric dry and wet deposition, sewage irrigation, industrial activities, and the overuse of chemical fertilizers and pesticides [1,2]. Crops grown in Cd-contaminated soil accumulate Cd in their edible parts, and this Cd can enter the human body through the food chain, posing a significant health threat [3,4,5]. Wheat (Triticum aestivum L.), as one of the major grain crops, has a greater Cd enrichment capacity than maize and rice [6,7]. However, China has limited arable land resources. Under the premise of safeguarding the livelihood of the population and agricultural production while adhering to the red line of 1.8 billion mu (120 million hectares) of arable land, it is unavoidable that crops such as wheat will be planted in farmland contaminated with mild to moderate Cd [8]. To mitigate issues related to excessive Cd levels in wheat grains, low-Cd-accumulating wheat cultivars (LAWC-Cds) have been widely adopted as a safe measure to effectively reduce Cd levels in grains and minimize the risk of exceeding Cd standards [9,10,11].
However, the enrichment and transport of soil Cd by LAWC-Cds are affected by both the environment and cultivar; the soil environment serves as the basis for wheat growth, and different soil physicochemical properties directly affect the uptake and accumulation of Cd in wheat. Soil Cd serves as a direct source of Cd input to wheat, but the distribution of Cd in soil has strong spatial heterogeneity, which is affected by the location of plots and geographical location [12]. Previous research revealed that the total Cd content in the wheat grains (Grain-Cd) of LAWC-Cds was influenced mainly by environmental factors [13]. The soil Cd content in the diethylenetriaminepentaacetic acid extraction state (DTPA-Cd), an important indicator for assessing the availability of Cd for uptake and accumulation by wheat, is influenced mainly by soil physicochemical properties and the root microenvironment [14,15,16]. Studies have shown that the main soil factors affecting Grain-Cd are soil pH and total Cd content in soil (Soil-Cd) [17,18]. This is primarily because, in addition to the inherent properties of the soil (such as soil organic matter (SOM) and soil pH affecting DTPA-Cd levels) [16], the release of root exudates (such as organic acids) changes the soil pH in the rhizosphere microenvironment, thereby affecting the bioavailability of Cd [19]. Previous studies have shown that there was a significant reduction in the levels of low molecular weight organic acids in the interroot soils of LAWC-Cds compared with those of high-Cd cultivars, leading to a decrease in the availability of Cd in the soil [20]. However, spatial colocated comparisons of changes in soil properties before and after wheat cultivation are lacking in the available studies. Therefore, it is important to characterize changes in soil properties before planting and at wheat maturity to explore the bioavailability of soil Cd during Cd uptake and enrichment in wheat.
In addition to the influence of soil environmental factors and cultivar differences on the enrichment of Cd transporter capacity, there are also large differences in Cd in the accumulation of Cd in LAWC-Cds [21]. The accumulation of Cd in LAWC-Cds is mainly affected by the ability of various organs (roots, stems, leaves, and spikes) to transport and enrich Cd [22,23]. LAWC-Cds, as an effective measure to reduce Grain-Cd, limit Cd transport in three main ways: (1) reducing root Cd uptake (decreasing interroot organic acid secretion and transporter protein production), (2) enhancing limitations to intercellular tissue transport of Cd (enhancing Cd sequestration in the vacuoles and retention in the cell wall), and (3) increasing limitations to Cd transport between organs in wheat (decreasing Cd translocation from roots to aboveground parts and between grains) [9,24]. Liu et al. (2020) showed that more Cd in the roots of LAWC-Cds was sequestered in the cell walls and vesicles, limiting Cd mobility [25]. Feng et al. showed that LAWC-Cds have a strong retention capacity for Cd at the uppermost node and glume sites, limiting Cd translocation to the grain [26]. Shi et al. (2020) showed that reducing Cd translocation from roots to aboveground parts is an important way to reduce Cd accumulation in wheat grains during grain filling and maturity [27]. However, most of these results were based on a single LAWC-Cd cultivar, and whether the results can be generalized to different LAWC-Cds remains to be investigated. Moreover, there is large heterogeneity among different soil environments, and it is impossible to determine whether a single cultivar has the same characteristics of Cd enrichment, transport, and accumulation in different environments. Therefore, we investigated whether LAWC-Cds universally limit Cd enrichment, transport, and accumulation and whether it is suitable for use in multiple locations.
Both soil properties and the low Cd accumulation capacity of a cultivar are important influences on Cd accumulation in wheat cultivars [8]. Currently, published studies have mainly focused on exploring the effects of soil properties or wheat cultivar differences on the uptake and transport of Cd. However, there is a lack of studies on the enrichment and transport characteristics of the same LAWC-Cds in different Cd-contaminated soils, as well as relatively few studies on the differences in the performance of LAWC-Cds in terms of grain Cd accumulation in soils with similar Cd contamination levels. Structural equation modeling (SEM) allows a comprehensive assessment of impact indicators and facilitates the search for the main factors influencing Grain-Cd. The objectives of this study were (1) to investigate the effects of before planting and at maturity of LAWC-Cds on soil properties; (2) to reveal the universality of LAWC-Cds in limiting Cd enrichment, translocation, and accumulation patterns; and (3) to evaluate the combined causality and effects of soil properties, agronomic traits, dry weight, yield, and Cd content of wheat, cultivars, and the environment on Grain-Cd. This study innovatively investigated the combined effects of external soil environmental factors and low Cd-accumulating wheat cultivar’s own factors on the Cd content of grains, aiming to promote the research on the adaptability and stability of low Cd-accumulating wheat cultivar’s low Cd characteristics in different soil environments.

2. Materials and Methods

2.1. Experimental Design

Field experiments were conducted in three experimental fields (BS, PD, and ZC) in Shandong Province, China, with different soil Cd contents (BS: 1.84 ± 0.31 mg kg−1; PD: 1.32 ± 0.30 mg kg−1; ZC: 1.19 ± 0.17 mg kg−1) and soil pH values (BS: 7.22 ± 0.17; PD: 7.24 ± 0.27; ZC: 8.44 ± 0.17) (Table S1). The soil textures of the BS, PD, and ZC test plots were silty loam, loam, and silty loam, respectively. Based on our previous research, thirteen low-Cd-accumulating wheat cultivars (WN14, JM22, TM98, JN17, TS24, KM18, LX66, LX99, YN999, XM26, XN979, JM229, and JM44) (Table S2) [13,17] were selected for planting in each experimental field. Each cultivar was replicated thrice in a randomized block design trial (Table S3), resulting in a total of 39 plots per experimental field. A total of 117 plots were included across the three experimental fields. Each plot was planted in a 6 m2 area (length: 4 m, width: 1.5 m), with adjacent plots spaced 0.5 m apart. Soil sample collection and wheat planting were completed in October–November 2020, and wheat and soil sample collection were completed in June 2021.

2.2. Sample Collection and Preparation

Surface soil samples (0–20 cm) were collected from each plot using a five-point sampling method both before sowing and at the time of wheat maturity. At wheat maturity, we collected soil samples from the vicinity of wheat roots via the root-shaking method [28,29]. The collected soil samples were placed in plastic sample trays to remove stones, plant debris, and other impurities mixed in the soil. The samples were then spread out in a thin layer and left to air dry naturally. All soil samples were ground manually using a mortar and pestle and then passed through a nylon sieve with a particle size of 2 mm. Soil pieces larger than 2 mm were repeatedly ground and sieved until they all passed, and then the sieved samples were mixed well and sampled in quadrature for the determination of soil pH, soil conductivity (EC), and DTPA-Cd. The remaining 2 mm of soil was ground and mixed, passed through a 0.25 mm particle-size nylon sieve, mixed, and then sampled in quadrature for the determination of SOM. The remaining 0.25 mm of soil was ground and mixed, passed through a nylon sieve with a particle size of 0.15 mm, and then mixed for the determination of Soil-Cd.
After wheat maturity, a 1 m2 area of wheat ears from the middle of each plot was harvested to avoid cross-contamination between wheat cultivars to calculate the wheat yield. Mixed wheat samples were collected from each plot using the five-point sampling method for the analysis of wheat agronomic properties and Grain-Cd. Ten intact wheat plants were collected from each plot, and agronomic traits including wheat height, first internode diameter (near the root) (FID), spike length (SL), spikelet number (SN), grain number per spike (GPS), awn length (AL), first internode length (near the root) (FIL), second internode length (near the root) (SIL), thousand-grain weight (TGW), and wheat yield were determined. Wheat plant height refers to the length of the wheat from the ground to the top of the wheat (excluding the awn), spike length refers to the length of the wheat spike from the bottom to the top of the spike (excluding the awn), and the number of spikelets per spike was counted manually. The wheat agronomic properties in each plot were averaged over 10 wheat plants. The ten wheat plants were divided into six parts: roots, stems, leaves, rachises, glumes (with awns), and grains. The organs of the wheat plants were washed 3–5 times with tap water and twice with deionized water, and the cleaned wheat plants were deactivated in an oven at 105 °C for 30 min and then dried at 65 °C to a constant weight. The dry weights of the roots, stems, leaves, rachises, glumes, and grains were recorded. After drying the wheat organs, each wheat tissue sample was ground into powder using a grinder (AQ-180E-Y, Nail, Cixi, China) and stored.

2.3. Measurement of Sample Indicators

For the determination of Soil-Cd, approximately 0.2000 g of air-dried soil samples with a particle size of 0.15 mm were accurately weighed and transferred into a polytetrafluoroethylene digestion tube, and 10 mL of HNO3, 5 mL of HF, and 2 mL of HClO4 were added for heating and digestion using a fully automatic graphite digestion apparatus (DigestLinc-ST60D, Polytech, Beijing, China). After the volume of the soil digestion solution was adjusted, the Cd concentration was determined by a graphite furnace atomic absorption spectrometer (iCE 3500, Thermo Fisher Scientific, Waltham, MA, USA). Soil standard reference material GBW07982 (GSS-40), GBW07553 (GSS-62), and GBW07555 (GSS-64) and blank samples were added for calibration, validation, and quality control in the experimental analyses, and the Cd contents of the actual standards were within the range of the standard values. DTPA-Cd was extracted by a DTPA extractant (GB/T 23739-2009) [30], and the Cd concentration of the DTPA extract was determined using a graphite furnace atomic absorption spectrometer (iCE 3500, Thermo Fisher Scientific, USA), in which the determination was supplemented with the standard substance GBW07442 (GSF-2) and blank samples were used for calibration, validation, and quality control in the experimental analysis. The determination of SOM was carried out by heating samples in a constant temperature oil bath (HH-8, Zhengji, Jiangsu, China) (NY/T 1121.6-2006) [31], and the standard substance RMU079 (10.3 ± 0.94 g kg−1) was added for quality control. EC was determined at a water-to-soil ratio of 5:1 (V/m) (HJ 802-2016) [32], and the soil pH was determined at a water-to-soil ratio of 2.5:1 (V/m) (HJ 962-2018) [33]. To ensure that the matrix effects for samples from each experimental field remained consistent, soil samples from each experimental field were measured in the same batch.
For the determination of Cd in various organs of wheat, approximately 0.3000–0.5000 g of wheat powder was accurately weighed and placed in a digestion tube, 9 mL of HNO3 and 1 mL of HClO4 were added, digestion was carried out using a fully automated graphite digestion apparatus (DigestLinc-ST60D, Polytech, Beijing, China), and the digested solution was analyzed by graphite furnace atomic absorption spectrometry (iCE 3500, Thermo Fisher Scientific, Waltham, MA, USA) to determine the Cd concentration. For calibration, validation, and quality control of the wheat samples, wheat standard reference material GBW10011a (GSB-2a) (0.021 ± 0.003 mg kg−1) and blank samples were added to the assay in each field.

2.4. Bioaccumulation Factors (BCFs) and Transfer Factors (TFs)

The BCF is the ratio of the concentration of a heavy metal in the plant body to the concentration of that metal in its growing medium (soil) and is an indicator of the plant’s ability to be enriched in heavy metals from the soil [34]. The formula is as follows: BCF = CWheat-Cd/CSoil-Cd, where CWheat-Cd represents the Cd content of different wheat organs (roots, stems, leaves, rachises, glumes, and grains), and CSoil-Cd represents the Cd content of the soil. TF indicates the ratio of Cd content in different organs of wheat and can be used to evaluate the ability and rate of heavy metal transfer between different organs [26,35]. The formula is TF = Ci/Cj, where Ci and Cj are the Cd content in each organ of wheat.

2.5. Data Analysis

Microsoft Office Excel 2019 and SPSS 25 were used for statistical analysis of these data. The Spearman’s correlation coefficient was used to determine the correlation between two variables. Graphing was performed using RStudio (R Version 4.3.1), in which graphing of soil physicochemical properties was performed using the “pheatmap” package (Version 3.5.0). To assess the importance of the Cd content in different organs on Grain-Cd, we used a random forest model for importance ranking. The random forest model analysis was conducted using the “randomForest” package (Version 4.7-1.1). We used linear regression to explore the linear relationship between Grain-Cd and Cd content of each organ, using the “ggplot2” package (Version 3.5.0) for plotting. We used SEM to determine the main factors affecting Cd content in wheat grains, accounting for account both soil properties (pH 1 (preplanting), Soil-Cd 1 (preplanting), DTPA-Cd 1 (preplanting), EC 1 (preplanting), SOM 1 (preplanting), pH 2 (maturity stage), Soil-Cd 2 (maturity stage), DTPA-Cd 2 (maturity stage), EC 2 (maturity stage), SOM 2 (maturity stage)), Wheat-Cd (total Cd content in roots (Root-Cd), total Cd content in stems (Stem-Cd), total Cd content in leaves (Leaf-Cd), total Cd content in rachis (Rachis-Cd), total Cd content in glumes (Glume-Cd)), dry weight (root dry weight (Root-DW), stem dry weight (Stem-DW), leaf dry weight (Leaf-DW), rachis dry weight (Rachis-DW), glume dry weight (Glume-DW), grain dry weight (Grain-DW)), agronomic traits (Height, FID, SL, SN, GPS, AL, FIL, and SIL), yield (TGW and Wheat-yield), cultivar, and environment. The SEM was constructed using the “piecewiseSEM” package (Version 2.3.0) [36,37]. The main evaluation criteria of the model were as follows: Fisher’s C value for the chi-squared test to determine the overall fit of the model to derive the Akaike information criterion (AIC) value, the AIC value (the smaller, the better) and the p-value > 0.05 to indicate that the model structure was reasonable [38]. In selecting data for the structural equation model, we first performed a hypothetical causal model: soil properties, Cd content in various organs of wheat, agronomic traits, dry weight, cultivars, yield, and environments all had a direct effect on grain Cd content. Therefore, these factors were modeled in multiple linear regression with grain Cd in structural equation construction, and whether the model fit reasonableness was judged by AIC scores.

3. Results

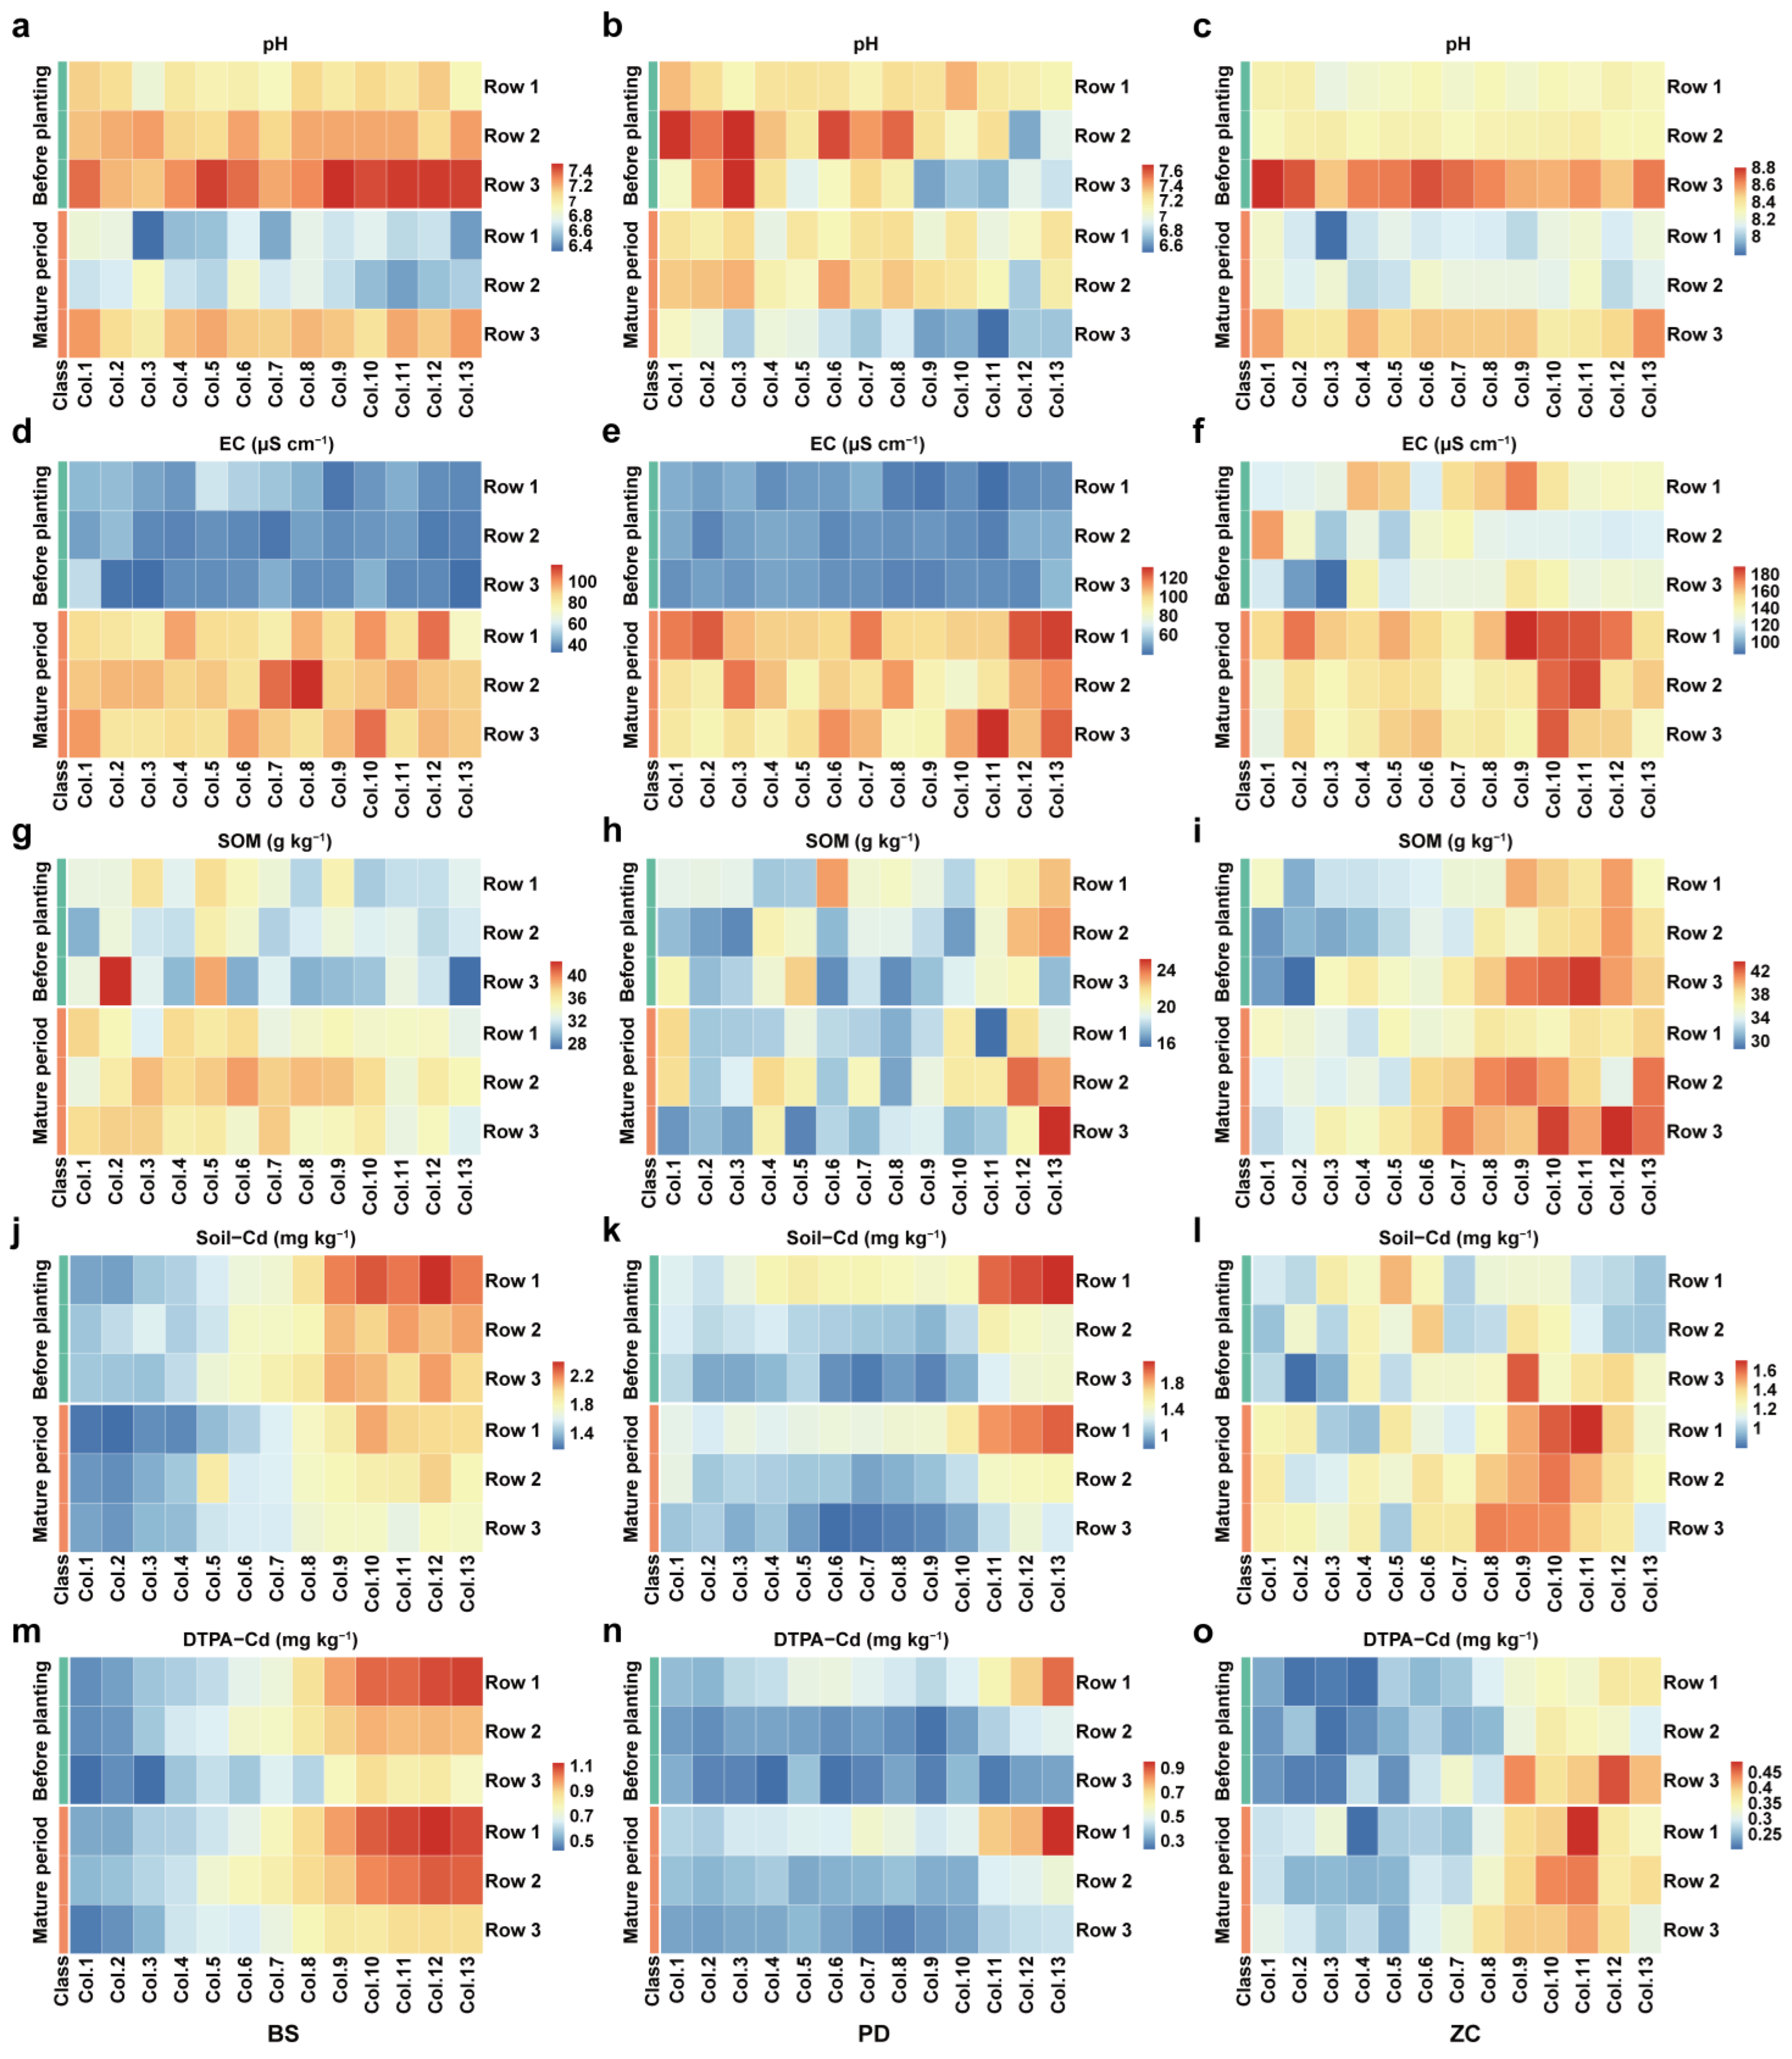
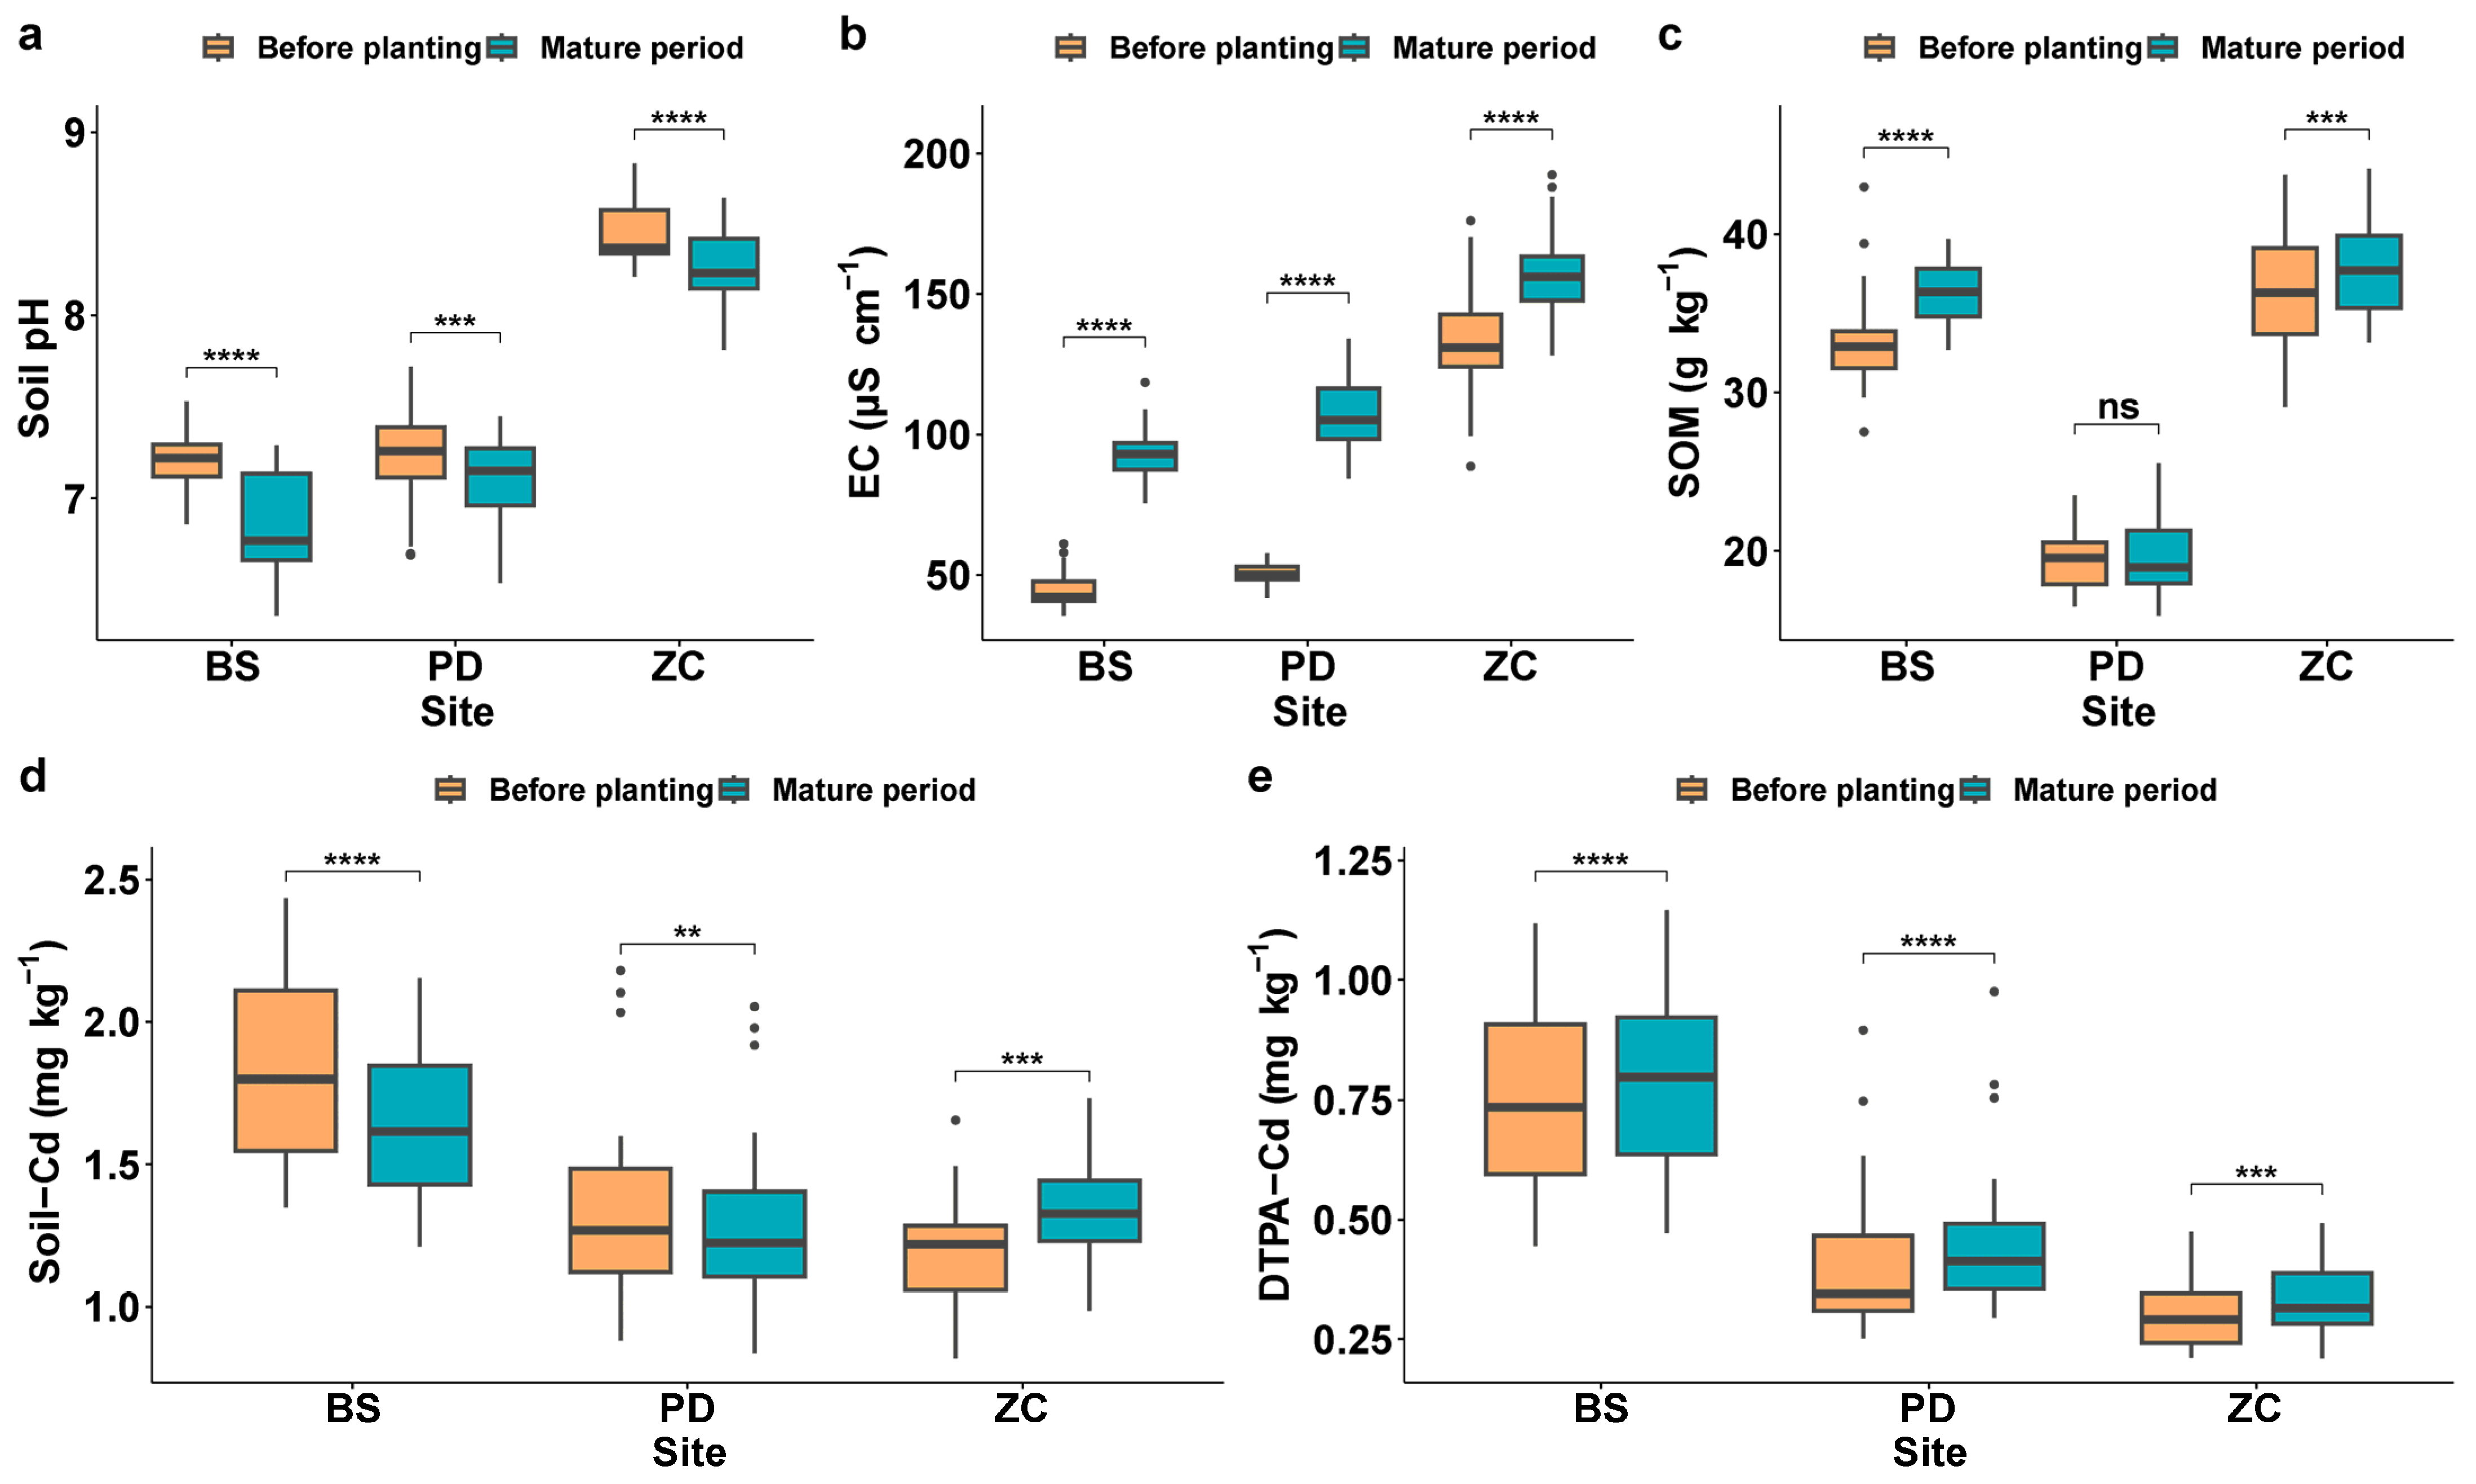
3.1. Differences in Soil Properties before and after Planting of LAWC-Cd Planting

Soil samples collected during the wheat maturity period had neutral soil pH values for BS and PD and alkaline pH values for ZC. Soil-Cd at maturity were 1.65 ± 0.26 mg kg−1, 1.27 ± 0.28 mg kg−1, and 1.34 ± 0.18 mg kg−1 for BS, PD, and ZC, respectively (Table S1). According to the “Risk Control Standard for Soil Contamination of Agricultural Land” (GB 15618-2018) [39], the soil samples taken from the three fields all exceeded the risk screening values established for soil contamination. The spatial distributions of the soil properties in the three experimental fields (BS, PD, and ZC) before the planting of LAWC-Cds and at the maturity stage were variably distributed (Figure 1), especially those of DTPA-Cd, Soil-Cd, and soil pH, which showed a more pronounced spatial clustering in both periods. In contrast, the distributions of EC and SOM were more dispersed in both periods. Based on the paired-samples Wilcoxon test analysis, the soil properties at maturity in the three experimental fields (BS, PD, and ZC) compared with preplanting showed that the mean values of soil pH decreased significantly (p < 0.001) by 5.08%, 1.96%, and 1.96%, respectively (Figure 2a), the mean values of EC increased significantly (p < 0.001) by 111.83%, 111.16%, and 17.92%, the mean values of SOM increased by 9.20% (p < 0.001), 4.25% (p < 0.001), and 0.25% (p > 0.05) (Figure 2c), and the mean values of DTPA-Cd increased significantly (p < 0.001) by 6.35%, 11.71%, and 10.54%, respectively (Figure 2e). In the BS and PD fields, the mean Soil-Cd at maturity significantly (p < 0.01) decreased by 10.07% and 3.93%, respectively, compared with that in preplanting, whereas in the ZC field, the mean Soil-Cd was significantly (p < 0.001) increased by 12.26% (Figure 2d).
Comparison among cultivars using paired sample t-tests revealed that the mean soil pH of JM229 was significantly (p < 0.05) lower at maturity than before planting in all three experimental fields (Figures S1a, S2a and S3a). The EC values of the 13 LAWC-Cds increased relatively significantly at maturity compared with those at preplanting in the BS and PD experimental fields (Figures S1b and S2b). In contrast, in the ZC field, only four cultivars (JM229, WN14, XN979, and YN999) exhibited a significant increase in EC values at maturity compared with those at preplanting (Figure S3b). The SOM of six cultivars (JM44, KM18, LX99, TS24, XM26, and XN979) significantly increased at maturity compared with that of plants preplanted in the BS field (Figure S1c); the SOM of JN17 in the PD field significantly increased (p < 0.05), and that of the other cultivars did not significantly change (Figure S2c); only the SOM of the ZC experimental plot, XM26, significantly increased at maturity compared with preplanting (Figure S3c). In the BS field, all cultivars showed reduced mean values of soil Cd at maturity compared with those in the preplanting period, with those of six cultivars (JM229, JN17, KM18, LX99, TS24, and XM26) being significantly reduced (Figure S1d), whereas none of the values in the PD field significantly differed (Figure S2d). In the ZC field, except LX66, TS24, and XN979, none of the cultivars were significantly different (Figure S3d). In the BS and PD fields, the 13 LAWC-Cds showed an increasing trend for DTPA-Cd at maturity compared with preplanting, but BS did not show a significant difference (Figure S1e), and PD-planted cultivars JM44 and XM26 showed a significant increasing trend (p < 0.05). In the ZC field, for DTPA-Cd at maturity compared with preplanting, all cultivars showed an increasing trend except for the LX99 and XM26 cultivars, with JM229 and LX66 increasing significantly (p < 0.05) (Figure S3e).
In summary, there was spatial heterogeneity in the soil properties in the experimental field, with DTPA-Cd, Soil-Cd, and soil pH showing strong spatial clustering. The cultivation of LAWC-Cds had a significant effect on increasing soil EC, DTPA-Cd, and SOM and decreasing soil pH and Soil-Cd.

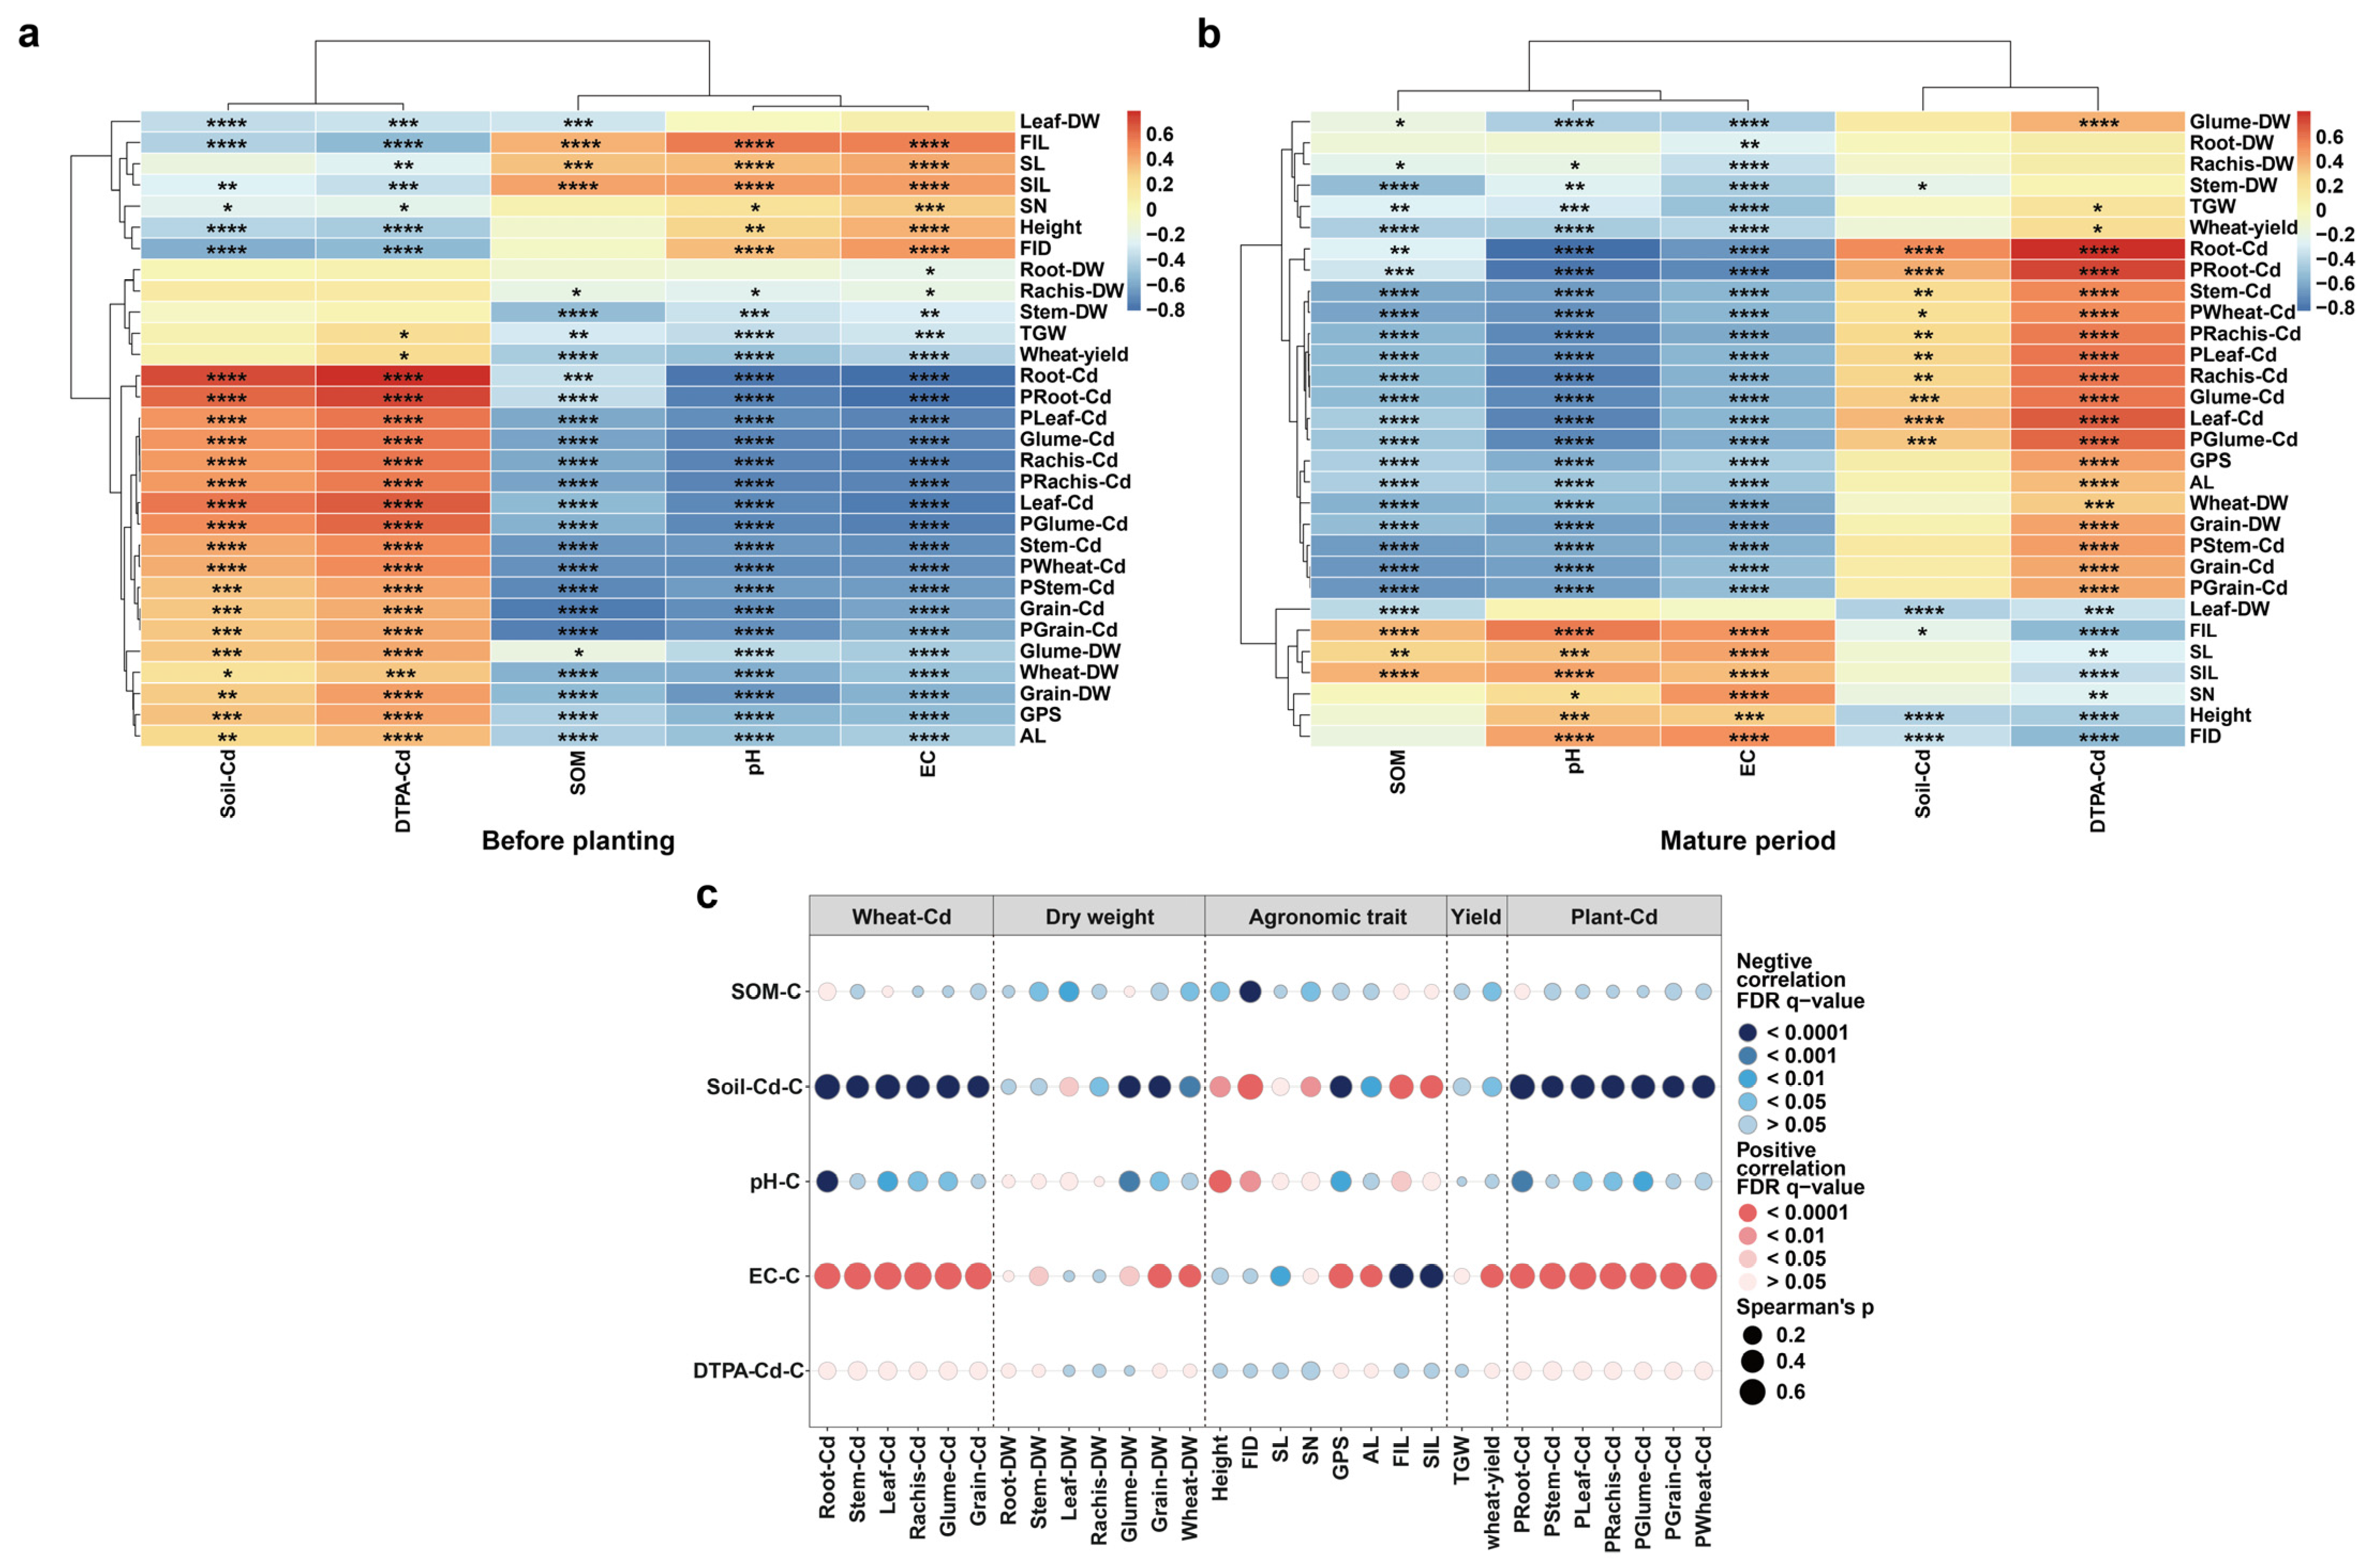
3.2. Influence of Soil Environmental Factors on Cd Content and Agronomic Traits in Wheat

According to the standard limit of GB 2762-2022 [40] for Grain-Cd of 0.1 mg kg−1, the exceedance rates for Grain-Cd in PD, BS, and ZC grains were 100%, 79.49%, and 0%, respectively (Figure S4, Table S4). Spearman’s correlation (Figure 3a,b) analysis of these overall data (n = 117) from the three experimental fields showed that correlations of soil pH with wheat agronomic traits, yield, dry weight, Cd content, and Cd accumulation consistently existed at the preplanting and maturity stages of wheat. Soil pH in the two periods showed significant negative correlations with agronomic traits (GPS and AL), dry weight (Rachis-DW, Stem-DW, Glume-DW, Grain-DW, and Wheat-DW), yield, Cd content in all wheat organs and Cd accumulation; and with agronomic traits (FIL, SL, SIL, SN, Height, and FID) showed significant positive correlations. The correlations between EC and wheat agronomic traits, yield, dry weight, Cd content, and Cd accumulation were similar to those between EC and soil pH but were significantly negatively correlated with Root-DW. The cluster analysis also grouped soil pH and EC into the same category. SOM was highly significantly and positively correlated with agronomic traits (FIL, SL, and SIL) and significantly and negatively correlated with agronomic traits (GPS and AL), dry weight (except for Root-DW), yield, Cd content in all organs, and Cd accumulation in both periods. Soil-Cd showed a highly significant positive correlation with Cd content and Cd accumulation in all organs of wheat before planting; a positive correlation with PStem-Cd, Grain-Cd, and PGrain-Cd was not significant at maturity; and Soil-Cd was significantly negatively correlated with Leaf-DW, FIL, Height, and FID in both periods. The correlations between DTPA-Cd and wheat agronomic traits, yield, dry weight, Cd content, and Cd accumulation were consistent between the two periods. DTPA-Cd showed significant negative correlations with agronomic traits (FIL, SL, SIL, SN, Height, and FID) and dry weight (Leaf-DW). Conversely, DTPA-Cd displayed significant positive correlations with dry weight (Glume-DW, Grain-DW, and Wheat-DW), agronomic traits (GPS and AL), yield, Cd content in various organs of wheat, and Cd accumulation. However, individual fields may have had less significant correlations because of the small dataset size (n = 39), especially the ZC field (Figures S5 and S6).
Correlation analysis (Figure 3c) of the difference in values of similar soil factors between the two periods (maturity minus preplanting) with wheat agronomic traits, yield, dry weight, Cd content, and Cd accumulation showed that the changes in soil pH (Soil- pH-C) were significantly negatively correlated with Wheat-Cd (Root-Cd, Leaf-Cd, Rachis-Cd, and Glume-Cd), Plant-Cd (PRoot-Cd PLeaf-Cd, PRachis-Cd, and PGlume-Cd), Dry weight (Glume-DW and Grain-DW), and Agronomic trait (GPS), with a significantly positively correlated with agronomic trait (Height, FID, and FIL), and had no significant correlation with yield. The correlations between the changes in SOM and Wheat-Cd and Plant-Cd did not reach statistical significance. In contrast, the changes in EC were significantly positively correlated with both Wheat-Cd and Plant-Cd. Contrary to this pattern, the changes in Soil-Cd were significantly negatively correlated with Wheat-Cd and Plant-Cd. DTPA-Cd did not show a significant difference with wheat agronomic traits, yield, dry weight, Cd content, and Cd accumulation. Similarly, correlations for individual sites were less significant (Figure S7).
In summary, the correlations between soil factors at the preplanting and maturity stages of wheat and wheat agronomic traits, yield, dry weight, Cd content, and Cd accumulation were generally consistent. The correlations of DTPA-Cd and Soil-Cd with wheat metrics were opposite to the correlations of soil pH, EC, and SOM with wheat metrics. The cluster analysis was used to categorize the five soil metrics into two groups: one for Soil-Cd and DTPA-Cd and the other for soil pH, EC, and SOM. The correlations indicated that the changes in Soil-Cd and EC values had the greatest impact on various wheat traits (especially wheat Cd content and accumulation), followed by pH and SOM, with the smallest correlation with the changes in DTPA-Cd.

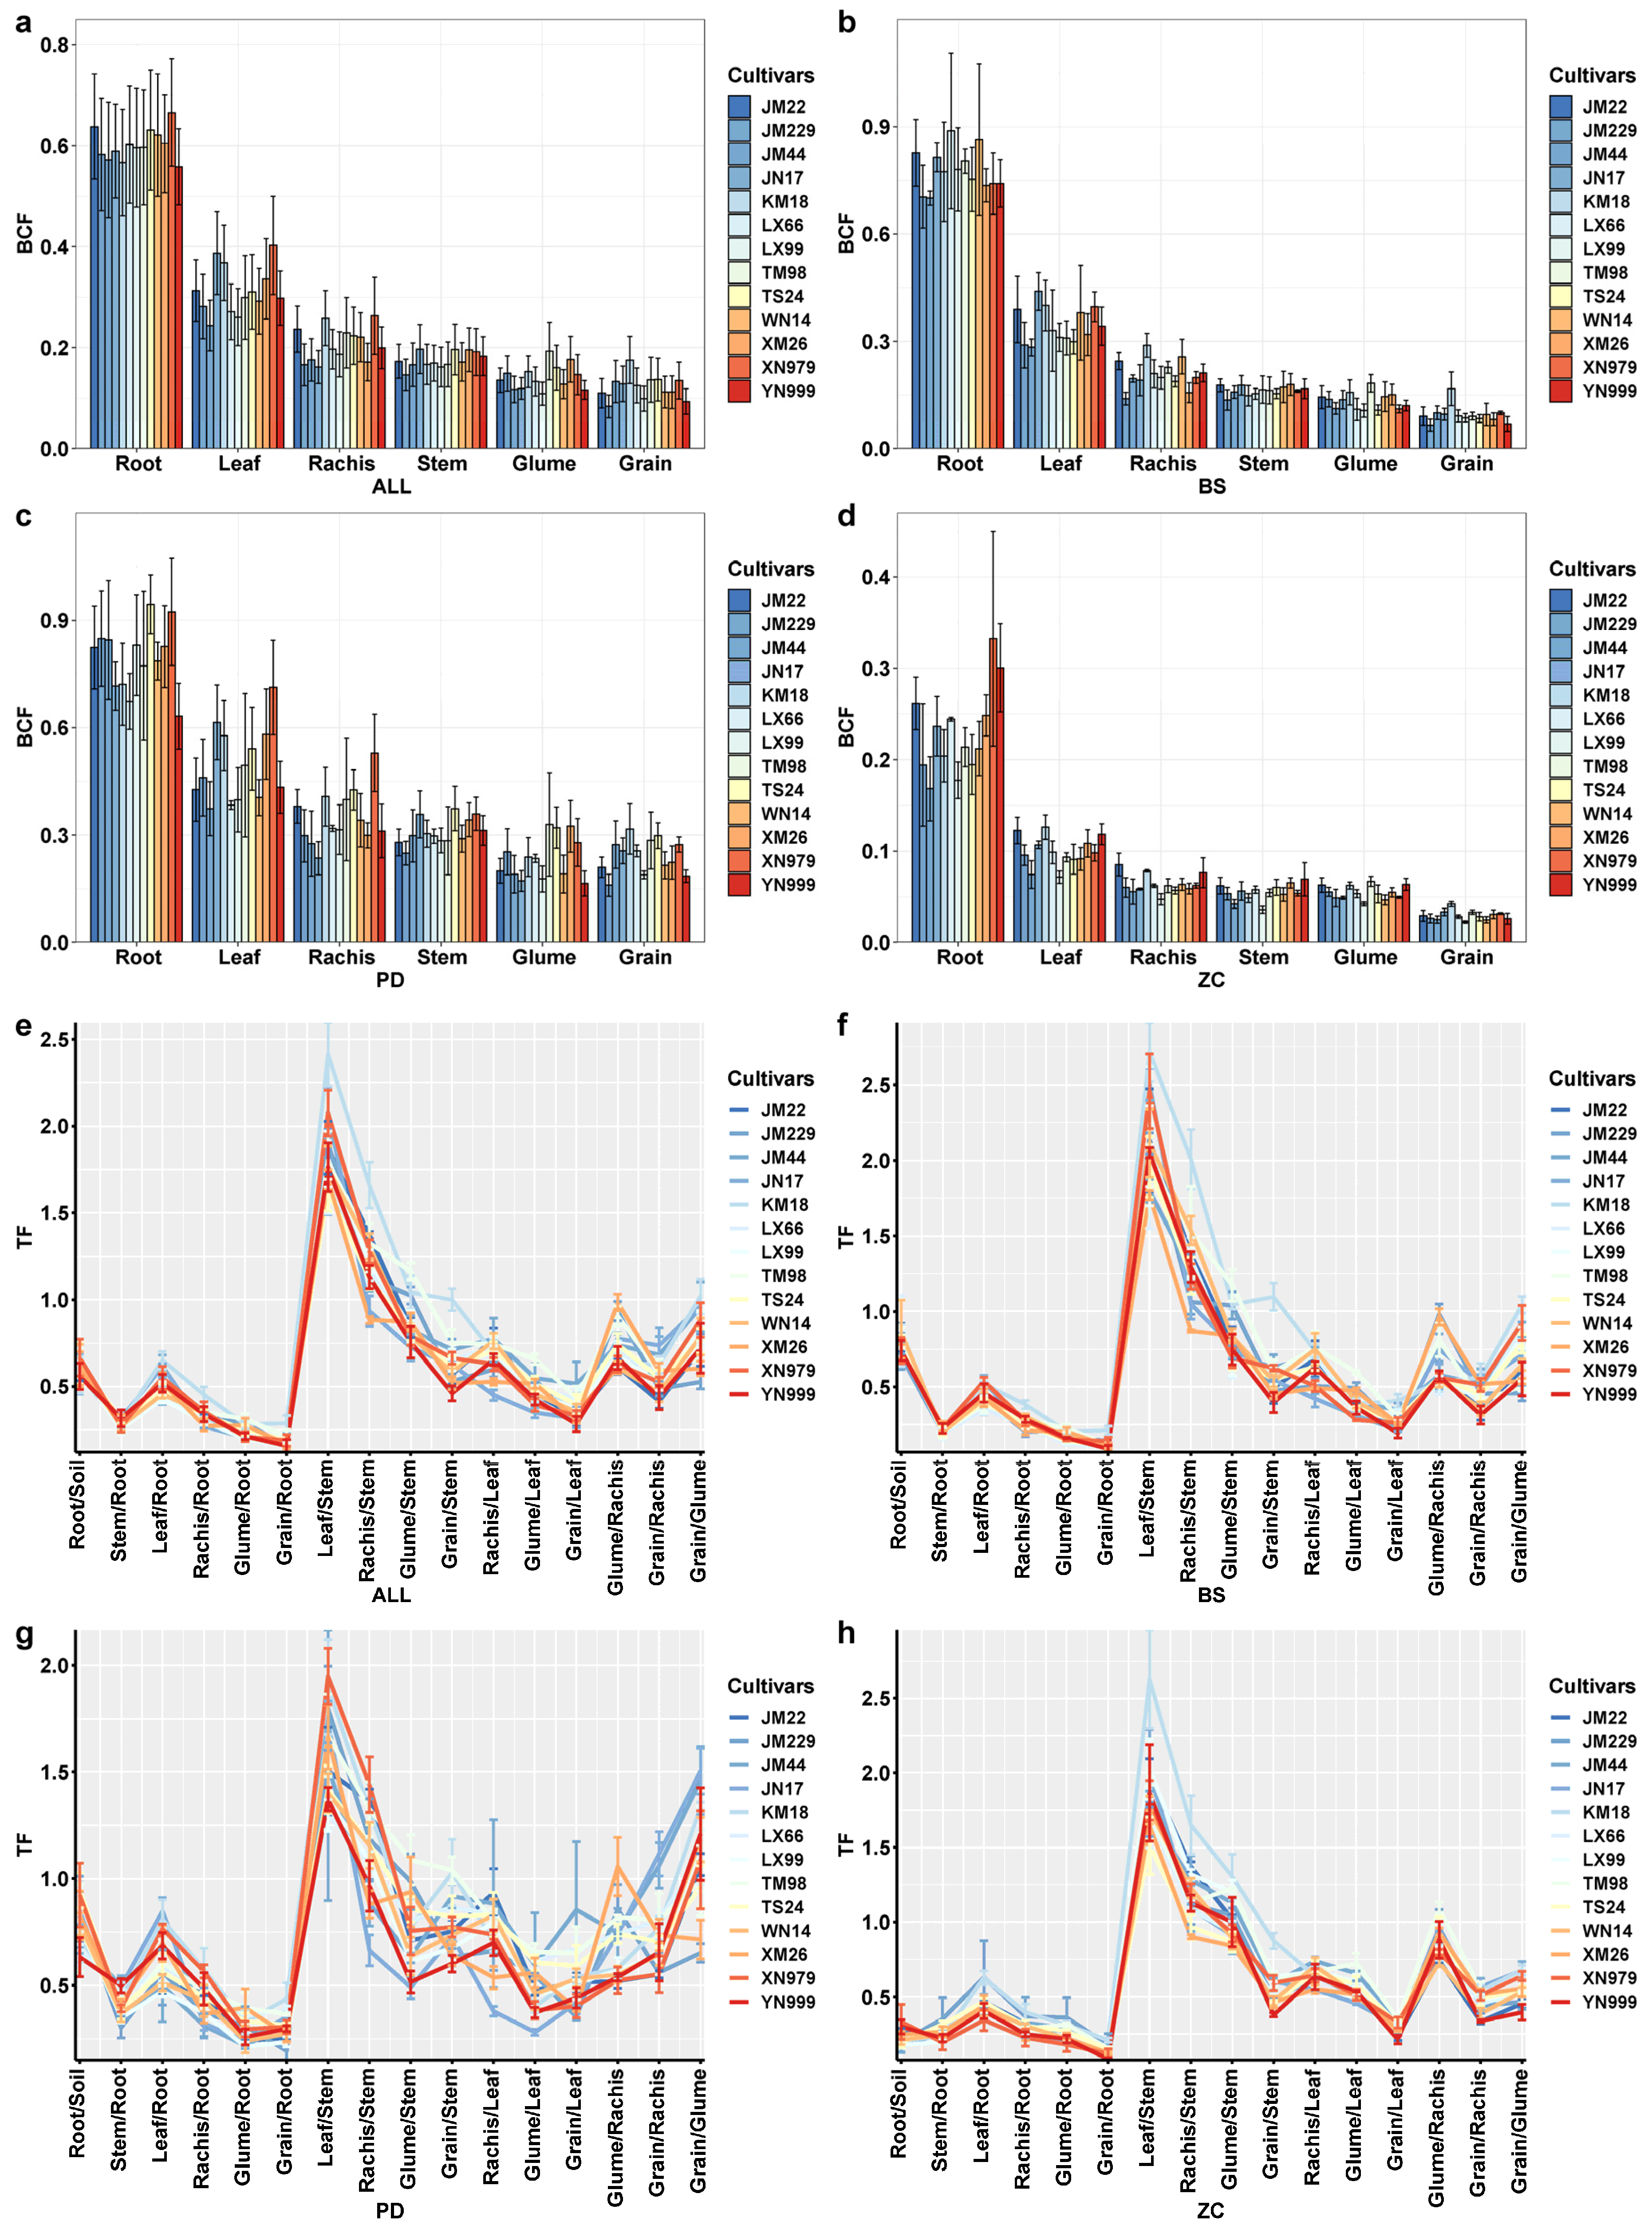
3.3. Characteristics of Cd Enrichment, Transport, and Accumulation in Various Organs of Wheat

Overall, these BCF data indicated that the Cd enrichment capacity of each organ of wheat decreased in the order of root > leaf > rachis > stem > glume > grain (Figure 4a). In all three experimental fields, the Cd enrichment capacity of the roots was greater than that of the other organs, followed by that of the leaves, while the grains showed the weakest Cd enrichment capacity. Among the different cultivars, JM229, YN999, and LX99 had relatively low enrichment capacities for Cd in grains, and KM18 had strong enrichment capacities for Cd in grains (Figure 4b–d). The enrichment capacity of the rachises was greater than that of the stems, suggesting that wheat also accumulates Cd in rachises during upward migration.
The Cd transport capacity of different organs differed in the low-Cd-accumulating wheat system. There were differences in translocation from soil to roots in the three fields, with TFs significantly greater in the BS and PD fields than in the ZC field and TFs greater than 1 in the BS and PD fields. Overall, the trend in root-to-stem, leaf, rachis, glume, and grain translocation under the 13 LAWC-Cd treatments increased and then decreased, with TF values ranked as leaf > rachis > stem > glume > grain (Figure 4e) and TF values less than 1, and the lowest TF was found for root-to-grain translocation. The Cd translocation capacity of roots to other organs in the BS and ZC fields was the same as these overall data, and there was a trend toward increased root-to-grain translocation processes in individual cultivars in the PD field. Stem-to-leaf, rachis, glume, and grain translocation decreased, but the leaf/stem, rachis/stem, and glume/stem ratios were all greater than 1, especially the leaf/stem ratio, which was highest during the whole-wheat translocation process, and the leaf/stem ratio was greater than 1 in all three fields. Leaf to rachis, glume, and grain transfer also showed a decreasing trend, and the mean TF values were all less than 1. The Cd transfer ability from rachises to glumes was greater than that from grains, and the correlation analysis between TF and Grain-Cd showed that grain/glume (0.753) > grain/root (0.659) > grain/stem (0.664) > grain/rachis (0.603) > grain/leaf (0.554) (Table S5). In summary, the greatest transport capacity was observed from the stem to other organs, especially from the stem to the leaf. Grain Cd accumulation had the strongest correlation with glume-to-grain transport.
The proportions of Cd accumulation in wheat grains to the total Cd accumulation in the whole plant in the three experimental fields were as follows: BS field, grain (26.74%) > leaf (23.62%) > stem (19.59%) > root (19.42%) > glume (8.12%) > rachis (2.51%); PD field, grain (38.25%) > stem (22.20%) > leaf (20.34%) > root (10.37%) > glume (6.67%) > rachis (2.17%); and ZC field, leaf (27.29%) > stem (21.77%) > grain (20.41%) > root (18.14%) > glume (9.70%) > rachis (2.68%) (Figure 5a). The accumulation of Cd in the different organs in the three fields decreased in the order of PD > BS > ZC (Figure 5b). Among the 13 LAWC-Cds, KM18 and TM98 exhibited relatively high levels of Cd accumulation in their grains. In contrast, YN999 and JM229 showed comparatively low levels of grain Cd accumulation. The proportion of Cd accumulation in the grains of the same cultivar also varied across different fields, with the sequence being PD > BS > ZC (Figure 5a). As the percentage of Cd accumulation in the grains increased from 20.41% to 38.25%, the percentage of root and leaf accumulation decreased, and the changes in the glumes and rachises were smaller (Figure 5a). However, the results showed that for the different LAWC-Cds, the percentage of accumulation in the roots decreased with increasing Cd accumulation in the grains. When the percentage of Cd accumulation in the grain decreased, the percentage of accumulation in leaves and roots increased.

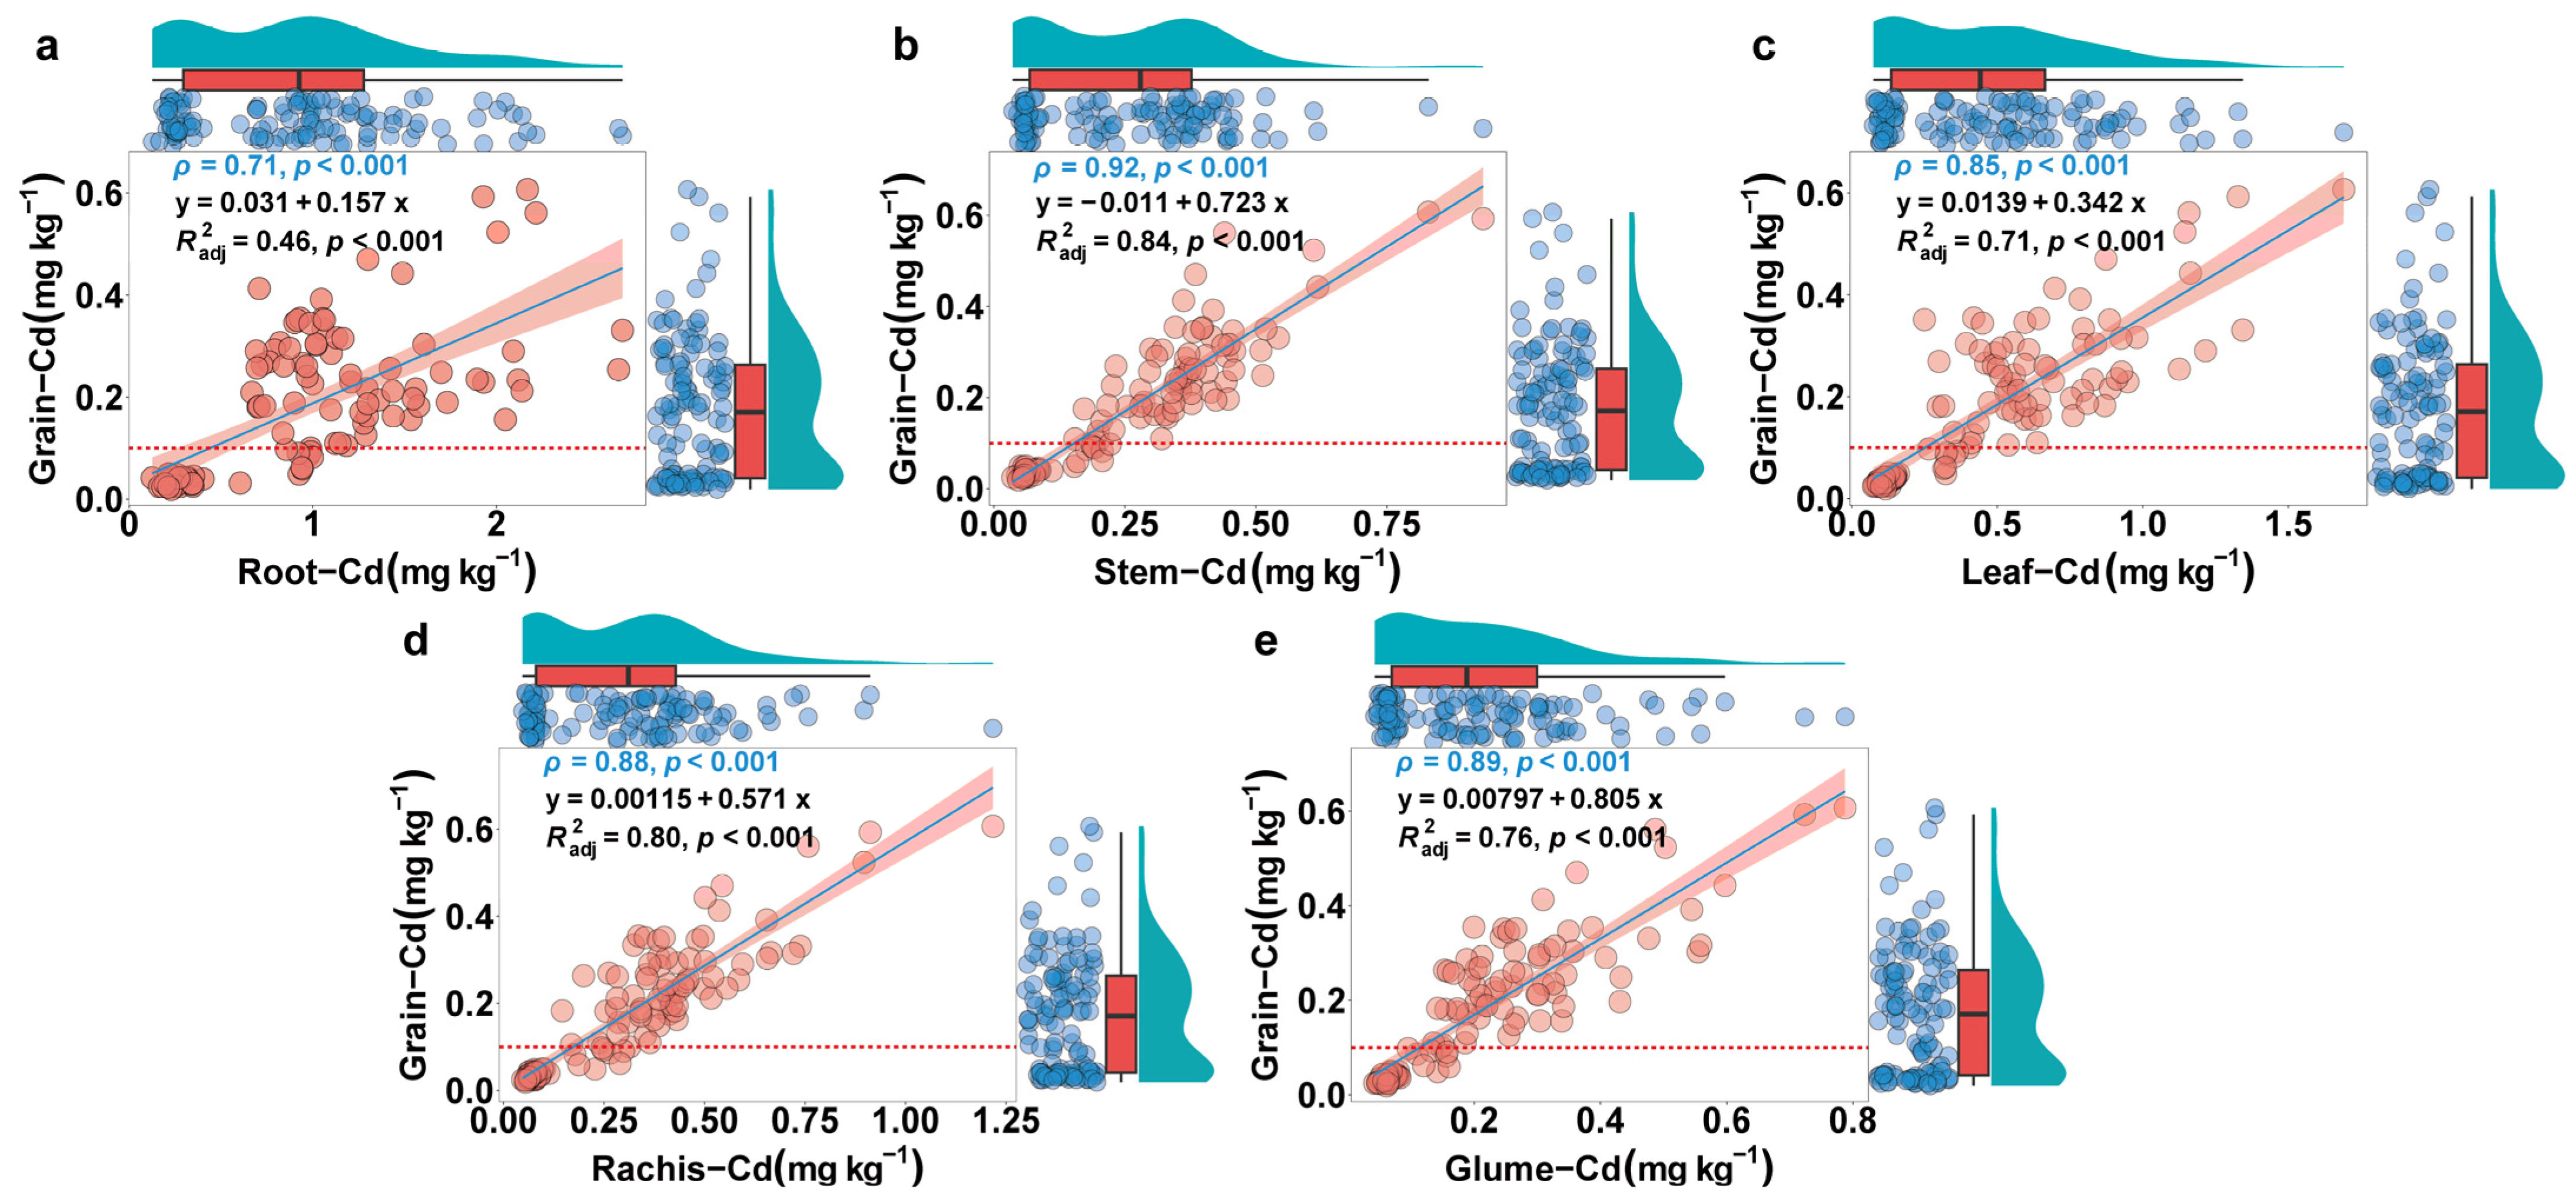
3.4. Correlation of the Cd Accumulation Capacity of Wheat Grain with Agronomic Traits, Yield, and Dry Weight

Spearman’s correlation analysis was used to investigate the relationships between Grain-Cd and the agronomic traits, yield, and dry weight of wheat. The results showed that Grain-Cd was significantly negatively correlated (p < 0.05) with SL, FIL, and SIL and highly significantly positively correlated (p < 0.05) with Wheat-Cd, Plant-Cd, GPS, AL, yield, and dry weight (except Root-DW), and no significant correlation (p < 0.05) was found between Height, FID, SN, and Root-DW (Figure 6). A comparison of the absolute values of the trait correlation coefficients of Grain-Cd with the other indicators that reached high significance showed that PGrain-Cd (0.98) > PWheat-Cd (0.95) > Stem-Cd (0.92) > PStem-Cd (0.91) > Glume-Cd (0.89) > PRachis-Cd (0.89) > Rachis-Cd (0.88) > PLeaf-Cd (0.88) > PGlume-Cd (0.85) > Leaf-Cd (0.85) > Root-Cd (0.71) > Grain-DW (0.70) > PRoot-Cd (0.68) > Wheat-DW (0.66) > FIL (−0.63) > SIL (−0.61) > GPS (0.57) > Wheat-yield (0.55) > AL (0.48) > Stem-DW (0.45) > TGW (0.39) > Glume-DW (0.38) > SL (−0.37) > Rachis-DW (0.25) > Leaf-DW (0.20).
To examine the association between Cd levels in different organs and grain Cd levels in LAWC-Cds, Spearman’s correlation analysis, linear regression analysis, and importance analysis were conducted. There were strong linear relationships (p < 0.001) between the root, stem, leaf, rachis, and glume and grain Cd contents. Spearman’s correlation coefficient showed that Stem-Cd (0.92) > Glume-Cd (0.89) > Rachis-Cd (0.88) > Leaf-Cd (0.85) > Root-Cd (0.71) (Figure 6 and Figure 7), and the linear regression equation R2adj showed that Stem-Cd (0.84) > Rachis-Cd (0.80) > Glume-Cd (0.76) > Leaf-Cd (0.71) > Root-Cd (0.46) (Figure 7). Random forest importance analysis revealed the following order: Stem-Cd (20.43%, p < 0.001) > Rachis-Cd (16.43%) > Glume-Cd (16.36%, p < 0.001) > Root-Cd (12.07%) > Leaf-Cd (10.16%) (Figure S8). In summary, among the Cd levels, stem Cd was the most significant factor affecting Grain-Cd. In contrast, the impact of roots and leaves on grain Cd levels was relatively low.

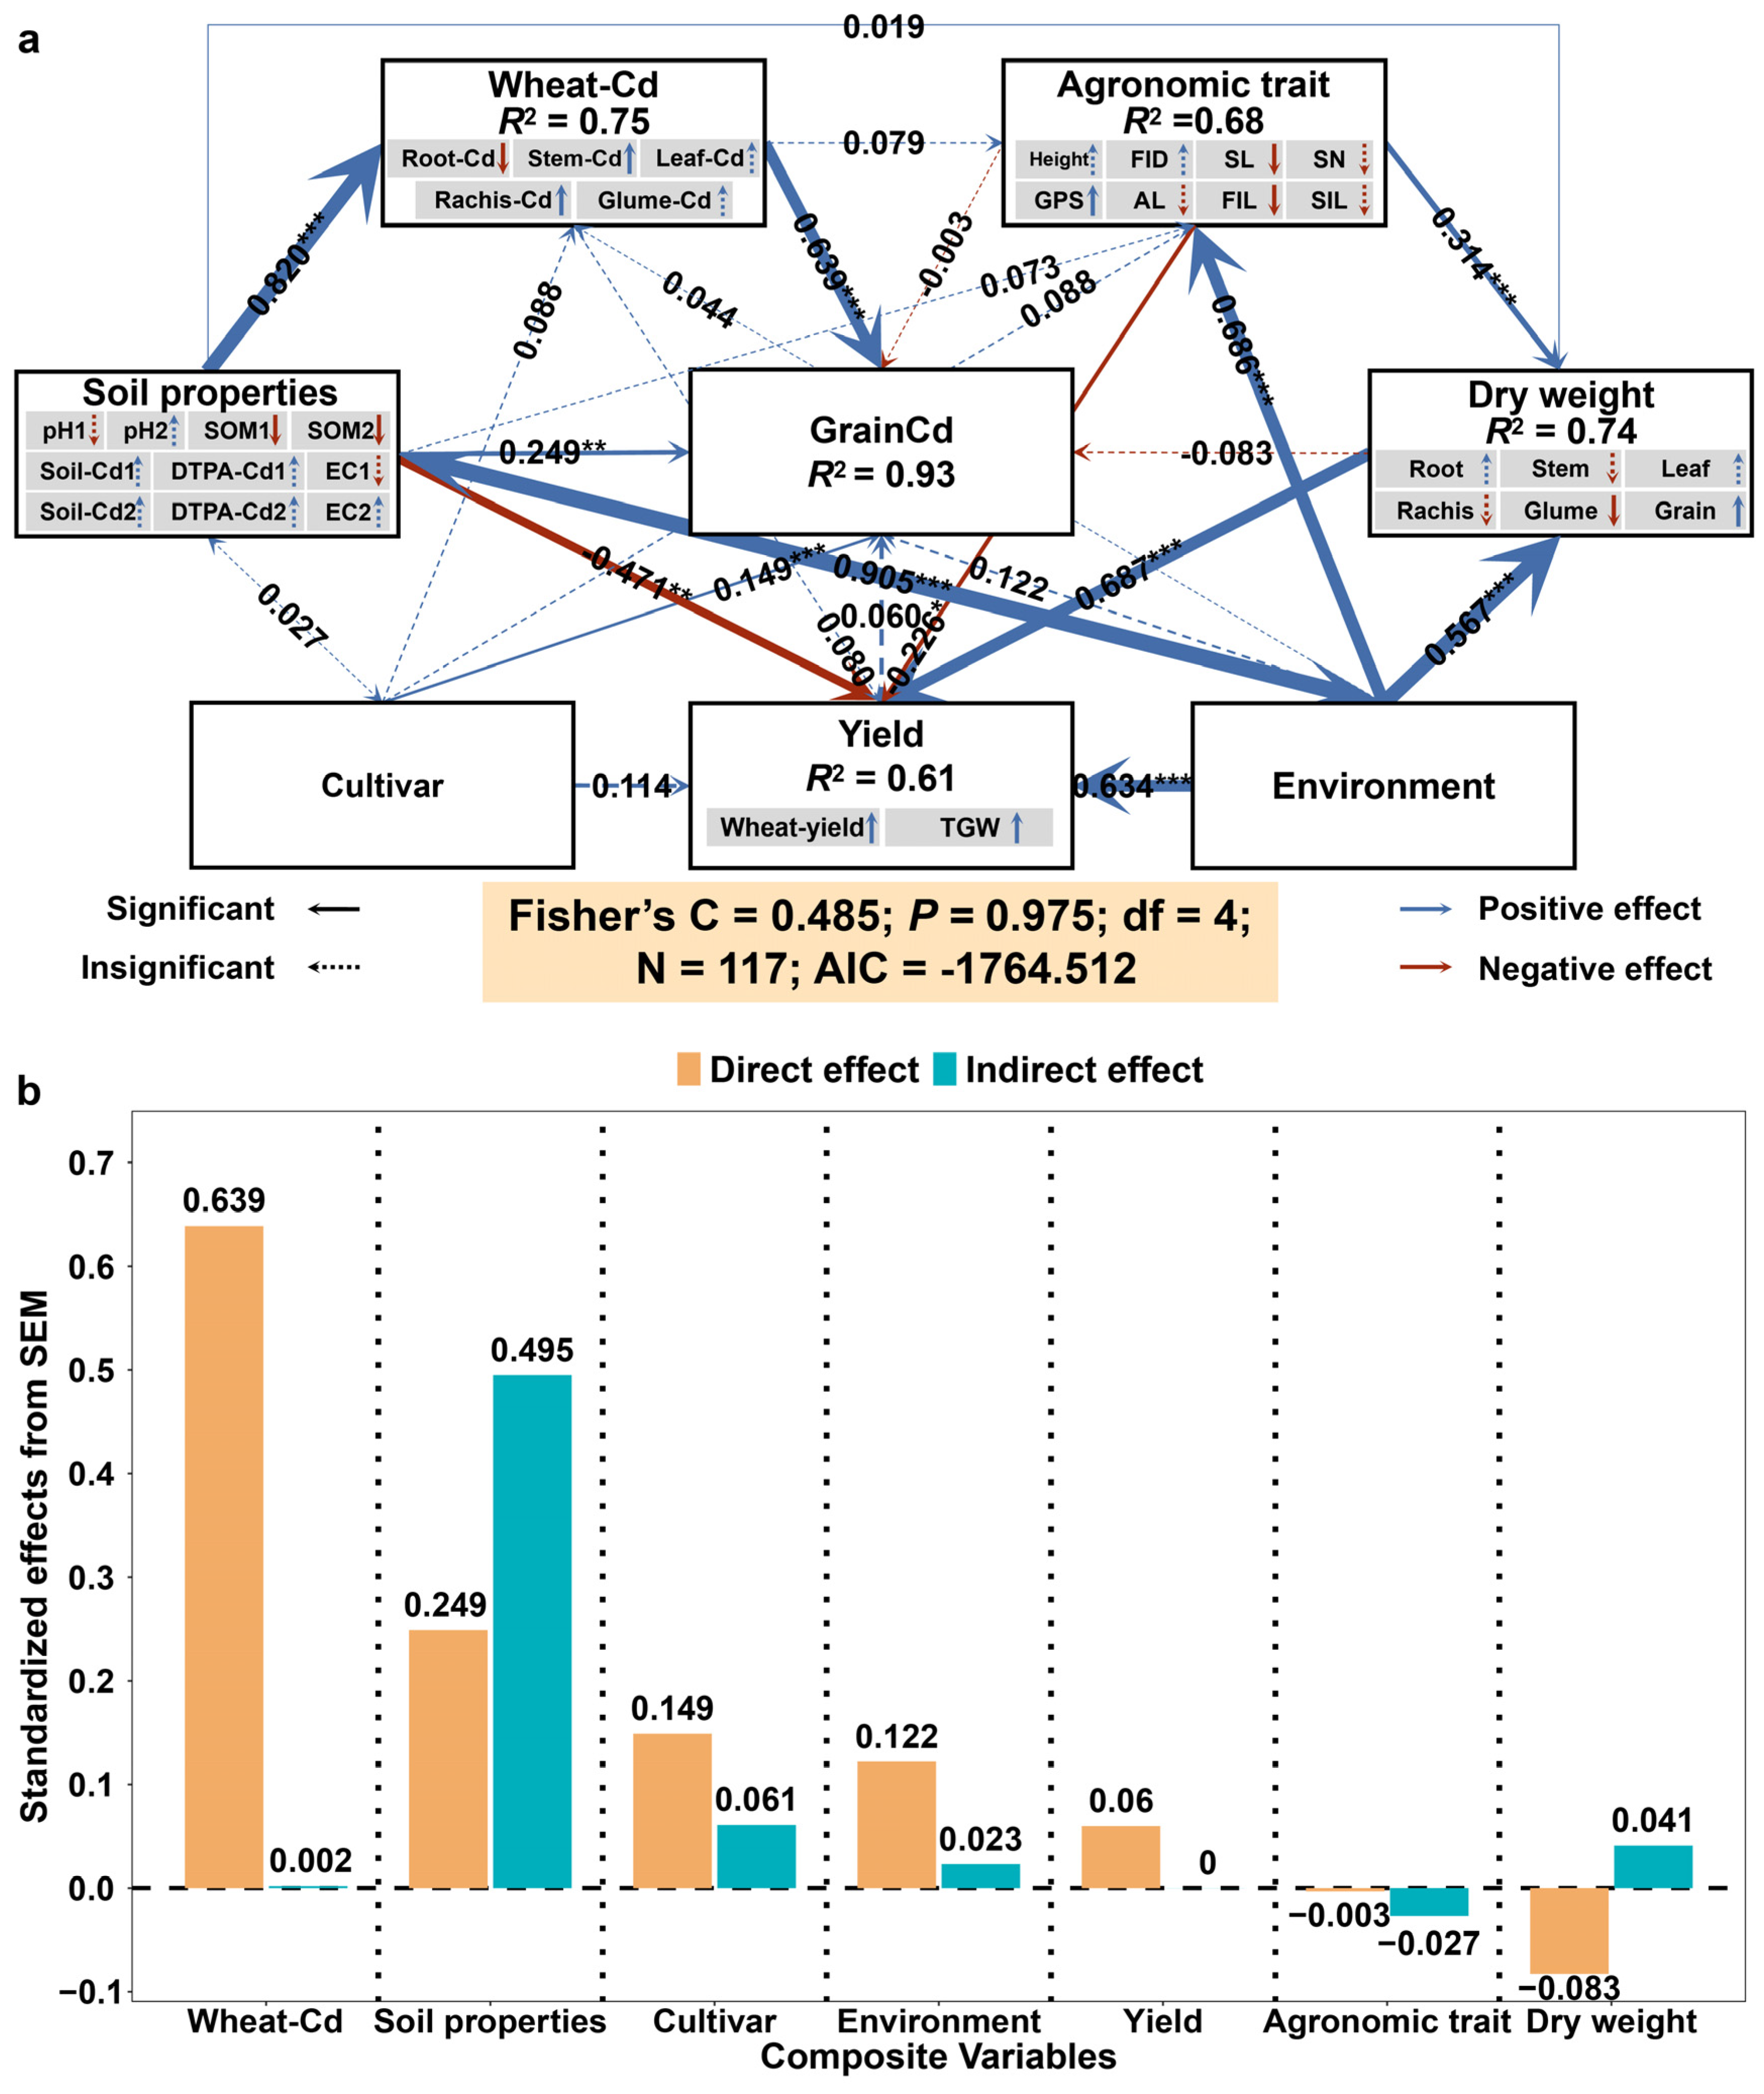
3.5. Modeling the Effect Role of Soil and Wheat Traits on Grain Cd Concentrations

“PiecewiseSEM” revealed the direct and indirect effects of seven factors (soil properties, agronomic traits, Wheat-Cd, yield, cultivar, environment, and dry weight) on Grain-Cd to elucidate better the characteristics and mechanisms affecting Grain-Cd in wheat plants with low Cd accumulation. The SEM results showed that Fisher’s C of the equation was 0.485, and the AIC value was −1764.512, indicating the suitability of the SEM (Figure 8a). All factors had direct or indirect effects on Grain-Cd, and the overall factors explained 93% of the phenotypic variance in Grain-Cd. Soil properties, Wheat-Cd, environment, yield, and cultivar had a direct positive effect on Grain-Cd, with direct effect values of 0.249, 0.639, 0.122, 0.060, and 0.149 (Figure 8b), respectively, among which the direct positive effects of soil properties, Wheat-Cd, and cultivar were highly significant. Agronomic traits and dry weight had a direct negative effect on Grain-Cd with direct effects of −0.003 and −0.083 (Figure 8b), respectively, but none of these effects were significantly different. Soil properties had the greatest values of indirect effects on Grain-Cd, with soil properties affecting Grain-Cd mainly through direct effects on Wheat-Cd, which in turn affected Grain-Cd. In addition, the total effect value (0.744) (Figure 8b) of soil properties was the largest, indicating that soil properties had a greater effect on Grain-Cd, SOM had a highly significant negative effect, and Soil-Cd and DTPA-Cd contents had a positive effect. Although Wheat-Cd mainly had a direct effect on Grain-Cd, its predictor, Root-Cd, had a highly significant negative effect, and the Cd content in the remaining organs had a positive effect. The total effects of yield, cultivar, and environment were all positive, and the total effects of agronomic traits and dry weight were all negative, but the total effect values of all five factors were small.

4. Discussion

4.1. Effect of LAWC-Cds on Soil Properties before and after the Wheat Growth Period

During wheat growth, the root system releases root secretions (nucleic acids and their derivatives, amino acids, organic acids, and sugars) into the interroot zone, altering soil physicochemical properties, microbial population and activity, and the bioavailability of Cd, which influence the uptake, transport, and distribution of Cd in wheat [41,42,43].
Our research revealed that there was a significant decrease in soil pH during wheat maturity compared with the preplanting period of wheat (Figure 1, Figure 2 and Figures S1–S3), which could be attributable to increased interroot secretions of organic acids, which led to decreased soil pH, increased desorption of Cd from soil colloids, and improved Cd mobility and bioavailability. Previous studies have also shown that low molecular weight organic acids in soil can increase soil Cd activity and biosorption, mainly because H ions can replace cations at soil binding sites when the soil pH is low, increasing Cd uptake by plant roots [2,44]. Recent research by Affholder et al. (2023) has shown that among the organic acids secreted by the wheat root system, acetate and succinate exudates affect the aboveground Cd content in wheat [41]. DTPA-Cd, as an accurate indicator for assessing Cd uptake and accumulation in wheat, can reflect soil Cd availability [16]. Li et al. (2018) also showed that there was a correlation between DTPA-Cd and Cd accumulation in wheat (shoots, roots, and grains) [45]. Our research revealed that Soil-Cd decreased while DTPA-Cd increased in the BS and PD fields (Figure 1), and both DTPA-Cd and Soil-Cd in the preplanting and maturity stages of wheat were highly positively and significantly correlated with Cd content and accumulation in all organs of wheat (Figure 3a,b), suggesting that Soil-Cd may be converted to bioavailable DTPA-Cd, which was then enriched, transported and accumulated by wheat. However, Soil-Cd in the ZC field appeared to increase, which deviated from the actual conditions. We hypothesized that the increase observed in Soil-Cd may be due to the large spatial heterogeneity of soils in the ZC field (Figure 1). In summary, low Cd accumulating wheat also absorbs Cd from the interroot soil as influenced by the root microenvironment, leading to a decrease in total soil Cd content.
The decomposition of microorganisms, plants, and animals in soil produces SOM, whose influence on the bioeffectiveness of Cd plays an important role in regulating Cd migration because of the influence of factors such as source, content, speciation, and physical and chemical properties [8]. We found that in the BS and ZC fields, which had relatively low Grain-Cd, SOM tended to increase at maturity compared with preplanting, whereas soils in the PD field, which had relatively high Grain-Cd, SOM decreased for several cultivars (Figures S1–S3). This may have occurred because during the growth of wheat, root secretions, and shed material are released into the soil by microbial decomposition of SOM, and this SOM and Cd form complexes, reducing the bioavailability of Cd and reducing its absorption by wheat [2]. Studies have also shown that reducing soil available Cd and increasing SOM can reduce the risk of Cd contamination in wheat [46]. In this study, it was also found that soil EC values were significantly greater in wheat at maturity than in the soil before wheat planting, and it was hypothesized that the cause of the increase in soil EC could be an increase in ions due to an increase in root secretion, which is mainly because the fact that root secretion of acids changes the pH of the soil and facilitates the solubilization of nutrients for conversion into a utilizable form [47].
Based on the observed variations in soil properties and differences in Grain-Cd across different fields, a single soil property could not explain the differences in Grain-Cd in low-Cd-accumulating cultivars across different fields. Our research revealed that among the three fields, the soil pH was highest in ZC, with no significant difference between BS and PD (Table S1); the magnitudes of both Soil-Cd and DTPA-Cd were BS > PD > ZC (Table S1); the EC values were ZC > PD > BS (Table S1); and the SOM content was ZC > BS > PD (Table S1); however, Grain-Cd was PD > BS > ZC (Table S4). Even with small differences in soil pH (BS and PD fields), the BS field with higher Soil-Cd and DTPA-Cd had lower grain Cd than the PD field. This is mainly because the PD field with higher grain Cd content had lower SOM, suggesting that SOM at lower levels is unable to form complexes with Cd that can be utilized by wheat; as a result, the Cd in the PD field was more readily available for wheat uptake and utilization. The ZC field had lower Grain-Cd but lower DTPA-Cd and higher soil pH and EC values. Therefore, relatively high EC and SOM values limited Cd accumulation in the grains. This finding is consistent with our previous 379 pairwise data correlation results [17]. In conclusion, in Cd-contaminated soils, in addition to increasing soil pH and reducing DTPA-Cd and Soil-Cd, increasing soil EC and SOM may also be effective measures to reduce Grain-Cd.

4.2. Mechanisms Limiting Cd Enrichment, Transport and Accumulation in LAWC-Cds

The primary process of Cd transfer from soil to wheat grains involves Cd root absorption and accumulation from the soil, followed by the transport of accumulated Cd from the roots to the stems and leaves, and finally, the transfer of accumulated Cd from the stems and leaves to the grains [24]. Therefore, exploring the mechanisms of Cd enrichment and transport between different organs in LAWC-Cds that limit Cd can help screen for LAWC-Cds.
LAWC-Cds limit Cd entry into wheat by reducing soil Cd uptake. After the adsorption of Cd on the root surface, Cd enters wheat roots through transport proteins, cation channels, and chelated forms of Cd [48]. In our study, the transfer coefficient of Cd ions from soil to roots was generally less than 1, especially in the ZC field where none of the Grain-Cd values exceeded the standard (0.1 mg kg−1), which was lower than the mean value (1.14) reported in Li and Zhou (2019) in the investigation of the transfer coefficient of Cd ions from soil to roots [6]. The reason for this difference may be, on the one hand, that the soils of the three experimental fields are neutral and alkaline, which reduces the bioavailability of soil Cd, and on the other hand, LAWC-Cds were used in our study because it has a low enrichment capacity for soil Cd compared with high-Cd-accumulating wheat cultivars. Wheat roots, as the first organ exposed to soil Cd ions, are an important part of the absorption and storage compartment, and the enrichment capacity of roots for Cd is greater than that of stems and leaves [49]. Additionally, root uptake of Cd directly affects the level of Cd enrichment in wheat plants with low Cd accumulation. The wheat root system also serves as a basic barrier to prevent Cd transfer from the roots to the above ground, reducing the accumulation of Cd in transit to the above ground [50]. In this study, we found that in different Cd-contaminated soil conditions, the Cd accumulation in the root system of the same LAWC-Cds affects the Cd accumulation in the grain: the higher the proportion of root accumulation, the lower the proportion of Cd accumulation in the wheat grain (Figure 5). Consequently, this results in a lower risk of the grains exceeding the established standard. After Cd ions entered the cells in the roots, more Cd in the roots of LAWC-Cds was sequestered in the cell walls and vesicles, limiting Cd transfer from the roots to the shoots [25]. Cd sequestration by wheat roots has also been identified as a significant factor contributing to variations in grain Cd accumulation in Canadian wheat cultivars [51]. In addition, recent studies have shown that root morphological characteristics (thicker roots retain more Cd) [52] and genes controlling root translocation capacity [25,53,54] all influence root enrichment, translocation, and accumulation of Cd. In summary, LAWC-Cds limit the entry of Cd into wheat by reducing the uptake of soil Cd on the one hand and reducing the accumulation of Cd by Cd sequestration through Cd transit to the ground on the other hand.
Reducing the stem transport of Cd is an important way to reduce Cd accumulation in grains. Our results showed that when the percentage of Cd accumulation in the grains was high, the transfer coefficient of Cd from the stems to the grains was high, and the transfer coefficient to the leaves was low. Spearman’s correlation coefficient (0.92) (Figure 7), linear regression equation R2adj (0.84) (Figure 7), and random forest significance (20.43%) (Figure S8) analyses of the Cd content of grains and stems indicated that stems are the main organs determining Grain-Cd and that the Cd that accumulates in grains is mainly transported through stems. Stems are the main transport channel for Cd enriched in wheat grains, especially during the wheat filling period. Grain-Cd depends not only on its uptake by wheat plants but also on the re-transport capacity of Cd from the aboveground parts to the grain [55]. Cd in the roots is transported above ground through the xylem in the form of Cd ions, Cd entering the stem is redistributed in the stem through the nodes, part of the Cd is transferred to the leaves, another part of the Cd is transferred through the xylem to the phloem of the wheat stem, eventually reaching the grain, and the remaining Cd is retained in the stem by node sequestration [56]. It was shown that 50%–60% of the Cd accumulated in the grain at maturity is transported by pre-flowering Cd storage through the stem, and the remaining Cd is exogenous Cd absorbed during grain filling [57]. Nodes in different parts of the wheat stem play different roles in the transfer, distribution, and limitation of Cd, with the vascular area at the stem and flag leaf playing an important role in limiting the transfer of Cd from the stem to the grain, and the remaining nodes also limiting Cd translocation [56,58].
Leaves contribute less to grain Cd accumulation and can immobilize and limit Cd translocation to a great extent. Our study showed that the Cd enrichment capacity of the leaves of LAWC-Cds was second only to that of the roots (Figure 5), and the mean values of the transfer coefficients to the rachises, grains, and glumes were generally less than 1, suggesting that the leaves had strong enrichment capacity and weak translocation capacity. Random forest importance analysis also revealed that leaves were the least important organ (10.16% importance) for Grain-Cd (Figure S8). Earlier studies also showed that leaves did not redistribute Cd to other organs during the flowering and filling periods in wheat [57]. Recent studies in which foliar sprays of Cd were applied at different concentrations have shown that leaves are of negligible importance in the accumulation of Grain-Cd [35,59]. However, it has also been shown that leaves play an important role in the enrichment of grain Cd in wheat at the early stage of filling, and the contribution of leaves to grain Cd at maturity reaches 31.73% [60]. Therefore, the effect of leaves on grain Cd accumulation was small and occurred mainly in the early stages of grain filling.
The rachis is an organ in direct contact with the wheat kernel and can transport and distribute Cd to the grains Cd and glumes. Our study showed that in the PD field with higher Grain-Cd, there was a greater rachis-to-grain transport coefficient than rachis-to-glume transport coefficient; at lower Grain-Cd (e.g., ZC field), the rachis-to-grain transport coefficients were all less than the rachis-to-glume transport coefficients. Thus, the pattern of translocation and distribution from the rachis to the grain and glumes influenced the final grain Cd accumulation. LAWC-Cds were mainly dependent on decreased Cd translocation from roots to shoots and decreased rachis-to-grain remobilization [27]. It has been suggested that the rachis may control the transport of Cd from the internodes to the grain [55,56]. The head of the wheat spike (glume + rachis) is also an important Cd-accumulating tissue, accounting for a mean value of 21% of the total Cd accumulated in the upper part [51]. Recent studies have also shown that LAWC-Cd glumes have a high capacity for Cd retention, limiting the accumulation of grain Cd [26]. In summary, increasing Cd transport from the rachis to the glumes can limit grain Cd accumulation to a greater extent.
In addition to the enrichment and transport capacity of various wheat organs that affect Cd accumulation in the grain, aboveground biomass accumulation may be an important factor influencing Cd accumulation in the grain. Our research revealed that when the proportion of the dry weight of the grain to the total dry weight of the upper part (stem, leaf, rachis, glume, and grain) was greater than 0.47, the likelihood of Grain-Cd exceeding the standard increased (Figure S9). Perrier et al. (2016) also found that leaf biomass influenced changes in Grain-Cd and that the risk of excess grain accumulation of Cd increased when the proportion of stem, leaf, and spike biomass was less than the grain biomass [51]. Cd content and accumulation in all organs of wheat were highly significantly negatively correlated with Height, FID, SL, SN, FIL, and SIL, respectively, and highly significantly positively correlated with both GPS and AL (Figure 6). It has also been shown that spike length is negatively correlated with Grain-Cd [21]. To ensure low Cd accumulation, we recommend prioritizing wheat cultivars with long spike lengths, short awns, and long lengths of both the first and second internodes for LAWC-Cds.

4.3. Causal Relationships between Soil Properties, Wheat Growth Factors and Grain Cd Concentrations

Cd accumulation in wheat grains is affected by the soil environment and Cd transport processes among tissues and organs [24]. However, comprehensive analyses of the soil properties and Cd content in various organs of wheat, yield, and agronomic traits are lacking. Notably, in this study, structural equation modeling indicated that the direct effect of soil properties on Grain-Cd was 0.249, while soil properties indirectly influenced Grain-Cd through Wheat-Cd, with an indirect effect of 0.52 (Figure 8). This suggests that while soil properties significantly influenced Grain-Cd in LAWC-Cds, the Cd content in various wheat organs had a more direct effect on grain Cd accumulation. Therefore, the Grain-Cd of LAWC-Cds is influenced mainly by self-enrichment and translocation. The effects of cultivar and environment on grain Cd concentrations were less pronounced than those on wheat Cd concentrations and soil properties. The yield, agronomic traits, and dry weight had even smaller effects on Grain-Cd, and agronomic traits were mostly negative. Recent research has indicated that the use of LAWC-Cds is a green and safe technological measure for effectively realizing the safe use of contaminated farmland, and the cultivars have been widely applied in actual production [9]. Therefore, on Cd-contaminated farmland, the application of LAWC-Cds can greatly reduce Cd translocation and enrichment among wheat organs and reduce the direct effect of the Cd content of wheat organs on Grain-Cd.

5. Conclusions

In conclusion, LAWC-Cds limit Cd entry into wheat by reducing soil Cd uptake, and the Cd entering wheat is confined to the roots, reducing Cd translocation to the ground. Reducing Cd transport by stems is an important way to reduce Cd accumulation in grains. The smaller contribution of leaves to Cd accumulation in grains suggested that leaves may fix and limit Cd transport to a great extent. Increasing transport from rachises to glumes can limit grain Cd accumulation to a great extent. In Cd-contaminated soils, in addition to increasing soil pH and reducing DTPA-Cd and Soil-Cd, increasing soil EC and SOM may also be effective measures for reducing Grain-Cd. Although soil properties significantly influenced Grain-Cd in LAWC-Cds, the Cd content in all wheat organs had the most direct effect on grain Cd accumulation. The cultivar and environment had relatively small effects on Grain-Cd and yield, while agricultural traits and dry weight had the smallest effects. To ensure that LAWC-Cds have low Cd accumulation characteristics, we recommend prioritizing LAWC-Cds with shorter awns, longer spike lengths, and longer lengths of both the first and second internodes. Our study provides a research basis for exploring molecular and physiological barriers and the breeding of LAWC-Cds. Low Cd-accumulating wheat cultivars can effectively reduce the uptake of Cd in the grain. Howevre, there is still a risk of Cd accumulation in grains even in fields with a high risk of Cd contamination. In the future, we will combine soil conditioning and foliar barrier control technologies with low Cd-accumulating wheat cultivars to maximize the Cd-reducing capacity of low Cd-accumulating wheat to achieve safe use of Cd-contaminated farmland.

Supplementary Materials

The following supporting information can be downloaded at: https://www.mdpi.com/article/10.3390/agronomy14061191/s1, Figure S1: Differences in soil properties of 13 low Cd wheat cultivars before planting and at mature period in the BS; Figure S2: Differences in soil properties of 13 low Cd wheat cultivars before planting and at mature period in the PD; Figure S3: Differences in soil properties of 13 low Cd wheat cultivars before planting and at mature period in the ZC; Figure S4: Distribution of content in various organs of wheat in different planting plots; Figure S5: Spearman’s correlation analysis between soil properties and various wheat traits before planting wheat; Figure S6: Spearman’s correlation analysis between soil properties and various wheat traits at wheat maturity; Figure S7: Spearman’s correlation analysis of the amount of change in soil properties with wheat traits; Figure S8: Analysis of the importance of Cd content of each organ on Cd content of grains; Figure S9: Grain dry weight as a proportion of total aboveground dry weight in relation to grain cadmium content; Table S1. Soil properties at different sampling periods in the three study areas (Mean ± SD); Table S2: Thirteen wheat cultivars with low cadmium accumulation; Table S3: Field plot layout of the three experimental plots (BS, PD, and ZC); Table S4. Grain-Cd of 13 wheat cultivars grown in three study areas (Mean ± SD) (mg kg−1); Table S5: Spearman’s correlation between Cd content and TFs in different parts of wheat.

Author Contributions

Conceptualization, L.B. and J.D.; methodology, L.B., H.L., M.S., D.L., K.Z. and S.L.; software, L.B. and D.L.; validation, H.L. and M.S.; formal analysis, L.B.; investigation, S.D., X.L., C.N., H.L. and M.S.; resources, S.D., X.L., C.N. and J.D.; data curation, L.B. and J.D.; writing—original draft preparation, L.B.; writing—review and editing, J.D.; visualization, L.B., X.Y. and D.L.; supervision, X.Y. and J.D.; project administration, X.Y. and J.D.; funding acquisition, X.Y. and J.D. All authors have read and agreed to the published version of the manuscript.

Funding

This research was funded by the National Natural Science Foundation of China, grant number 41977144; Agricultural Major Technology Collaborative Promotion Plan of Shandong Province, grant number SDNYXTTG–2022–22; Youth Fund from Natural Science Foundation of Shandong Province, grant number ZR2023QD015; Postdoctoral Applied Research Project of Qingdao, grant number QDBSH20230102090; Research and Development Plan Initiated Projects of Jining, grant number 2023NYNS016.

Data Availability Statement

Data is contained within the article or Supplementary Material.

Conflicts of Interest

The authors declare no conflicts of interest.

References

  1. Gallego, S.M.; Pena, L.B.; Barcia, R.A.; Azpilicueta, C.E.; Iannone, M.F.; Rosales, E.P.; Zawoznik, M.S.; Groppa, M.D.; Benavides, M.P. Unravelling cadmium toxicity and tolerance in plants: Insight into regulatory mechanisms. Environ. Exp. Bot. 2012, 83, 33–46. [Google Scholar] [CrossRef]
  2. Shahid, M.; Dumat, C.; Khalid, S.; Niazi, N.K.; Antunes, P.M.C. Cadmium bioavailability, uptake, toxicity and detoxification in soil-plant system. Rev. Environ. Contam. Toxicol. 2016, 241, 73–137. [Google Scholar] [CrossRef] [PubMed]
  3. Irshad, M.A.; Rehman, M.Z.U.; Anwar-ul-Haq, M.; Rizwan, M.; Nawaz, R.; Shakoor, M.B.; Wijaya, L.; Alyemeni, M.N.; Ahmad, P.; Ali, S. Effect of green and chemically synthesized titanium dioxide nanoparticles on cadmium accumulation in wheat grains and potential dietary health risk: A field investigation. J. Hazard. Mater. 2021, 415, 125585. [Google Scholar] [CrossRef] [PubMed]
  4. Thijssen, S.; Cuypers, A.; Maringwa, J.; Smeets, K.; Horemans, N.; Lambrichts, I.; Van Kerkhove, E. Low cadmium exposure triggers a biphasic oxidative stress response in mice kidneys. Toxicology 2007, 236, 29–41. [Google Scholar] [CrossRef] [PubMed]
  5. Tuffour, A.; Kosiba, A.A.; Peprah, F.A.; Gu, J.; Zhou, Y.; Shi, H.F. Cadmium-induced stress: A close look at the relationship between autophagy and apoptosis. Toxicol. Sci. 2023, 194, 1–12. [Google Scholar] [CrossRef] [PubMed]
  6. Li, X.F.; Zhou, D.M. A meta-analysis on phenotypic variation in cadmium accumulation of rice and wheat: Implications for food cadmium risk control. Pedosphere 2019, 29, 545–553. [Google Scholar] [CrossRef]
  7. Wang, S.Y.; Wu, W.Y.; Liu, F.; Liao, R.K.; Hu, Y.Q. Accumulation of heavy metals in soil-crop systems: A review for wheat and corn. Environ. Sci. Pollut. Res. 2017, 24, 15209–15225. [Google Scholar] [CrossRef] [PubMed]
  8. Liu, N.; Zhang, S.B.; Guo, X.Y.; Ning, R.Y. Influencing factors of cadmium content in wheat grain: A meta-analysis and decision tree analysis. Environ. Sci. 2023, 44, 2265–2274. [Google Scholar] [CrossRef] [PubMed]
  9. Wang, L.; Zhang, Q.Y.; Liao, X.Y.; Li, X.H.; Zheng, S.N.; Zhao, F.H. Phytoexclusion of heavy metals using low heavy metal accumulating cultivars: A green technology. J. Hazard. Mater. 2021, 413, 125427. [Google Scholar] [CrossRef]
  10. Yang, S.S.; Wu, P.; Jeyakumar, P.; Wang, H.L.; Zheng, X.; Liu, W.J.; Wang, L.K.; Li, X.F.; Ru, S.H. Technical solutions for minimizing wheat grain cadmium: A field study in North China. Sci. Total Environ. 2022, 818, 151791. [Google Scholar] [CrossRef]
  11. Zaid, I.U.; Zheng, X.; Li, X.F. Breeding low-cadmium wheat progress and perspectives. Agronomy 2018, 8, 249. [Google Scholar] [CrossRef]
  12. Sheng, M.L.; Fei, X.F.; Lou, Z.H.; Xiao, R.; Ren, Z.Q.; Lv, X.N. Processing toxic metal source proxies appropriately for better spatial heterogeneity source apportionment. Sci. Total Environ. 2023, 898, 165516. [Google Scholar] [CrossRef]
  13. Bai, L.Y.; Huang, X.M.; Li, Z.L.; Li, S.S.; Lv, C.; Zhang, K.; Dai, J.L. Stability and adaptability of wheat cultivars with low cadmium accumulation based on farmland trials. Eur. J. Agron. 2023, 144, 126764. [Google Scholar] [CrossRef]
  14. Fu, Y.C.; Zhu, X.L.; Yuan, C.; Xie, X.L.; Li, P.X.; Zhu, W.; Li, H.L.; Liu, D.H. Cadmium absorption and enrichment in wheat and its cadmium pollution prediction: Research progress. Chinese Agric. Sci. Bull. 2020, 36, 37–41. [Google Scholar] [CrossRef]
  15. Greger, M.; Landberg, T. Role of rhizosphere mechanisms in Cd uptake by various wheat cultivars. Plant Soil 2008, 312, 195–205. [Google Scholar] [CrossRef]
  16. Huang, J.W.; Fan, G.P.; Liu, C.; Zhou, D.M. Predicting soil available cadmium by machine learning based on soil properties. J. Hazard. Mater. 2023, 460, 132327. [Google Scholar] [CrossRef] [PubMed]
  17. Bai, L.Y.; Ding, S.; Huang, X.M.; Chen, X.G.; Chen, Y.H.; Cao, X.Y.; Wang, X.R.; Yu, X.J.; Dai, J.L. Prediction of the cadmium content in grains of low-accumulating wheat cultivars and soil cadmium threshold for safe production. J. Clean. Prod. 2023, 417, 138081. [Google Scholar] [CrossRef]
  18. Nguyen, C.; Roucou, A.; Grignon, G.; Cornu, J.; Méléard, B. Efficient models for predicting durum wheat grain Cd conformity using soil variables and cultivars. J. Hazard. Mater. 2021, 401, 123131. [Google Scholar] [CrossRef]
  19. Yu, G.F.; Jiang, X.; Sun, L.; Wang, F.; Bian, Y.R. A review for effect of organic substances on the availability of cadmium in soils. Acta Ecol. Sin. 2002, 22, 770–776. [Google Scholar]
  20. Cieśliński, G.; Van Rees, K.C.J.; Szmigielska, A.M.; Krishnamurti, G.S.R.; Huang, P.M. Low-molecular-weight organic acids in rhizosphere soils of durum wheat and their effect on cadmium bioaccumulation. Plant Soil 1998, 203, 109–117. [Google Scholar] [CrossRef]
  21. Liu, N.; Huang, X.M.; Sun, L.M.; Li, S.S.; Chen, Y.H.; Cao, X.Y.; Wang, W.X.; Dai, J.L.; Rinnan, R. Screening stably low cadmium and moderately high micronutrients wheat cultivars under three different agricultural environments of China. Chemosphere 2020, 241, 125065. [Google Scholar] [CrossRef] [PubMed]
  22. Rizwan, M.; Ali, S.; Abbas, T.; Zia-Ur-Rehman, M.; Hannan, F.; Keller, C.; Al-Wabel, M.I.; Ok, Y.S. Cadmium minimization in wheat: A critical review. Ecotoxicol. Environ. Saf. 2016, 130, 43–53. [Google Scholar] [CrossRef]
  23. Zhou, M.; Li, Z.G. Recent advances in minimizing cadmium accumulation in wheat. Toxics 2022, 10, 187. [Google Scholar] [CrossRef] [PubMed]
  24. Xu, L.J.; Huang, Y.J.; Wang, Y.P.; Shen, A.L.; Gao, J.W. Research progress on the influencing factors of cadmium accumulation in wheat. J. Zhejiang Agric. Sci. 2022, 63, 2508–2511. [Google Scholar] [CrossRef]
  25. Liu, Y.K.; Lu, M.; Tao, Q.; Luo, J.P.; Li, J.X.; Guo, X.Y.; Liang, Y.C.; Yang, X.E.; Li, T.Q. A comparative study of root cadmium radial transport in seedlings of two wheat (Triticum aestivum L.) genotypes differing in grain cadmium accumulation. Environ. Pollut. 2020, 266, 115235. [Google Scholar] [CrossRef]
  26. Feng, Y.J.; Li, T.X.; Pu, Y.; Zhang, X.Z. Characteristics of cadmium accumulation and distribution in different organs of wheat with different cadmium—Accumulating type. Acta Agron. Sin. 2022, 48, 1761–1770. [Google Scholar]
  27. Shi, G.L.; Li, D.J.; Wang, Y.F.; Liu, C.H.; Hu, Z.B.; Lou, L.Q.; Rengel, Z.; Cai, Q.S. Accumulation and distribution of arsenic and cadmium in winter wheat (Triticum aestivum L.) at different developmental stages. Sci. Total Environ. 2019, 667, 532–539. [Google Scholar] [CrossRef]
  28. Mo, X.H.; Wang, M.K.; Zeng, H.; Wang, J.J. Rhizosheath: Distinct features and environmental functions. Geoderma 2023, 435, 116500. [Google Scholar] [CrossRef]
  29. Pande, P.M.; Azarbad, H.; Tremblay, J.; St-Arnaud, M.; Yergeau, E. Metatranscriptomic response of the wheat holobiont to decreasing soil water content. ISME Commun. 2023, 3, 30. [Google Scholar] [CrossRef]
  30. GB/T 23739-2009; Soil Quality-Analysis of Available Lead and Cadmium Contents in Soils-Atomic Absorption Spectrometry. Standards Press of China: Beijing, China, 2009.
  31. NY/T 1121.6-2006; Soil Testing Part 6: Method for Determination of Soil Organic Matter. China Agriculture Press: Beijing, China, 2006.
  32. HJ 802-2016; Soil Quality-Determination of Conductivity-Electrode Method. China Environmental Science Press: Beijing, China, 2016.
  33. HJ 962-2018; Soil-Determination of pH-Potentiometry. National Environmental Protection Standard of the People’s Republic: Beijing, China, 2018.
  34. Pan, G.X.; Andrew, C.C.; Albert, L.P. Modeling transfer and partitioning of potentially toxic pollutants in soil crop system for human food security. Chin. J. Appl. Ecol. 2002, 13, 854–858. [Google Scholar] [CrossRef]
  35. Liu, P.K.; Li, L.P.; Ippolito, J.A.; Xing, W.Q.; Wang, Y.L.; Wang, Y.L.; Cheng, Y.X.; Qiu, K.Y. Heavy metal distribution in wheat plant components following foliar Cd application. Chemosphere 2023, 322, 138177. [Google Scholar] [CrossRef] [PubMed]
  36. Huang, M.J.; Liu, X.; Zhou, S.R. Asynchrony among species and functional groups and temporal stability under perturbations: Patterns and consequences. J. Ecol. 2020, 108, 2038–2046. [Google Scholar] [CrossRef]
  37. Tian, P.; Liu, S.E.; Zhao, X.C.; Sun, Z.L.; Yao, X.; Niu, S.L.; Crowther, T.W.; Wang, Q.K. Past climate conditions predict the influence of nitrogen enrichment on the temperature sensitivity of soil respiration. Commun. Earth Environ. 2021, 2, 251. [Google Scholar] [CrossRef]
  38. Shi, Y.F.; Shi, S.H.; Huang, X.M. The application of structural equation modeling in ecology based on R. Chin. J. Ecol. 2022, 41, 1015–1023. [Google Scholar] [CrossRef]
  39. GB 15618-2018; Soil Environmental Quality-Risk Control Standard for Soil Contamination Ofagricultural Land. China Environmental Science Press: Beijing, China, 2018.
  40. GB 2762-2022; National Standards for Food Safety-Limits of Contaminants in Food. Standards Press of China: Beijing, China, 2022.
  41. Affholder, M.C.; Moazzami, A.A.; Weih, M.; Kirchmann, H.; Herrmann, A.M. Cadmium reduction in spring wheat: Root exudate composition affects Cd partitioning between roots and shoots. J. Soil Sci. Plant Nutr. 2023, 23, 3537–3547. [Google Scholar] [CrossRef]
  42. Zhang, X.Q.; Zhou, R.X.; Teng, L.D.; Chen, H.B.; Li, M.; Wang, L.; Zhran, M.; Cao, F.B. Genotypic variation in grain cadmium concentration in wheat: Insights into soil pollution, agronomic characteristics, and rhizosphere microbial communities. Environ. Pollut. 2024, 340, 122792. [Google Scholar] [CrossRef] [PubMed]
  43. Chen, C.; Li, Z.B.; Li, S.J.; Deng, N.X.; Mei, P. Effects of root exudates on the activation and remediation of cadmium ion in contaminated soils. Environ. Sci. Pollut. Res. 2020, 27, 2926–2934. [Google Scholar] [CrossRef] [PubMed]
  44. Zia-Ur-Rehman, M.; Bani Mfarrej, M.F.; Usman, M.; Azhar, M.; Rizwan, M.; Alharby, H.F.; Bamagoos, A.A.; Alshamrani, R.; Ahmad, Z. Exogenous application of low and high molecular weight organic acids differentially affected the uptake of cadmium in wheat-rice cropping system in alkaline calcareous soil. Environ. Pollut. 2023, 329, 121682. [Google Scholar] [CrossRef] [PubMed]
  45. Li, S.S.; Wang, M.; Zhao, Z.Q.; Li, X.Y.; Han, Y.; Chen, S.B. Alleviation of cadmium phytotoxicity to wheat is associated with Cd re-distribution in soil aggregates as affected by amendments. RSC Adv. 2018, 8, 17426–17434. [Google Scholar] [CrossRef]
  46. Li, J.; Zhang, P.Y.; Ye, J.P.; Zhang, G.M.; Cai, Y.J. Simultaneous in-situ remediation and fertilization of Cd-contaminated weak-alkaline farmland for wheat production. J. Environ. Manag. 2019, 250, 109528. [Google Scholar] [CrossRef]
  47. Vives-Peris, V.; de Ollas, C.; Gómez-Cadenas, A.; Pérez-Clemente, R.M. Root exudates: From plant to rhizosphere and beyond. Plant Cell Rep. 2020, 39, 3–17. [Google Scholar] [CrossRef] [PubMed]
  48. Abedi, T.; Mojiri, A. Cadmium uptake by wheat (Triticum aestivum L.): An overview. Plants 2020, 9, 500. [Google Scholar] [CrossRef] [PubMed]
  49. Zheng, S.L.; Qi, J.; Fu, T.W.; Chen, Y.J.; Qiu, X.Y. Novel mechanisms of cadmium tolerance and Cd-induced fungal stress in wheat: Transcriptomic and metagenomic insights. Ecotoxicol. Environ. Saf. 2023, 256, 114842. [Google Scholar] [CrossRef]
  50. Rezapour, S.; Atashpaz, B.; Moghaddam, S.S.; Kalavrouziotis, I.K.; Damalas, C.A. Cadmium accumulation, translocation factor, and health risk potential in a wastewater-irrigated soil-wheat (Triticum aestivum L.) system. Chemosphere 2019, 231, 579–587. [Google Scholar] [CrossRef]
  51. Perrier, F.; Yan, B.; Candaudap, F.; Pokrovsky, O.S.; Gourdain, E.; Meleard, B.; Bussière, S.; Coriou, C.; Robert, T.; Nguyen, C.; et al. Variability in grain cadmium concentration among durum wheat cultivars: Impact of aboveground biomass partitioning. Plant Soil 2016, 404, 307–320. [Google Scholar] [CrossRef]
  52. Zhang, D.Z.; Zhou, H.; Shao, L.L.; Wang, H.R.; Zhang, Y.B.; Zhu, T.; Ma, L.T.; Ding, Q.; Ma, L.J. Root characteristics critical for cadmium tolerance and reduced accumulation in wheat (Triticum aestivum L.). J. Environ. Manag. 2022, 305, 114365. [Google Scholar] [CrossRef]
  53. Zhang, L.X.; Gao, C.; Chen, C.; Zhang, W.W.; Huang, X.Y.; Zhao, F.J. Overexpression of rice OsHMA3 in wheat greatly decreases cadmium accumulation in wheat grains. Environ. Sci. Technol. 2020, 54, 10100–10108. [Google Scholar] [CrossRef] [PubMed]
  54. Hua, Y.P.; Chen, J.F.; Zhou, T.; Zhang, T.Y.; Shen, D.D.; Feng, Y.N.; Guan, P.F.; Huang, S.M.; Zhou, Z.F.; Huang, J.Y.; et al. Multiomics reveals an essential role of long-distance translocation in regulating plant cadmium resistance and grain accumulation in allohexaploid wheat (Triticum aestivum). J. Exp. Bot. 2022, 73, 7516–7537. [Google Scholar] [CrossRef]
  55. Shi, G.L.; Zhu, S.; Bai, S.N.; Xia, Y.; Lou, L.Q.; Cai, Q.S. The transportation and accumulation of arsenic, cadmium, and phosphorus in 12 wheat cultivars and their relationships with each other. J. Hazard. Mater. 2015, 299, 94–102. [Google Scholar] [CrossRef]
  56. Zhang, L.G.; Zhang, C.; Du, B.Y.; Lu, B.X.; Zhou, D.M.; Zhou, J.; Zhou, J. Effects of node restriction on cadmium accumulation in eight Chinese wheat (Triticum turgidum) cultivars. Sci. Total Environ. 2020, 725, 138358. [Google Scholar] [CrossRef]
  57. Yan, B.F.; Nguyen, C.; Pokrovsky, O.S.; Candaudap, F.; Coriou, C.; Bussière, S.; Robert, T.; Cornu, J.Y. Contribution of remobilization to the loading of cadmium in durum wheat grains: Impact of post-anthesis nitrogen supply. Plant Soil 2018, 424, 591–606. [Google Scholar] [CrossRef]
  58. Wang, Y.L.; Xu, Y.M.; Liang, X.F.; Wang, L.; Sun, Y.B.; Huang, Q.Q.; Qin, X.; Zhao, L.J. Soil application of manganese sulfate could reduce wheat Cd accumulation in Cd contaminated soil by the modulation of the key tissues and ionomic of wheat. Sci. Total Environ. 2021, 770, 145328. [Google Scholar] [CrossRef] [PubMed]
  59. Li, L.P.; Zhang, Y.Q.; Ippolito, J.A.; Xing, W.Q.; Qiu, K.Y.; Wang, Y.L. Cadmium foliar application affects wheat Cd, Cu, Pb and Zn accumulation. Environ. Pollut. 2020, 262, 114329. [Google Scholar] [CrossRef] [PubMed]
  60. Ma, C.; Xie, P.; Yang, J.; Lin, L.; Zhang, K.; Zhang, H.Z. Evaluating the contributions of leaf organ to wheat grain cadmium at the filling stage. Sci. Total Environ. 2022, 833, 155217. [Google Scholar] [CrossRef] [PubMed]
Figure 1. Differences in the spatial distribution of soil properties in the three experimental fields with low-Cd-accumulating wheat cultivars before planting and at maturity. (a,d,g,j,m) are the soil properties of the BS field. (b,e,h,k,n) are the soil properties of the PD field, and (c,f,i,l,o) are the soil properties of the ZC field. The columns and rows in the figure represent the length and width of the actual planting plot, respectively.
Agronomy 14 01191 g001
Figure 2. Analysis of mean differences in soil properties in the three experimental fields with low-Cd wheat cultivars before planting and during the mature period. (a) Differences in soil pH changes between at before planting and during the mature period; (b) Differences in soil EC changes between at before planting and during the mature period; (c) Differences in SOM changes between at before planting and during the mature period; (d) Differences in Soil-Cd changes between at before planting and during the mature period; (e) Differences in DTPA-Cd changes between at before planting and during the mature period. The Wilcoxon test was used for paired sample tests for different periods in the same field. The horizontal line in the box plot is the median. ****: Significant at the 0.0001 level. ***: Significant at the 0.001 level. **: Significant at the 0.01 level. ns: Not significant.
Agronomy 14 01191 g002
Figure 3. Spearman’s correlation analysis of soil factors with wheat agronomic traits, Cd content, and Cd accumulation before planting and at maturity. (a) Spearman’s correlation analysis of soil properties with wheat agronomic traits, Cd content, and Cd accumulation before wheat planting. (b) Spearman’s correlation analysis of soil properties with wheat agronomic traits, Cd content, and Cd accumulation during the mature period of wheat. (c) Spearman’s correlation between the amount of change in soil property differences and wheat agronomic traits, Cd content, and Cd accumulation before planting and during the mature period. ****: Significant at the 0.0001 level, ***: significant at the 0.001 level, **: significant at the 0.01 level, and *: significant at the 0.05 level.
Agronomy 14 01191 g003
Figure 4. BCF and TF values of different wheat cultivars in the three fields for Cd in various organs. (a) BCFs of Cd by organs of all LAWC-Cds from the three fields. (b) BCFs of Cd by organs of LAWC-Cds from the BS field. (c) BCFs of Cd by organs of LAWC-Cds from the PD field. (d) BCFs of Cd by organs of LAWC-Cds from the ZC field. (e) TFs of Cd by organs of all LAWC-Cds from three fields. (f) TFs of Cd by organs of LAWC-Cds from the BS field. (g) TFs of Cd by organs of LAWC-Cds from the PD field. (h) TFs of Cd by organs of LAWC-Cds from the ZC field.
Agronomy 14 01191 g004
Figure 5. Distribution of Cd accumulation and percentage in each organ in low-Cd-accumulating wheat. (a) Distribution of the percentage of Cd accumulation in each organ of low-Cd-accumulating wheat in a single plant. (b) Cadmium accumulation in various organs of low-Cd-accumulating wheat from a single plant.
Agronomy 14 01191 g005
Figure 6. Correlations between grain Cd content and agronomic traits, yield, dry weight, Cd content, and Cd accumulation in wheat. ***: Significant at the 0.001 level. **: Significant at the 0.01 level. *: Significant at the 0.05 level.
Agronomy 14 01191 g006
Figure 7. Linear regression of cadmium content in various organs of wheat with cadmium content in grains. (a) Linear regression of root Cd content with grain Cd content. (b) Linear regression of stem Cd content with grain Cd content. (c) Linear regression of leaf Cd content with grain Cd content. (d) Linear regression of rachis Cd content with grain Cd content. (e) Linear regression of glume Cd content with grain Cd content. ρ is the Spearman correlation coefficient. The red dots in the figure are linear regression scatter plots. The blue dots on the right side of each subplot show the distribution of Cd content in grains, and the blue dots on the top side show the distribution of X-axis indicators. The red box-and-line plot indicates the distribution of the content of each indicator.
Agronomy 14 01191 g007
Figure 8. SEM of the causal relationships between soil properties and wheat growth factors and Grain-Cd. (a) SEM relationship between the Cd content of grains and various indicators of wheat and soil. The blue and red arrows in the figure indicate positive and negative effects, respectively, and the straight lines and dotted dots of the arrows indicate significance and insignificance, respectively. The main evaluation criteria of the model were as follows: Fisher’s C value for the chi-squared test to determine the overall fit of the model to derive the Akaike information criterion (AIC) value, the AIC value (the smaller, the better) and the p-value > 0.05 to indicate that the model structure was reasonable [38]. (b) SEM-standardized effect values between the Cd content of grains and various indicators of wheat and soil. ***: Significant at the 0.001 level. **: Significant at the 0.01 level. *: Significant at the 0.05 level.
Agronomy 14 01191 g008
Disclaimer/Publisher’s Note: The statements, opinions and data contained in all publications are solely those of the individual author(s) and contributor(s) and not of MDPI and/or the editor(s). MDPI and/or the editor(s) disclaim responsibility for any injury to people or property resulting from any ideas, methods, instructions or products referred to in the content.

