Article

Comparison of Oil Extraction and Density Extraction Method to Extract Microplastics for Typical Agricultural Soils in China

1
Jiangxi Provincial Key Laboratory of Soil Erosion and Prevention, Nanchang 330000, China
2
Institute of Soil and Water Conservation, Northwest A&F University, Yangling 712100, China
3
Institute of Soil and Water Conservation, Chinese Academy of Sciences & Ministry of Water Resources, Yangling 712100, China
*
Author to whom correspondence should be addressed.
Agronomy 2024, 14(6), 1193; https://doi.org/10.3390/agronomy14061193
Submission received: 19 April 2024 / Revised: 21 May 2024 / Accepted: 28 May 2024 / Published: 1 June 2024
(This article belongs to the Section Agricultural Biosystem and Biological Engineering)

Abstract

:
Microplastic pollution in agricultural soil threatens soil quality and human health which has attracted extensive attention worldwide. However, there is no uniform standard for microplastic extraction methods and the identification of microplastic component in different typical agricultural soils. In this study, an artificial simulation adding experiment was used in eight typical agricultural soil samples in China. The aim of the study was to use different methods for extraction, comparing the extraction rates of four microplastics and their influence on polymer identification using ATR- FTIR. The two separate methods were oil extraction (water + oil and saturated NaCl solution + oil), and density method (saturated NaCl solution). The four types of microplastics include polyethylene terephthalate (PET), polypropylene (PP), polystyrene (PS), and polyethylene (PE). We found that the oil extraction method effectively extracted four types of microplastics in agricultural soils, which varied from 83.33% to 100.00%. However, the extraction rate of PET under the oil extraction method and PP under the density method from Southern laterite area was lower than other soils. The presence of iron and aluminum ions influenced the extraction rates of microplastics in the Southwest laterite area. With the increase in microplastic density, the extraction rates of the density method decrease. The oil extraction methods with the cleaning of residual oil were recommended for the higher density microplastics. The density method was recommended for the lighter microplastics in agricultural soils. However, these two extraction methods were not ideal to extract the microplastics from the Southern laterite area and the appropriate extraction methods for laterite need to be further studied in the future. Our results can provide technical support for the extraction treatment and scientific microplastic pollution control of typical agricultural soils with different erosion areas.

1. Introduction

Plastic has become an integral component of human life owing to its excellent properties [1,2,3,4]. However, the increasing demand and production of plastic products, unconscionable handling methods and management have led to the persistent increase in plastic garbage. Plastic that remains in the environment breaks into microplastics (a size less than 5 mm) through physical, chemical, and biological processes [5,6,7]. At present, the research on microplastics mainly focuses on their occurrence and distribution in water environments, but there is a lack of extraction methods for microplastics from different agricultural soils.
Agricultural soil was theoretically considered as the primary repository for various pollutants, including microplastics [8]. Microplastics enter the agricultural soil environment mainly through the degradation of plastic film, sewage irrigation, atmospheric deposition, and the friction between tires and the ground which can enter the soil under the action of wind [9,10]. The microplastics in the soil environment can be divided into two parts according to the migration process: horizontal and vertical migration (Figure 1) [11,12]. Microplastic accumulation obviously influences soil physicochemical properties, soil fertility, enzyme activities, and microbial diversity, thereby threatening agricultural soil ecological functions and global food production [1,11,13,14]. In addition, microplastics can also adsorb other contaminants, such as heavy metals [15], pesticides [16] and antibiotics [17], which make them remarkably hazardous to organisms [18]. Therefore, accurate and correct extraction and detection methods of microplastics play an important role in the assessment, control and prevention of microplastic pollution in agricultural soil systems.
There are many methods, which include screening and filtering, visual sorting, chemical digestion and hyperspectral imaging, to detect microplastics in soil [19]. Each microplastic method has its principles, application scopes and shortcomings. The screening and filtering is mainly used for the initial processing. The visual sorting method, which can be used to analyze microplastic in various environmental media, always classifies the microplastic size and morphological structure through naked eye observation or optical microscopy. Accidental human factors during operation may lead to errors in analysis results [20]. The density extraction method was the most commonly used method for the separation of microplastics from soil, which mainly uses the density difference between microplastics and soil to float microplastics in the supernatant [21]. The commonly used solutes are CaCl2, NaI, ZnCl2 and NaCl, but CaCl2, NaI and ZnCl2 are expensive, costly and heavily polluting to the environment [22]. On the contrary, the saturated NaCl solution is inexpensive, easily available, and environmentally friendly [23]. Based on the advantages of saturated NaCl, it is widely used in the extraction of microplastics from different urban soils. For example, the average microplastic abundance from farmland soils in Qinghai province and Wuhan city was 2795.7 and 1.6 × 10⁵ items kg−1, respectively [22,24]. Consequently, the total recovery of microplastics was up to 96.1% ± 7.4 by using a filtered canola oil extraction solution [25]. However, the residual oil on the microplastic surface affects the component identification of microplastics. Therefore, selecting a suitable method to extract microplastics from agricultural soil can provide a basis for subsequent research.
The extraction methods of microplastics always include sampling, pre-treatment, flotation, filtration and digestion. The qualitative and quantitative analysis of microplastics is mainly performed through the following methods: visual [26], scanning electron microscopy (SEM) [27], transmission electron microscopy (TEM) [28], Pyrolysis Gas Chromatography-Mass Spectrometry (Py-GC/MS) [29], Fourier Transform infrared (FTIR) [30] and Raman spectroscopy (RM) [31]. The visual method is simple, quick and economical, but it is only applicable to the larger plastics. Even with the help of a microscope, it is impossible to observe microplastics smaller than 100 μm, and this causes the high error rate for the identification of microplastic polymer types [32]. SEM is commonly used to research the aging of microplastics, and TEM is only used to study the combination of microplastics and plants [20]. The Py-GC/MS can determine the polymer types of microplastics according to the results of thermal decomposition. But it will destroy the structure of microplastics and the quantitative analysis of microplastics cannot be achieved [33]. The RM and FTIR methods do not cause damage to the sample and can obtain detailed information about microplastics characteristics [34]. The RM method is more suitable for detecting microplastics of a smaller size, with the capability of identifying microplastics as small as 1 μm [35]. But it can be interfered with by fluorescent material, including the oil treatment residual oil on the surface of microplastics [36]. The FTIR spectra seem very suitable to predict various indices due to the distinctive signatures of microplastic components in the mid-infrared region, in which different molecular functional groups can be easily recognized through spectral libraries [37]. In addition, FTIR spectra have the advantages of high sensitivity, simple operation and a slightly lower price. In this study, the microplastics were extracted using the oil separation and density separation methods. The effects of the extraction methods on microplastic polymers were detected using FTIR.
In recent years, microplastics have been a research hotspot in environment science, and many studies have been conducted to practice the extraction and identification of microplastics [38]. However, few studies have examined the microplastic suitability of unified detection standards for microplastics in different agricultural soil types in China [39]. Therefore, an artificially simulated microplastics experiment, which was more easily controlled and plainly observed, was needed to study the appropriate extraction and identification method. The soil samples, which were collected from eight agricultural soil types as defined by the regionalization of soil and water conservation of China, were selected as test objects. Three treatments, including cyri rapeseed oil extraction (water + oil and saturated NaCl solution + oil) and the density separation method (saturated NaCl solution), were used in the study. The study evaluated the influence of different methods on the separation efficiency and component property identification of different microplastic types with various densities. The objective of this study was to summarize the suitable microplastic detection methods in different agricultural soils in China. The findings will provide support and a valuable reference for the control and prevention of microplastic pollution in agricultural soil.

2. Materials and Methods
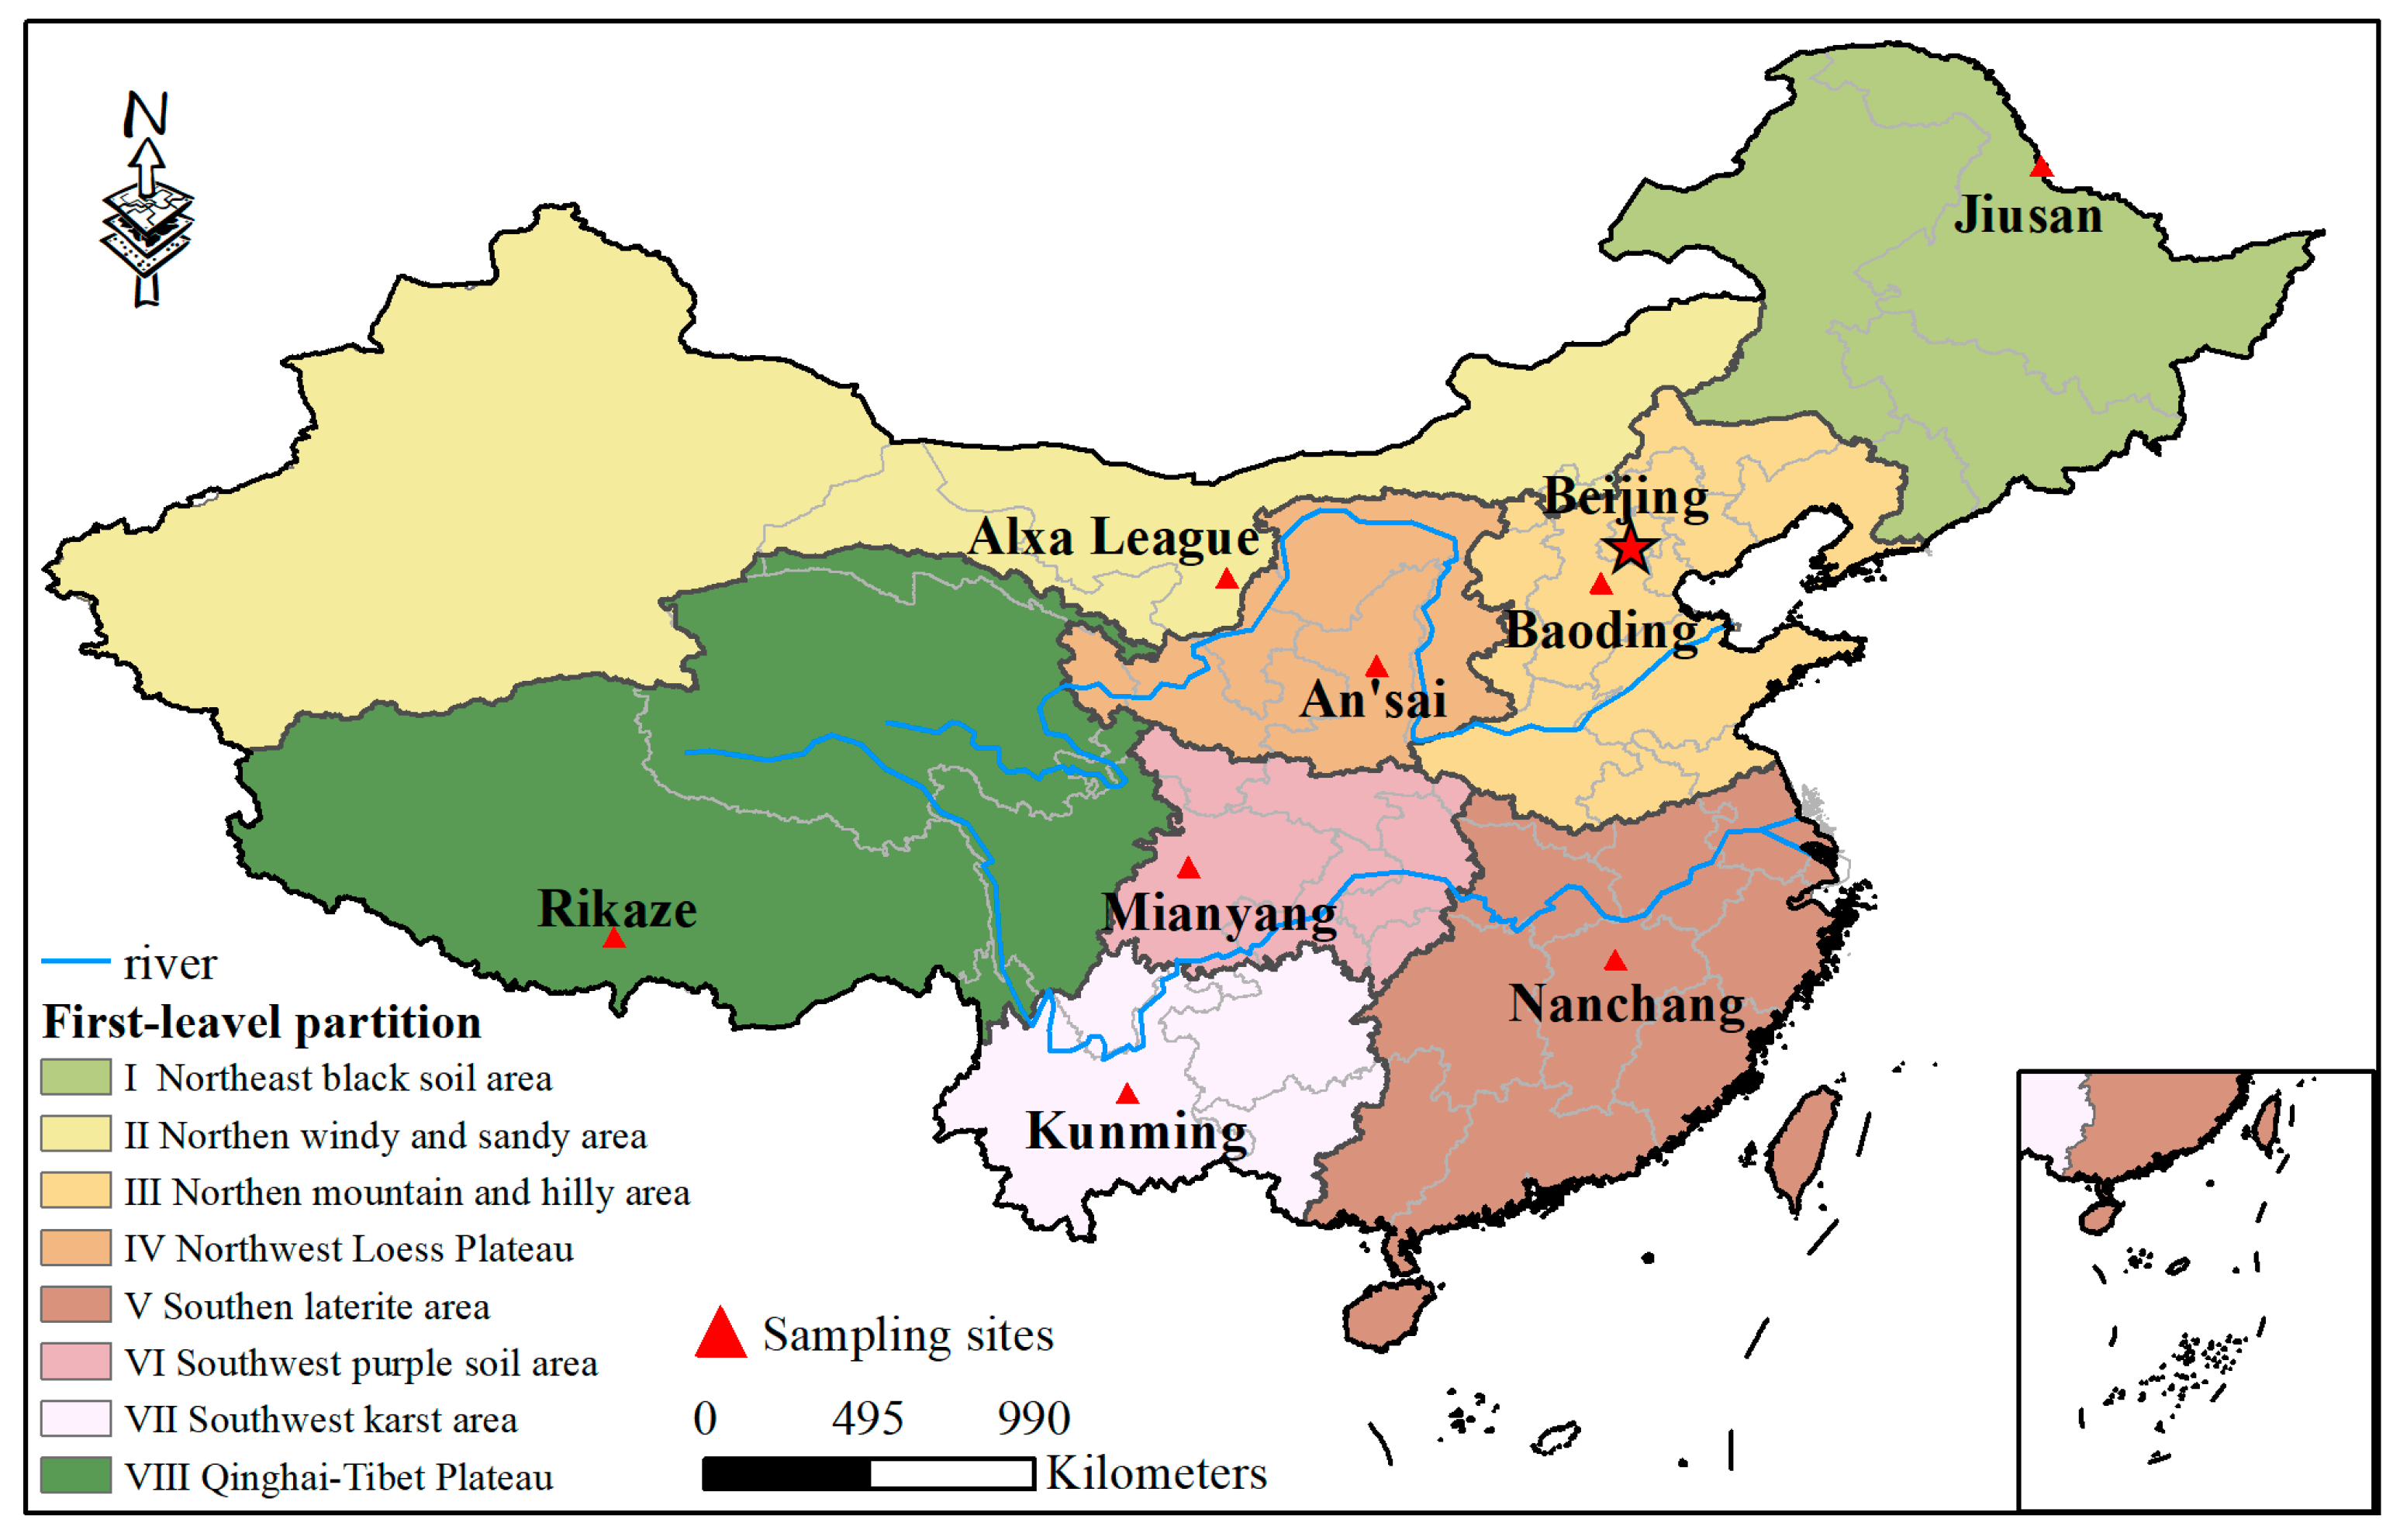
2.1. Soil Sample

Adequately considering the similarity and interval difference in soil erosion, the regionalization of soil and water conservation of China can be divided into eight regions, i.e., Northeast black soil area (the I region), Northern windy and sandy area (the II region), Northern mountain and hilly area (the III region), Northwest loess plateau (the IV region), Southern laterite area (the V region), Southwest purple soil area (the VI region), Southwest karst area (the VII region), and the Qinghai–Tibet plateau (the VIII region). Soil samples were collected from 8 provinces (Figure 2). In each agricultural soil, three subplots (10 × 10 m), which were at least 10 m apart from each other, were set up as replications for soil sampling. In each sub-sampling site, five topsoil samples (0–20 cm) were collected with a shovel and mixed evenly to form a composite sample which was approximately 3 kg. The soil samples were carefully packed into aluminum boxes for laboratory analysis. In addition, handheld GPS was used for the positioning and recording of the situation near the sampling point. The physical and chemical properties of the soil reflect the health of the soil; these characteristics are shown in Table 1, in order to understand the differences in soil nutrients in different regions and the impact of microplastics. Soil types, main crops, and area of the regionalization of soil and water conservation of China are derived from the “Zoning of soil and water conservation in China”.
The I region is located in the northeast of China with black topsoil as the dominant ground composition. The area has a typical cold temperate continental monsoon climate, which is contributes to the higher organic matter content [39]. Water and wind erosion area account for 138,200 and 77,800 km2, respectively. The II region is crisscrossed by wind and water erosion. The soil type is characterized by weathered sandstone and desert sand with coarser particles [40].
The III region is located in the central and eastern part of China, with brown soil as the dominant ground component. Soil erosion is mainly water erosion. Soil nutrient content, such as available phosphorus ammonium nitrogen and nitrate nitrogen, is higher than other areas. The IV region is mostly covered by loess soil with a fine texture and is rich in goethite [39]. Loess is barren and has a strong erodibility, which is contributes to the soil erosion.
The soil type of the V region is mainly laterite. Laterite is formed in a long-term humid and warm climate. The parent materials are quaternary red clay [41]. The soil is potassium deficient, but rich in iron and aluminum oxides. Heavy storms have been demonstrated as the main driving force of severe soil erosion in the region.
The surface soil of the VI region is dominated by purple soil, which is the main cultivated soil in the upper reaches of Yangte River, in the southwest of China [42]. The main soil erosion is gulley erosion. The soil type of the VII region is formed by carbonate weathering and is rich in calcium. The region is crisscrossed by landslides and debris flows. The VIII region is mostly covered by brown soil. An alpine steppe climate contributes to severe freeze–thaw erosion. The types of soil erosion and soil material composition are shown by spatial heterogeneity and different distribution in these eight regions.
Table 1. Physical and chemical characteristics of the four agricultural soil types and the basic information of the regionalization of soil and water conservation of China.
Total Nitrogen Content/g·kg−1Total Phosphorus Content/g·kg−1Available Phosphorus/mg·kg−1Organic Matter Content/g·kg−1pHAmmonium Nitrogen/mg·kg−1Nitrate Nitrogen/mg·kg−1Soil Bulk Density/g·cm−3Soil TypesMain CropsArea/106 km2Reference
Northwest black soil area(I)1.350.75.5516.44.8611.548.451.31Black soilWheat1.09The research group
determined
Northern windy and sandy area (II)0.310.5261.069.657.670.325.571.46Weathered sandstone,
desert sand
Corn2.39Wang [43]
Molatudi [44]
Northern mountain and hilly area (III)0.870.7258.319.37.7929.1423.771.36Brown soilWheat0.81Xue [45]
Li et al. [46]
Northwest loess plateau (IV)0.830.816.67.538.142.6912.61.2Loess soilWheat; corn0.56The research group
determined
Southwest red soil area (V)1.50.1512.513.14.973.957.251.37LateriteRice1.27The research group
determined
Southwest purple soil area (VI)0.810.849.028.758.23.1717.691.34Purple soilTea0.51The research group
determined
Southwest karst area (VII)1.110.682.5315.375.5826.928.91.28Laterite,
Grey soil
Barley0.7Meng et al. [47]
Zheng [48]
Qinghai–Tibet plateau (VIII)2.790.8424.828.897.761.037.891.13Brown soilBarley2.24Liu et al. [49]

2.2. Microplastic Preparation

In this study, colorful PET, PP, PS, and PE were selected as typical microplastic samples for easy recognition and identification which were all purchased from a local market (Figure 1). The densities of the four microplastics were 1.37, 0.84, 0.92, and 0.95 g·cm−3, respectively. Microplastics were sourced from transparent mineral water bottles (PET), blue plastic water pipes (PP), white fast food boxes (PS), and black agricultural plastic mulching film (PE). To make the simulated plastic similar to the plastic in real soil, we exposed the plastic to ultraviolet light for 24 hours. According to the definition of microplastics, and for easy observation, all of these processed plastics were manually cut with scissors to make the particle size less than 1 mm. The colors of PET, PP, PS and PE were transparent, blue, white, and black. Because each typical microplastic sample selected was different in material and color, as well as large in size, they could be easily picked out by the naked eyes. In addition, the shape of the microplastics was fragment and film.

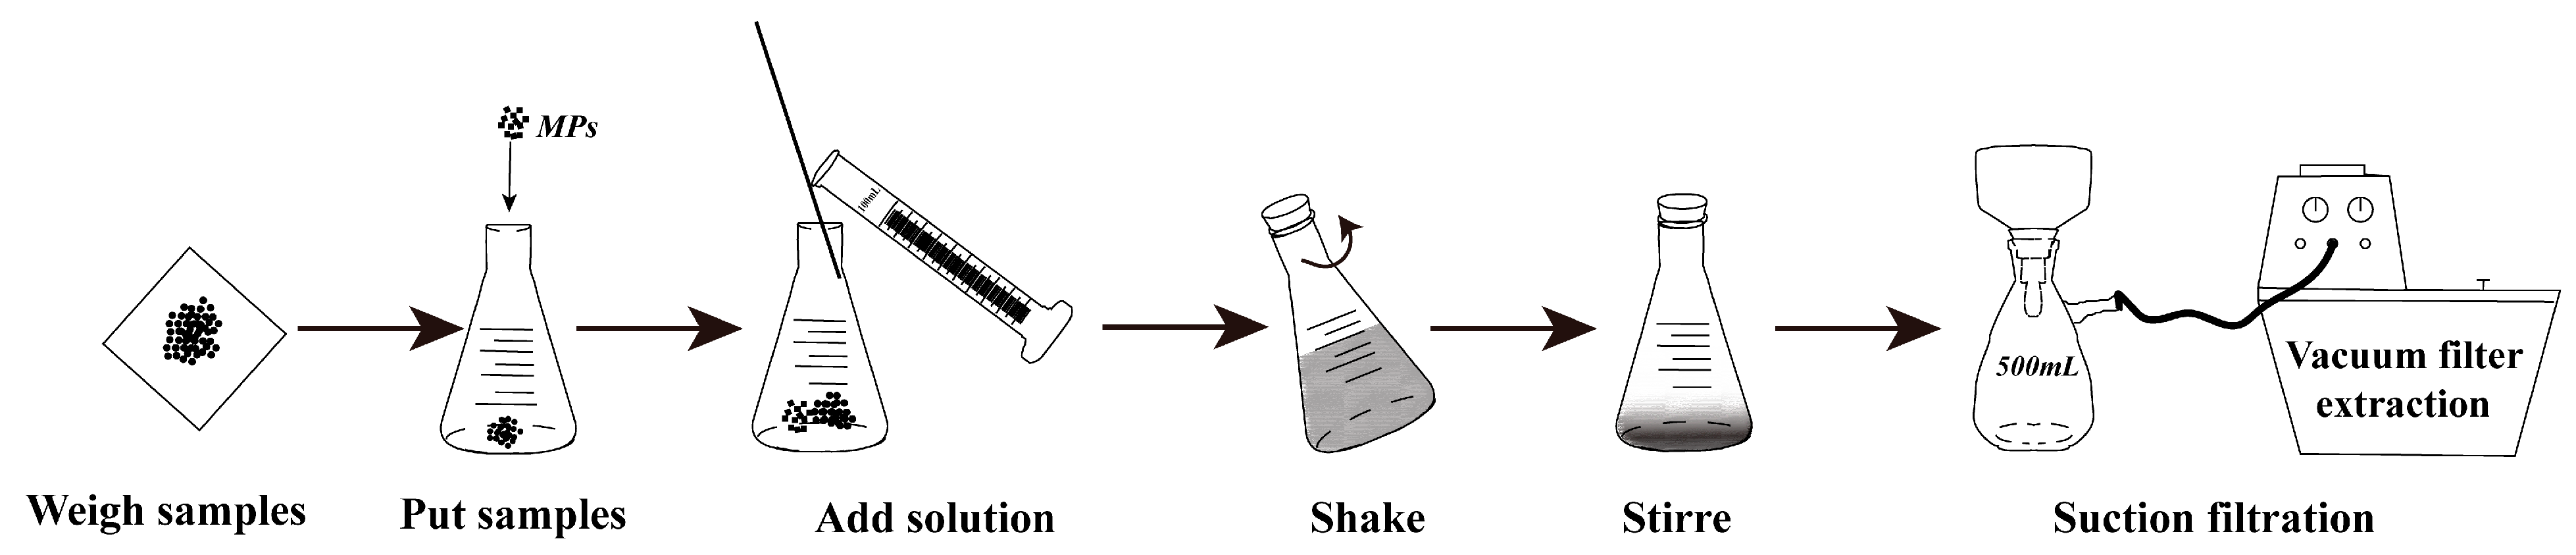
2.3. Extraction and Analysis of Microplastics

In the simulation experiment, eight agricultural soils from the regionalization of soil and water conservation of China and four typical microplastics (PET, PP, PS, and PE) were selected. Microplastics in agricultural soil were extracted using the following three treatments: water + cyri rapeseed oil (M1, Shanxi Xirui Group Co., Ltd., Xi’an, China), saturated NaCl solution + cyri rapeseed oil (M2), and saturated NaCl solution (M3). Three replications were carried out for each sample, for a total of 288 tests. The M1 and M2 treatments utilized the hydrophobicity and lipophilicity of microplastics, and the microplastics were absorbed to the supernatant. The M3 treatment takes advantage of the density difference between NaCl solution and microplastics, so that the microplastics in the soil float on the surface.
In order to reduce the interference of microplastics in the agricultural soil samples, the following measures were taken. Briefly, each soil sample of 2 kg was dried in an oven at 105 °C for 24 h to a constant weight and then sieved through a 2 mm mesh. Then, the dried soil samples and NaCl solution were mixed in a glass conical flask and stirred with a clean glass rod for 5 min until reaching a complete mix. After settling for 24 h, the supernatant with microplastics was transferred. The remaining soil samples in the conical flask were used for the artificial addition simulation test. The dried remaining soil samples of 50 g, 10 microplastic fragments (PP, PE, PS or PET) were soaked with 100 mL of the solution (M1, M2, or M3) in a 250-mL glass conical flask. The mixtures were stirred for 5 min with a glass bar. After settling for 24 h, the supernatant with plastics was transferred to a conical flask. The supernatants were treated with 20 mL of 30% H2O2 to degrade organic matter, and then stored in an oven (70 °C) for 72 h. Finally, the supernatant was filtered using filter paper (pore size: 0.45 μm, diameter: 100 mm, China). To remove residual oil that might subsequently interfere with FTIR analysis, the filters were incubated in 5 mL absolute ethanol and reacted for 2 min. This process was repeated until no obvious oil shine appeared on the filter paper. The filter papers were stored in a clean glass dish and dried at room temperature (Figure 3).
All dried filters with microplastics were visually observed, and the residual correction results were searched in the agricultural soils. Subsequently, the chemical composition and polymer types of microplastics were identified with ATR-FTIR, and the scan range ranged from 400 to 4000 cm−1. The FTIR spectra were compared to Hummel polymer library that included spectra of all common polymers and natural materials.

2.4. Quality Assurance and Quality Control

In order to avoid the chance of microplastic pollution, all glassware and instruments were cleaned and rinsed three times with distilled water, and covered with aluminum foil after each step. All reagents (saturated NaCl solution, H2O2 solutions) were passed through filter paper (0.45 μm, 100 mm Ø) before use. Clean 100% cotton clothing was worn during whole experiment to avoid contact with external synthetic fibers. Three blank tests were conducted, in which distilled water was used instead of dried soil samples. Other steps were consistent with the above for artificially simulating the addition of microplastics. The result showed that there were no microplastics in the environment.

3. Results and Discussion

3.1. Extraction Rates of Microplastics and Comparison the Influence of Different Method

The extraction rates of the microplastics in the eight typical agricultural soils are illustrated in Figure 4. For the higher density PET (1.37 g·cm−3) in eight agricultural soils, the oil extraction method was more effective than using the density extraction method. Figure 4 showed that the extraction rates of PET ranged from 83.33% to 100.00% with oil extraction methods and only 0.00% to 20.00% using density extraction methods in agricultural soils, except at the V region (the soil type is laterite). Dong et al. [50] also found that the recovery rate of PET and PVC microplastics reached more than 90% under oil extraction and M2 treatment. In the V region, the extraction rates of PET were 50.00% and 56.60% using M1 and M2 treatment, respectively. Crichton, Noël, Gies and Ross [25] adopted the oil extraction method to extract fine particles from river sediments, and the extraction rate reached 96.80% ± 1.16, which was higher than the extraction rate in this experiment. In addition, Lekše et al. [51] showed that the recovery of PS and PP microplastics reached 100% under oil extraction. The difference in microplastic extraction rates may have been caused by the heterogeneity among the extracted objects and the difference in extraction solution between canola oil and rapeseed oil.
The extraction rates of PP, PS, and PE were all greater than 80.00% for the density extraction method in agricultural soils, but the extraction rate of PP was only 56.67% in the V region (Figure 4V). The low extraction rate of PP microplastics in the V region may be attributed to the fact that PP microplastics were more likely to be affected by Fe3+. The extraction rate of PET only ranged from 0.00% to 20.00%. This was because the density of the NaCl solution was close to the density of PET, which was 1.20 g·cm−3. PET would not be suspended on the surface but would slowly settle at the bottom [52].
In the V region, the extraction rates of PET under the oil extraction method and the PP using the density extraction method were lower than those of other agricultural soils. This result may have occurred because they were rich iron oxides and aluminum oxides, and its Fe2O3 and Al2O3 contents were 9.44–50.36% and 15.41–26.05%, respectively [53]. In addition, Fe3+ and Al3+ can absorb microplastics in the agricultural soil [54]. The migration of microplastics in agricultural soil was affected by the concentration of Fe3+ and Al3+, pH value and the content of dissolved organic matter [55]. In addition, the content of organic matter in the V region was twice that in the IV region. With the increase in organic matter content, the adsorption points of microplastics in agricultural soil decrease, thus increasing the ability of microplastics to migrate and resulting in a loss of microplastics in the surface soil [54]. It was also possible that the microplastics in the V region were more likely to age during the processes of cultivated land friction, ultraviolet radiation and rainwater interchange, which degraded them further, and the specific surface area and surface roughness of microplastics could be increased [56]. Turner and Holmes [57] showed that the combination of organic matter and microplastics resulted in a lower extraction rate in the V region than in other agricultural soils during the weathering process.

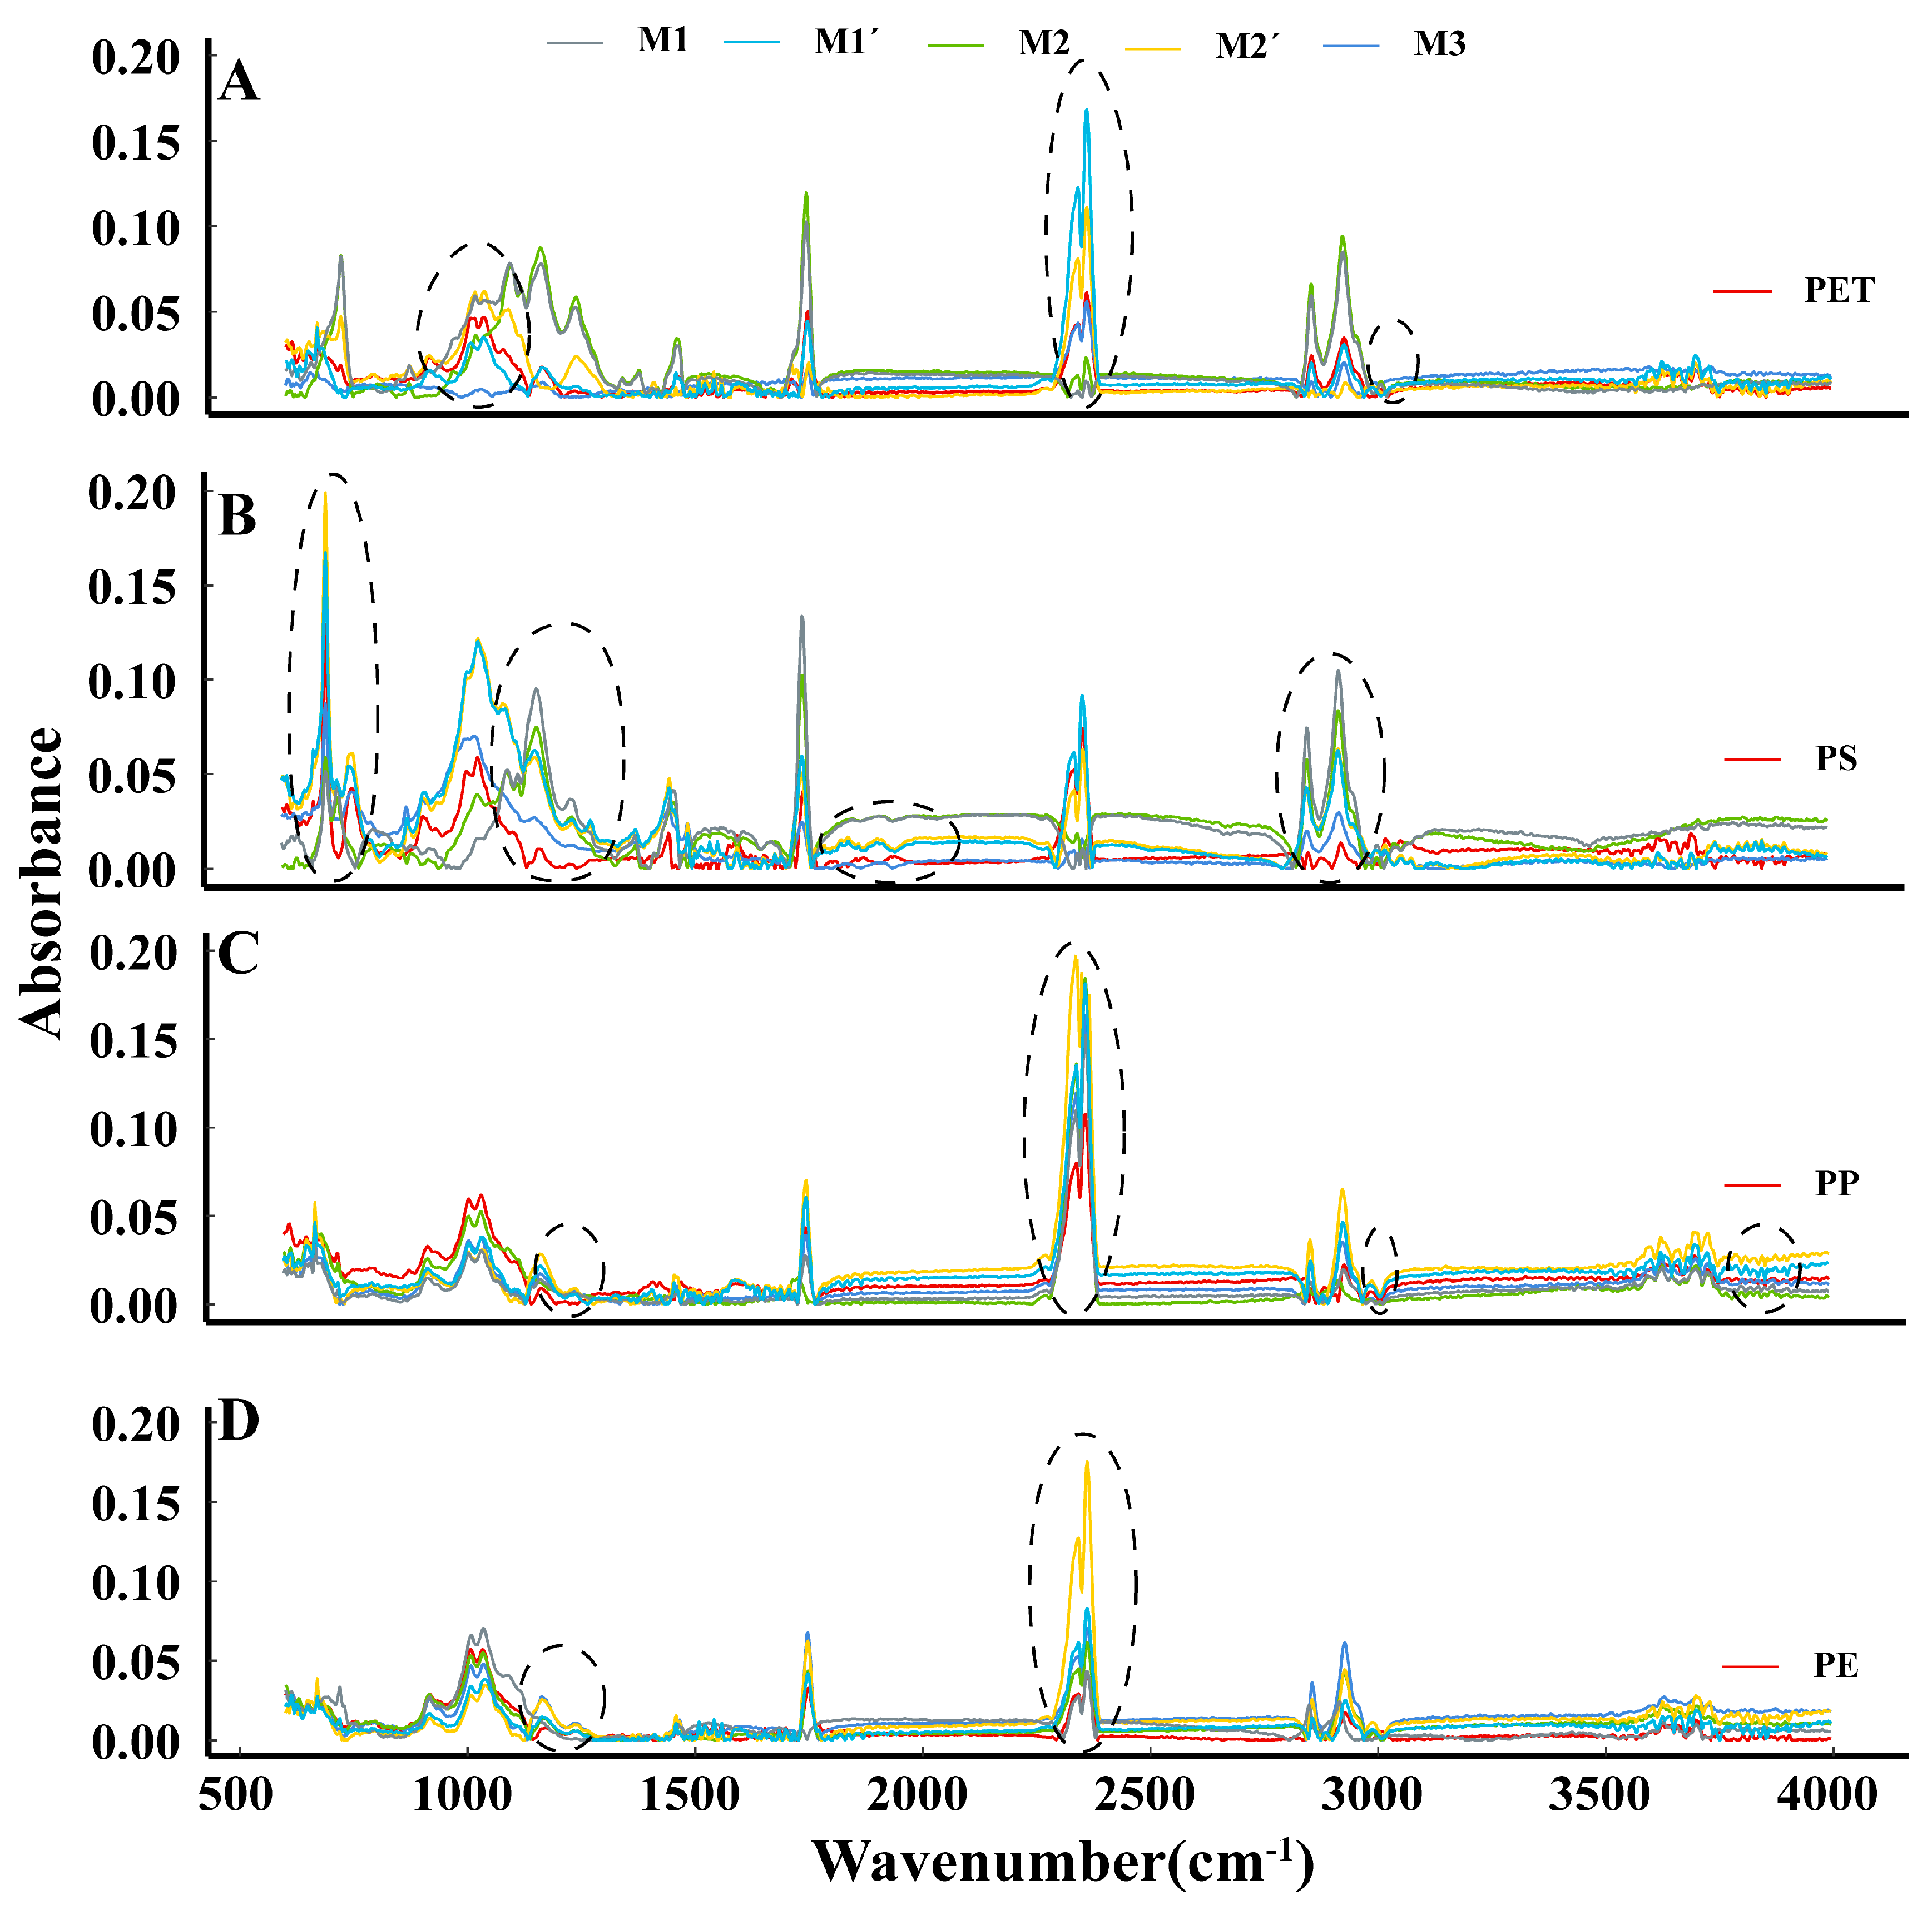
3.2. Changes in Microplastic Spectrograms under the Different Methods

The background image of FTIR was affected by different reagents and processing methods, which interfered with the identification of microplastic components [58]. Four microplastics were shown to peak at 1150, 1750, and 3000 cm−1 under the oil treatment method in the eight typical agricultural soils due to the oil adhering to microplastics. The infrared spectra of the microplastics were consistent with that of the original blank sample after cleaning. For instance, PS in the IV regions showed a peak in the range of 2750–3000 cm−1 when it was not cleaned under the M1 treatment, and peak was reduced after cleaning as shown in Figure 5. However, the peak shape did not change compared with that before cleaning the oil, and a new peak appeared in the fingerprint area, which was inconsistent with the spectrum of the original blank sample. Crichton, Noël, Gies and Ross [25] pointed out that the addition of oil would interfere with the infrared spectrum and that the use of anhydrous ethanol for cleaning had good compatibility. The spectra of PET and PP followed that of the original sample after cleaning. In the V region, the peaks of PE and PS were reduced after cleaning at 1150, 1750, and 3000 cm−1, but some new peaks appeared in other waveband wavelengths. Under the M1 treatment, the peak value of PP increased after cleaning at 1750 cm−1, and the spectral functional group area waveforms of microplastics that had been soaked in anhydrous ethanol were closer to that of the original sample (Figure 5). In the VI region, the infrared spectra of the four types of microplastics were identical to the original sample spectra after cleaning (Figure 5).
Figure 5 showed that the PS microplastics cleaned with absolute ethanol still had peaks at the waveband shown as a low value of the characteristic absorption peak, and the peaks were lower than before cleaning for the IV region. The spectra of the other three types of microplastics were consistent with the original sample spectrum. This peak may have developed because the benzene ring in PS forms π-π bonds with organic pollutants, and the adsorption was enhanced [59]. Therefore, the oil remains in the pores of the sample, which interfered with the measurement of the sample. In the I region, PET showed a low value of the characteristic absorption peak in the band peaks in the range of 2250–2500 cm−1, and the infrared spectrum of the sample after washing was in accord with that of the original sample under the M2 treatment (Figure 5). The characteristic absorption peaks of PP were not apparent in the wavelength range of 2750–3000 cm−1 or at 1750 cm−1 in the V region (Figure 5). However, the characteristic absorption peaks were similar to that of the original sample spectrum after cleaning. It may be that some substance in laterite reacted with PP and anhydrous ethanol, which destroyed the structure of PP and reduced the oil content between the pores of the sample, thus reducing the interference with the infrared spectrum background. In the VI region, PE had a peak shape similar to that of the original sample in the band peaks in the range of 1000–1250 cm−1 under the M2 treatment, but the value of the characteristic absorption peaks increased after cleaning (Figure 5). The characteristic absorption peaks of PET and PP were still high at 1150, 1750, and 3000 cm−1 after cleaning, and the treatment effect was not notable.
Under the density extraction method, the infrared spectra of the four types of microplastics in loess showed anomalies at 1150, 1750, and 3000 cm−1 and the peak value of the functional group region of PS was lower than that of the original sample (Figure 5), which may have been due to the existence of small loess particles between the pores of microplastic samples during FTIR detection (Figure 5). Mintenig et al. [60] suggested that some soil particles adhered to the surface of microplastics, which made the surface structure and material of the microplastics more complex. Figure 5 shows that the peak value of PET was lower than that of the original sample in the fingerprint area (waveband wavelengths 750–1500 cm−1) in the I region. In the V region, the peaks of PP were higher than those of the original sample at the waveband wavelengths of 1750 and 2750–3000 cm−1, but the overall peak shape and peak position were similar to those of the original sample (Figure 5). This result may have occurred because the M3 solution absorbed on the surface of microplastics. In addition, iron and aluminum oxides in laterite adhered to the surfaces of microplastics, which also leads to this phenomenon. The infrared spectra of the four types of microplastics were consistent with that of the original blank sample in the VI region.

3.3. Appropriate Methods for Microplastic Detection in Different Agricultural Soils

The physical and chemical properties have significant differences when agricultural soil was collected from different regions. The extraction rate of microplastics was affected by the composition of different substances and the proportions of chemicals in the agricultural soil [61]. Ding et al. [62] indicated that various agricultural soil types may have different effects on the distribution of microplastics. Meanwhile, various extraction methods had different extraction rates of microplastics and different impacts on the environment. Fuller and Gautam [63] extracted microplastics from a composted municipal waste sample with pressurized fluid extraction, and the extraction rates of PE and PP ranged from 84.50% to 95.00%, but this method changed the structure of the microplastics. Felsing et al. [64] extracted microplastics from soils with the Korona–Walzen–Scheider device; the recovery rate of microplastics reached up to 90%, even for very small (63 μm) microplastic particles. However, this method was only suitable for sediment separation with a large sample weight (>1 kg).
The methods used in this study can address some limitations of the current microplastic methods and provide laboratories with simple analytical methods in a range of environmental samples. They have the advantages of high extraction rates, saving time, operating easily, and being environmentally friendly. The priority of the treatment methods for the extraction of microplastics was M1 > M2 > M3 in the I and VIII regions (Table 2). High-density microplastics were extracted using the oil extraction methods, but the cleaning procedure should be optimized to reduce the impact of oil on the FTIR identification of microplastics. The density of the saturated NaCl solution (1.20 g·cm−3) used in the density extraction method was lower than that of PET (1.37 g·cm−3), while the densities of ZnCl2 solution (1.70 g·cm−3) and NaI solution (1.80 g·cm−3) were higher than that of PET [65]; thus, the extraction effects of ZnCl2 and NaI solutions were better than that of saturated NaCl solution. However, considering the wide application, the three treatment methods adopted in this study were feasible.
The preferred treatment methods for extracting microplastics were M2 > M1 > M3 in the IV and VII regions (Table 2). The extraction efficiency of the M1 treatment was slightly lower than that of the M1 treatment in these two regions. The priority of the treatment methods for the extraction of microplastics was M1 = M2 > M3 in the II and VI region (Table 2). Under the oil extraction methods, the extraction rates of microplastics in purple soil were consistent, and both were greater than 93.33%. However, the PP extraction rate under the density extraction method was slightly lower than those under the oil extraction methods. Therefore, it was preferable to choose the oil extraction methods.
Although the oil extraction methods were suitable for the other agricultural soils, the highest PET extraction rate in the V region was only 56.60% under oil extraction methods. The PE extraction rate in the V region was also slightly lower than the other agricultural rate under oil extraction methods, which was 86.67%. This may be attributed to the special physical and chemical composition of laterite. Under the density extraction method, the extraction of PET and PP was also not ideal, which were extracted at rates of 3.33% and 56.67%, respectively. These results may have been related to the high contents of organic matter and iron and aluminum oxides. Therefore, the three treatment methods were not suitable for laterite, and it is necessary to explore appropriate extraction methods to extract different microplastics from laterite.

4. Conclusions

In summary, this study selected eight types of agricultural soils from the regionalization of soil and water conservation of China as test objects. This was to evaluate the influence on the separation efficiency and component property identification of microplastics with different types and densities using oil extraction and density extraction methods. The conclusions were as follows.
The results showed that the extraction rates of the four types of microplastics, especially for high density PET microplastics, were higher under oil extraction than the density extraction method. However, when FTIR was used to identify the microplastic components, the influence of the oil extraction method was greater than that of the density separation. For the higher density microplastics such as PET and PVC, it is recommended that the oil extraction method is used, combined with cleaning the residual oil with absolute ethyl alcohol. For the lighter microplastics, such as PP, PE and PS, density separation is the recommended method. Nevertheless, the Southern laterite area was a special case, as the extraction rate of PET using the oil extraction method and PP using the density extraction method was lower than other soils. The main reason was that the content of iron and aluminum oxides was high in the laterite soil. Therefore, an appropriate extraction method for microplastics in laterite needs to be explored in the future. In addition, the difference in the extraction rates of microplastics from soil using different types of oil will continue to be explored.

Author Contributions

All authors contributed to the study conception and design. X.Z.: Writing—original draft preparation, visualization, investigation; Z.L.: sampling, investigation; J.Z.: resources; L.C.: resources; Y.L.: resources; J.H.: conceptualization, writing—review and editing, visualization; M.Z.: conceptualization, writing—review and editing, visualization. All authors have read and agreed to the published version of the manuscript.

Funding

This work was supported by the open Foundation of Key Laboratory in Jiangxi Academy of Water Science and Engineering (grant numbers: 2021SKTR02, 2022SKTR02); the Platform support Project of Northwest Engineering Corporation Limited, Power China (grant number: XBY-PTKJ-2022-9); the Major science and technology project of the Ministry of Water Resources (grant number: SKS-2022093), International Partnership Program of the Chinese Academy of Sciences (grant number: 16146KYSB20200001).

Data Availability Statement

Data used in this paper will be made available upon request from the corresponding author.

Conflicts of Interest

The authors declare no conflicts of interest.

References

  1. Ren, A.-T.; Zhou, R.; Mo, F.; Liu, S.-T.; Li, J.-Y.; Chen, Y.; Zhao, L.; Xiong, Y.-C. Soil water balance dynamics under plastic mulching in dryland rainfed agroecosystem across the Loess Plateau. Agric. Ecosyst. Environ. 2021, 312, 107354. [Google Scholar] [CrossRef]
  2. Lv, H.; Zhou, W.; Dong, J.; He, S.; Chen, F.; Bi, M.; Wang, Q.; Li, J.; Liang, B. Irrigation amount dominates soil mineral nitrogen leaching in plastic shed vegetable production systems. Agric. Ecosyst. Environ. 2021, 317, 107474. [Google Scholar] [CrossRef]
  3. Fan, Y.n.; Zhang, Y.; Wan, M.; Hu, W.; Chen, Z.; Huang, B. Plastic shed production intensified secondary soil salinization in perennial fruit production systems. Agric. Ecosyst. Environ. 2021, 316, 107469. [Google Scholar] [CrossRef]
  4. Andrady, A.L. Microplastics in the marine environment. Mar. Pollut. Bull. 2011, 62, 1596–1605. [Google Scholar] [CrossRef] [PubMed]
  5. Ren, S.Y.; Sun, Q.; Ni, H.G.; Wang, J. A minimalist approach to quantify emission factor of microplastic by mechanical abrasion. Chemosphere. 2020, 245, 125630. [Google Scholar] [CrossRef] [PubMed]
  6. Han, J.; Ge, W.; Hei, Z.; Cong, C.; Ma, C.; Xie, M.; Liu, B.; Feng, W.; Wang, F.; Jiao, J. Agricultural land use and management weaken the soil erosion induced by extreme rainstorms. Agric. Ecosyst. Environ. 2020, 301, 107047. [Google Scholar] [CrossRef]
  7. Thompson, R.C.; Olsen, Y.; Mitchell, R.P.; Davis, A.; Rowland, S.J.; John, A.W.; McGonigle, D.; Russell, A.E. Lost at Sea: Where Is All the Plastic? Science 2004, 304, 838. [Google Scholar] [CrossRef] [PubMed]
  8. Horodytska, O.; Valdes, F.J.; Fullana, A. Plastic flexible films waste management—A state of art review. Waste Manag. 2018, 77, 413–425. [Google Scholar] [CrossRef] [PubMed]
  9. Corradini, F.; Meza, P.; Eguiluz, R.; Casado, F.; Huerta-Lwanga, E.; Geissen, V. Evidence of microplastic accumulation in agricultural soils from sewage sludge disposal. Sci. Total Environ. 2019, 671, 411–420. [Google Scholar] [CrossRef] [PubMed]
  10. Chen, H.; Jia, Q.; Zhao, X.; Li, L.; Nie, Y.; Liu, H.; Ye, J. The occurrence of microplastics in water bodies in urban agglomerations: Impacts of drainage system overflow in wet weather, catchment land-uses, and environmental management practices. Water Res. 2020, 183, 116073. [Google Scholar] [CrossRef] [PubMed]
  11. Scheurer, M.; Bigalke, M. Microplastics in Swiss Floodplain Soils. Environ. Sci. Technol. 2018, 52, 3591–3598. [Google Scholar] [CrossRef] [PubMed]
  12. Liu, M.; Lu, S.; Song, Y.; Lei, L.; Hu, J.; Lv, W.; Zhou, W.; Cao, C.; Shi, H.; Yang, X.; et al. Microplastic and mesoplastic pollution in farmland soils in suburbs of Shanghai, China. Environ. Pollut. 2018, 242, 855–862. [Google Scholar] [CrossRef] [PubMed]
  13. Liu, H.; Yang, X.; Liang, C.; Li, Y.; Qiao, L.; Ai, Z.; Xue, S.; Liu, G. Interactive effects of microplastics and glyphosate on the dynamics of soil dissolved organic matter in a Chinese loess soil. Catena 2019, 182, 104177. [Google Scholar] [CrossRef]
  14. Berger, S.; Kim, Y.; Kettering, J.; Gebauer, G. Plastic mulching in agriculture—Friend or foe of N2O emissions? Agric. Ecosyst. Environ. 2013, 167, 43–51. [Google Scholar] [CrossRef]
  15. Selvam, S.; Jesuraja, K.; Venkatramanan, S.; Roy, P.D.; Jeyanthi Kumari, V. Hazardous microplastic characteristics and its role as a vector of heavy metal in groundwater and surface water of coastal south India. J. Hazard. Mater. 2021, 402, 123786. [Google Scholar] [CrossRef] [PubMed]
  16. Wang, T.; Yu, C.; Chu, Q.; Wang, F.; Lan, T.; Wang, J. Adsorption behavior and mechanism of five pesticides on microplastics from agricultural polyethylene films. Chemosphere 2020, 244, 125491. [Google Scholar] [CrossRef] [PubMed]
  17. Ahmed, M.B.; Rahman, M.S.; Alom, J.; Hasan, M.S.; Johir, M.A.H.; Mondal, M.I.H.; Lee, D.Y.; Park, J.; Zhou, J.L.; Yoon, M.H. Microplastic particles in the aquatic environment: A systematic review. Sci. Total Environ. 2021, 775, 145793. [Google Scholar] [CrossRef] [PubMed]
  18. Feng, S.; Lu, H.; Liu, Y. The occurrence of microplastics in farmland and grassland soils in the Qinghai-Tibet plateau: Different land use and mulching time in facility agriculture. Environ. Pollut. 2021, 279, 116939. [Google Scholar] [CrossRef] [PubMed]
  19. Li, Q.; Zeng, A.; Jiang, X.; Gu, X. Are microplastics correlated to phthalates in facility agriculture soil? J. Hazard. Mater. 2021, 412, 125164. [Google Scholar] [CrossRef] [PubMed]
  20. Zhang, Z.; Wu, X.; Liu, H.; Huang, X.; Chen, Q.; Guo, X.; Zhang, J. A systematic review of microplastics in the environment: Sampling, separation, characterization and coexistence mechanisms with pollutants. Sci. Total Environ. 2023, 859, 160151. [Google Scholar] [CrossRef] [PubMed]
  21. Hassan, I.; Sethupathi, S.; Bashir, M.J.K.; Munusamy, Y.; Chan, C.W. A systematic review of microplastics occurrence, characteristics, identification techniques and removal methods in ASEAN and its future prospects. J. Environ. Chem. Eng. 2024, 12, 112305. [Google Scholar] [CrossRef]
  22. Zhang, H.; Huang, Y.; An, S.; Li, H.; Deng, X.; Wang, P.; Fan, M. Land-use patterns determine the distribution of soil microplastics in typical agricultural areas on the eastern Qinghai-Tibetan Plateau. J. Hazard. Mater. 2022, 426, 127806. [Google Scholar] [CrossRef] [PubMed]
  23. Nuelle, M.T.; Dekiff, J.H.; Remy, D.; Fries, E. A new analytical approach for monitoring microplastics in marine sediments. Environ. Pollut. 2014, 184, 161–169. [Google Scholar] [CrossRef] [PubMed]
  24. Zhou, Y.; Liu, X.; Wang, J. Characterization of microplastics and the association of heavy metals with microplastics in suburban soil of central China. Sci. Total Environ. 2019, 694, 133798. [Google Scholar] [CrossRef] [PubMed]
  25. Crichton, E.M.; Noël, M.; Gies, E.A.; Ross, P.S. A novel, density-independent and FTIR-compatible approach for the rapid extraction of microplastics from aquatic sediments. Anal. Methods 2017, 9, 1419–1428. [Google Scholar] [CrossRef]
  26. Heo, N.W.; Hong, S.H.; Han, G.M.; Hong, S.; Lee, J.; Song, Y.K.; Jang, M.; Shim, W.J. Distribution of small plastic debris in cross-section and high strandline on Heungnam beach, South Korea. Ocean. Sci. J. 2013, 48, 225–233. [Google Scholar] [CrossRef]
  27. Ding, L.; Mao, R.; Ma, S.; Guo, X.; Zhu, L. High temperature depended on the ageing mechanism of microplastics under different environmental conditions and its effect on the distribution of organic pollutants. Water Res. 2020, 174, 115634. [Google Scholar] [CrossRef] [PubMed]
  28. Sun, X.; Chen, B.; Li, Q.; Liu, N.; Xia, B.; Zhu, L.; Qu, K. Toxicities of polystyrene nano- and microplastics toward marine bacterium Halomonas alkaliphila. Sci. Total Environ. 2018, 642, 1378–1385. [Google Scholar] [CrossRef] [PubMed]
  29. Okoffo, E.D.; Rauert, C.; Thomas, K.V. Mass quantification of microplastic at wastewater treatment plants by pyrolysis-gas chromatography-mass spectrometry. Sci. Total Environ. 2023, 856, 159251. [Google Scholar] [CrossRef]
  30. Ding, L.; Mao, R.F.; Guo, X.; Yang, X.; Zhang, Q.; Yang, C. Microplastics in surface waters and sediments of the Wei River, in the northwest of China. Sci. Total Environ. 2019, 667, 427–434. [Google Scholar] [CrossRef] [PubMed]
  31. Renner, G.; Schmidt, T.C.; Schram, J. Analytical methodologies for monitoring micro(nano)plastics: Which are fit for purpose? Curr. Opin. Environ. Sci. Health 2018, 1, 55–61. [Google Scholar] [CrossRef]
  32. Song, Y.K.; Hong, S.H.; Jang, M.; Han, G.M.; Rani, M.; Lee, J.; Shim, W.J. A comparison of microscopic and spectroscopic identification methods for analysis of microplastics in environmental samples. Mar. Pollut. Bull. 2015, 93, 202–209. [Google Scholar] [CrossRef] [PubMed]
  33. Zhang, Z.; Geng, Y.; Zhou, W.; Shao, X.; Lin, H.; Zhou, Y. Development of a multi-spectroscopy method coupling mu-FTIR and mu-Raman analysis for one-stop detection of microplastics in environmental and biological samples. Sci. Total Environ. 2024, 917, 170396. [Google Scholar] [CrossRef] [PubMed]
  34. Guo, X.; Dai, H.; He, L. Migration testing of microplastics from selected water and food containers by Raman microscopy. J. Hazard. Mater. 2024, 462, 132798. [Google Scholar] [CrossRef] [PubMed]
  35. Guo, X.; Lin, H.; Xu, S.; He, L. Recent Advances in Spectroscopic Techniques for the Analysis of Microplastics in Food. J. Agric. Food Chem. 2022, 70, 1410–1422. [Google Scholar] [CrossRef] [PubMed]
  36. Shim, W.J.; Song, Y.K.; Hong, S.H.; Jang, M. Identification and quantification of microplastics using Nile Red staining. Mar. Pollut. Bull. 2016, 113, 469–476. [Google Scholar] [CrossRef] [PubMed]
  37. Goydaragh, G.M.; Taghizadeh-Mehrjardi, R.; Golchin, A.; Asghar Jafarzadeh, A.; Lado, M. Predicting weathering indices in soils using FTIR spectra and random forest models. Catena 2021, 204, 105437. [Google Scholar] [CrossRef]
  38. Dong, Y.; Gao, M.; Song, Z.; Qiu, W. Microplastic particles increase arsenic toxicity to rice seedlings. Environ. Pollut. 2020, 259, 113892. [Google Scholar] [CrossRef] [PubMed]
  39. Liu, F.; Rossiter, D.G.; Zhang, G.-L.; Li, D.-C. A soil colour map of China. Geoderma 2020, 379, 114556. [Google Scholar] [CrossRef]
  40. Zhao, G.; Yue, X.; Tian, P.; Mu, X.; Xu, W.; Wang, F.; Gao, P.; Sun, W. Comparison of the suspended sediment dynamics in Two Loess Plateau Catchments, China. Land Degrad. Dev. 2017, 28, 1398–1411. [Google Scholar] [CrossRef]
  41. Liu, K.; Du, J.; Zhong, Y.; Shen, Z.; Yu, X. The response of potato tuber yield, nitrogen uptake, soil nitrate nitrogen to different nitrogen rates in red soil. Sci. Rep. 2021, 11, 22506. [Google Scholar] [CrossRef] [PubMed]
  42. Lei, W.; Tang, X.; Zhou, X. Transport of 3,5,6-trichloro-2-pyrdionl (a main pesticide degradation product) in purple soil: Experimental and modeling. Appl. Geochem. 2018, 88, 179–187. [Google Scholar] [CrossRef]
  43. Wang, L. Study on Soil Properties Changed after the Enclosurein the Loess Hilly-Gully Region Ordos; Inner Mongolia Agricultural University: Hohhot, China, 2017. [Google Scholar]
  44. Molatudi, R.L. Effect of Switchgrass and Energy Sorghum on Main Physicaland Chemical Properties of Soil in Marginal Land, InnerMongolia; China Agricultural University: Beijing, China, 2016. [Google Scholar]
  45. Xue, Z. Assessment of Soil Quality and Pollution Riskin Main Sewage-Irrigated Area of Hebei Province; Hebei Agricultural University: Baoding, China, 2012. [Google Scholar]
  46. Li, Y.; Song, A.; Lu, Y.; Wang, E.; Tang, Z.; Liu, x.; Fan, F. Volatile organic compound compositions and microbial communityproperties in maize rhizosphere among different soils. J. Plant Nutr. Fertil. 2019, 25, 1633–1645. [Google Scholar] [CrossRef]
  47. Meng, Y.; Xue, J.; Sha, L.; Tang, J. Variations of soil NH4-N,NO-N and N mineralization under differntforests in xishuangbanna, southwest China. Acta Phytoecol. Sin. 2001, 25, 99–104. [Google Scholar]
  48. Zheng, X. Effect of Plowing Depth and Straw Returned on SoilProperties and Crop Growth; Yunnan Agricultural University: Kunming, China, 2017. [Google Scholar]
  49. Liu, L.; Zhao, G.; Mu, X.; Gao, P.; Sun, W.; Han, J. Soil Quality Evaluation Along the Qinghai-Tibet HighwayBased on the Minimum Data Set. Res. Soil Water Conserv. 2022, 29, 125–131. [Google Scholar] [CrossRef]
  50. Dong, M.; Luo, Z.; Xing, X.; Zhang, Q.; Sun, Y. Separation of Microplastics in Soils and Sediments with Oil Extraction Protocol. Res. Environ. Sci. 2020, 33, 1522–1529. [Google Scholar]
  51. Lekše, N.; Žgajnar Gotvajn, A.; Zupančič, M.; Griessler Bulc, T. Oil-based extraction as an efficient method for the quantification of microplastics in environmental samples. Environ. Sci. Eur. 2024, 36, 68. [Google Scholar] [CrossRef]
  52. Gu, W.; Yang, G.; Liu, Y.; Mao, Y.; Li, H.; Ai, H.; He, Q. Treatment and detection methods of microplastics from environment media: A review. J. Civ. Environ. Eng. 2020, 42, 135–143. [Google Scholar]
  53. Wei, X.; Ji, H.; Wang, S.; Chu, H.; Song, C. The formation of representative lateritic weathering covers in south-central Guangxi (southern China). Catena 2014, 118, 55–72. [Google Scholar] [CrossRef]
  54. Cai, L.; Hu, L.; Shi, H.; Ye, J.; Zhang, Y.; Kim, H. Effects of inorganic ions and natural organic matter on the aggregation of nanoplastics. Chemosphere 2018, 197, 142–151. [Google Scholar] [CrossRef] [PubMed]
  55. Wu, X.; Lyu, X.; Li, Z.; Gao, B.; Zeng, X.; Wu, J.; Sun, Y. Transport of polystyrene nanoplastics in natural soils: Effect of soil properties, ionic strength and cation type. Sci. Total Environ. 2020, 707, 136065. [Google Scholar] [CrossRef] [PubMed]
  56. Xu, l.; Li, H.; Han, L.; Zou, G.; Chen, Y.; Liu, D.; Xue, Y.; Lu, A. Research progress on the adsorption and desorption between microplastics and typical pollutants. Chin. J. Eco-Agric. 2021, 29, 1–9. [Google Scholar]
  57. Turner, A.; Holmes, L.A. Adsorption of trace metals by microplastic pellets in fresh water. Environ. Chem. 2015, 12, 600–610. [Google Scholar] [CrossRef]
  58. Zhao, C.; Yan, Y.; Su, J.; Li, H.; Wang, B.; Zhong, Y.; Hu, B.; Yang, L. Research progress on the harm and detection technologies of nanoplastics in aquatic environment. Environ. Eng. 2019, 37, 64–70. [Google Scholar]
  59. Wei, X.; Li, M.; Wang, Y.; Jin, L.; Ma, G.; Yu, H. Developing Predictive Models for Carrying Ability of Micro-Plastics towards Organic Pollutants. Molecules 2019, 24, 1784. [Google Scholar] [CrossRef] [PubMed]
  60. Mintenig, S.M.; Int-Veen, I.; Loder, M.G.J.; Primpke, S.; Gerdts, G. Identification of microplastic in effluents of waste water treatment plants using focal plane array-based micro-Fourier-transform infrared imaging. Water Res. 2017, 108, 365–372. [Google Scholar] [CrossRef] [PubMed]
  61. Jiang, P.; Zhao, S.; Zhu, L.; Li, D. Microplastic-associated bacterial assemblages in the intertidal zone of the Yangtze Estuary. Sci. Total Environ. 2018, 624, 48–54. [Google Scholar] [CrossRef] [PubMed]
  62. Ding, L.; Wang, X.; Ouyang, Z.; Chen, Y.; Wang, X.; Liu, D.; Liu, S.; Yang, X.; Jia, H.; Guo, X. The occurrence of microplastic in Mu Us Sand Land soils in northwest China: Different soil types, vegetation cover and restoration years. J. Hazard. Mater. 2021, 403, 123982. [Google Scholar] [CrossRef] [PubMed]
  63. Fuller, S.; Gautam, A. A Procedure for Measuring Microplastics using Pressurized Fluid Extraction. Environ. Sci. Technol. 2016, 50, 5774–5780. [Google Scholar] [CrossRef] [PubMed]
  64. Felsing, S.; Kochleus, C.; Buchinger, S.; Brennholt, N.; Stock, F.; Reifferscheid, G. A new approach in separating microplastics from environmental samples based on their electrostatic behavior. Environ. Pollut. 2018, 234, 20–28. [Google Scholar] [CrossRef] [PubMed]
  65. Stile, N.; Raguso, C.; Pedruzzi, A.; Cetojevic, E.; Lasagni, M.; Sanchez-Vidal, A.; Saliu, F. Extraction of microplastic from marine sediments: A comparison between pressurized solvent extraction and density separation. Mar. Pollut. Bull. 2021, 168, 112436. [Google Scholar] [CrossRef]
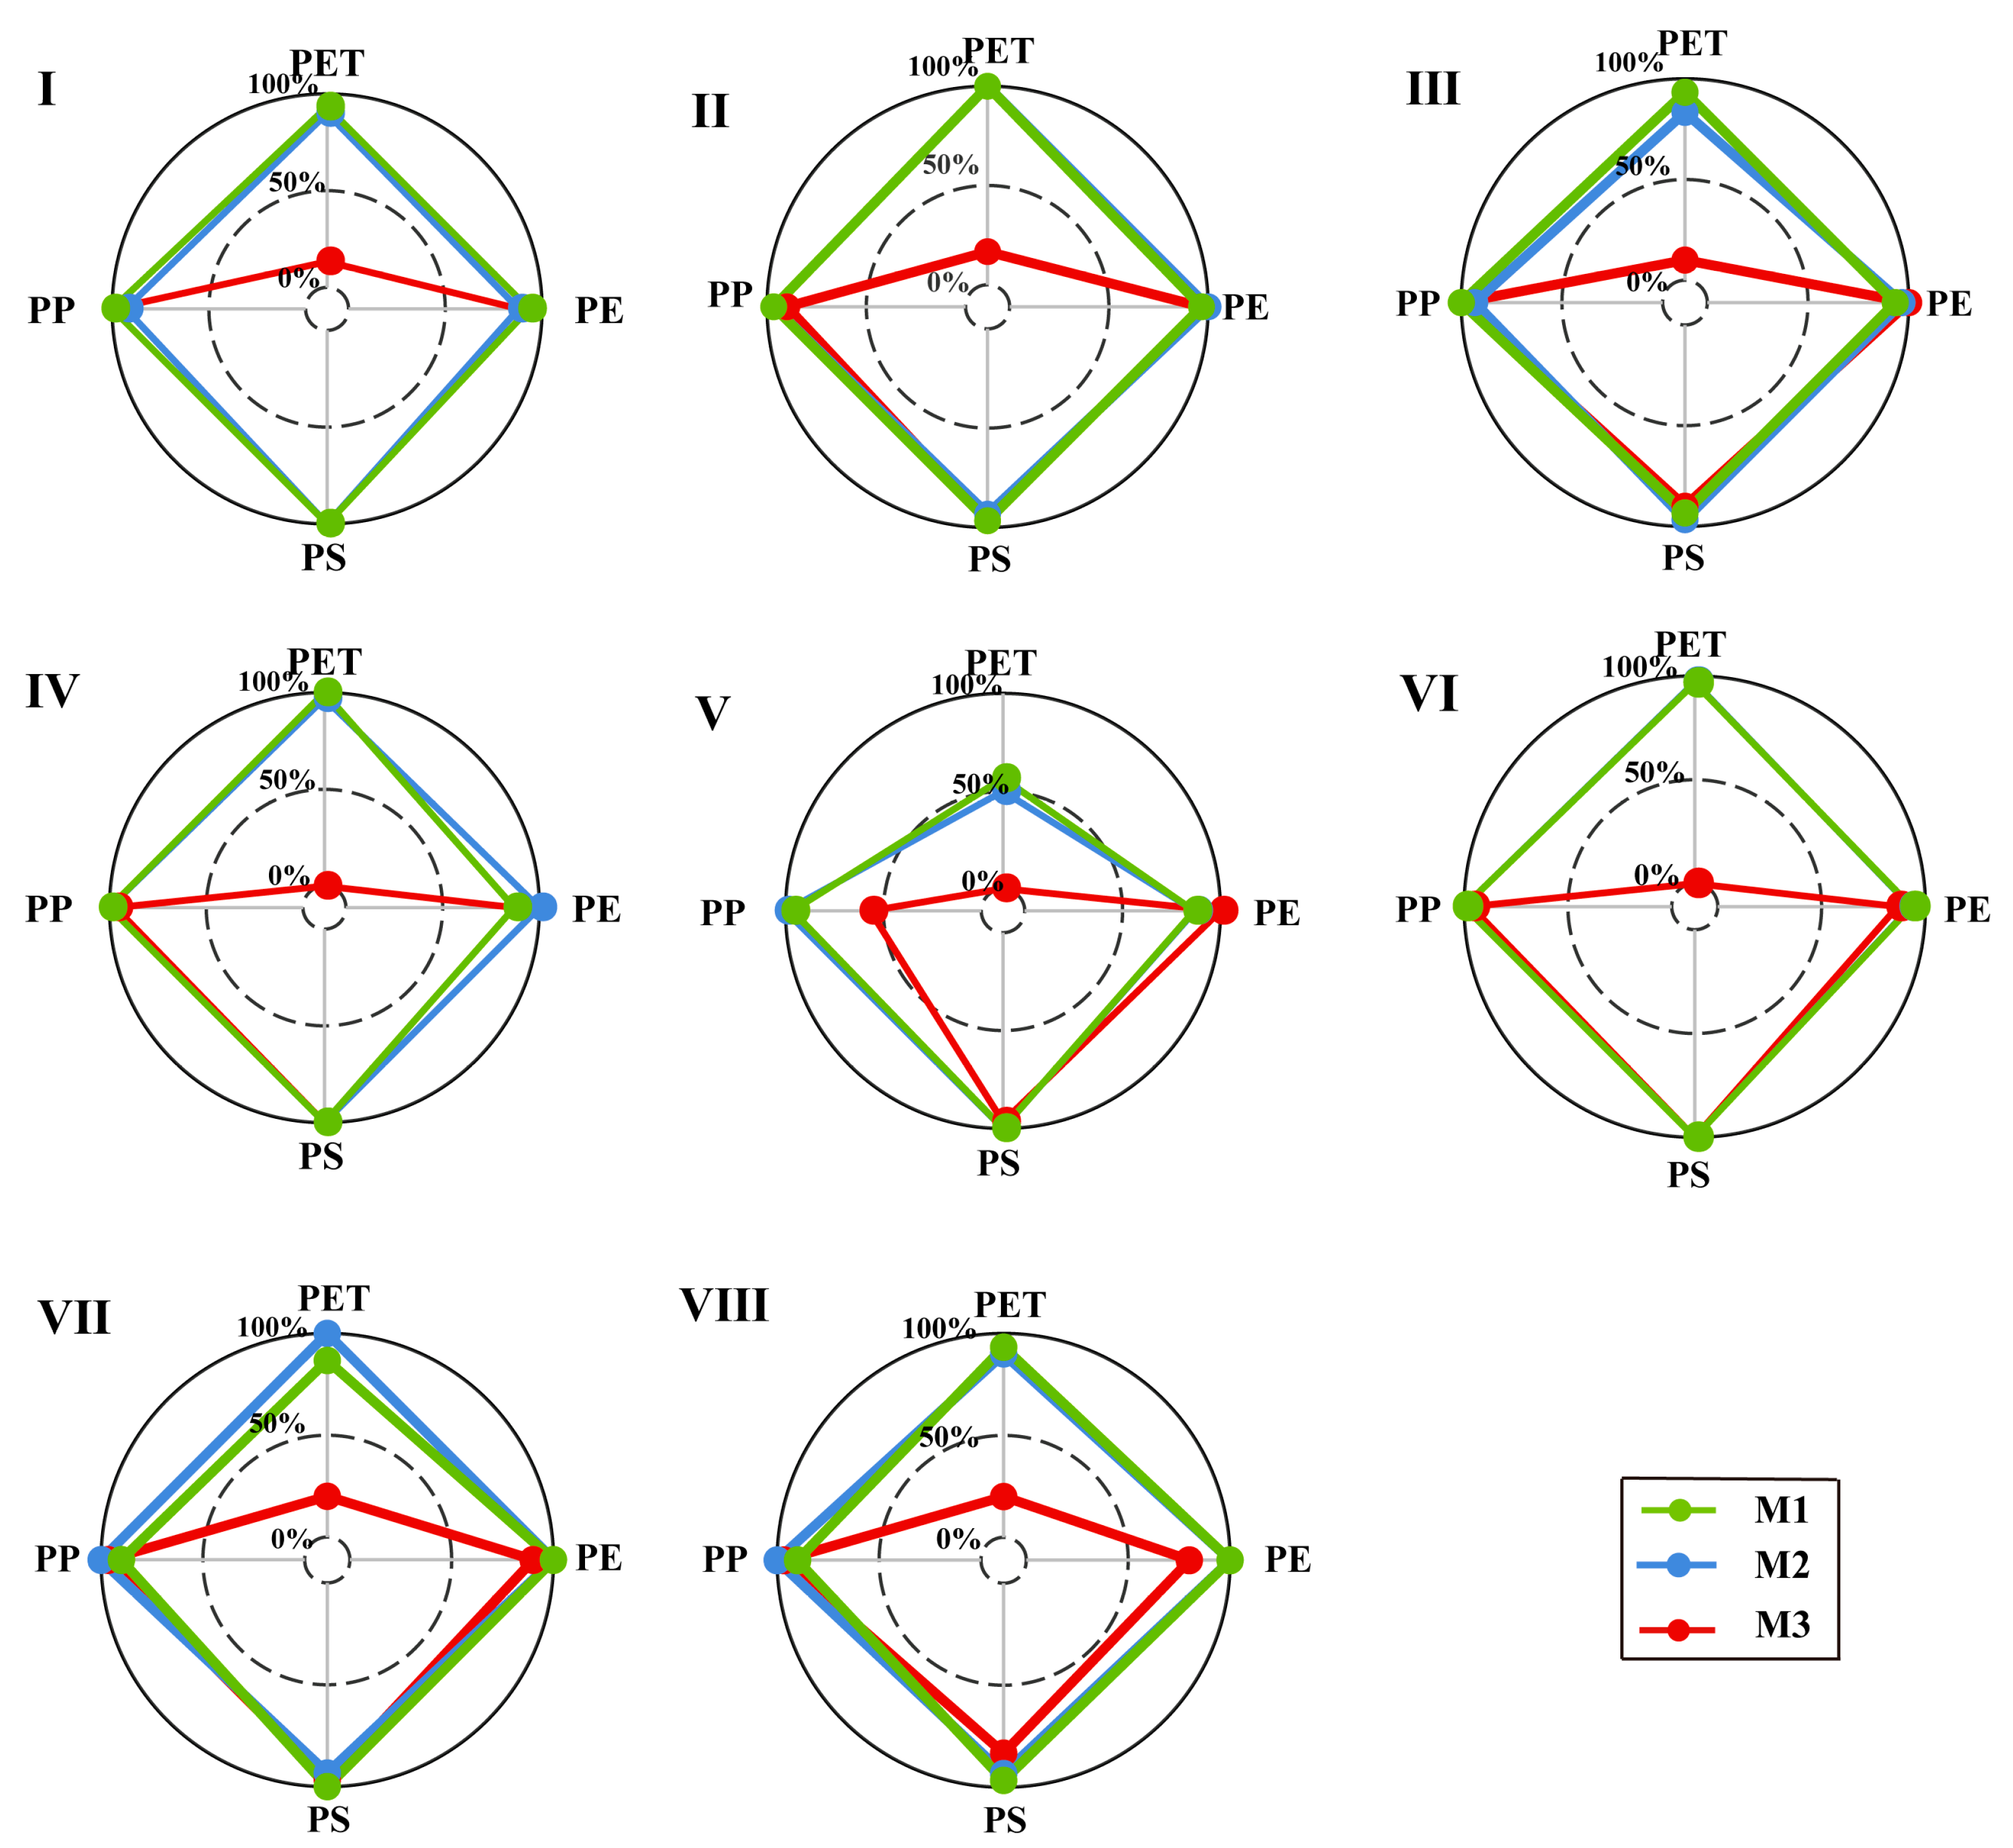
Figure 1. The sources, distribution, migration and influence of microplastics in a soil ecosystem.
Agronomy 14 01193 g001
Figure 2. The map of the sampling sites.
Agronomy 14 01193 g002
Figure 3. Process of the oil extraction protocol.
Agronomy 14 01193 g003
Figure 4. The extraction rates of microplastics in eight agricultural soils under different treatments. Notes: (I)–(VIII) represent Northwest black soil area, Northern windy and sandy area, Northern mountain and hilly area, Northwest loess plateau, Southwest red soil area, Southwest purple soil area, Southwest karst area, and Qinghai—Tibet plateau, respectively.
Agronomy 14 01193 g004
Figure 5. FTIR spectra of diverse agricultural soils containing typical microplastics using different processing methods. (A) PS in the I region, (B) PET in IV region, (C) PP in the V region, (D) PE in the VI region; M1′ is water + oil with absolute ethanol, and the following are performed in the same manner.
Agronomy 14 01193 g005
Table 2. Appropriate methods of microplastic extraction from different agricultural soils.
Agricultural Soil TypesTreatment
M1M2M3
Northwest black soil area (I)PreferredSecondThird
Northern windy and sandy area (II)PreferredPreferredSecond
Northern mountain and hilly area (III)PreferredSecondThird
Northwest loess plateau (IV)SecondPreferredThird
Southwest laterite area (V)---------
Southwest purple soil area (VI)PreferredPreferredSecond
Southwest karst area (VII)SecondPreferredThird
Qinghai–Tibet plateau (VIII)PreferredSecondThird
Note: M1 is water + cyri rapeseed oil; M2 is saturated NaCl solution + cyri rapeseed oil; M3 is saturated NaCl solution.
Disclaimer/Publisher’s Note: The statements, opinions and data contained in all publications are solely those of the individual author(s) and contributor(s) and not of MDPI and/or the editor(s). MDPI and/or the editor(s) disclaim responsibility for any injury to people or property resulting from any ideas, methods, instructions or products referred to in the content.

