Abstract
Planting cover crops can improve soil health and help to sustain agricultural crop yields. In northern climates where corn (Zea mays L.) and soybean (Glycine max L.) are grown, cover crop biomass production can be low. This has led to people investigating the potential of interseeding cover crops into the growing main crop. This paper sought to determine biomass production and the benefit to grain yields, weed control and soil properties from interseeding cover crops into corn and soybean. This review included 70 studies published prior to 15 March 2024. Interseeded cover crops that were winter-hardy such as cereal rye (Secale cereale L.) produced more biomass in the spring (1.04 Mg ha−1 average biomass production) than any of the interseeded cover crops did in fall (0.35 Mg ha−1 average biomass production), primarily at crop row spacings of 76 cm. Factors that affected cover crop biomass production were crop stage, planting method, tillage practice, irrigation and row spacing. There was not a consistent widely planted cover crop species that produced the most biomass. Interseeded cover crops reduced weed biomass by 46% compared to weed control and generally did not affect crop grain yields when planted after V4 crop stage. Interseeded cover crops reduced soil nitrate concentration but generally did not affect other soil properties including soil water content. However, most of these studies planted cover crops at the same site for less than three years. Early interseeded cover crops generally did not perform better than interseeded winter-hardy cover crops planted around crop physiological maturity.
1. Introduction
Cover crops are planted for soil and water conservation, to fix nitrogen for the following crop, reduce nutrient leaching, provide additional biomass for forage, increase diversity in the cropping system and for weed control [,]. Cropping systems in some regions have unfavorable conditions for cover crops to grow between grain harvest and planting the following crop. In areas such as the Northern Midwest and Northeastern United States, corn and soybeans are two of the more commonly grown crops [,]. These crops are generally planted in late April to early June and harvested for grain in mid-September–November in these regions [,]. The climate in these regions of the United States is cold during the fallow period of these crops, which leads to limited time for cover crops to grow in this cropping system []. Also, there are limited cover crop species that can produce significant biomass during the fallow period between these two annual crops. Species selection is limited to winter-hardy cover crops such as cereal rye (Secale cereale L.), hairy vetch (Vicia villosa L.) and red clover (Trifolium pratense L.) [,]. The poor growing conditions for many cover crop species during the fallow period limits the diversity of cover crop species that can be added to the cropping system and biomass that can be produced by the cover crop.
Cover crops are traditionally planted following harvest of the main crop and terminated by frost, tillage or herbicides applied at or prior to planting []. Another way that cover crops can be integrated into a cropping system is to plant them during the growing cycle of the main crop []. Cover crops can be planted with the main crop to provide nitrogen to the main crop, control weeds, provide cover for soil and water conservation and to produce forage that can be grazed by livestock once the main crop is harvested [,,,,]. Cover crops are frequently planted by a grain drill after harvest []. It is difficult to plant with a drill into growing or standing crops, so alternative planting equipment has been developed to interseed cover crops into growing or standing crops. High-clearance drills have been developed that can plant between the rows of growing crops during the vegetative (V) stages []. Cover crops have been drill-interseeded up to the V10 stage in corn and during early V stages of soybean growth before the crop canopy begins to close [,]. This allows some light to get through the crop canopy to help establish the cover crop. Shade-tolerant cover crops such as annual ryegrass (Lolium multiflorum L.), clovers (Trifolium sp. L.), cereal rye and radish (Raphanus sativus L.) have been the most frequently used cover crops when interseeding into corn and soybeans [,,,,,,,,,,,]. Also, cover crops can be broadcast into crops at later reproductive stages (R stages) by high-clearance tractors and from planes, helicopters and drones [,]. When the crop reaches physiological maturity, some of the leaves begin to dry out, opening the crop canopy again []. Winter-hardy cover crops such as cereal rye, winter camelina (Camelina sativa L.) and hairy vetch are usually used when broadcasting cover crops into standing crops later in the growing season []. This provides additional time for the cover crop to become established prior to winter temperatures occurring and may increase biomass production compared to postharvest cover crop planting.
Interest in cover crops has increased in recent years as agricultural producers have become more interested in soil health and regenerative agriculture [,]. Also, cover crops can reduce some of the negative effects of agriculture to the environment by reducing loss of phosphorous and nitrogen by leaching and from runoff [,,,,,]. Benefits to the ecosystem from cover crops generally increase as biomass production from the cover crop increases [,,]. However, in northern climates there is limited time for cover crop growth when full-season crops such as corn and soybeans are grown [,,]. That has led to investigation and development of techniques to plant cover crops into a standing crop to increase the duration of cover crop growth [,,,]. Little is known about how much biomass is produced, what effect it has on grain yields and what ecosystem services are provided when cover crops are interseeded into growing corn and soybean crops.
Previously published studies, looking at cover crop and weed biomass production, grain yields and soil properties when interseeding cover crops into corn and soybeans between planting and harvest, were analyzed and are listed in Table 1. The objectives of this review are the following. (1) Determine how much cover crop biomass is produced and what factors affect biomass production when they are interseeded into corn and soybeans. (2) Analyze the effects of interseeded cover crop on grain yields, weed control and soil properties. The hypothesis is that planting cover crops during the early V stages of the crop would produce the most biomass, provide the best weed control and supply the greatest benefits to soil properties, but may have a negative effect on crop grain yields. Cover crop mixtures would produce more biomass than single cover crop species that were interseeded and would offer the greatest benefit to weed control and soil properties. Legume cover crops would have larger benefits for corn yield than other species, whereas cover crop mixtures would be most beneficial to soybean yields.

Table 1.
Studies included in this review, including paper, location, cover crop species, crop stage when interseeded, planting technique, tillage practice, average annual precipitation, average annual temperature, crop row spacing, crop seeding rate and crop. NA means not available, CP is chisel plow, CT is conventional tillage, MP is moldboard plow, NT is no till, RT is reduced tillage, ST is strip tillage, V is vegetative crop growth stage and R is reproductive crop growth stage.
2. Materials and Methods
A search of Google Scholar was conducted looking for papers that investigated cover crops planted into corn and soybean prior to harvest. Search terms entered into Google Scholar included corn or soybeans combined with “cover crop” and “interseeding”, “cover crop and broadcasting”, and “cover crop and preharvest planted”. Papers were included from both organic and conventional cropping systems. Papers were only included in this analysis that planted cover crops into growing or standing corn or soybeans under the same tillage and fertilization practices. Papers included in this analysis included open access papers and ones from journals to which South Dakota State University Library subscribes. Web Plot Digitizer Version 5 was used to extract data from graphs []. Average annual temperature and precipitation were collected from worldclimate.com or usclimatedata.com [,].
Many papers reported results of biomass production or grain yield averaged across planting dates or reported data on cover crop species averaged across planting dates in the analysis. In the comparison of biomass production from cover crop species and the effect of cover crop species on grain yields, data were averaged across planting dates. In the results analyzing the effect of cover crop planting dates on biomass production and grain yields, data were averaged across cover crop species for the given planting date. When comparing different planting methods, tillage practices and mean annual temperature and precipitation, data were averaged across cover crop species and planting dates. Data presented in the text and figures represent the averaged value across studies with standard error as error bars or ±. Data were included in the analysis as presented in the manuscript, although some papers present data averaged across site years and locations, whereas others present data with individual site years. The high number of observations in the analysis is due to some studies including many cover crop species and planting date combinations. An ANOVA was conducted with Bonferroni t-tests of differences between means to compare different factors that may affect cover crop biomass production, grain yields and weed biomass production in SAS 9.4 [,]. Scientific names of cover crops/crops included in this review are cereal rye (Secale cereale L.), hairy vetch (Vicia villosa L.), red clover (Trifolium pratense L.), white clover (Trifolium repens L.), subterranean clover (Trifolium subterraneum L.), yellow sweet clover (Melilotus officinalis L.), black medic (Medicago lupulina L.), Persian clover (Trifolium resupinatum L.), strawberry clover (Trifolium fragiferum L.), crimson clover (Trifolium incarnatum L.), alfalfa (Medicago sativa L.), berseem clover (Trifolium alexandrinum L.), wheat (Triticum aesivium L.), radish (Raphanus sativus L.), turnip (Brassica rapa L.), annual ryegrass (Lolium multiflorum L.), common vetch (Vicia sativa L.), barrel medic (Medicago truncatula L.), triticale (Triticosecale species L.), cowpea (Vigna unguiculata L.), chickling vetch (Lathyrus sativus L.), black oats (Avena strigosa L.), oats (Avena sativa L.), winter pea (Pisum sativum L.), balansa clover (Trifolium michelianum L.), forage collard (Brassica oleracea L.), soybean (Glycine max L.), corn (Zea mays L.), winter camelina (Camelina sativa L.), pennycress (Thlaspi arvense L.), lentil (Vicia lens L.), bayou kale (Brassica oleracea sabellica L.), ladino clover (Trifolium repens L.), Kentucky bluegrass (Poa pratensis L.), velvetbean (Mucuna pruriens L.), flax (Linum usitatissimum L.), faba bean (Vicia faba L.), buckwheat (Fagopyrum esculentum L.), sorghum (Sorghum bicolor L.), millet (Pennisetum glaucum L.), phacelia (Phacelia tanacetifolia L.), Italian ryegrass (Lolium multiflorum L.), red fescue (Festuca rubra L.), pigeon pea (Cajanus cajan L.) and orchard grass (Dactylis glomerata L.).
3. Interseeded Cover Crop Biomass Production
3.1. Average Cover Crop Biomass Production
In this review, 38 papers reported fall biomass production and 34 papers reported spring biomass production from interseeded cover crops (Table 1). Thirty-two of the studies reported fall biomass production and 24 reported spring biomass production from cover crops that were interseeded into corn (Table 1). Also, 14 papers were found that determined fall and 18 that determined spring cover crop biomass production when cover crops were interseeded into soybeans (Table 1). Average fall biomass production in corn was 0.30 ± 0 02 Mg ha−1 and spring cover crop biomass production was 0.96 ± 0.078 Mg ha−1. In soybeans, average fall biomass production was 0.45 ± 0.045 Mg ha−1 and spring biomass production was 1.12 ± 0.092 Mg ha−1. The biomass production across studies on interseeded cover crops is less than that reported by a review that found an average cover crop biomass production of 1.5 to 3 Mg ha−1 across the climatic conditions of studies that were included in this review using a variety of cover crop planting methods []. This suggests that cover crop performance in these interseeded cover crops may not be as strong as cover crop biomass production averaged across cropping systems in the geographic locations included in this review.
3.2. Cover Crop Species and Mixtures
Certain cover crop species may perform better when they are planted into growing crops or a combination of different species may perform better. In previous research, there were 15 individual cover crop species that were interseeded into corn and 16 planted into soybeans along with many different mixtures of species (Figure 1 and Figure 2). In corn, the most common cover crop species used were annual ryegrass, cereal rye, hairy vetch, radish and red clover (Figure 1A,B). In soybean, the most commonly planted cover crop species were annual ryegrass, cereal rye, oats and winter camelina (Figure 2A,B). Many studies also planted cover crop mixtures containing multiple species (Table 1). The mixtures vary across studies, so mixtures were combined by the number of species that they contained, with mixtures being categorized as two-species, three-species or a diverse mixture with four or more species.
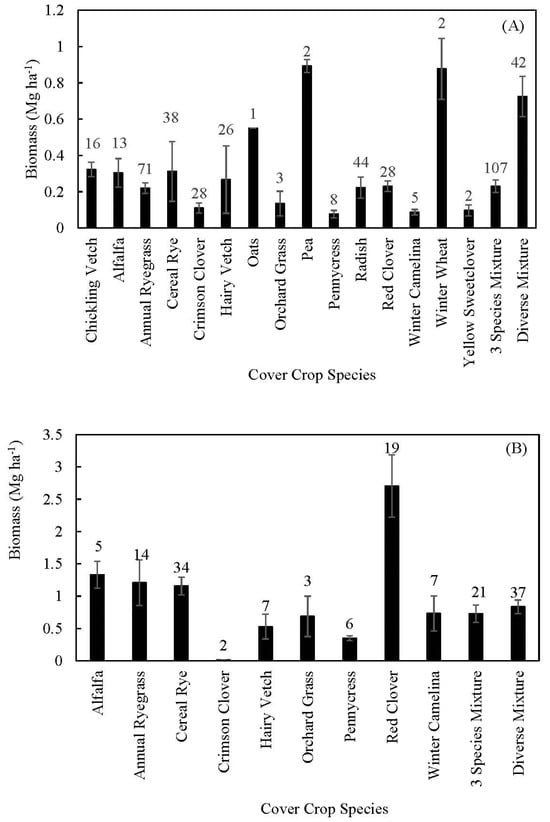
Figure 1.
Average (A) fall and (B) spring cover crop biomass production from different cover crop species interseeded into corn. Error bars are standard error, and number of observations is above the column.
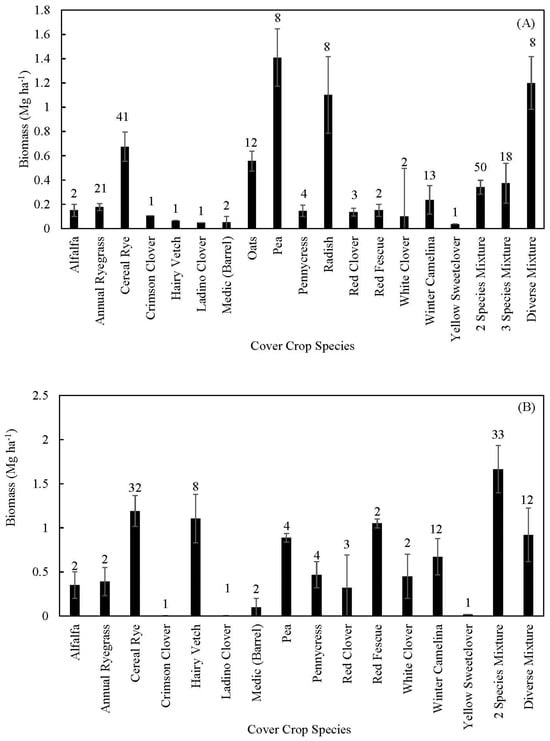
Figure 2.
Average (A) fall and (B) spring cover crop biomass production from different cover crop species interseeded into soybean. Number listed above the column is the number of observations and error bars are standard error.
In corn, fall biomass production was the highest in pea, winter wheat and diverse mixture, and lowest in the pennycress and winter camelina cover crops (Figure 1A). Species/mixture diversity affected both fall and spring biomass production at a probability (p) < 0.0001. However, the two cover crop species that produced the most biomass had only two observations, making it difficult to conclude that they performed better than the other species. The widely planted species, including cereal rye, hairy vetch, annual ryegrass, radish and red clover, produced a similar amount of fall biomass (0.20–0.35 Mg ha−1) (Figure 1A). Red clover produced the most spring biomass, although this was averaged across different corn seeding rates during four years at a location in Michigan ([] and Figure 1B). Cereal rye produced similar spring biomass to annual ryegrass and alfalfa, but produced more biomass than hairy vetch, winter camelina and mixtures (Figure 1B). It is worth noting that most of the mixtures that overwintered contained cereal rye in them, and much of the biomass may have consisted of cereal rye (Table 1). Some of the other species in these mixtures were not winter-hardy and may have only contributed to biomass in fall but not the following spring. Diverse mixtures produced the most fall biomass, which agrees with the hypothesis, but in spring cover crop mixtures did not produce more biomass than individual species.
In soybeans, the cover crop species of pea, radish, diverse mixtures and cereal rye produced the most, whereas clovers and annual ryegrass produced the least fall biomass (Figure 2A). Fall biomass production by different cover crop species was significantly varied at p < 0.0001 but not with a p value = 0.1046 for spring cover crop biomass production. Cereal rye, annual ryegrass and mixtures were the most common cover crops interseeded into soybean in previous studies (Figure 2A,B). Cereal rye, hairy vetch and the two-species mixture produced more spring biomass than any of the clover species, pennycress and winter camelina. All of the two-species mixtures that overwintered contained either cereal rye or hairy vetch in the seed mix, which likely made up much of the biomass that was produced. Cereal rye and hairy vetch are two of the more winter-hardy cover crops available, which may be why they performed well in these cover crop studies in temperate climates []. In soybeans, cover crop mixtures produced similar biomass to many of the commonly planted individual cover crop species, which does not completely agree with the hypothesis that cover crop mixtures would produce the most biomass. However, compared to a review which analyzed biomass production in many agroecosystems [], the biomass production in studies included in this review was much lower. This shows that interseeded cover crops generally performed worse than average cover crop performance in the regions where these interseeding studies were conducted.
3.3. Crop Stage When Interseeded
Planting cover crops into a certain crop growth stage can affect shading of the interrow area of the main crop and competition between the planted cover crop and the main crop. Seeding cover crops into the main crop at the right time minimizes competition between the cover crop and main crop but allows for adequate cover crop biomass production. Some of the studies did not include crop growth stage when cover crop was planted, making it difficult to perform this comparison (Table 1). Winter-hardy cover crops such as cereal rye, hairy vetch and winter camelina were most commonly planted during the R stages (R4–R8), whereas mixtures and less cold-tolerant species such as annual ryegrass, radish and clover species were planted earlier in the growing season during the V stages (Table 1). In corn, fall cover crop biomass production was significantly affected at p = 0.0081 and spring biomass at p < 0.0001. Planting cover crops at planting and the V4 stage produced the most fall biomass in corn, although high biomass produced when interseeded at planting in one irrigated location led to the high average value ([] and Figure 3A). These results were expected in the hypothesis due to a greater time for cover crops to grow when they are planted during the early V stages. The highest biomass production the following spring occurred when cover crops were planted at the R6 stage (Figure 3B). However, many of the studies that planted cover crops at earlier crop stages planted cover crop species that would winterkill. Also, some of the crop species may have not been able to outcompete corn once the corn plants became large and the cover crop plants died. Most of the studies that planted cover crops during the R stages used cover crop species or contained species in the mixture that would survive throughout the winter at the location where they were planted. That is likely why cover crops planted at the later stages of corn growth produced more spring biomass.
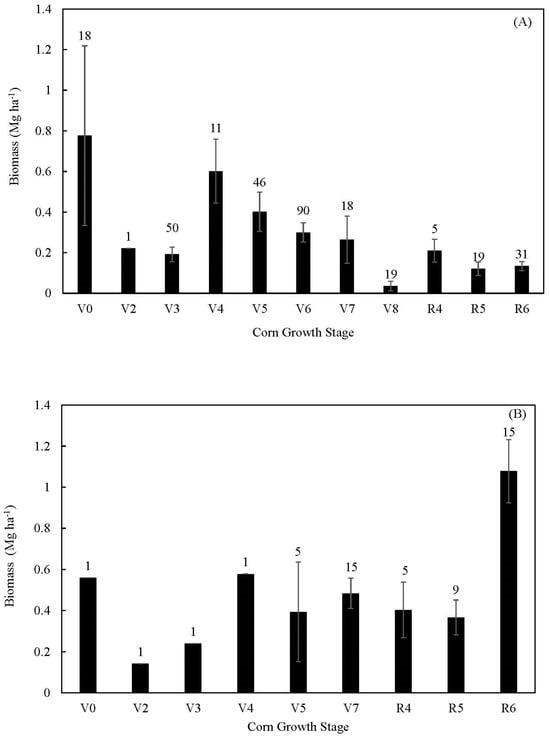
Figure 3.
Average cover crop biomass production when interseeded in corn at different vegetative (V) and reproductive (R) growth stages in the (A) fall and (B) spring. Error bars are standard error and number of data points is listed above each column.
Cover crops were interseeded at fewer growth stages in soybeans compared to corn (Figure 4A). Most of the studies broadcast-seeded cover crops into soybeans during the R stages, apart from some studies which looked at the potential of interseeded cover crops to control weeds [,,,]. The highest fall biomass was produced when cover crops were planted into soybeans at the R4 and R6 stage, whereas lowest biomass was produced when cover crops were planted at the V4 and R5 stages (Figure 4A). However, fall biomass was not significantly affected by growth stage (p = 0.5582), while spring biomass was affected by the crop stage at which cover crops were interseeded (p = 0.0017). The highest spring biomass was produced when cover crops were planted into soybeans at the R5 and R8 stages (Figure 4B). These findings do not agree with the hypothesis that planting cover crops during early V stages would produce more fall biomass in soybeans. Broadcasting winter-hardy cover crops into both corn and soybeans between the R4 and R8 stages generally produced more biomass the following spring than planting any cover crop species at earlier growth stages did in the fall. This finding suggests that planting summer annual cover crops during V stages of the corn and soybean crops does not improve cover crop biomass production compared to planting a winter-hardy cover crop when the crop is near physiological maturity and the canopy begins to open back up. A potential drawback to using fall biomass measurement as an indication of performance of cover crops planted in May or June is that the cover crops may germinate but then die when the crop canopy closes. The biomass from cover crops may already be broken down by the time cover crop biomass is measured in the fall. However, this also may indicate poor performance of the cover crop species planted in shaded conditions or summer temperatures.
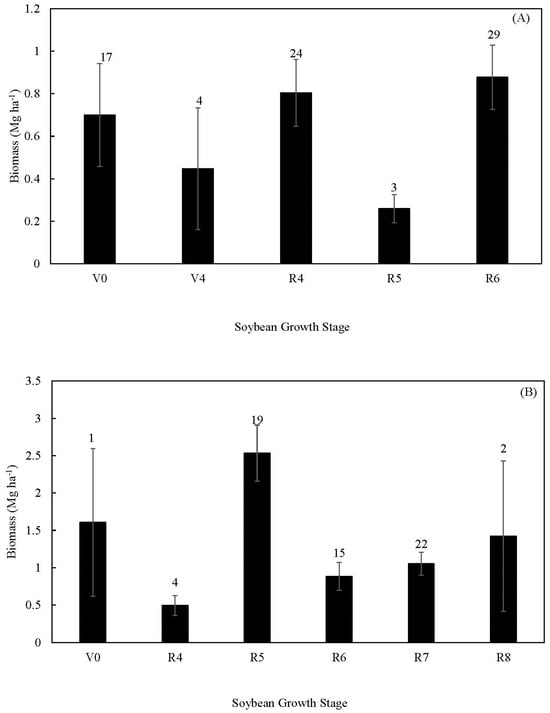
Figure 4.
Average interseeded cover biomass production in soybeans when planted at different vegetative (V) and reproductive (R) stages in the (A) fall and (B) following spring. Error bars are standard error and number of data points is listed above each column.
3.4. Cover Crop Seeding Method
Traditionally, cover crops are planted postharvest using a drill to ensure good seed-to-soil contact. When cover crops are broadcast, the seeds fall on the soil surface and may be eaten by animals or have poor contact with the soil [,]. Many of the papers broadcast cover crops into growing crops due to difficulty drill-seeding at later stages of crop growth and lack of equipment available to drill the seed (Table 1). In corn, average fall cover crop biomass was 0.28 ± 0.03 Mg ha−1 when cover crops were broadcast, 0.45 ± 0.11 Mg ha−1 when broadcast and incorporated and 0.28 ± 0.03 Mg ha−1 when drilled. In soybean, average fall biomass was 0.46 ± 0.046 Mg ha−1 when broadcast, 0.26 ± 0.056 Mg ha−1 when broadcast and incorporated and 0.61 ± 0.13 Mg ha−1 when drilled. However, in studies where cover crop species overwintered, spring biomass produced under corn was 1.12 ± 0.11 Mg ha−1 when broadcast and 0.74 ± 0.13 Mg ha−1 when drilled, and in soybean was 0.97 ± 0.08 Mg ha−1 when broadcast and 2.23 ± 0.38 Mg ha−1 when drilled. Fall (p = 0.1417) biomass production was not affected by planting method but spring was at p = 0.0227 in corn. In soybeans, drilled cover crops produced more biomass the following spring, although many of the observations were from one study in Maryland []. In soybeans, fall biomass production was not significantly affected by planting method p = 0.0998 but spring biomass was at p < 0.0001. Caution should be taken when analyzing spring biomass production due to the drilled technique being used more often during V stages, and broadcast technique being more often used during the R stages (Table 1). Some studies also compared broadcast cover crops to drill-planted cover crops that were planted at the same date and location [,,]. One study at two locations in Minnesota found that drilling the cover crop produced more fall cover crop biomass than broadcasting []. However, in this study planting method did not affect spring pennycress or cereal rye biomass, while planting the cover crop by drill increased red clover and winter camelina spring biomass production []. Another study conducted at three locations in North Dakota found that drilled cover crops produced more fall biomass than broadcast cover crops when planted at V7 but not the R4 stage []. Also, a study conducted in three counties in Pennsylvania found that drilled cover crops at the V5–V7 stage produced more fall biomass than broadcast cover crops []. Although averaged across studies biomass production was similar with the different planting methods, drill-seeded cover crops produced more biomass when they were planted at the same time and location in some studies.
3.5. Tillage Practice
Tillage practice may affect how cover crops perform when they are interseeded into growing crops. Tillage affects the amount of crop residue on the surface and may affect the seed-to-soil contact. Average fall biomass production was higher under conventional tillage practices, including chisel plow and moldboard plow, compared to no tillage (Figure 5). Many of the studies did not specify the types of tillage implements they used, so these were grouped into conventional tillage in the comparison. Broadcasting cover crops on top of soil under no till produced the least amount of fall biomass, whereas drilling or broadcasting into conventional till produced the highest biomass (Figure 5). Under no tillage, drill seeding produced more fall biomass compared to broadcast seeding, but biomass production was similar across planting techniques under tilled soils (Figure 5A). Across planting methods, tillage type statistically affected fall (p < 0.0001) and spring biomass (<0.0001) production. Spring biomass production was higher under chisel plow (2.47 ± 0.43 Mg ha−1 across 23 observations) than no tillage, but biomass averaged across tilled plots (1.03 ± 0.087 Mg ha−1 across 108 observations) was similar to that under no tillage (1.09 ± 0.074 Mg ha−1 across 189 observations). When comparing the different planting methods by tillage combinations, fall and spring biomass production were significantly affected at p < 0.0001. This suggests that interseeded cover crops produce more fall biomass when they are broadcast onto soils that are managed with tillage techniques that disturb the soil surface. However, spring biomass production was similar across the tillage practices.
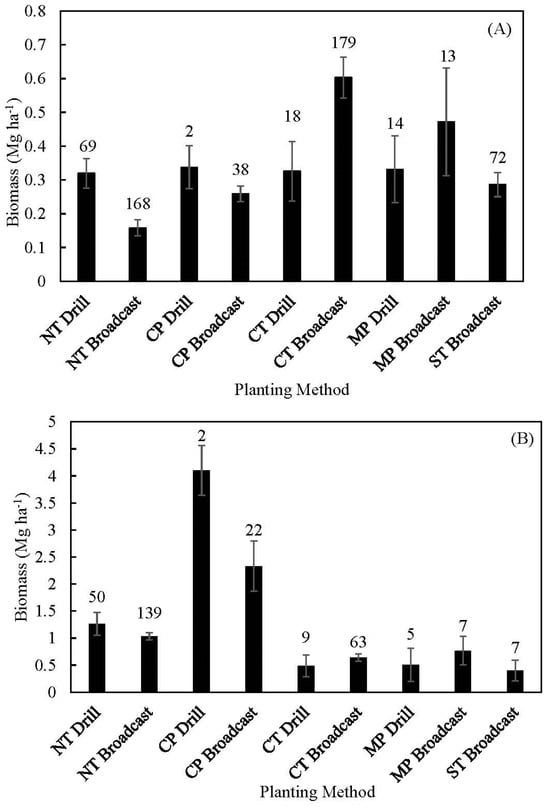
Figure 5.
Effect of tillage practices with broadcast and drill-planted cover crops on cover crop biomass production in (A) fall and (B) spring. NT is no tillage, CP is chisel plow, CT is conventional tillage, MP is moldboard plow and ST is strip till. Error bars are standard error and number of data points is above each column.
3.6. Cover Crop Seeding Rate
The seeding rate of cover crops also may affect how much biomass is produced. Most studies only planted a cover crop species at one seeding rate. Across studies, seeding rate was not correlated to biomass production. One study planted winter camelina and cereal rye at full and 75% seeding rate []. Spring biomass production was similar in winter camelia when seeded at 5.04 kg ha−1 (0.097 Mg ha−1) and 6.72 kg ha−1 (0.103 Mg ha−1) and cereal rye when seeded at 67.2 kg ha−1 (0.321 Mg ha−1) and 50.4 kg ha−1 (0.304 Mg ha−1) []. Another study that broadcast-seeded cereal rye into soybean at R7 and postharvest-drilled the cover crop found spring biomass production was 0.57 Mg ha−1 when seeded at 46 kg ha−1, 0.66 Mg ha−1 when seeded at 67 kg ha−1 and 0.77 Mg ha−1 when seeded at 88 kg ha−1, averaged across three sites []. Increasing seeding rate increased the spring biomass production in two of the six site years in this Iowa, USA study []. An additional study broadcast-planted cereal rye and hairy vetch into corn at the R5 stage and soybean at the R7 or 8 stage []. This study found hairy vetch biomass production was similar at three seeding rates (45, 60 and 90 kg ha−1) in both corn and soybean across two years and locations in Nebraska []. It found that rye biomass was higher at seeding rates of 101 kg ha−1 (1.66 Mg ha−1) and 135 kg ha−1 (1.8 Mg ha−1) than at 67 kg ha−1 (0.95 Mg ha−1) when broadcast into corn, but no differences were found when broadcast into soybeans []. These findings show that in some cases using higher seeding rates can lead to an increase in biomass production, but more studies are needed to see how other species perform when they are interseeded into growing crops at different seeding rates. However, seeding cover crops at a higher seeding rate costs more for the producers, and did not cause a large increase in cover crop biomass production in the three previous studies.
3.7. Corn or Soybean Row Spacing and Seeding Rate
A majority of studies found in this review planted corn and soybeans at 76 cm row spacing (Table 1). However, some producers are interested in planting corn in wider rows to increase cover crop biomass and improve ecosystem services provided from the cover crop. Three studies measured fall cover crop biomass production when corn was planted at 152 cm row spacing [,,], and one measured cover crop performance when corn was planted at 118 cm row spacing []. Across studies, average fall cover crop biomass production under 76 cm row spacing was 0.28 ± 0.02 Mg ha−1, under 112 cm was 1.58 ± 0.36 Mg ha−1 and under 152 cm was 1.17 ± 0.36 Mg ha−1. Another study measured winter camelina cover crop biomass when planted into corn at 61 and 76 cm row spacing and found no significant interaction between corn row spacing and percent soil cover or biomass production []. Three studies planted cover crops into soybeans at different row spacings [,,]. A study that broadcast cereal rye into soybeans at planting with 19 and 76 cm row spacing found that there was no difference in cover crop biomass between the two row spacings []. Another study found no differences in percent soil cover and spring and fall biomass production of cereal rye and winter camelina planted into R6-stage soybean at 30.5 and 61 cm row spacing []. An additional study found no effect of soybean row spacing on winter camelina biomass production at 31 and 61 cm row spacing []. These data suggest that cover crop biomass production was similar when comparing row spacings of 76 cm or less, but that more biomass may be produced when interseeding cover crop into corn planted at 118 and 152 cm row spacing.
The main crop seeding rate can affect the density of corn or soybean plants per hectare and how much light can penetrate through the canopy for the cover crop to use []. It would be expected that increasing the grain crop seeding rate might reduce cover crop biomass production and light penetration through the plant canopy. Most studies only used one corn or soybean seeding rate at a location, and there was no correlation between seeding rate and cover crop biomass production in the spring or the fall across studies. Two studies analyzed cover crop biomass production when seeded into corn planted at different seeding rates [,]. One study planted two different cover crop species into corn seeded at 37,500, 55,000, 65,000 and 75,000 seeds ha−1 []. This study found that chickling vetch biomass production was higher in the 37,500 seeds ha−1 seeding rate (0.51 Mg ha−1) than the 55,000 seeds ha−1 (0.28 Mg ha−1), 65,000 seeds ha−1 (0.31 Mg ha−1) and 75,000 seeds ha−1 (0.20 Mg ha−1) seeding rates across four site years []. Also, this study found that fall red clover biomass production was 0.37 Mg ha−1 at 37,500 seeds ha−1, 0.26 Mg ha−1 at 55,000 seeds ha−1, 0.24 Mg ha−1 at 65,000 seeds ha−1 and 0.18 Mg ha−1 at 75,000 seeds ha−1 across three site years []. The chickling vetch did not overwinter, but the red clover produced 4.25 Mg ha at 37,500 seeds ha−1, 4.16 Mg ha−1 at 55,000 seeds ha−1, 4.29 Mg ha−1 at 65,000 seeds ha−1 and 3.6 Mg ha−1 at 75,000 seeds ha−1, which was not significantly different []. The other study that interseeded a cereal rye, annual ryegrass, hairy vetch and red clover cover crop mixture into corn planted at 37,100, 74,100 and 111,200 seeds ha−1 found cover crop biomass decreased as corn planting population increased []. Mean cover crop biomass production was 0.28 Mg ha−1 when corn was seeded at 37,500 seeds ha−1, 0.19 Mg ha−1 when seeded at 74,100 seeds ha−1 and 0.084 Mg ha−1 when seeded at 111,200 seeds ha−1 []. Two studies also interseeded cover crops into soybean planted at different seeding rates [,]. A study in Michigan planted cereal rye cover crop into soybeans seeded at 444,600, 889,200 and 1,333,800 seeds ha−1 and found no difference in cover crop biomass production across three site years []. Another study planted cereal rye cover crop into soybean planted at 494,000 and 741,000 seeds ha−1 and found no difference in cover crop biomass production at the two seeding rates []. Some of the previous studies found that reducing seeding rate can increase biomass production in corn but that there also may be reduced grain yields from reducing the crop seeding rate. The two studies that measured cover crop biomass production in soybeans found that cover crop biomass production was not affected by soybean seeding rate.
3.8. Irrigation
Cover crops planted as companion crops into corn or soybean may compete for available water in the soil. Irrigation water additions during the summer may improve performance of the interseeded cover crop. Irrigation has been shown to increase biomass production of cover crops in previous studies [,]. Unfortunately, no studies analyzed cover crop performance under both irrigated and dryland conditions at the same location. Across studies, average fall biomass production was 0.35 ± 0.012 Mg ha−1 in dryland (576 observations) and was 0.60 ± 0.16 Mg ha−1 under irrigation (60 observations). Average spring cover crop biomass production was 1.1 ± 0.07 Mg ha−1 under dryland (288 observations) and was 0.68 ± 0.16 Mg ha−1 under irrigated management (31 observations). These data suggest that irrigation increases fall cover crop biomass production but decreases spring biomass production when interseeding cover crops into corn and soybeans. The lower spring biomass production under irrigated management may be due to the lack of irrigation between the main crop harvest and planting of the following crop, and these studies occurring in semi-arid or arid environments. However, studies comparing cover crop performance under both irrigated and dryland conditions at the same location are necessary to see if this is true.
3.9. Average Annual Precipitation and Temperature
The temperature and precipitation at a location also may affect cover crop biomass production. Average annual precipitation in studies included in this review ranged from 80 mm to 1243 mm (Table 1). When comparing the effect of average annual precipitation on cover crop biomass production, irrigated studies were not included. Average annual precipitation was grouped into classes of <500 mm, 500–750 mm, 750–1000 mm and >1000 mm. The average annual precipitation did not affect fall cover crop biomass production (Figure 6A). However, annual average precipitation had large effects on spring biomass production, with an increase in biomass production as the average annual precipitation increased (Figure 6A). Spring cover crop biomass production was statistically affected in the precipitation group at p < 0.0001 but fall biomass was not (p = 0.9716). It would be expected that spring and fall cover crop biomass production would increase as precipitation increases due to a greater amount of soil moisture being available. The finding that spring cover crop biomass increased in wetter climates agrees with this. Warmer average annual temperature can lead to an increased duration of cover crop growth during the fallow period between main crop harvesting and planting the following crop. Average annual temperature was grouped into <6 °C, 6–10 °C and >10 °C. Fall and spring cover crop production were both affected by temperature group at p < 0.0001. Fall biomass production was greatest when the average annual temperature was <6 °C, whereas spring biomass production was highest when the average annual temperature was >10 °C (Figure 6B). It would be expected that a warmer climate with more favorable temperatures during cover crop season would produce more cover crop biomass, which was partially shown by the results of the review. Based on the findings of this review, higher mean annual precipitation and temperature do not increase fall cover crop biomass production but do increase biomass production the following spring. This suggests that light penetration through the main crop canopy may have a larger effect on fall cover crop biomass production than the climatic conditions. However, more favorable conditions for cover crop growth, such as greater precipitation and temperature, increased spring biomass production when cover crops were planted that could survive through the winter period.
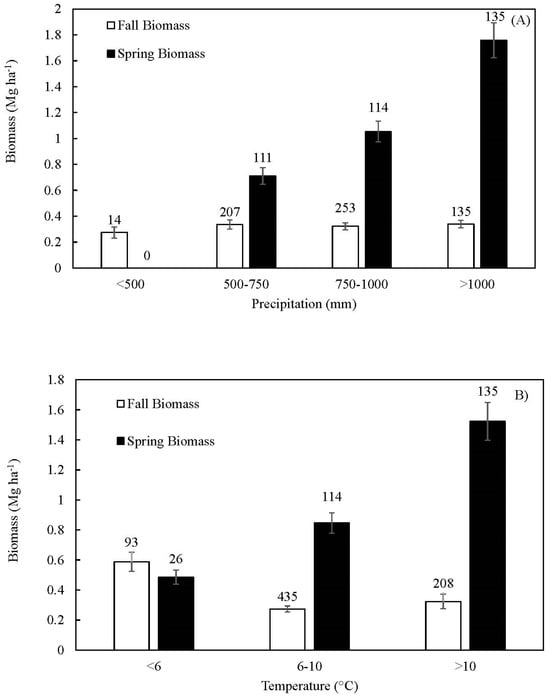
Figure 6.
Effect of interseeding cover crop into corn and soybean on fall and spring biomass production (A) across four mean annual precipitation classes and (B) across three mean annual temperature classes. Number above each column is the number of data points and error bars are standard error.
3.10. Pre- vs. Postharvest Planting
Several studies have compared planting cover crops by postharvest drilling to preharvest broadcast planting of the cover crop into the standing crop [,,,,,,,]. Preharvest broadcasting gives the cover crop a longer period of time to establish in the fall, which may increase spring cover crop biomass production. Most of the studies in this comparison broadcast cover crop species that will overwinter into corn and soybeans at the R4–R6 growth stages, which is when the crop canopy begins to open back up again (Table 1 and []). This planting technique allows an extra 1–2 months for the cover crop to establish and grow prior to harvesting the main crop for grain. However, broadcast seed may render poorer seed-to-soil contact than cover crop seed that is drilled. It is unclear whether better seed-to-soil contact or extra time for cover crop growth in fall increases spring cover crop biomass production. In corn, average biomass production from preharvest-planted cover crops was 0.81 Mg ha−1 and postharvest-drilled biomass production was 0.83 Mg ha−1 (Figure 7A). In soybean, average biomass production from preharvest-planted cover crop was 1.34 Mg ha−1 and postharvest-drilled cover crop was 0.79 Mg ha−1 (Figure 7A). In corn, spring biomass production was not different between the two planting methods (p = 0.8580), but it was in soybeans (p = 0.0315). This finding suggests that in corn, preharvest-broadcast and postharvest-drilled cover crops produce similar biomass, but that in soybeans preharvest-broadcast cover crops produce more biomass.
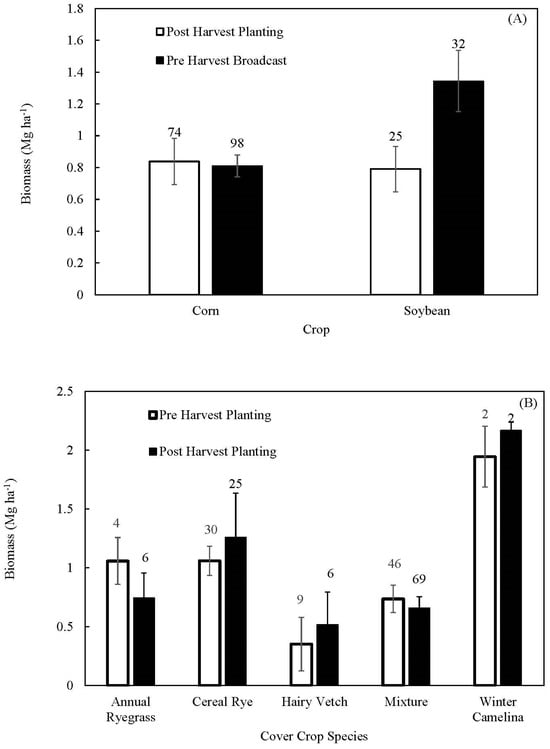
Figure 7.
Comparison of biomass production from pre- vs. postharvest-planted cover crops on (A) biomass production in corn and soybean and (B) biomass production by different cover crop species. Error bars are standard error, and the number of observations is above each column.
Some cover crop species may perform better when they are preharvest-broadcast vs. postharvest-drilled. Some seeds may be better at penetrating through the crop canopy and growing underneath the canopy of the main crop. Cereal rye, hairy vetch and mixtures were the most used cover crops when comparing preharvest-planted to postharvest-drilled cover crops. Regardless of species, biomass production was similar whether cover crop was preharvest-planted or postharvest-drilled (Figure 7B). In these studies, species significantly affected biomass production at p = 0.0115 but species by planting time interaction did not affect biomass production (p = 0.9935). In some cases a study will find greater biomass production from preharvest-planted cover crops [,], but in other instances postharvest-drilled cover crops have produced more biomass [,]. Having adequate moisture available to germinate the winter-hardy cover crops is likely more important to establish a cover crop stand than the method by which the cover crop is planted. Based upon the findings in this review, preharvest planting of winter-hardy cover crops into standing crops produces similar biomass to postharvest-drilled winter-hardy cover crops.
4. Effect of Interseeded Cover Crop on Main Crop Yield
4.1. General Effect on Grain Yield
Cover crops may compete with the main crop that is planted for resources. Different cover crop species and planting dates may have greater positive or negative effects on the main crop that is being grown. Average corn grain yields were 9.95 Mg ha−1 ± 0.33 Mg ha−1 under no cover crop where weeds were controlled and 9.71 Mg ha−1 ± 0.16 Mg ha−1 where cover crops were planted. Average soybean yields were 2.81 Mg ha−1 ± 0.12 Mg ha−1 without cover crops but with weed control, and 2.81 Mg ha−1 ± 0.08 Mg ha−1 with cover crops. This shows that interseeding cover crops may not affect corn or soybean grain yields. However, in certain cases cover crop species and/or planting date did affect grain yields, which will be further discussed.
4.2. Crop Growth Stage When Interseeded
At certain stages of crop growth, interactions between the main crop and weeds or the added cover crop may negatively affect main crop grain yields. Competition between the cover crop and main crop at certain growth stages may negatively affect crop grain yields. Cover crops were planted into corn at many more growth stages than soybean (Figure 8A,B). Planting cover crops at the same time as corn and at the V4 stage reduced grain yield relative to having no cover crops (Figure 8A). The growth stage at which cover crops were planted affected relative yield in corn and soybean at p < 0.0001. In soybean, planting cover crops at the same time as the planting and V4 stage reduced grain yield, but planting cover crops at the R5 stage and after did not have a negative effect on grain yield (Figure 8B). However, studies are missing that determined grain yields between the V4 and R5 stage of soybeans (Figure 8B). These findings suggest that planting cover crops at early stages of plant growth (V4 or earlier) can have negative effects on crop grain yields, which agrees with the hypothesis. In the earlier V stages of growth, weed control is more important than at later stages of growth [,]. The critical weed-free period is up to the V3 stage in soybeans and the V14 stage in corn [,]. Planting cover crops before the critical stage for weed control in soybeans reduced grain yields, but in corn, cover crops did not always reduce grain yields when planted before the critical growth stage for weed control. In some instances, planting cover crops during early growth stages of the crop may have negative effects on grain yield and have an effect on the main crop similar to weeds.
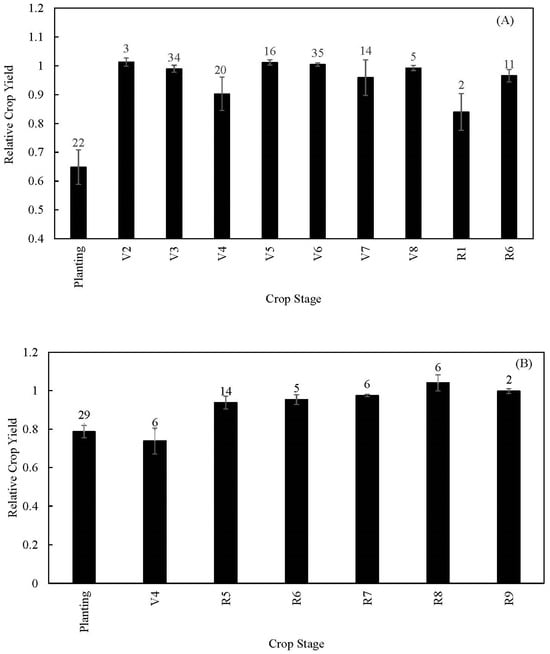
Figure 8.
Relative grain yield compared to weed control when cover crops are planted at different vegetative (V) and reproductive (R) crop stages in (A) corn and (B) soybean. Error bars are standard error and number of observations is listed above each column.
4.3. Interseeded Cover Crop Species
Some cover crop species that can fix nitrogen may benefit corn yield by providing additional nitrogen, whereas other cover crops may compete with the main corn or soybean crop for resources. None of the cover crop species benefited crop grain yields compared to control plots where weeds were managed in both corn and soybeans (Figure 9A,B). However, berseem clover, black medic, buckwheat, cereal rye, hairy vetch, Persian clover, radish and winter camelina cover crops tended to reduce corn grain yields across the observations (Figure 9A). Soybean yields were reduced when interseeded with alfalfa, cereal rye and red clover cover crop species (Figure 9B). Cover crop species significantly reduced relative soybean yield at p = 0.0011 but did not affect relative corn yield at p = 0.0578. This shows that planting some species of cover crops as companion crops during the main crop growing season may lead to reduced grain yields. A negative effect of certain cover crop species on grain yield does not agree with the hypothesis. This may be due to limited cover crop biomass production from many of the species that were planted, leading to minimal symbiotic relationship formed between the cover crop and corn or soybeans.
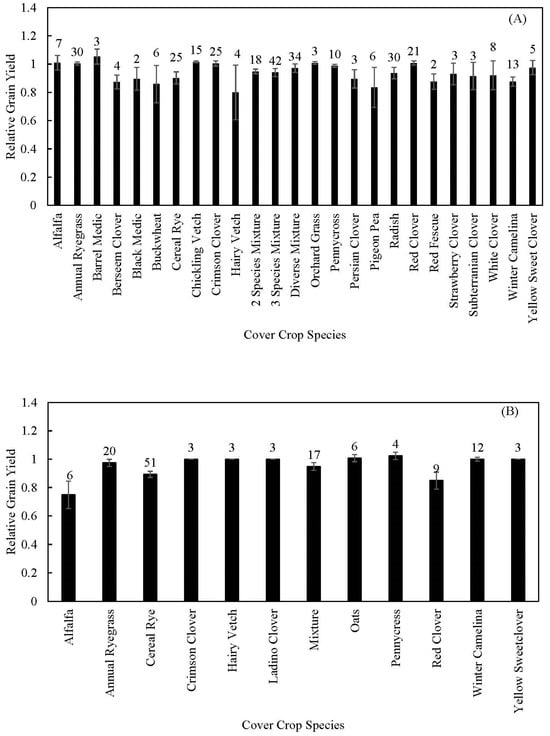
Figure 9.
Effect of different cover crop species on relative grain yield when interseeded into (A) corn and (B) soybean. Error bars are standard error and the number of observations is above each column.
4.4. Average Annual Precipitation and Temperature
Climate also may affect how much interseeding cover crops affect the main crop grain yield. In drier climates, cover crops may take up some of the water that would otherwise be used by the main crop. Relative grain yield was 1.00 ± 0.019 under an average annual precipitation of <500 mm, 0.88 ± 0.026 when precipitation was between 500 and 750 mm, 0.97 ± 0.011 when precipitation was between 750 and 1000 mm and 0.96 ± 0.0095 when precipitation was >1000 mm. This shows that in drier climates (500–750 mm), crop grain yields were reduced more than in climates that received more annual precipitation. Some of the studies that interseeded cover crops when average annual precipitation was <500 mm were conducted with irrigation, which may be why there was not a reduction in grain yields in the lowest average annual precipitation group [,,]. Temperature also may affect how interseeded cover crops affect grain yields. Relative grain yields were 0.95 ± 0.011 when average annual temperature was <6 °C, 0.98 ± 0.0087 when average annual temperature was between 6 and 10 °C and 0.92 ± 0.013 when average annual temperature was >10 °C. Average annual temperature did not have a consistent effect on grain yields, but precipitation did affect relative grain yield.
4.5. Corn and Soybean Row Spacing and Seeding Rate
Some agricultural producers are interested in planting wide-row corn and interseeding cover crops to improve the performance of the cover crop by allowing more light to penetrate the main crop canopy [,]. This can potentially produce more cover crop biomass and provide greater benefits to soil properties from the cover crop. Two studies were found that determined crop yield when comparing wide-row corn planted with cover crops to conventional 76 cm corn row spacing []. One of the studies found that corn grain yields were 11.5 Mg ha−1 with no cover crop at 76 cm row spacing, 11 Mg ha−1 with cover crop and 76 cm row spacing and 9.4 Mg ha−1 with cover crop and 152 cm row spacing, averaged across six site years []. The other study found that corn silage yield at 70% moisture was 78.5 Mg ha−1 with 76 cm row spacing with no cover crop, 80.8 Mg ha−1 with 118 cm row spacing and a cover crop and 68.2 Mg ha−1 with 152 cm row spacing and a cover crop []. In a study that compared corn grain yields with interseeded cover crops under 61 and 76 cm row spacing, corn grain yield was higher under 61 cm than 76 cm across cover crop treatments []. However, planting cover crops at the planting stage reduced grain yields relative to no cover crop at both row spacings, but not at other planting dates []. Two studies analyzed soybean grain yield with cover crops under different row spacings and found no interaction between soybean row spacing and grain yields [,]. These two studies show that using wider row spacing to allow for more cover crop growth may reduce corn yield. However, additional cover crop biomass production can provide forage for livestock to graze, which may offset the loss in production from planting corn at wider row spacing if producers are integrating livestock into the cropping system or enhanced ecosystem services from the cover crop occurs.
Two studies analyzed the effects of seeding rate and cover crops on corn [,] and soybean [,] grain yields. One of the studies found that corn yield tended to increase as corn seeding rate increased from 35,000 to 75,000 seeds ha−1, but that cover crops did not affect grain yield at any of the seeding rates []. The other study looking at corn seeding rate and cover crop interaction also found no effect of the cover crop on grain yield at any seeding rate []. However, at one of the three study locations, the low seeding rate (37,100 seeds ha−1) resulted in a lower grain yield than the medium (74,100 seeds ha−1) and high (111,200 seeds ha−1) seeding rates []. This study attributed the lack of differences in corn yield between seeding rates to using a flex-ear corn variety []. In the two studies that analyzed the effects of soybean seeding rate and cover crops on grain yield, the yield generally increased when seeding rate increased [,]. However, grain yields were usually less in these studies under any seeding rate when comparing weeded plots to the cover crop plots [,]. Based on these few previous studies, grain yields do not appear to be affected by the interaction between corn seeding rate and cover crops; however, in soybeans, the two studies found that interseeding cereal rye cover crop into soybeans may affect grain yield at any seeding rate.
4.6. Following-Year Grain Yields
Some cover crop species interseeded into corn and soybeans may affect the yield of crops planted the following year. Cover crops may reduce nutrient availability and soil water content, or not completely be terminated when the following crop is planted and act like weeds. Relative grain yields generally were not increased following cover crops in the studies included in this review (Figure 10A,B). Corn yield was slightly lower relative to having no cover crop in the season following interseeding of alfalfa, annual ryegrass, cereal rye and red clover cover crops (Figure 10A). When soybeans were planted the year following annual ryegrass interseeded into corn, grain yields were reduced (Figure 10B). However, cover crop mixtures did not reduce crop grain yields (Figure 10A, B). Relative grain yield of corn planted the year following interseeded cover crops was significantly affected by cover crop species at p = 0.0002, as was that of soybean at p < 0.0001. This shows that, in some cases, certain interseeded cover crop species will not benefit the following crop yields. Climate may affect the performance of crops planted following cover crops. Cover crops may take up some of the nutrients and reduce soil water available for the main crop to use. Higher annual precipitation may reduce the effect of the cover crop on the following crop yield. Mean annual temperature and average annual precipitation did not have a consistent effect on relative crop grain yield following interseeded cover crops included in this review.
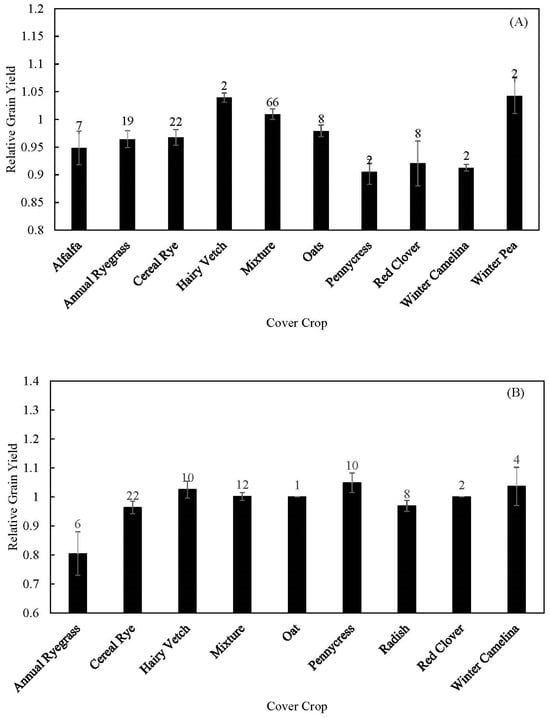
Figure 10.
Effect of interseeded cover crop species on grain yield relative to no cover crop the following year for (A) corn and (B) soybean. Error bars are standard error and number of observations is above each column.
5. Weed Control from Interseeded Cover Crops
5.1. Weed Biomass Reduction from Interseeded Cover Crop
Weeds can have negative effects on crop production by competing with desired crops being grown for resources. Weeds are traditionally controlled mechanically by tillage and cultivation and chemically with herbicides. Planting cover crops may be a biological control method to control weeds, as cover crops provide symbiotic benefits to the growing crop by controlling undesirable weeds, while not affecting grain yield []. Across studies, planting cover crops reduced weed biomass compared to weedy plots. In corn, average weed biomass was 813 kg ha−1 ± 428 kg ha−1 in plots with no weed control, 279 kg ha−1 ± 46 kg ha−1 in cover crop plots, and 58 kg ha−1 ± 14 kg ha−1 in plots that were either mechanically or chemically weeded. In soybeans, average weed biomass production was 1621 kg ha−1 ± 655 kg ha−1 in the plots with no weed control, 846 kg ha−1 ± 225 kg ha−1 under cover crop and 422 kg ha−1 ± 376 kg ha−1 in weeded plots. This shows that, across cover crop species, weeds were reduced by 66% in corn and 48% in soybeans.
5.2. Cover Crop Planting Date Effect on Weed Biomass
When cover crops are interseeded into the main crop, the growth stage of the crops may affect how well they suppress undesirable weeds. Some of the studies that measured weed biomass did not include the V stage of the crop when interseeding, so planting time was categorized into planting, 1–3 weeks after planting and >3 weeks after planting. Cover crops most effectively suppressed weeds when planted >3 weeks after planting (91 kg ha−1 ± 28.2 kg ha−1 weed biomass across 17 observations) compared to 1–3 weeks after planting (244 kg ha−1 ± 29.6 kg ha−1 weed biomass across 47 observations) and at planting (1581 kg ha−1 ± 410 kg ha−1 weed biomass across 10 observations). Planting time significantly affected weed biomass at p < 0.0001. According to the previous studies included in this review, planting cover crops after planting was more effective at controlling weeds than planting cover crops at the same time as main crop planting. This agrees with the hypothesis that weeds would be most effectively controlled when planting cover crops at early V stages of the main crop. This may be from cover crops being planted after mechanical or chemical weed control has been done following the planting of the main crops [].
5.3. Cover Crop Species Effect on Weed Biomass
Some cover crops may be more effective at controlling weeds than others due to how shade-tolerant they are, how rapidly they grow and the ability of the cover crop to outcompete weeds []. There were many previous cases where the effectiveness of a cereal rye cover crop in suppressing weeds was analyzed (Figure 11). However, fewer studies analyzed how effective other cover crops were at reducing weed biomass (Figure 11). Cereal rye and cover crop mixtures had higher weed biomass production than many of the other cover crops. However, these data might change if there were more studies analyzing the performance of other cover crop species in controlling weeds. Weed biomass production under different cover crop species was not significantly varied at a p value = 0.0590. This does not agree with the hypothesis that cover crop mixtures would be best at suppressing weeds. Studies are too few to fully support this due to many of the cover crops only being tested in one study with four site years []. In one study where much of the data came from cereal rye, this cover crop showed similar performance in controlling weeds to the other cover crop species [].
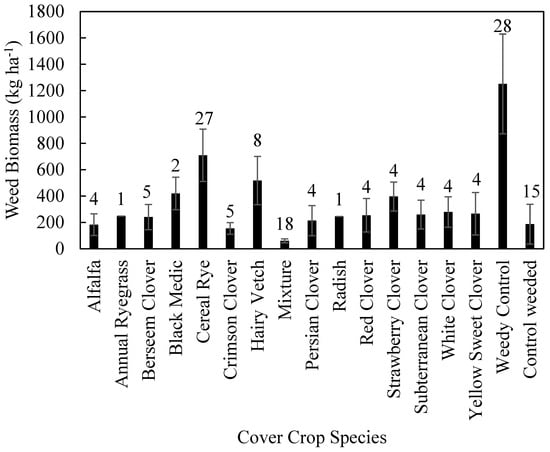
Figure 11.
Weed biomass production when different cover crop species were interseeded into corn and soybean. Error bars are standard error and number of observations is above each column.
5.4. Grain Yield Compared to Weedy Control
In the previous section on grain yields, the grain yields under cover crops were compared to weed control using either tillage or herbicides across all studies. Here only relative grain yields are included from studies with a weedy and weeded control. Relative grain yield is still determined compared to the weeded plots with no cover crop. Relative to weeded plots with no cover crop, grain yields were lowest in the weedy plots, cereal rye and radish cover crop treatments (Figure 12). There was a significant effect of weed management/cover crop species on relative grain yield at p = 0.0231. Other cover crop species had relative grain yields between 0.89 and 1.0. These findings show that interseeding cover crops can reduce weed biomass and slightly but not significantly increase crop grain yields relative to the weedy control. However, conventional weeding methods had higher grain yield relative to weedy control and some of the cover crop species.
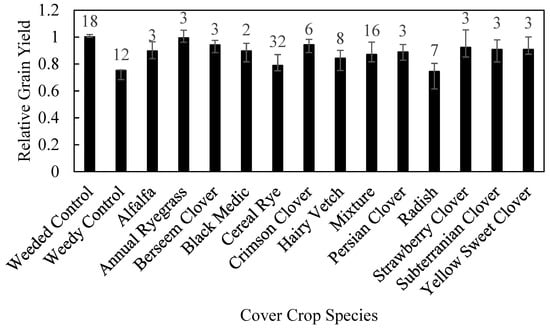
Figure 12.
Relative crop grain yield compared to weeded control on studies that analyzed the effectiveness of cover crops in suppressing weeds. Error bars are standard error and number of observations is above each column.
6. Soil Properties
6.1. Soil Chemical Properties
Among the main purposes of planting cover crops are soil and water conservation and the improvement of soil health []. There are many previous studies that have analyzed the effect of cover crops on soil properties, but most of these studies have used traditional cover crop planting methods such as drill planting during the fallow period of the main crop [,,,,,]. Few of these studies analyzed how interseeding cover crops into corn and soybeans affects soil properties. Previous studies that measured soil properties after interseeding cover crops into growing crops were conducted for periods of four years or less, which is a relatively short duration of time (Table 2, Table 3 and Table 4).
Table 2.
Effects of interseeding cover crops on soil chemical properties compared, where NT is no till, MP is moldboard plot, ST is strip till, VT is vertical tillage, CT is conventional tillage, CP is chisel plow, D is disk, RT is reduced tillage, CEC is cation exchange capacity, C is carbon, CO2 is carbon dioxide, Ca is calcium, Mg is magnesium, K is potassium, Na is sodium, N is nitrogen, NO3 is nitrate, NH4 is ammonium, P is phosphorus, PMN is potentially mineralizable nitrogen, SOC is soil organic carbon, R is reproductive stage and V is vegetative crop stage.
Table 3.
Effects of interseeding cover crops on soil physical properties. NT is no till, MP is moldboard plot, ST is strip till, RT is reduced tillage, WSA is percent water stable aggregates, DAS is dry aggregate stability, V is vegetative stage, R is reproductive stage and NA is not available.
Table 4.
Summary of previous studies that analyzed the effects of interseeding cover crops on soil biological properties. NT is no tillage, CT is conventional tillage, CP is chisel plow, V is vegetative crop stage, N is nitrogen, PLFA is phospholipid fatty acid and NA is not available.
There are many soil chemical properties that were measured following interseeding cover crops into corn and soybean. Planting cover crops may take up essential plant nutrients, reducing their availability to the main crop and affecting biochemical cycling in the soil. Unfortunately, many of the soil properties were only measured under a couple of different interseeded cover crop species (Table 2). That is why the comparison in this section primarily focuses on comparing cover crop treatments to the no-cover-crop control. The most commonly measured soil properties following interseeding cover crops were soil inorganic nitrogen, nitrate and ammonium. In many instances, planting at least one of the species of cover crop affected soil nitrate concentration compared to no cover crop (16 of 24 locations) (Table 2). However, some of these studies found that nitrate was reduced at one time but not at all times that soil nitrate concentration was measured (Table 2). Although soil ammonium concentration was measured in fewer cases (9), cover crops did not affect soil ammonium concentration in 89% of them (Table 2). About half of the time (3 of 6), planting cover crops did not affect soil total inorganic nitrogen concentration. Cover crops take up inorganic nitrogen when they are growing and convert the nitrate into organic N in the cover crop []. This is only negative if the cover crop reduces grain yields of the crop it is planted with or reduces the yield of the following crop. In Section 4, cover crops generally did not reduce crop grain yields. However, in some of the studies where interseeded cover crops reduced the yield of the crop they were planted with or the following crop, it may have been due to the cover crop taking up some of the available nitrogen in the soil.
Some previous studies also measured total nitrogen and potentially mineralizable nitrogen following planting cover crops (Table 2). Two times planting cover crops increased potentially mineralizable nitrogen with at least one of the species that was planted, but another time planting cover crops did not have any effect. However, in the four cases that measured soil total nitrogen, interseeding cover crop did not affect total nitrogen (Table 2). Also, one study measured dissolved organic nitrogen at two locations and found no effect of the cover crop []. This study also found that microbial biomass nitrogen was higher under cover crop mixture, radish and control than the crimson clover cover crop []. It is difficult to determine whether certain factors affected soil nitrogen dynamics due to the limited studies available measuring some of the soil nitrogen-related properties. However, interseeding grass cover crops tended to reduce nitrate concentration in some of the studies listed in Table 2. One of the purposes of planting cover crops is to reduce nutrient leaching and uptake free nutrients [,,]. However, cover crops did not increase the total amount of nitrogen stored in the soil in the studies included in our review.
One of the reasons cover crops are planted is to return additional carbon to the soil and increase soil organic carbon concentration. Soil organic carbon is important in soil aggregate formation and retaining nutrients []. Previous studies showed minimal benefits of interseeded cover crops to organic carbon, organic matter or particulate organic matter (Table 2). The studies included in this review were conducted for short periods of time, which may be why there were minimal benefits to soil carbon in these studies (Table 2). Also, cover crop biomass production in many of these studies was generally low (<1.1 Mg ha−1 average biomass production). The relatively low level of carbon additions from the cover crops in these studies may be why there was a lack of benefits to soil organic carbon. However, a previous review found that in many cases planting cover crops increased soil organic carbon concentration, but that biomass production was a factor that affected how much carbon was sequestered []. Also, three studies measured soil properties that indicate how effectively the soil processes soil carbon, and two studies measured how much of certain pools of carbon was contained in the soil. Two of the studies found no benefit of cover crops to microbial biomass carbon, and one found no improvement in soil CO2 burst and dissolved organic carbon [,]. However, two studies found that planting cover crops can increase soil CO2 burst [,]. This shows that interseeding cover crops may improve how quickly soil biology processes carbon, but that it does not increase the total soil organic carbon concentration when planted for a short duration of time.
A few studies also measured other soil chemical properties, including soil cation exchange capacity, pH and concentrations of many essential nutrients for plant growth. Cover crops uptake the same nutrients that plants need but may also prevent them from leaching downward in the soil []. Cover crops also may improve biochemical cycling of organic matter that will make the nutrients plant-available []. Interseeding cover crops generally did not affect soil phosphorous concentration (5 of 6 locations) and had inconsistent effects on soil potassium (Table 2). Soil potassium was increased by some species in one, was lower under some of the species in two, and was not affected by cover crops at the other three locations (Table 2). Although they were only measured in a few cases, interseeding cover crops did not affect soil pH, cation exchange capacity, magnesium, calcium, sodium and manganese concentration, but increased iron and zinc concentration in one study (Table 2). These studies show that in most cases interseeding cover crops did not affect the concentration of most essential plant nutrients besides the nitrate form of nitrogen. The finding that interseeded cover crops generally did not affect soil chemical properties does not agree with the hypothesis that soil properties would be better improved by cover crop mixtures compared to individual species and planting at early V growth stages compared to later R stages. However, there were limited studies available that compared the effect of individual species to cover crop mixtures at the same location. More studies are needed to conclude how long it takes and what cover crop species or mixtures and planting times are best to improve soil properties when interseeding into corn and soybeans.
6.2. Soil Physical Properties
Soil physical properties are important for maintaining soil structure, water infiltration, storage and plant availability and reducing soil erosion []. Many fewer studies measured soil physical properties when cover crops were interseeded into corn and soybean compared to soil chemical properties (Table 3). Also, these studies primarily measured soil water content. This is not surprising, because many producers are concerned about cover crops taking up soil water that could be used by the main crop []. In a few of the studies, cover crops planted during at least one of the planting dates reduced soil water content compared to the control (Table 3). However, most of the time interseeding cover crops into corn or soybean did not affect soil water content (Table 3). It is worth noting that water content was only measured a few times during the cover crop/main crop cycle in many of these studies [,,]. This finding is important because many would assume that interseeding cover crops into corn or soybean during the main crop growing season would reduce soil water content, which was generally not found in the papers included in this review. Also, soil temperature was measured at two locations and planting cover crops at planting reduced soil temperature, but not at the V8 or R5 stages. This may have occurred from the cover crop biomass increasing cover on the soil surface and increasing the soil surface albedo, which reduces heat adsorption by the soil [,]. However, there is only one study that measured soil temperature, which is not enough data to make a conclusion [].
Some other studies measured how interseeding cover crops affects other soil physical health measurements [,,,]. These studies found that interseeding cover crops generally did not improve wet aggregate stability, infiltration, bulk density, penetration resistance and cone index (Table 3). However, in one case each interseeded cover crop increased infiltration [] and plant-available water [], but reduced bulk density and cone index at one of the locations in another study []. In a minority of the cases, interseeding cover crops into corn or soybeans improves soil physical health, but more studies are needed that measure many of these soil physical properties to see if this is true. However, it may take a longer duration of planting interseeded cover crops to see benefits to many of these soil physical properties. A previous review found that increasing the duration that cover crops are planted increased the improvement to soil physical properties provided by cover crops []. Also, the studies included in this review found minimal improvement in soil organic carbon concentration from interseeded cover crops, which may be why there also was limited improvement in soil physical properties.
6.3. Soil Biological Properties
Compared to soil physical and chemical properties, many fewer studies measured soil biological properties when interseeding cover crops. However, soil biology is important for creating pores in the soil, decomposing organic materials and making nutrients available to plants []. One study measured soil microbial biomass, fungi and bacteria when interseeding cover crops into corn at three locations in South Dakota and found no benefit from the cover crop ([] and Table 4). However, a study conducted in Pennsylvania found that interseeding annual ryegrass cover crop into corn increased the microbial biomass and changed the soil microbial community structure []. However, there was no change in the fungal:bacterial ratio when cover crops were interseeded at this location []. Additionally, a study that was conducted at two locations in Michigan found no effect of interseeded cover crops on β-glucosidase, N-acetyl-glycosaminidase, peptidase and phosphatase enzymes (Table 4 []). These enzymes are measured as an indication of how effective the soil is at decomposing organic matter and making nitrogen and phosphorous contained in organic forms available to plants []. The results from previous studies show that interseeding cover crops may affect soil biological properties in some cases, but more studies are needed to see if this is true.
7. Summary and Conclusions
Based upon the findings of this review, interseeded cover crops that were terminated by frost produced less biomass than cover crop species that overwintered into the following spring. Planting a diverse mixture of cover crops tended to produce a larger amount of biomass in the fall, but mixtures did not produce greater spring biomass compared to single species. Most cover crop species that overwintered produced similar biomass to cereal rye, which is one of the most commonly planted cover crop species in the northern portion of the United States where most of these studies were conducted. This finding suggests that interseeding cover crops into corn and soybean during V stages may not produce greater biomass than planting winter-hardy cover crops either during late R stages or postharvest. Planting cover crops during the R stages produced the most spring biomass whether planted into corn or soybeans, but the most fall biomass was produced when cover crops were planted into corn at the planting and V4 growth stage. Factors that affected cover crop biomass production included cover crop species, tillage practice, planting date, planting method, row spacing and average annual precipitation. Broadcast cover crops performed better under conventional tillage than with no tillage. Also, as precipitation increased, spring cover crop biomass increased. In corn, row spacing wider than 76 cm increased biomass production.
Interseeded cover crops did not improve grain yields but also did not lead to a large reduction in grain yields. However, interseeding cover crops into corn or soybeans at the V4 stage or before may negatively affect crop grain yield. Cereal rye, berseem clover and winter camelina tended to reduce corn grain yield, and alfalfa, cereal rye and red clover reduced soybean grain yields. In the year following the planting of the interseeded cover crop, annual ryegrass reduced both corn and soybean grain yields, and cereal rye, alfalfa and red clover cover crops affected corn yields. Also, in semi-arid climates (500–750 mm of precipitation), interseeded cover crops had the largest negative effects on grain yield. The findings of this review suggest that cover crops should be interseeded after the V4 stage into corn and the R4 stage in soybeans to minimize the negative effects of the cover crop on grain yields. Also, cover crops reduced weed biomass compared to the weedy control with no cover crop. However, chemically weeded control or cultivation generally had less weed biomass compared to the cover crop plots. Additionally, interseeded cover crops generally did not benefit most soil properties, apart from reducing soil nitrate in the soil. Although there were limited benefits to soil properties from interseeded cover crops, these studies were conducted for four years or less and produced limited biomass, which may be why limited improvement to soil properties occurred.
Many studies measured biomass production and crop grain yields when cover crops were interseeded into corn and soybeans after a short period of time. More studies are needed that measure soil properties after cover crops are interseeded into corn and soybeans for a longer duration. It may take a long period of time to see improvement in many of the soil properties that are indicators of soil health. Also, studies are needed to study the effects of row spacing and seeding rate on cover crop biomass production and grain yields. Almost all of the previous studies planted cover crops into corn or soybeans planted at one seeding rate and row spacing. Some producers are interested in planting corn at wider row spacing and incorporating cover crops. This allows more sunlight to enter the canopy for the cover crop to grow. The increased biomass production from the cover crop may enhance benefits to the soil provided by the cover crop and provide additional forage for grazing. Additionally, more studies are needed to see how effective different cover crop species are at suppressing weeds. Cover crops may be able to serve as an alternative to chemical weed control while improving soil health.
Interseeding cover crops into corn and soybeans at conventional row spacing generally did not produce a large amount of cover crop biomass. Interseeded cover crops did not perform better than planting cover crops using traditional methods, based upon the findings of this review. Grain yields generally were not affected by interseeded cover crops. The relatively low biomass production likely is why interseeded cover crops provided minimal benefits to soil health.
Funding
This research received no external funding.
Data Availability Statement
Data will be available upon request.
Conflicts of Interest
The author declares no conflicts of interest.
References
- Uchino, H.; Iwama, K.; Jitsuyama, Y.; Yudate, T.; Nakamura, S.; Gopal, J. Interseeding a cover crop as a weed management tool is more compatible with soybean than with maize in organic farming systems. Plant Prod. Sci. 2015, 18, 187–196. [Google Scholar] [CrossRef]
- Van Eerd, L.L.; Chahal, I.; Peng, Y.; Awrey, J.C. Influence of cover crops at the four spheres: A review of ecosystem services, potential barriers, and future directions for North America. Sci. Total Environ. 2023, 858, 159990. [Google Scholar] [CrossRef] [PubMed]
- National Agricultural Statistics Service. United States Department of Agriculture. Available online: https://www.nass.usda.gov/ (accessed on 15 February 2024).
- Ketterings, Q.M.; Swink, S.N.; Duiker, S.W.; Czymmek, K.J.; Beegle, D.B.; Cox, W.J. Integrating cover crops for nitrogen management in corn systems on northeastern US dairies. Agron. J. 2015, 107, 1365–1376. [Google Scholar] [CrossRef]
- Belfry, K.D.; Van Eerd, L.L. Establishment and impact of cover crops intersown into corn. Crop Sci. 2016, 56, 1245–1256. [Google Scholar] [CrossRef]
- Snapp, S.S.; Swinton, S.M.; Labarta, R.; Mutch, D.; Black, J.R.; Leep, R.; Nyiraneza, J.; O’Neil, K. Evaluating cover crops for benefits, costs and performance within cropping system niches. Agron. J. 2005, 97, 322–332. [Google Scholar] [CrossRef]
- Toom, M.; Talgre, L.; Mäe, A.; Tamm, S.; Narits, L.; Edesi, L.; Haljak, M.; Lauringson, E. Selecting winter cover crop species for northern climatic conditions. Bio. Agric. Hort. 2019, 35, 263–274. [Google Scholar] [CrossRef]
- Fisher, K.A.; Momen, B.; Kratochvil, R.J. Is broadcasting seed an effective winter cover crop planting method? Agron. J. 2011, 103, 472–478. [Google Scholar] [CrossRef]
- Brooker, A.P.; Renner, K.A.; Basso, B. Interseeding cover crops in corn: Establishment, biomass, and competitiveness in on-farm trials. Agron. J. 2020, 112, 3733–3743. [Google Scholar] [CrossRef]
- Exner, D.N.; Cruse, R.M. Interseeded forage legume potential as winter ground cover, nitrogen source, and competitor. J. Prod. Agric. 1993, 6, 226–231. [Google Scholar] [CrossRef]
- Baributsa, D.N.; Foster, E.F.; Thelen, K.D.; Kravchenko, A.N.; Mutch, D.R.; Ngouajio, M. Corn and cover crop response to corn density in an interseeding system. Agron. J. 2008, 100, 981–987. [Google Scholar] [CrossRef]
- Lemessa, F.; Wakjira, M. Cover crops as a means of ecological weed management in agroecosystems. J. Crop Sci. Biotech. 2015, 18, 123–135. [Google Scholar] [CrossRef]
- Black, K.L.; Wells, S.; Johnson, G.A.; Lazarus, W.F.; Kraus, A. Interseeding Wide-Row Corn with Forage Cover Crops: Investigating System Potential for Expanded Economic Opportunities in Corn Production Systems. Agronomy 2023, 13, 307. [Google Scholar] [CrossRef]
- Wallace, J.M.; Isbell, S.; Hoover, R.; Barbercheck, M.; Kaye, J.; Curran, W.S. Drill and broadcast establishment methods influence interseeded cover crop performance in organic corn. Renew. Agric. Food Sys. 2021, 36, 77–85. [Google Scholar] [CrossRef]
- Peterson, C.M.; Mirsky, S.B.; VanGessel, M.J.; Davis, B.W.; Ackroyd, V.J.; Tully, K.L. Evaluation of interseeding cover crop mixtures in Mid-Atlantic double-crop soybean. Agron. J. 2021, 113, 3935–3951. [Google Scholar] [CrossRef]
- St. Aime, R.; Bridges, W.C., Jr.; Narayanan, S. Interseeded cover crops did not reduce silage corn performance in the sandy loam soils of South Carolina. Agrosys. Geosci. Environ. 2023, 6, e20364. [Google Scholar] [CrossRef]
- Sustainable Agriculture Research and Education. Managing Cover Crops Profitably; Clark, A., Ed.; SARE Outreach: College Park, MD, USA, 2013. [Google Scholar]
- Sharma, P.; Singh, A.; Kahlon, C.S.; Brar, A.S.; Grover, K.K.; Dia, M.; Steiner, R.L. The role of cover crops towards sustainable soil health and agriculture—A review paper. Am. J. Plant Sci. 2018, 9, 1935–1951. [Google Scholar] [CrossRef]
- Newton, P.; Civita, N.; Frankel-Goldwater, L.; Bartel, K.; Johns, C. What is regenerative agriculture? A review of scholar and practitioner definitions based on processes and outcomes. Front. Sustain. Food Sys. 2020, 4, 194. [Google Scholar] [CrossRef]
- Aronsson, H.; Hansen, E.M.; Thomsen, I.K.; Liu, J.; Øgaard, A.F.; Känkänen, H.; Ulén, B.J.J.O. The ability of cover crops to reduce nitrogen and phosphorus losses from arable land in southern Scandinavia and Finland. J. Soil Water Cons. 2016, 71, 41–55. [Google Scholar] [CrossRef]
- Liu, J.; Macrae, M.L.; Elliott, J.A.; Baulch, H.M.; Wilson, H.F.; Kleinman, P.J. Impacts of cover crops and crop residues on phosphorus losses in cold climates: A review. J. Environ. Qual. 2019, 48, 850–868. [Google Scholar] [CrossRef]
- Kaur, H.; Nelson, K.A.; Singh, G.; Kaur, G.; Davis, M.P. Spring applied phosphorus loss with cover crops in no-till terraced field. J. Environ. Manag. 2024, 355, 120431. [Google Scholar] [CrossRef]
- Koefender, J.; Schoffel, A.; Manfio, C.E.; Golle, D.P. Biomass and nutrient cycling by winter cover crops. Rev. Ceres 2016, 63, 816–821. [Google Scholar] [CrossRef]
- Thapa, R.; Mirsky, S.B.; Tully, K.L. Cover crops reduce nitrate leaching in agroecosystems: A global meta-analysis. J. Environ. Qual. 2018, 47, 1400–1411. [Google Scholar] [CrossRef] [PubMed]
- Blanco-Canqui, H.; Ruis, S.J. Cover crop impacts on soil physical properties: A review. Soil Sci. Soc. Am. J. 2020, 84, 1527–1576. [Google Scholar] [CrossRef]
- Abdin, O.; Coulman, B.E.; Cloutier, D.; Faris, M.A.; Zhou, X.; Smith, D.L. Yield and yield components of corn interseeded with cover crops. Agron. J. 1998, 90, 63–68. [Google Scholar] [CrossRef]
- Abdin, O.A.; Zhou, X.M.; Cloutier, D.; Coulman, D.C.; Faris, M.A.; Smith, D.L. Cover crops and interrow tillage for weed control in short season maize (Zea mays). Eur. J. Agron. 2000, 12, 93–102. [Google Scholar] [CrossRef]
- Adler, R.L.; Singh, G.; Nelson, K.A.; Weirich, J.; Motavalli, P.P.; Miles, R.J. Cover crop impact on crop production and nutrient loss in a no-till terrace topography. J. Soil Water Cons. 2020, 75, 153–165. [Google Scholar] [CrossRef]
- Alonso-Ayuso, M.; Gabriel, J.L.; Pancorbo, J.L.; Quemada, M. Interseeding cover crops into maize: Characterization of species performance under Mediterranean conditions. Field Crops Res. 2020, 249, 107762. [Google Scholar] [CrossRef]
- Antosh, E.; Liebig, M.A.; Archer, D.W.; Luciano, R. Cover crop interseeding effects on aboveground biomass and corn grain yield in western North Dakota. Crop Forage Turfgrass Manag. 2022, 8, e20148. [Google Scholar] [CrossRef]
- Barker, J.B.; Heeren, D.M.; Koehler-Cole, K.; Shapiro, C.A.; Blanco-Canqui, H.; Elmore, R.W.; Proctor, C.A.; Irmak, S.; Francis, C.A.; Shaver, T.M.; et al. Cover crops have negligible impact on soil water in Nebraska maize–soybean rotation. Agron. J. 2018, 110, 1718–1730. [Google Scholar] [CrossRef]
- Bastidas, A.M. Cover Crop Introduction into Corn (Zea mays L.)-Soybean (Glycine max L.) Cropping Systems. Ph.D. Thesis, The University of Nebraska-Lincoln, Lincoln, NE, USA, 2018. [Google Scholar]
- Berti, M.; Samarappuli, D.; Johnson, B.L.; Gesch, R.W. Integrating winter camelina into maize and soybean cropping systems. Ind. Crops Prod. 2017, 107, 595–601. [Google Scholar] [CrossRef]
- Bich, A.D.; Reese, C.L.; Kennedy, A.C.; Clay, D.E.; Clay, S.A. Corn yield is not reduced by mid-season establishment of cover crops in northern Great Plains environments. Crop Manag. 2014, 13, 1–8. [Google Scholar] [CrossRef]
- Bishop, L.; Nelson, K.A. Field pennycress seeding date and corn herbicide management effects on corn, pennycress, and soybean production. Agron. J. 2019, 111, 257–263. [Google Scholar] [CrossRef]
- Blanco-Canqui, H.; Sindelar, M.; Wortmann, C.S.; Kreikemeier, G. Aerial interseeded cover crop and corn residue harvest: Soil and crop impacts. Agron. J. 2017, 109, 1344–1351. [Google Scholar] [CrossRef]
- Brockmueller, B.; Tautges, N.E.; Vereecke, L.; Silva, E.M. Spring-seeded winter rye living mulches enhance crop biodiversity and promote reduced tillage organic soybeans. Front. Sustain. Food Syst. 2023, 6, 926606. [Google Scholar] [CrossRef]
- Brooker, A.P.; Renner, K.A.; Sprague, C.L. Interseeding cover crops in corn. Agron. J. 2020, 112, 139–147. [Google Scholar] [CrossRef]
- Carabajal-Capitán, S.; Kniss, A.R.; Jabbour, R. Seed predation of interseeded cover crops and resulting impacts on ground beetles. Environ. Entomol. 2021, 50, 832–841. [Google Scholar] [CrossRef] [PubMed]
- Caswell, K.; Wallace, J.M.; Curran, W.S.; Mirsky, S.B.; Ryan, M.R. Cover crop species and cultivars for drill-interseeding in Mid-Atlantic corn and soybean. Agron. J. 2019, 111, 1060–1067. [Google Scholar] [CrossRef]
- Chen, S.; Wyse, D.L.; Johnson, G.A.; Porter, P.M.; Stetina, S.R.; Miller, D.R.; Betts, K.J.; Klossner, L.D.; Haar, M.J. Effect of cover crops alfalfa, red clover, and perennial ryegrass on soybean cyst nematode population and soybean and corn yields in Minnesota. Crop Sci. 2006, 46, 1890–1897. [Google Scholar] [CrossRef]
- Chikoye, D.; Udensi, U.E.; Ogunyemi, S. Integrated Management of cogongrass [Imperata cylindrica (L.) Rauesch.] in corn using tillage, glyphosate, row spacing, cultivar, and cover cropping. Agron. J. 2005, 97, 1164–1171. [Google Scholar] [CrossRef]
- Curran, W.S.; Hoover, R.J.; Mirsky, S.B.; Roth, G.W.; Ryan, M.R.; Ackroyd, V.J.; Wallace, J.M.; Dempsey, M.A.; Pelzer, C.J. Evaluation of cover crops drill interseeded into corn across the Mid-Atlantic region. Agron. J. 2018, 110, 435–443. [Google Scholar] [CrossRef]
- Curtright, A.J.; Renner, K.A.; Tiemann, L.K. Availability of dissolved organic carbon drives differences in microbial nitrogen-cycling processes between two sites with cover crops interseeded into corn. Soil Sci. Soc. Am. J. 2024, 88, 56–70. [Google Scholar] [CrossRef]
- Donaldson, A.R. Weeds with a Purpose: Interseeding Cover Crops into Sweet Corn in Western Oregon. Master’s Thesis, Oregon State University, Corvallis, OR, USA, 2019. [Google Scholar]
- Fakhari, R.; Khanzade, H.; Mammadova, R.; Tobeh, A.; Moharramnezhad, S. Effects of interseeding cover crops and split nitrogen application on weed suppression in forage maize. Albanian J. Agric. Sci. 2015, 14, 278. [Google Scholar]
- Francis, H. Nitrogen Benefits when Interseeding Red Clover into Corn. Ph.D. Thesis, University of Wisconsin-Madison, Madison, WI, USA, 2020. [Google Scholar]
- Franzen, D.; Wick, A.; Bu, H.; Ritchison, D.; Mullins, B.; Chatterjee, A. Interseeded cover crops did not cause corn yield loss in eastern North Dakota. Agrosyst. Geosci. Environ. 2023, 6, e20441. [Google Scholar] [CrossRef]
- Goettl, B.; Anderson, B.; DeSutter, T.; Franzer, D.; Wick, A. Interseeded cover crops in wide-row corn: An opportunity for northern cropping systems. Crop Forage Turfgrass Manag. 2024, 10, e20268. [Google Scholar] [CrossRef]
- Hines, S.; Packham, J.; Loomis, G.; Thomas, J.; Adjesiwor, A. Impacts of interseeding cover crop into silage corn grown on wide row spacings. J. NACAA 2023, 16. [Google Scholar]
- Hively, W.D.; Cox, W.J. Interseeding cover crops into soybean and subsequent corn yields. Agron. J. 2001, 93, 308–313. [Google Scholar] [CrossRef]
- Isbell, S.A.; Alonso-Ayuso, M.; Bell, T.H.; Bradley, B.; Rowles, T.; Kaye, J.P. Nitrogen services provided by interseeded cover crops in organic corn systems. Agron. J. 2022, 114, 2458–2472. [Google Scholar] [CrossRef]
- Johnson, T.J.; Kaspar, T.C.; Kohler, K.A.; Corak, S.J.; Logsdon, S.D. Oat and rye overseeded into soybean as fall cover crops in the upper Midwest. J. Soil Water Cons. 1998, 53, 276–279. [Google Scholar]
- Johnson, K.L.; Kandel, H.J.; Samarappuli, D.P.; Berti, M.T. Interseeding camelina and rye in soybean with varying maturity provides soil cover without affecting soybean yield. Agronomy 2021, 11, 353. [Google Scholar] [CrossRef]
- Jones, M.E.; Harwood, R.R.; Dehne, N.C.; Smeenk, J.; Parker, E. Enhancing soil nitrogen mineralization and corn yield with overseeded cover crops. J. Soil Water Cons. 1998, 53, 245–249. [Google Scholar]
- Kandel, H.J.; Samarappuli, D.P.; Johnson, K.L.; Berti, M.T. Soybean relative maturity, not row spacing, affected interseeded cover crops biomass. Agriculture 2021, 11, 441. [Google Scholar] [CrossRef]
- Kaspar, T.C.; Radke, J.K.; Laflen, J.M. Small grain cover crops and wheel traffic effects on infiltration, runoff, and erosion. J. Soil Water Cons. 2001, 56, 160–164. [Google Scholar]
- Kaspar, T.C.; Parkin, T.B.; Jaynes, D.B.; Cambardella, C.A.; Meek, D.W.; Jung, Y.S. Examining changes in soil organic carbon with oat and rye cover crops using terrain covariates. Soil Sci. Soc. Am. J. 2006, 70, 1168–1177. [Google Scholar] [CrossRef]
- Koehler-Cole, K.; Elmore, R.W. Seeding rates and productivity of broadcast interseeded cover crops. Agronomy 2020, 10, 1723. [Google Scholar] [CrossRef]
- Koehler-Cole, K.; Elmore, R.W.; Blanco-Canqui, H.; Francis, C.A.; Shapiro, C.A.; Proctor, C.A.; Ruis, S.J.; Irmak, S.; Heeren, D.M. Cover crop planting practices determine their performance in the US Corn Belt. Agron. J. 2023, 115, 526–543. [Google Scholar] [CrossRef]
- Koehler-Cole, K.; Elmore, R.W.; Blanco-Canqui, H.; Francis, C.A.; Shapiro, C.A.; Proctor, C.A.; Ruis, S.J.; Irmak, S.; Heeren, D.M.; Ferguson, R.B. Cover crop productivity and subsequent soybean yield in the western Corn Belt. Agron. J. 2020, 112, 2649–2663. [Google Scholar] [CrossRef]
- Liu, R.M.; Wells, S.; Garcia, A.G. Cover crop potential of winter oilseed crops in the Northern U.S. Corn Belt. Arch. Agron. Soil Sci. 2019, 65, 1845–1859. [Google Scholar] [CrossRef]
- Marcos, F.M.; Acharya, J.; Parvej, M.R.; Robertson, A.E.; Licht, M.A. Cereal rye cover crop seeding method, seeding rate, and termination timing effects corn development and seedling disease. Agron. J. 2023, 115, 1356–1372. [Google Scholar] [CrossRef]
- Mohammed, Y.A.; Patel, S.; Matthees, H.L.; Lenssen, A.W.; Johnson, B.L.; Wells, M.S.; Forcella, F.; Berti, M.T.; Gesch, R.W. Soil nitrogen in response to interseeded cover crops in maize–soybean production systems. Agronomy 2020, 10, 1439. [Google Scholar] [CrossRef]
- Mohammed, Y.A.; Matthees, H.L.; Gesch, R.W.; Patel, S.; Forcella, F.; Aasand, K.; Steffl, N.; Johnson, B.L.; Wells, S.M.; Lenssen, A.W. Establishing winter annual cover crops by interseeding into maize and soybean. Agron. J. 2020, 112, 719–732. [Google Scholar] [CrossRef]
- Moore, V.M.; Mirsky, S.B. Cover crop biomass production across establishment methods in mid-Atlantic corn. Agron. J. 2020, 112, 4765–4774. [Google Scholar] [CrossRef]
- Nelson, K.A.; Belknap, R.A.; Brake, D.; Singh, G. Overseed timing of ryegrass and cereal rye in soybean affects rotational crops in upstate Missouri. Crop Forage Turfgrass Manag. 2022, 8, e20184. [Google Scholar] [CrossRef]
- Nelson, K.A.; Smeda, R.J.; Smoot, R.L. Spring-interseeded winter rye seeding rates influence weed control and organic soybean yield. Int. J. Agron. 2011, 2011, 571973. [Google Scholar] [CrossRef]
- Nguyen, L.T.; Ortner, K.A.; Tiemann, L.K.; Renner, K.A.; Kravchenko, A.N. Soil properties after one year of interseeded cover cropping in topographically diverse agricultural landscape. Agric. Ecosyst. Environ. 2022, 326, 107803. [Google Scholar] [CrossRef]
- Noland, R.L.; Wells, M.S.; Sheaffer, C.C.; Baker, J.M.; Martinson, K.L.; Coulter, J.A. Establishment and function of cover crops interseeded into corn. Crop Sci. 2018, 58, 863–873. [Google Scholar] [CrossRef]
- Nunes, M.R.; van Es, H.M.; Schindelbeck, R.; Ristow, A.J.; Ryan, M. No-till and cropping system diversification improve soil health and crop yield. Geoderma 2018, 328, 30–43. [Google Scholar] [CrossRef]
- Peterson, A.T.; Berti, M.T.; Samarappuli, D. Intersowing cover crops into standing soybean in the US Upper Midwest. Agronomy 2019, 9, 264. [Google Scholar] [CrossRef]
- Rabin, K.C.; Johnson, G.A.; Strock, J.S.; Jordan, N.R.; Garcia y Garcia, A. Tillage and cover crop mixtures interseeded in maize–soybean in the upper Midwest. Agron. J. 2023, 115, 1188–1201. [Google Scholar]
- Reinbott, T.M.; Conley, S.P.; Blevins, D.G. No-tillage corn and grain sorghum response to cover crop and nitrogen fertilization. Agron. J. 2004, 96, 1158–1163. [Google Scholar] [CrossRef]
- Ruis, S.J.; Blanco-Canqui, H.; Elmore, R.W.; Proctor, C.; Koehler-Cole, K.; Ferguson, R.B.; Francis, C.B.; Shapiro, C.A. Impacts of cover crop planting dates on soils after four years. Agron. J. 2020, 112, 1649–1665. [Google Scholar] [CrossRef]
- Rusch, H.L.; Coulter, J.A.; Grossman, J.M.; Johnson, G.A.; Porter, P.M.; Garcia y Garcia, A. Towards sustainable maize production in the US upper Midwest with interseeded cover crops. PLoS ONE 2020, 15, e0231032. [Google Scholar] [CrossRef] [PubMed]
- Schmitt, M.B.; Berti, M.; Samarappuli, D.; Ransom, J.K. Factors affecting the establishment and growth of cover crops intersown into maize (Zea mays L.). Agronomy 2021, 11, 712. [Google Scholar] [CrossRef]
- Sedghi, N.; Fox, R.J.; Sherman, L.; Gaudlip, C.; Weil, R.R. Aerial interseeding and planting green to enhance nitrogen capture and cover crop biomass carbon. J. Soil Water Cons. 2023, 78, 282–298. [Google Scholar] [CrossRef]
- Stanton, V.L.; Haramoto, E.R. Biomass potential of drill interseeded cover crops in corn in Kentucky. Agron. J. 2021, 113, 1238–1247. [Google Scholar] [CrossRef]
- Thelen, K.D.; Mutch, D.R.; Martin, T.E. Utility of interseeded winter cereal rye in organic soybean production systems. Agron. J. 2004, 96, 281–284. [Google Scholar] [CrossRef]
- Thompson, N.M.; Armstrong, S.D.; Roth, R.T.; Ruffatti, M.D.; Reeling, C.J. Short-run net returns to a cereal rye cover crop mix in a midwest corn–soybean rotation. Agron. J. 2020, 112, 1068–1083. [Google Scholar] [CrossRef]
- Uchino, H.; Iwama, K.; Jitsuyama, Y.; Yudate, T.; Nakamura, S. Yield losses of soybean and maize by competition with interseeded cover crops and weeds in organic-based cropping systems. Field Crops Res. 2009, 113, 342–351. [Google Scholar] [CrossRef]
- Uchino, H.; Iwama, K.; Jitsuyama, Y.; Ichiyama, K.; Sugiura, E.R.I.; Yudate, T.; Makamura, S.; Gopal, J.A.I. Effect of interseeding cover crops and fertilization on weed suppression under an organic and rotational cropping system: 1. Stability of weed suppression over years and main crops of potato, maize and soybean. Field Crop. Res. 2012, 127, 9–16. [Google Scholar] [CrossRef]
- Wallace, J.M.; Curran, W.S.; Mirsky, S.B.; Ryan, M.R. Tolerance of interseeded annual ryegrass and red clover cover crops to residual herbicides in mid-Atlantic corn cropping systems. Weed Technol. 2017, 31, 641–650. [Google Scholar] [CrossRef]
- Wilson, M.L.; Allan, D.L.; Baker, J.M.; Pagliari, P.H. Comparing methods for overseeding winter rye into standing soybean. Agrosystems Geosci. Environ. 2019, 2, 1–7. [Google Scholar] [CrossRef]
- Youngerman, C.Z.; DiTommaso, A.; Curran, W.S.; Mirsky, S.B.; Ryan, M.R. Corn density effect on interseeded cover crops, weeds, and grain yield. Agron. J. 2018, 110, 2478–2487. [Google Scholar] [CrossRef]
- Rohatgi, A. Web Plot Digitizer. 12 March 2024. Available online: https://apps.automeris.io/wpd/ (accessed on 12 March 2024).
- US Climate Data. 11 March 2024. Available online: https://www.usclimatedata.com/ (accessed on 12 March 2024).
- Worldclimate.com. World Climate. 11 March 2024. Available online: http://www.worldclimate.com/ (accessed on 12 March 2024).
- Bonferroni, C.E. Teoria Statistica delle Classi e Calcolo delle Probabilità; Pubblicazioni del R Istituto Superiore di Scienze Economiche e Commerciali di Firenze; Seeber: Florence, Italy, 1936. [Google Scholar]
- SAS Institute Inc. SAS/STAT 13.1 User’s Guide Chapter 26 The Anova Procedure; SAS Institute Inc.: Cary, NC, USA, 2013. [Google Scholar]
- Ruis, S.J.; Blanco-Canqui, H.; Creech, C.F.; Koehler-Cole, K.; Elmore, R.W.; Francis, C.A. Cover crop biomass production in temperate agroecozones. Agron J. 2019, 111, 1535–1551. [Google Scholar] [CrossRef]
- Calderon, F.J.; Nielsen, D.; Acosta-Martinez, V.; Vigil, M.F.; Drew, L.Y.O.N. Cover crop and irrigation effects on soil microbial communities and enzymes in semiarid agroecosystems of the Central Great Plains of North America. Pedosphere 2016, 26, 192–205. [Google Scholar] [CrossRef]
- Nielsen, D.C.; Lyon, D.J.; Hergert, G.W.; Higgins, R.K.; Holman, J.D. Cover crop biomass production and water use in the Central Great Plains. Agron. J. 2015, 107, 2047–2058. [Google Scholar] [CrossRef]
- Soltani, N.; Nurse, R.E.; Jhala, A.J.; Sikkema, P.H. The critical weed-free period in glyphosate-resistant soybean in Ontario is similar to previous estimates using glyphosate-susceptible soybean. Can. J. Plant Sci. 2019, 99, 437–443. [Google Scholar] [CrossRef]
- Tursun, N.; Datta, A.; Sakinmaz, M.S.; Kantarci, Z.; Knezevic, S.Z.; Chauhan, B.S. The critical period for weed control in three corn (Zea mays L.) types. Crop Protect. 2016, 90, 59–65. [Google Scholar] [CrossRef]
- Knezevic, S.Z.; Pavlovic, P.; Osipitan, O.A.; Barnes, E.R.; Beiermann, C.; Oliveira, M.C.; Lawrence, N.; Scott, J.E.; Jhala, A. Critical time for weed removal in glyphosate-resistant soybean as influenced by preemergence herbicides. Weed Technol. 2019, 33, 393–399. [Google Scholar] [CrossRef]
- Mennan, H.; Jabran, K.; Zandstra, B.H.; Pala, F. Non-chemical weed management in vegetables by using cover crops: A review. Agronomy 2020, 10, 257. [Google Scholar] [CrossRef]
- Osipitan, O.A.; Dille, J.A.; Assefa, Y.; Knezevic, S.Z. Cover crop for early season weed suppression in crops: Systematic review and meta-analysis. Agron. J. 2018, 110, 2211–2221. [Google Scholar] [CrossRef]
- McClelland, S.C.; Paustian, K.; Schipanski, M.E. Management of cover crops in temperate climates influences soil organic carbon stocks: A meta-analysis. Ecol. Appl. 2021, 31, e02278. [Google Scholar] [CrossRef]
- DuPont, S.T.; Ferris, H.; Van Horn, M. Effects of cover crop quality and quantity on nematode-based soil food webs and nutrient cycling. Appl. Soil Ecol. 2009, 41, 157–167. [Google Scholar] [CrossRef]
- Krstić, Đ.; Vujić, S.; Jaćimović, G.; D’Ottavio, P.; Radanović, Z.; Erić, P.; Ćupina, B. The effect of cover crops on soil water balance in rain-fed conditions. Atmosphere 2018, 9, 492. [Google Scholar] [CrossRef]
- Fageria, N.K. Role of soil organic matter in maintaining sustainability of cropping systems. Commun. Soil Sci. Plant Anal. 2012, 43, 2063–2113. [Google Scholar] [CrossRef]
- Adhikari, K.; Hartemink, A.E. Linking soils to ecosystem services—A global review. Geoderma 2016, 262, 101–111. [Google Scholar] [CrossRef]
- Yang, X.M.; Reynolds, W.D.; Drury, C.F.; Reeb, M.D. Cover crop effects on soil temperature in a clay loam soil in southwestern Ontario. Can. J. Soil Sci. 2021, 101, 761–770. [Google Scholar] [CrossRef]
- Decaëns, T.; Jiménez, J.J.; Gioia, C.; Measey, G.J.; Lavelle, P. The values of soil animals for conservation biology. Eur. J. Soil Biol. 2006, 42, S23–S38. [Google Scholar] [CrossRef]
- Karaca, A.; Cetin, S.C.; Turgay, O.C.; Kizilkaya, R. Soil enzymes as indication of soil quality. In Soil Enzymology; Soil Biology; Shukla, G., Varma, A., Eds.; Springer: Berlin/Heidelberg, Germany, 2011; Volume 22, pp. 119–148. [Google Scholar]
Disclaimer/Publisher’s Note: The statements, opinions and data contained in all publications are solely those of the individual author(s) and contributor(s) and not of MDPI and/or the editor(s). MDPI and/or the editor(s) disclaim responsibility for any injury to people or property resulting from any ideas, methods, instructions or products referred to in the content. |
© 2024 by the author. Licensee MDPI, Basel, Switzerland. This article is an open access article distributed under the terms and conditions of the Creative Commons Attribution (CC BY) license (https://creativecommons.org/licenses/by/4.0/).