Article

Enrichment of Grain Anthocyanin Content through Marker-Assisted Breeding for Ant1, Ant2 or HvMyc2 Genes in Barley (Hordeum vulgare L.)

by
Tatjana V. Kukoeva
1,2,
Camilla A. Molobekova
1,3,
Igor V. Totsky
1,
Gennady V. Vasiliev
1,2,
Artem Yu. Pronozin
1,2,
Dmitry A. Afonnikov
1,2,3,
Elena K. Khlestkina
1,4 and
Olesya Yu. Shoeva
1,2,3,*
1
Institute of Cytology and Genetics (ICG), Siberian Branch of Russian Academy of Sciences (SB RAS), Novosibirsk 630090, Russia
2
Kurchatov Genomic Center of ICG SB RAS, Novosibirsk 630090, Russia
3
Faculty of Natural Sciences, Novosibirsk State University, Novosibirsk 630090, Russia
4
N.I. Vavilov All-Russian Institute of Plant Genetic Resources (VIR), St. Petersburg 190000, Russia
*
Author to whom correspondence should be addressed.
Agronomy 2024, 14(6), 1231; https://doi.org/10.3390/agronomy14061231
Submission received: 18 April 2024 / Revised: 19 May 2024 / Accepted: 31 May 2024 / Published: 6 June 2024
(This article belongs to the Section Crop Breeding and Genetics)

Abstract

:
Breeding of cereals with anthocyanin-rich grains is promising for health food production. Here, we transferred genes responsible for activation of anthocyanin biosynthesis in the grain pericarp (Ant1 and Ant2) and aleurone (HvMyc2) to elite barley cultivars Aley, Tanay, and Vorsinsky-2 by marker-assisted backcrossing. Donors were Bowman lines BW648 and BW418. Three pairs of near-isogenic lines (NILs) with purple or blue colored grains were chosen in generation BC6F2 and propagated up to BC6F6. Genotyping-by-sequencing of resulting NILs and parental lines showed that the NILs carry 4.6–17.6% of donor SNPs including those at target loci. Unexpected big blocks of donor SNPs were revealed in some NILs on chromosomes 1H and 5H that do not carry target loci. The NILs possessed 274% and 12% higher anthocyanin (40.0–170.4 μg/g) and total phenolic content (2367.2–4396.8 μg/g), respectively, compared to original cultivars (18.3–33.1 μg/g and 2319.6–3768.5 μg/g). On average, antioxidant activity was 14% higher, although some lines showed reduced activity. NILs’ productivity depended on growth conditions and was similar to that of the recurrent cultivars. Hence, the applied breeding strategy is an effective approach to enrichment of grain anthocyanin content in barley.

1. Introduction

Barley (Hordeum vulgare L.) is one of the main crops in the world. As of 2022, the world’s barley area was 47 million hectares, thus ranking fifth after wheat, maize, rice, and soybean (http://www.fao.org/faostat accessed on 22 March 2024). A chemical analysis has shown that the barley grain is rich in such nutrients as dietary fiber β-glucans, tocols, minerals, and polyphenols. On the basis of research indicating that regular consumption of barley may prevent or control cardiovascular disease by lowering blood cholesterol concentration, in 2006, the US Food and Drug Administration listed barley as a functional food product [1]. Nonetheless, its consumption as edible grains does not exceed 2% of all produced barley grains around the world [2].
Currently, there is a demand for new barley varieties with high quality of the grain that could be used for the production of barley-derived health foods [3]. Besides β-glucans, anthocyanins are also in the focus of attention of geneticists and breeders striving to improve the quality of barley grains [3,4]. These compounds can be biosynthesized in the pericarp or in the aleurone layer of the barley caryopsis, resulting in a purple or blue color of the grain, respectively. The most common anthocyanin in purple barley is cyanidin 3-glucoside, whereas in blue barley, the most abundant anthocyanin is delphinidin 3-glucoside [5,6]. Both human and animal studies have revealed that anthocyanins are functional nutrients, which are able to affect the onset and progression of chronic disorders, such as atherosclerosis, metabolic syndrome, cardiovascular and neurodegenerative diseases, and many cancer types, and also can help to control weight [7]. The health-promoting effects of anthocyanins are related to their antioxidant properties as well as their ability to interact with cell receptors, kinases, or transcription factors, and to modulate signaling pathways [7]. In recent years, breeding for a high anthocyanin content in the grain of major crops including barley came into the spotlight [8,9]. Today, barley cultivars accumulating these health-promoting compounds are actively bred in the world [10], and recipes involving such grains are devised in cuisines [11]. As the world’s experience shows breeding anthocyanin-rich cultivars of cereals can take a long period of time particularly due to maternal inheritance of anthocyanin-accumulating pericarp tissues. For example, it took fourteen years to breed the first commercial purple hard bread wheat cv. CDC Primepurple (the University of Saskatchewan, Canada) [12]. Application of the molecular markers for target genes can substantially facilitates the selection of the hybrid plants with the required genotype and speeds up the breeding process [13].
In barley, the genes which control anthocyanin biosynthesis in grains have been revealed [14]. In pericarp, it is controlled by two complementary genes, Ant1 and Ant2, mapped to chromosomes 7HS and 2HL, respectively [14]. Allelic diversity of these genes has been investigated, and polymorphic sequence-tagged site (STS) markers that distinguish dominant alleles of the genes responsible for the purple color of grains have been found [15]. These markers have been successfully applied to select anthocyanin-rich plants in F2 hybrid populations obtained by crossing cvs. Biom, Golden Promise, and Krasnoyarsky-1 (having yellow grains) and donor Bowman near-isogenic line (NIL) BW648 (accumulating an anthocyanin in grains) [16].
Accumulation of anthocyanins in the barley aleurone is controlled by five Blx genes: Blx1, Blx3, and Blx4 (clustered on chromosome 4HL), and Blx2 and Blx5 (clustered on 7HL) [14]. The gene cluster responsible for blue pigmentation of the barley grain has been identified on chromosome 4HL. It includes H. vulgare Myc2 (HvMyc2), HvMpc2, and F3′5′h, which have been assumed to be Blx genes. A loss-of-function (frame shift) mutation in HvMyc2 of noncolored compared to blue-grained barley has been revealed, and a cleaved amplified polymorphic sequences (CAPS) marker intended to distinguish dominant and recessive alleles of this gene has been designed [17].
Available markers make it possible to develop effective breeding programs for enrichment of grain anthocyanin content. However, while transferring target genes from donors, the linked genomic regions are also introduced into a genome of the developed genotype; in addition to target genes these regions can also affect the agronomic traits of the resulting lines. In the current study, a six-time backcross breeding strategy—with the help of molecular markers designed for target genes that control anthocyanin pigmentation in the grain—was tested to get anthocyanin-rich barley NILs in three genetic backgrounds: cvs. Aley, Tanay, and Vorsinsky-2, which are adapted for growing in Western Siberia. To study the features of inheritance of the genomic regions carrying target genes while transferring them from donor lines to recurrent cultivars and their effects on grain quality and yield parameters, the resulting lines were characterized genetically by the genotyping-by-sequencing (GBS) approach. Besides, biochemical parameters such as the total contents of anthocyanins and phenolic compounds and antioxidant activity (AOA) in the grain as well as agronomic traits were evaluated. Such a comprehensive study allowed revealing specific features of transferring of target genes controlling anthocyanin pigmentation from donors into new barley genotypes and effects of the genomic regions inherited from donors on quality and agronomic traits of the lines. The results are important as a basis for the development of an effective breeding strategy for improving barley cultivars for functional food production.

2. Materials and Methods

2.1. Plant Material and the Breeding Strategy

To create anthocyanin-rich cultivars adapted to the West Siberian region, dominant alleles of regulatory genes Ant1, Ant2, and HvMyc2, which control purple and blue grain pigmentation, respectively, were transferred from donor lines to local cultivars (adapted to growing in this region) via a marker-assisted selection (MAS)-based backcrossing approach (Figure 1). A description of the cultivars used as recurrent parental lines is given in Table 1. Near-isogenic and inbred lines BW648 (NGB22213, NordGen, Alnarp, Sweden) and BW418 (NGB20651), respectively (with the purple and blue color of the grain), which were developed in the genetic background of yellow-grained spring barley cultivar Bowman [18], served as donors of the anthocyanin grain pigmentation traits.

2.2. Molecular Markers

DNA was extracted from young leaves of parental and individual progeny plants according to a procedure described by Plaschke et al. [19]. Intragenic STS markers for genes Ant1 and Ant2 and a CAPS marker for the HvMyc2 gene were used for screenings (Table 2). The PCRs with these markers were carried out according to the procedures described in ref. [15,16,17], respectively. Amplicons and restriction fragments were separated by 2% agarose gel (Dia-M, Russia) electrophoresis and visualized under UV light by means of a Molecular Imager® Gel DocTM XR+ System (Bio-Rad Laboratories, Inc., Hercules, CA, USA).

2.3. GBS

This procedure was performed using resources of the core facility Genome Research at the Institute of Cytology and Genetics (ICG), the Siberian Branch of the Russian Academy of Sciences (SB RAS; Novosibirsk, Russia).
Total genomic DNA was extracted from young leaf tissue of a single plant of each genotype by means of the DNEasy Plant Mini Kit (Qiagen Inc., Valencia, CA, USA). The concentration and purity of the tested samples were determined by gel electrophoresis and on a NanoDrop 2000 Spectrophotometer (Thermo Scientific™, USA). Genomic DNA was digested with restriction enzymes MspI (C^CGG) and PstI (CTGCA^G) (NEB, Ipswich, MA, USA), which were recommended by Poland et al. [20]. GBS libraries were generated by ligating the digested DNA to unique nucleotide adapters (barcodes) followed by PCR with sequencing primers. Equimolar amounts of each library were mixed, and 210–520 bp fragments were excised using a BluePippin instrument (SageScience, Beverly, MA, USA). Sequencing was performed on an Illumina NextSeq 550 platform by a 150 bp single-ended protocol.
To process the raw data, the GBS-DP pipeline was chosen, which included alignment, variant calling, and genetic distance analysis steps [21]. As a reference barley genome, the Morex_V3 assembly was used (DOI:10.5447/ipk/2021/3). The proportion of polymorphisms, mainly single-nucleotide polymorphisms (SNPs), indicating the donor genotype in a NIL (donor SNPs, dSNPs), was examined to evaluate the effectiveness of the recurrent genetic-background recovery. The found SNPs were “mapped” (assigned to physical positions on one of seven chromosomes) to the reference genome and visualized. The distribution of dSNPs throughout a NIL’s genome was also examined to identify regions with the highest frequency of dSNPs. For this purpose, a custom R script was used to divide the genome into 1 Mbp blocks and to determine the ratio of the number of dSNPs to the total number of SNP markers in each block. Subsequently, a graphical representation was generated to illustrate the density profile of all SNPs alongside the density of dSNPs.

2.4. Total Phenolic and Anthocyanin Contents

The total phenolic content (TPC) was determined according the Folin–Ciocalteu spectrophotometric method described in ref. [22], with modifications. Phenolic compounds were extracted from 100 mg of barley flour prepared in an LZM-1M laboratory mill (VNIIZ, Moscow, Russia) using 1 mL of acidified methanol (methanol/water/HCl, 80:10:1, v/v/v) at room temperature (25 °C) overnight. The extraction procedures were carried out in triplicate for each line/cultivar of barley. The mixture was centrifuged at 3000 rcf (relative centrifugal force) for 10 min at 20 °C on a centrifuge (Eppendorf, Hamburg, Germany); 120 µL of the supernatant was collected into new tubes, where 900 µL of a freshly diluted 10-fold Folin–Ciocalteu reagent (AppliChem GmbH, Darmstadt, Germany) was added. The mixture was allowed to equilibrate at room temperature for 5 min and then mixed with 900 µL of a sodium carbonate solution (60 g/L). In the presence of phenolic compounds, the solution turns dark blue, whereas in their absence it becomes discolored. After incubation at room temperature for 90 min, absorbance of the mixture was read at 725 nm on a SmartSpec Plus spectrophotometer (Bio-Rad, Hercules, CA, USA). Acidified methanol was used as a blank. Freshly diluted ferulic acid at concentration 320, 160, 80, 40, or 20 µg/mL was employed to build a calibration curve; the results were expressed in micrograms of ferulic acid equivalents per gram of flour.
To measure the total anthocyanin content (TAC), aliquots of 400–450 µL were collected after centrifugation of acidified methanol extracts prepared by the same method as described above for TPC measurement, but the absorbance of the mixture was read at 530 nm. The concentration of anthocyanins in micrograms of cyanidin-3 glycoside per gram of dry weight (DW) of a sample was calculated according to the protocol described in ref. [23]. Changes in TAC and TPC relative to the recurrent cultivars were calculated as follows:
T A C o r   T P C   o f   N I L T A C o r   T P C   o f   r e c c u r e n t   c u l t i v a r 1 × 100 %

2.5. AOA

This activity was measured using free radical 2,2-diphenyl-1-picrylhydrazyl (DPPH) according to the procedure described in ref. [22], with modifications. The method is based on a DPPH reduction reaction in a methanol solution, which has a violet color, but when reduced it gets discolored and the solution turns pale yellow.
Ground barley samples (200 mg) were incubated in 1 mL of methanol overnight at room temperature. The extraction procedures were carried out in triplicate for each line/cultivar of barley. The mixture was centrifuged at 3000 rcf for 10 min at 20 °C (Eppendorf centrifuge, Hamburg, Germany), 25 µL of the supernatant was collected into new tubes, where 975 µL of a fresh DPPH solution with concentration 6 × 10⁻⁵ M was added. Absorbance at 515 nm was read at 0 and 30 min. Methanol served as a blank. AOA was calculated via the formula: A O A = 1 D t = 30 D t = 0 × 100 % . Changes in AOA relative to recurrent cultivars were calculated via the same formula as used for TAC and TPC.

2.6. Phenotyping

To determine an influence of the recombinant fragments inherited from the donor lines on growth and yield parameters, plants of recurrent cultivars and six obtained NILs were grown in an experimental field (Novosibirsk, 54.847102° N and 83.127422° E) in 2022 and 2023. The plants were grown in 1 m rows, three rows per line. The following parameters were scored for 20 plants in each row (60 plants per line in total): the grain number and grain weight per plant, plant height, main-spike length, the spike number per plant, and spike density, which was evaluated as the number of seeds per 4 cm of a spike from its base. Thousand-grain weight in each row was calculated too. In addition, the growth parameters were assessed in 19–20 plants grown in the autumn of 2022 and spring of 2023 in a greenhouse at the ICG SB RAS (Novosibirsk, Russia).

2.7. Statistical Analysis

The Shapiro–Wilk test was performed to evaluate the normality of a distribution of data for biochemical parameters of the grain. Because the data were not normally distributed (p < 0.05), the median test was used for a comparison of biochemical parameters between the colored lines and corresponding parental cultivars; p < 0.05 indicated significant differences. The Kruskal–Wallis H test was carried out for determining an influence of factors “growth conditions,” “grain color,” and “genetic background” on biochemical parameters of the grain of the barley NILs. Correlations between the parameters were evaluated by means of Spearman’s rank correlation coefficients. Statistical analysis of the data was carried out in STATISTICA v.6.1 software (StatSoft, Inc., Tulsa, OK, USA).
For field test results, homogeneity of triplicates was first assessed by the Kruskal–Wallis test. If differences were detected (p < 0.05), then Dunn’s test was performed for multiple comparisons. An outlier replicate was excluded from the analysis, and the remaining replicates were combined into one sample containing 40 or 60 individual plants. Pairwise comparisons between a NIL and the corresponding recurrent parent were conducted by the Mann–Whitney U test for yield parameters within each growing season; at p < 0.05, differences were considered significant.
Biplot principal component analysis (PCA) was performed on the data using freeware PAST4.16 [24] to highlight similarities and differences among all the genotypes and analyzed yield parameters.

3. Results

3.1. MAS of the Anthocyanin-Rich Barley NILs

The breeding strategy chosen to construct new purple- and blue-grained lines based on the cultivars Aley, Tanay, and Vorsinsky-2 adapted to growing in Western Siberia is illustrated in Figure 1. The program was started in spring 2016. At the first stage, each of the parental recipient cultivars was pollinated with pollen of donor lines BW648 and BW418. F2 progenies were obtained by self-pollination of the resultant F1 hybrids in autumn 2016. Three-step selection of F2 plants homozygous for genes Ant1 and Ant2 was carried out next (Table 3). Because the Ant1 gene has a pleiotropic effect on the pigmentation of the grain and vegetative tissues, among 61–89 F2 progenies obtained in each crossing combination, only plants with a red color of leaf sheath bases were chosen for further genotyping. DNA was extracted from individual plants and genotyped with the Ant1 and Ant2 STS markers that were polymorphic in amplicon length between donor lines and recipient cultivars (Figure S1). Segregation of the Ant1 and Ant2 genes followed the Mendelian inheritance ratio of 1:2:1 in all three populations, except for Ant2 in populations derived by crossing cv. Aley × BW648 (Table S1). Homozygous plants having donor-like alleles of genes Ant1 and Ant2 were selected (for an example of the selection based on the STS marker genotyping, see Figure S2), 5–14 plants in total were chosen in each crossing combinations, and 4–6 of them were backcrossed with the recurrent parental cultivars. Five additional backcrosses were performed from 2017 to 2019 with two backcrosses per year; only plants heterozygous for the Ant2 gene (heterozygosity at each stage was confirmed by STS marker) were pollinated by recurrent parents, on average 1–15 hybrid plants were backcrossed at each stage (Table 3). In generation BC6F2, which was obtained in spring 2021, final phenotyping and genotyping of the hybrids were carried out, and 3–10 individual plants homozygous for the target genes were selected and propagated individually up to generation BC6F6, which was grown in the summer of 2022. The resultant families were homogeneous and had a purple color of the grain. One of the families from each crossing combination was selected and used in further analysis. The newly developed lines were named pAley, pTanay, and pVorsinsky-2, where p means purple (Figure 2).
The same breeding strategy and timeline as those used for purple-grained lines were applied to create blue-grained lines (Figure 1), but in this case, due to effect xenia (influence of pollen on the resultant seed characteristics, particularly color of aleurone after fertilization) it was possible to select blue grains of F2 generation by visual evaluation of their color. The selected grains were planted and among them, the hybrids homozygous for the dominant allele of the HvMyc2 gene were selected using an intragenic CAPS marker, which revealed restriction fragment length polymorphism of PCR products between donor lines and recipient cultivars (Figures S1 and S2). Since white grains were excluded, in F2 population, the recessive homozygotes were absent and only heterozygotes and dominant homozygotes were segregated according to the Mendelian inheritance ratio 2:1 in all crossing combinations except for Vorsinsky-2 × BW418 (Table S1). All resultant 12–15 families of generation BC6F6 were homogeneous and had a blue color of the grain. One of the families from each crossing combination was selected and used in further analysis. The newly developed lines were named bAley, bTanay, and bVorsinsky-2, where b means blue (Figure 2).

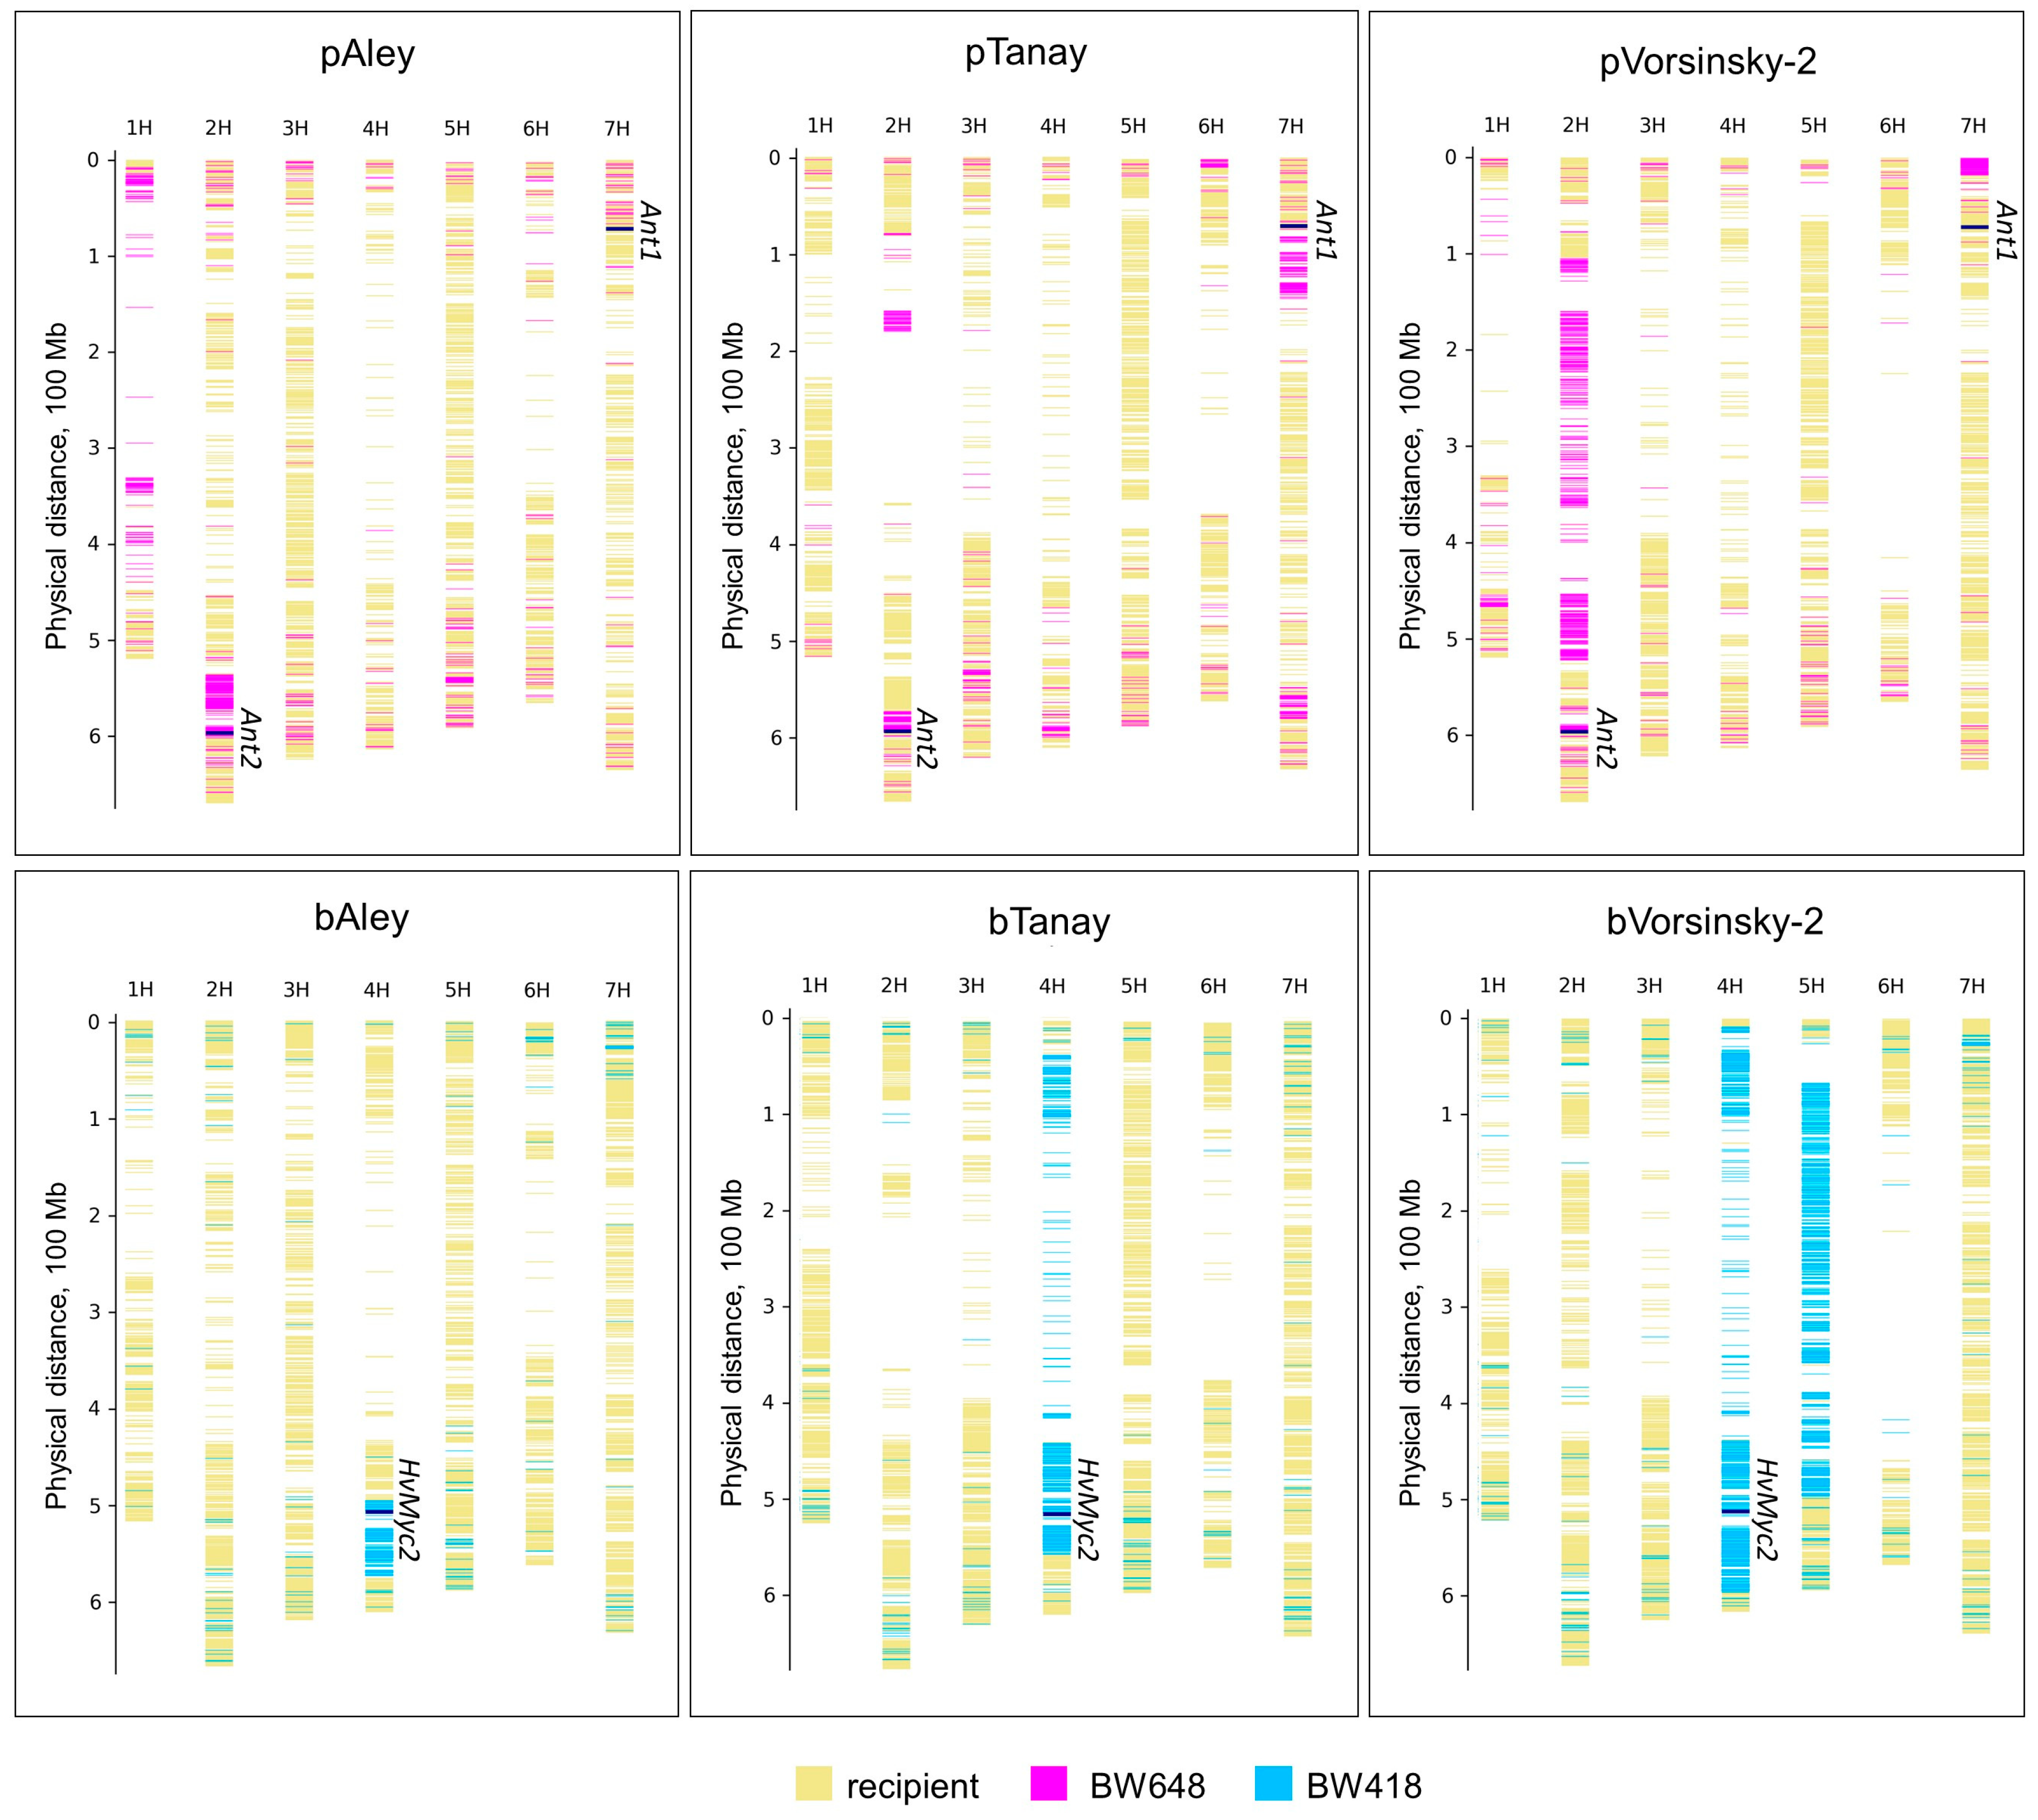
3.2. GBS of the NILs with Different Color of Grain

Sequencing the GBS libraries yielded approximately 11.5 million reads per sample with an average read length of 114 bp. On average, 97.3% of all reads were successfully aligned to a unique position and covered 85.1 million genome sites, which is 1.6% of the barley genome. After comparing the sequencing data of each sample with the reference barley genome, approximately 167,000 SNPs per library (2 million in total) were discovered, of which 49,136 SNPs were subjected to PCA and sample clustering (Figure S3). According to results of the genetic distance analysis, NILs are most similar to the corresponding recurrent cultivar, and the donor lines form a separate cluster with the Bowman line.
After exclusion of heterozygous positions and those with missing values or below the quality threshold, genotyping data decreased on average from 85.1 to 11.5 Mbp per sample, in other words, 13.4% of genotyped sites passed the filtering. For each NIL, 22,311 (pAley) to 30,289 (bVorsinsky-2) SNPs were found and mapped to the physical map of the Morex cultivar genome. Visualization of the resulting map of polymorphic markers for each NIL is shown in the Figure 3. SNPs were unevenly distributed throughout the genome, with the highest density in telomeric regions of chromosomes and the lowest in centromere regions (Figure S4). On average, for the whole genome, 6.3 SNPs/Mbp were found, varying between a minimum of 5.32 SNPs/Mbp in pAley and a maximum of 7.2 SNPs/Mbp in bVorsinsky-2 (Table 4). The proportion of SNPs indicating the donor’s genotype ranged from 4.6% in the bAley line to 17.6% in bVorsinsky-2. In purple-grained lines, a large proportion of donor SNPs was found on chromosome 2H, where Ant2, one of the target genes, is located. Furthermore, in purple-grained pVorsinsky-2 and pTanay, a large number of donor SNPs were found on chromosome 7H, where the Ant1 gene is located. The pAley line, however, does not carry extended blocks of the donor genome in the Ant1 gene region, probably because the original Aley cultivar already had dominant alleles of this gene. Among blue-grained lines, the largest number of donor SNPs proved to be situated on chromosome 4H, where target gene HvMyc2 is located. In addition, an excessively large number of donor SNPs were found on chromosomes that do not carry the target genes for which the selection was carried out in this work: in particular, in pAley on chromosome 1H (27.3%) and in bVorsinsky-2 on chromosome 5H (46.4%) (Table S2).

3.3. Comparative Study of Biochemical Characteristics of the Grain of the NILs
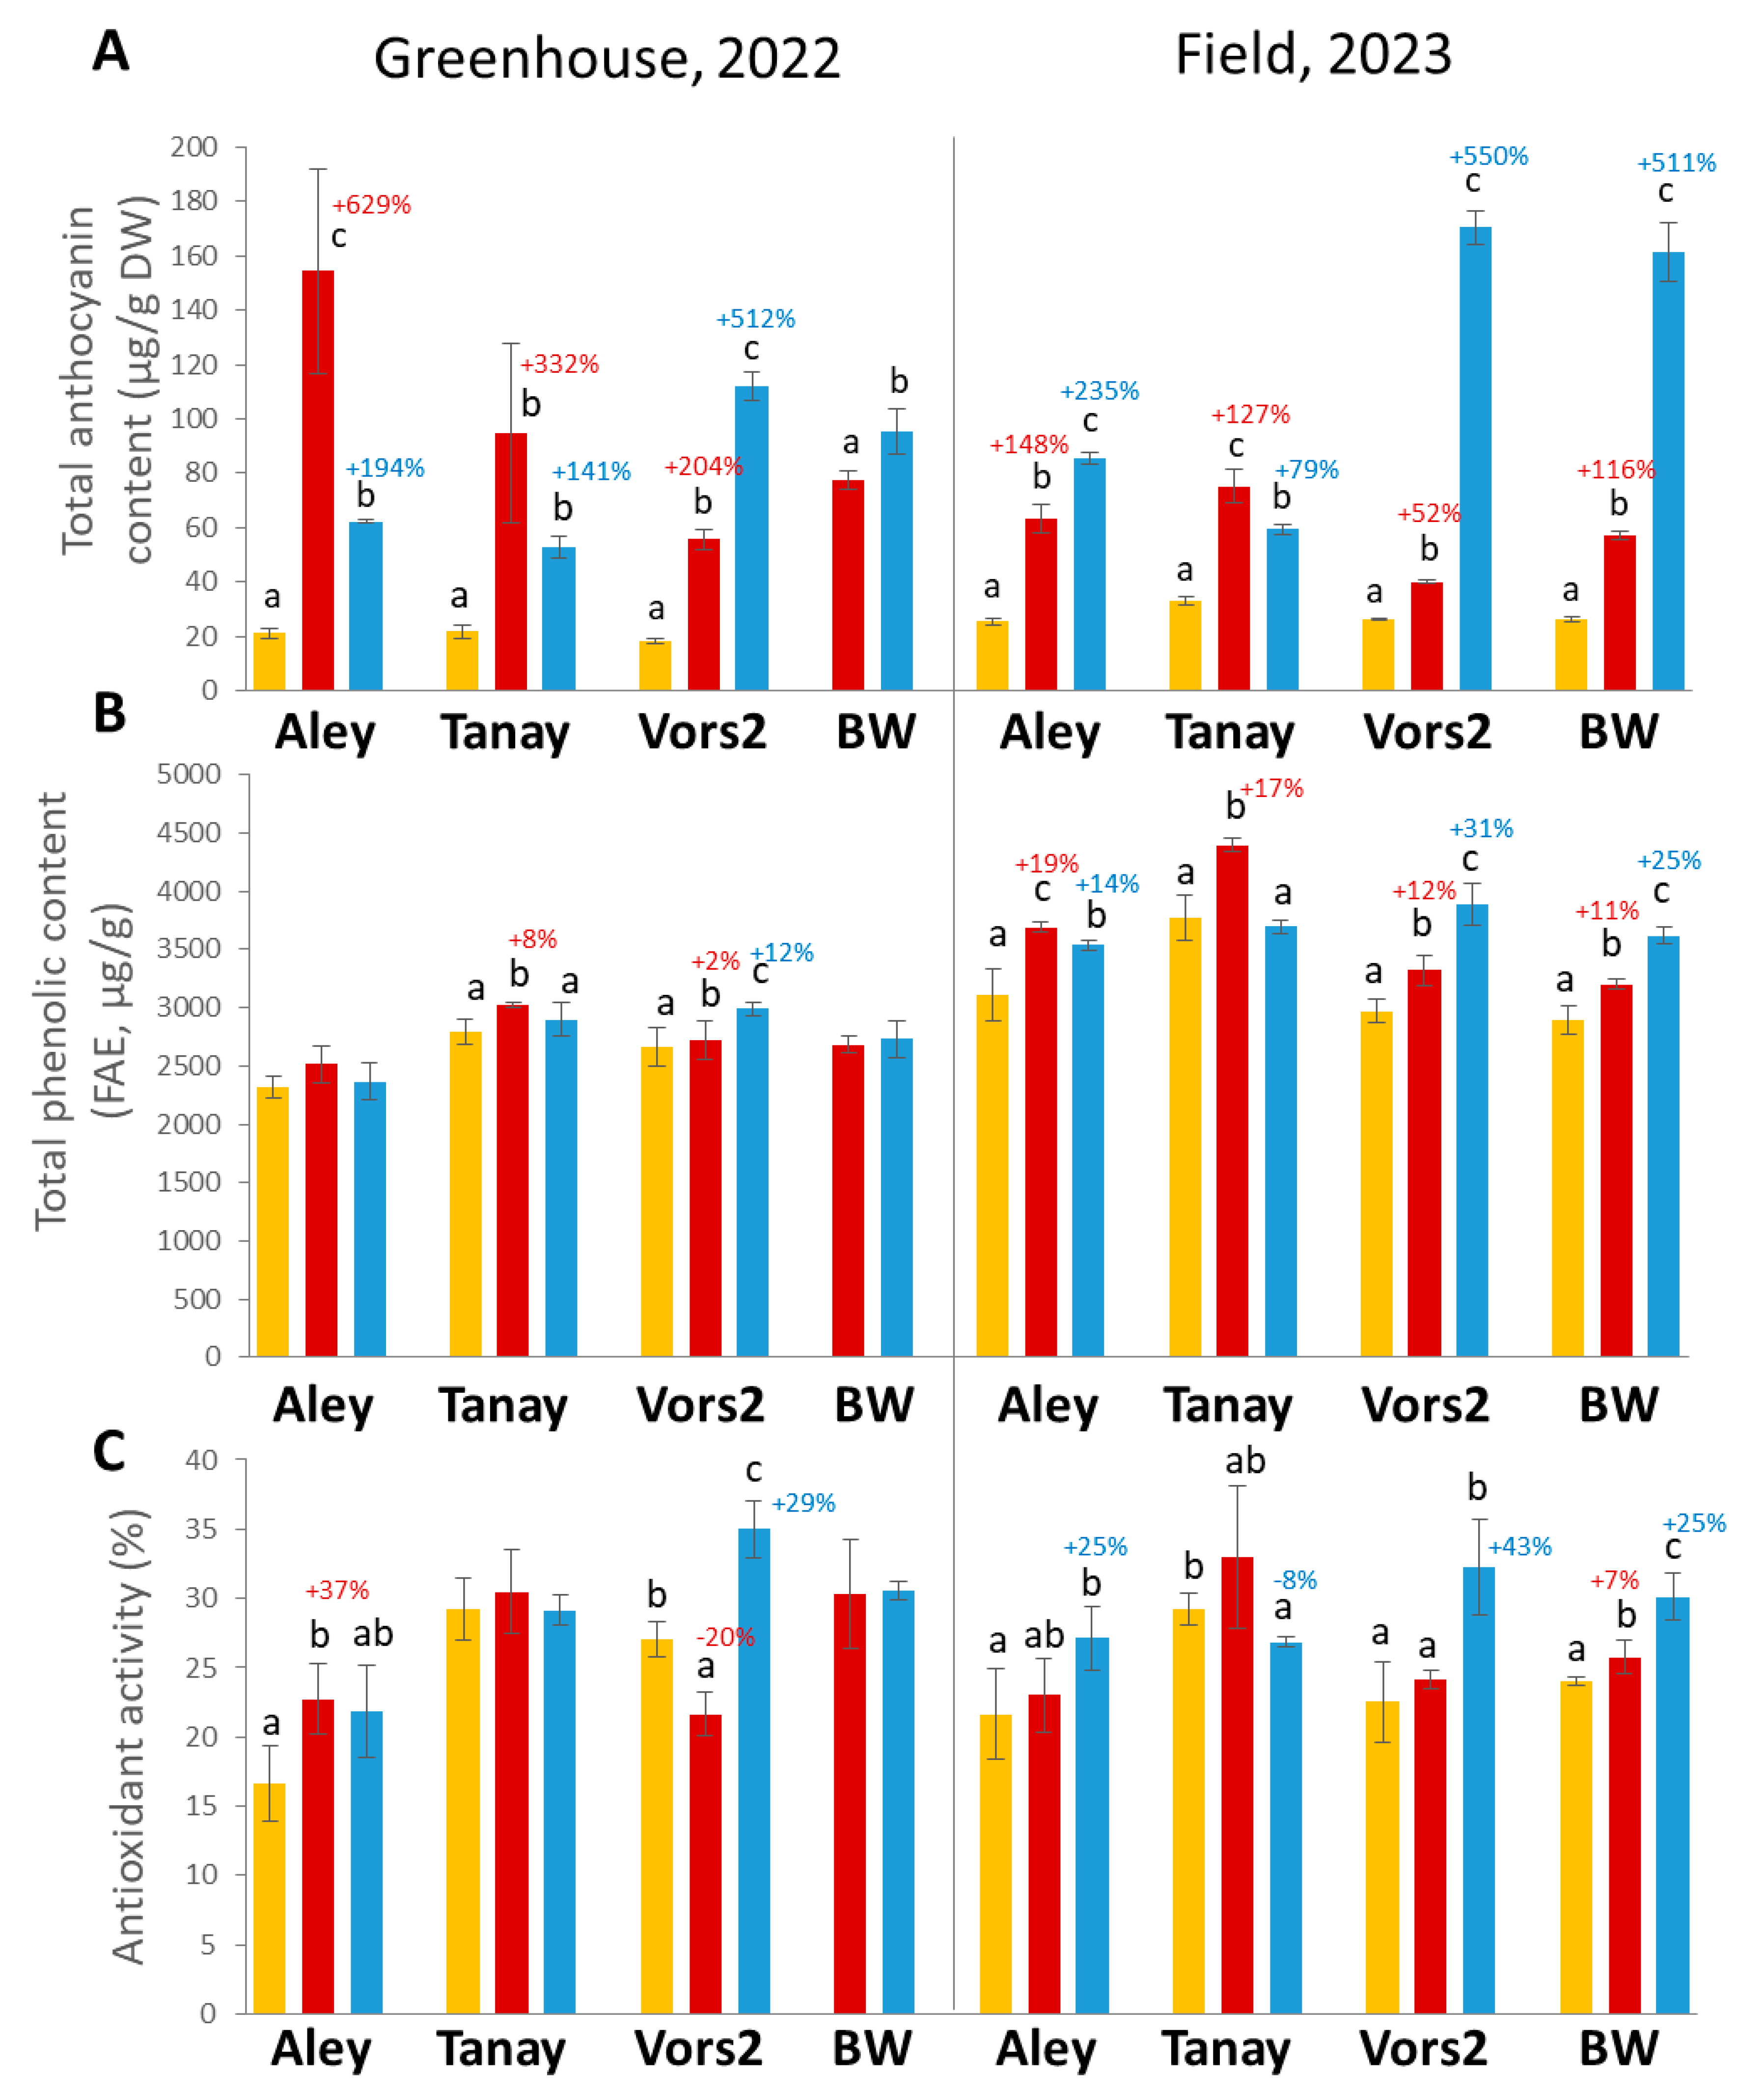
3.3.1. TAC

The anthocyanin-accumulating lines demonstrated an increased TAC relative to their uncolored parental cultivars both in the greenhouse and in the field (Figure 4).
The purple- and blue-grained lines developed in the Aley background differed significantly in TAC (in the greenhouse: 154.3 and 62.2 μg/g; in the field: 63.4 and 85.4 μg/g) both from parental cultivar Aley (in the greenhouse: 21.2 μg/g; in the field: 25.54 μg/g) and from each other, with the purple-grained line featuring a higher TAC in the greenhouse whereas blue-grained line manifested a higher TAC in the field.
Both anthocyanin-accumulating NILs developed in the Tanay background—pTanay and bTanay—manifested a higher TAC (in the greenhouse: 94.5 and 52.7 μg/g; in the field: 75.2 and 59.4 μg/g) than the recurrent cultivar Tanay (in the greenhouse: 21.9 μg/g; in the field: 33.1 μg/g), with the highest TAC observed in the purple-grained line than in its blue-grained sister line in the field, whereas in the greenhouse, the differences between the lines were not statistically significant.
The Vorsinsky-2 purple- and blue-grained NILs exhibited a higher TAC (in the greenhouse: 55.7 and 112.2 μg/g; in the field: 40.0 and 170.4. μg/g) as compared with its recurrent cultivar Vorsinsky-2 (in the greenhouse: 18.3 μg/g; in the field: 26.2 μg/g). Unlike the lines described above, the Vorsinsky-2 NILs manifested a stable pattern of the TAC with the highest values observed in the blue-grained line, both in the greenhouse and in the field.
Parental Bowman NILs exhibited the same tendency as the Vorsinsky-2 NILs: purple- and blue-grained lines have a higher TAC (in the field: 57.1 and 161.3 μg/g) than Bowman (in the field: 26.4 μg/g). The highest TAC was manifested by a blue-grained line than its purple sister line both in the greenhouse (95.3 and 77.4 μg/g) and in the field (161.3 and 57.1 μg/g).
TAC was on average 230% and 317% higher in the purple- and blue-grained NILs, respectively, compared to the recurrent cultivars.
The Kruskal–Wallis test was performed to evaluate effects of factors “growth conditions,” “grain color,” and “genetic background” on the TAC (Table S3).
An effect of “growth conditions” on the TAC was not detectable when it was assessed on the whole dataset: combined data for NILs having different colors of the grain. In contrast, this effect was detected via individual assessments of datasets from lines with a yellow or purple grain (p = 0.0002 and 0.0303, respectively), with a higher TAC observed in yellow grains harvested in the field than in grains harvested in the greenhouse, and a higher TAC observed in purple grains in the greenhouse than in grains harvested in the field. “Growth conditions” did not affect the TAC in the group of NILs with the blue color of grains (p = 0.1190).
The factor “grain color” affected the TAC in the assessment of the whole dataset (p < 0.0001) as well as when the dataset from plants grown in the greenhouse (p = 0.0001) or in the field (p < 0.0001) was used, with a higher TAC in anthocyanin-accumulating lines in comparison with yellow-grained parental cultivars (Table S3).
“Genetic background” did not influence the TAC in grains (p = 0.3925) (Table S3).
No correlation in the TAC was found between grains harvested in the greenhouse and in the field (rs = 0.43, p > 0.05) (Table S4).

3.3.2. TPC

The TPC of grains was found to be increased in some anthocyanin-accumulating lines in comparison with their parental cultivars and sister NILs, with the most drastic differences between the comparable genotypes observed in grains harvested in the field.
The purple- and blue-grained lines developed in the Aley background did not differ significantly in TPC in the greenhouse, while they exhibited enhanced TPC (3690.8 and 3542.0 μg/g) as compared with the parental cultivar Aley (3108.8 μg/g) in the field, where they differed significantly from each other, with the purple-grained line featuring the highest TPC.
Among the lines developed in the Tanay background, pTanay (in the greenhouse: 3022.0 μg/g; in the field: 4396.8 μg/g) outperformed both Tanay (in the greenhouse: 2788.4 μg/g; in the field: 3768.5 μg/g) and bTanay (in the greenhouse: 2899.2 μg/g; in the field: 3696.6 μg/g), which, in turn, did not differ from each other both in the greenhouse and in the field.
Among Vorsinsky-2 NILs, the highest TPC was observed in the blue-grained line (in the greenhouse: 2993.7 μg/g; in the field: 3888.4 μg/g) followed by those of the purple-grained one (in the greenhouse: 2718.4 μg/g; in the field: 3319.6 μg/g), both of which outperformed the recurrent cultivar Vorsinsky-2 in this parameter (in the greenhouse: 2662.6 μg/g; in the field: 2969.9 μg/g), both in the greenhouse and in the field.
The same pattern with the highest TPC in a blue-grained line followed by a purple-grained sister line and recurrent cultivar was documented for Bowman NILs (3621.3, 3203.9, and 2898.0 μg/g) in the field, while in the greenhouse the purple- and blue-grained lines did not differ in TPC (2679.7 and 2732.5 μg/g).
TPC in the purple- and blue-grained NILs was on average 11% and 12% higher, respectively, compared to the recurrent cultivars.
The Kruskal–Wallis test performed on the whole dataset indicated that “growth conditions” affect the TPC (p < 0.0001). This was also true in individual assessments of the effect of the factor in groups of lines with a yellow (p = 0.0008), purple (p < 0.0001), or blue (p < 0.0001) color of the grain. A higher TPC was observed in grains harvested in the field than in grains harvested in the greenhouse (Table S3).
The factor “grain color” did not influence the TPC as assessed in the whole dataset (p = 0.1880) or in the dataset from plants grown in the greenhouse (p = 0.2760). Under the field conditions, the “grain color” affected the TPC of the grain (p = 0.0093), with higher values of this parameter observed in blue-grained lines (Table S3). Factor “genetic background” did not affect the TPC of the grain (p = 0.0568) (Table S3).
A correlation in the TPC was not found between grains harvested in the greenhouse and in the field (rs = 0.16, p > 0.05). There was a weak positive correlation between the TPC and TAC in grains of the whole dataset (rs = 0.27, p < 0.05), whereas when the datasets from grains harvested in the greenhouse or in the field were examined individually, a correlation between these parameters was not detectable (rs = 0.28, rs = 0.60, p > 0.05, respectively) (Table S4).

3.3.3. AOA

AOA of methanol extracts from grains of the anthocyanin-accumulating NILs was higher, lower than, or equal to that of parental cultivars.
In lines developed in the Aley background, AOA was higher in the purple-grained line in the greenhouse (22.7%) as compared to the parental cultivar Aley (16.6%), but it did not differ from its blue-grained sister line (21.8%), which, in turn, did not differ in this parameter from recurrent cultivar. In the field, the blue-grained line manifested a higher AOA (27.1%) as compared both to the parental cultivar (21.7%) and to the purple-grained line (23.0%), which did not differ in this parameter from each other.
Purple- and blue-grained Tanay NILs did not differ in AOA from Tanay and each other in the greenhouse (30.5%, 29.1%, 29.2%), whereas in the field, bTanay had lower AOA (26.9%) in comparison with Tanay (29.2%) and did not differ from pTanay (32.9%), which, in turn, did not differ from Tanay.
bVorsinsky-2 demonstrated enhanced AOA, both in the greenhouse and in the field (35.0% and 32.3%) as compared with pVorsinsky-2 (21.7% and 24.1%) and Vorsinsky-2 (27.1% and 22.5%), whereas pVorsinsky-2 harvested in the greenhouse demonstrated diminished AOA in the grain, while in the field, it did not differ from the parental cultivar.
The purple- and blue-grained donor lines developed in the Bowman background did not differ from each other in AOA in the greenhouse (30.4% and 30.6%), whereas in the field, they differed significantly in this parameter (25.8% and 30.1%), both from parental cultivar Bowman (24.0%) and from each other, with the blue-grained line featuring the highest AOA.
AOA was on average 8% and 21% higher in the purple- and blue-grained NILs, respectively, compared to the recurrent cultivars.
The Kruskal–Wallis test applied to the whole dataset suggested that growth conditions do not affect AOA in the grain (p = 0.6055). This was also true in individual assessments of the impact of this factor in groups of lines with a yellow (p = 0.6189), purple (p = 0.9540), or blue (p = 0.6861) color of grains (Table S3).
The factor “grain color” affected AOA of grains as determined in the whole dataset (p = 0.0037) and the dataset of plants grown in the field (p = 0.0056), with higher values of this parameter seen in blue-grained lines. Under greenhouse conditions, the “grain color” did not affect AOA (p = 0.1518) (Table S3). The factor “genetic background” influenced AOA in the grain (p < 0.0001), with higher AOA in the NILs derived from Tanay and lower in NILs derived from Aley (Table S3).
No correlation in AOA between grains harvested in the greenhouse and in the field was found (rs = 0.05, p > 0.05) (Table S4). A weak positive correlation between AOA and the TPC and between AOA and the TAC was revealed in the whole dataset (rs = 0.37, rs = 0.42, p < 0.05) (Table S4). A high positive correlation between AOA and the TPC was registered in datasets of grains harvested in the greenhouse (rs = 0.76, p < 0.05) or in the field (rs = 0.82, p < 0.05), while between AOA and the TAC, a correlation was found only in the dataset of grains harvested in the field (rs = 0.75, p < 0.05) but not in the greenhouse (rs = 0.51, p > 0.05) (Table S4).

3.4. Comparative Study of Productivity of the NILs

A comparative phenotyping analysis was performed on the newly developed NILs and parental cultivars/lines that were grown in the field or in the greenhouse (Table S5).
Biplot PCA was carried out based on average values of the five assessed parameters of productivity (plant height, the spike number per plant, the number and weight of seeds per plant, and thousand-grain weight), recorded for 11 genotypes including the newly developed NILs, recurrent parental cultivars, and donor lines (Figure 5).
The first principal component accounted for 54.1% of the total variance, with a positive association between this component and the spike number per plant, height, and the number and weight of grains per plant. The second principal component explained 28.3% of the total variance, with a strong positive association between this component and the weight of grains per plant, thousand-grain weight (Table S6).
A diagram suggests that donor NILs BW418 and BW648 are well separated from the newly developed NILs and their recurrent parental cultivars (Figure 5). The areas occupied by these genotypes in the diagram do not overlap with the area occupied by the other lines except for cv. Aley, which was close to BW648; both were grown in the same vegetation season–field 2023. At the same time, the regions occupied by the newly developed lines and recurrent cultivars formed separate clusters that combine specimens harvested in a certain vegetation season. Those harvested in the field in 2022 and 2023 are grouped into two distinct clusters separated from each other and from the cluster of lines harvested in 2022 and 2023 in the greenhouse, which, in turn, overlap partly. There was no clustering of lines by their grain color, but lines created in the same genetic background are located in the plot close to each other, e.g., Vorsinsky-2 and pVorsinsky-2, which showed agronomic performance that was similar between the two tested environments in two different seasons.

4. Discussion

4.1. Marker-Assisted Breeding of Anthocyanin-Rich Barley NILs

Due to expansion of the functional food market, anthocyanin-rich cultivars of different crops are now in demand. Breeding programs aimed at the development of such cultivars have been started for different crop species. Barley is one of attractive cereals for the improvement of grain quality via enrichment with anthocyanins [8,10].
To breed barley cultivars adapted to growth conditions of West Siberia, in the current study, a backcross breeding strategy was applied to obtain anthocyanin-rich lines with a purple or blue color of grains (Figure 1 and Figure 2). In order to restore the genetic background of the original elite cultivars as much as possible, six backcrosses were carried out with the recurrent parent. In each generation, selection was carried out using intragenic DNA markers for the Ant1 and Ant2 or HvMyc2 genes, which control synthesis of anthocyanins in the pericarp or aleurone of grain, respectively, and segregated according to the predicted Mendelian ratio in most of the F2 populations tested. Only in the populations cv. Aley × BW648 and cv. Vorsinsky-2 × BW418, the segregation for Ant2 and HvMyc2 respectively, did not correspond to Mendelian ratio, probably due to low quantity of hybrids (less than 100). However, despite this, the hybrids with the donor-like alleles were selected from these populations also. As a result, three pairs of NILs with a purple or blue color of grains each were developed within 6 years (from spring 2016 to summer 2022). Without molecular markers, the creation of such lines would have taken over 11 years (taking into account two growing seasons per year). The period of obtaining lines without molecular markers is longer due to the necessity of phenotyping control of the grain color, which in case of maternal inheritance of anthocyanin-accumulating pericarp tissues can be assessed only after grains have ripened, and hybrids for subsequent backcrossing can be chosen only in generation BCxF2 with further backcrossing of chosen hybrids in generation BCxF3. The molecular markers allow the ability to choose hybrids carrying the required genes in a heterozygous state and to perform backcrossing already in BCxF1.
To assess effectiveness of recovery of the parental genomes that was achieved by six backcrosses, the NILs were genotyped by GBS. It was revealed that quantity of a donor’s SNPs in the NILs ranged from 4.6 (in bAley) to 17.6% (in bVorsinsky-2) (Table 4) and in addition to the loci carrying anthocyanin biosynthesis regulatory genes, the NILs inherited non-target regions from the donors. Such regions were revealed in pAley and bVorsinsky-2 on chromosomes 1H and 5H, respectively (Figure 3). The absence of recombination in genomic regions that do not carry target loci could be explained by inversions polymorphic in the recurrent cultivars and the donor lines; these events could repress recombination in an inverted region. Whole-genome sequencing data on 20 barley accessions indicate the presence—in the barley genome—of many inversions distributed along all the chromosomes [25]. Hi-C-based inversion scans of 69 barley lines has uncovered a total of 42 events ranging from 4 to 141 Mbp in size (mean size of 23.9 Mbp) [25]. The regions identified in the NILs’ genomes carrying blocks of donor SNPs may reflect such rearrangements; additional research is needed to map the inversions and to determine which genotype has undergone these rearrangements (parental cultivars or donor ones).
Thus, it was shown that recurrent parent genome can be recovered by six backcrosses with different effectiveness that is probably dependent on cultivars/lines used in crossing combinations and the presence of polymorphic inversions between them. To enhance the recovery of the parental genomes, marker-assisted background selection can be applied as, for example, in breeding multi-nutrient rich maize lines, when two backcrosses with selection for three target genes and background were enough to recover parental genome by 94% [26].

4.2. Comparative Study of Biochemical Parameters

According to available data the anthocyanin content in barley grain may vary significantly in dependence on color of grain, type of the barley (hulled or naked), and growth conditions [6,27,28]. Four groups of barley can be distinguished based on grain pigmentation: yellow, purple, blue, and black [14]. In yellow barley, any pigments in grain (except for the tissues, covering grain) are absent. Purple and blue barley accumulates anthocyanin in pericarp and aleurone layers of grain, respectively. Simultaneous accumulation of anthocyanins in both of these layers is also possible; the grain color of such barley is intense purple, or black, and such barley is expected to be the richest in TAC. Indeed, black barley on average had higher anthocyanin content in grain. For example, the TAC of black qingke barley ranged from 248.7 to 2902.9 μg/g, while it ranged from 141 to 2304 μg/g in purple qingke barley [27]. However, in some studies, the black barleys had less anthocyanins than purple or blue ones [6,29]. Probably, the studied black barleys accumulated another pigment in the grain that are not related to anthocyanins–melanins, which can be synthesize in lemma and pericarp of barley grain under control of the Blp1 gene [30]. Therefore, it is important to distinguish between the two types of black barley.
Another factor that can affect the TAC is the type of the barley, which can be hulled or naked. The naked barley is considered to have a higher TAC, which is partly because of the lack of hull (lemma and palea), the mass of which comprises 10–12% of grain. Kim et al. [6] found that the total average contents of phenolic compounds in the naked barley groups (268.6 μg/g) were significantly higher than that in the hulled groups (207.0 μg/g). Although naked barley rich in anthocyanins is a priority for food production [31,32,33], hulled barley cultivars (which are, as a rule, more resistant to pathogens and more productive than naked barley cultivars) also could be used in traditional food recipes, for example, in Khakass national cuisine Talgan, involving cooking based on fried and ground barley grains [34].
In the current study, the three pairs of NILs with purple and blue color of grain each were developed in different genetic backgrounds. All of them and their recurrent parental cultivar are hulled. These three sets of the lines represent a valuable genetic model to study the factors that can affect anthocyanin accumulation in pericarp and aleurone (in addition to the genes that control their synthesis) and their effect on related traits such as TPC and AOA (Figure 4).
The results of the Kruskal–Wallis test demonstrated that the factor “grain color” affects the TAC with the anthocyanin-accumulating NILs having an expected higher value than their yellow-grained recurrent cultivars. Although, on average, in blue-grained NILs, the TAC was increased more strongly than in purple-grained ones (with 317% and 230% relatively to their recurrent cultivars, respectively), the lines developed in different genetic background demonstrated different patterns of the TAC in two vegetation seasons. Only two of the four sets of the lines (Vorsinsky-2 and Bowman NILs) demonstrated a stable TAC pattern with the highest TAC observed in blue grains followed by purple and then yellow ones. The other two lines (Aley and Tanay NILs) demonstrated variable patterns with the highest TAC either in purple- or in blue-grained lines in different vegetation seasons. As a result, no correlation in the TAC between grains harvested in the greenhouse and in the field was revealed.
The influence of the factor “growth conditions” on the TAC was also tested. Effect of this factor was noted only in groups of yellow-grained and of purple-grained lines with a higher TAC in field and in greenhouse, respectively. By contrast, in the group of blue-grained lines, the effect of growth conditions on the TAC was not revealed. This finding could be explained by the fact that the aleurone layer is located more deeply in the grain than the pericarp and is less affected by light, which is required for activation of anthocyanin biosynthesis. This notion has also been demonstrated in a comparative study on blue and purple wheat NILs grown under different conditions, with the TAC being more stable in blue grains, while in purple ones, it varied significantly depending on growth conditions [35].
Since the lines were created from three different cultivars, it allowed us to test the influence of the factor “genetic background” on TAC. Effect of this factor on the parameter was not revealed. In previous studies, it was shown that the hybrid lines chosen from one crossing combination varied substantially in the TAC even though target genes that control the biosynthesis of an anthocyanin in each individual line have been inherited from the same donor [4,10,16]. One may conclude that the genetic background (or the genome of the original recurrent cultivar) less affects the TAC in grain than the genome of the resultant line, which determines this parameter.
The anthocyanins are related to phenolic compounds and together with them can contribute to antioxidant activity, which is considered one of the main factors of functional properties of food [36,37]. In the current study, AOA in grains harvested in the field (but not in the greenhouse) correlated with the TAC and TPC, while between the TAC and TPC only a weak correlation was found. This data showed that not the anthocyanins but the other phenolic compounds contribute more to the TPC and AOA. Indeed, Kim et al. had detected the high positive correlation between DPPH radical scavenging activity and the content of phenolic compounds, among which chlorogenic acid, 3,4-dimethoxybenzoic acid, homogentisic acid, protocatechuic acid, and rutin contributed more to the antioxidant capacity of the colored barley [6].
Despite the weak correlation between the TAC and TPC, the factor “grain color” affects the TPC in the field, with a higher TPC observed in anthocyanin-accumulating lines than their recurrent parents. Except for the “growth conditions” the other tested factors did not affect the TPC in grain. Due to the adaptive role of phenolic compounds, whose content is reported to be increased in harsh environments [38], the observed effect of the growth conditions on the TPC was expected.
Unlike the TAC and TPC, the AOA was not affected by the factor “growth conditions,” while the factors “grain color” and “genetic background” affected it. AOA was on average 8% and 21% higher in the purple- and blue-grained NILs, respectively, as compared with the recurrent cultivars. The higher AOA in blue-grained lines is suggested to be related with anthocyanins, among which the highest antioxidant activity and inhibitory effect on lipid peroxidation was featured by derivatives of delphinidin, which are abundant in blue-grained cereals including barley [39].
Unlike the other biochemical parameters, the AOA was dependent on genetic background in which the lines were developed. On average the parameter was higher in Tanay and its lines and lower in NILs derived from Aley. Tanay-derived lines were the only lines that did not show enhanced AOA in the grain in comparison with Tanay; pTanay even has a decreased value of this parameter in grains harvested in the field. Cv. Tanay has the highest AOA in the grain in comparison with the other recurrent cultivars, and additional anthocyanins in the grain do not influence this parameter in Tanay-derived lines. One may conclude that besides the TAC and TPC, some additional factors contribute to the AOA of grain. Among them the enzymatic antioxidants or tocopherols, which are lipid-soluble antioxidants represented in barley grain [1], can also be considered.
Thus, the developed anthocyanin-accumulating lines are characterized by increased TAC, TPC, and AOA in grains as compared with the recurrent cultivars. As a genetic model, it allows for the identification of certain features related to the establishment of these parameters, dependent on grain color, genetic factors, and environmental conditions.

4.3. Comparative Study of Yield-Related Parameters

The greatest concern in the breeding of anthocyanin-rich varieties is a possible negative impact of anthocyanins on the crop yield. Some authors have noticed that the biosynthesis of anthocyanins is an energy-consuming process, and their synthesis negatively affects accumulation of carbohydrates and plant growth [40]. Indeed, a reduction in grain size in some anthocyanin-rich lines/cultivars of rice [41] and wheat [42] has been reported in comparison to those devoid of these compounds. The observed lower yield in rice sister lines having a purple grain color in comparison with white ones [43] has been attributed to a decrease in chlorophyll synthesis (and therefore in photosynthetic efficiency) owing to anthocyanin synthesis [44]. On the other hand, the accumulated experience regarding the breeding of anthocyanin-rich varieties of different crops shows that among hybrids, it is possible to select not only lines with anthocyanins in the grain that do not differ in the yield from the parental varieties, but even lines that outperform the parents [4,45].
In the current study, agronomic appearance varied between lines constructed in the same genetic background. A negative effect of either the purple or blue color of grains on yield-related traits was not detectable. These parameters were mostly dependent on growth conditions rather than the grain color. Analysis of a scatter plot of the genotypes on basis of the agronomic traits indicated that some lines are close to their recurrent parental genotypes and are not inferior to them in productivity in both environments tested (Figure 5). Among them, pVorsinsky-2 is the line with a more stable yield relative to its parental genotype. One may assume that loci inherited form donor lines showing low agronomic performance (in the scatter plot, these lines formed a separate cluster) do not negatively affect the yield. The implemented backcrossing strategy was effective at creating barley anthocyanin-accumulating lines adapted to local conditions.

5. Conclusions

For the first time, a MAS breeding scheme was applied to obtain anthocyanin-rich barley NILs adapted to growing in the West Siberian region. In contrast to selection by phenotype, the proposed selection scheme made it possible to reduce the time for obtaining anthocyanin-rich barley lines by almost half (from 11 to 6 years). The lines possess elevated total anthocyanin and phenolic contents and higher AOA (except for the lines derived from Tanay) relative to the parental yellow-grained cultivars. Despite variation of the quantity of donors’ fragments among genomes of the newly developed lines, their productivity turned out to be similar to that of parental cultivars. The tested backcrossing strategy was found to be an effective approach to the design of barley anthocyanin-accumulating lines adapted to local growth conditions. The obtained lines represent promising breeding lines for further development of barley cultivars enriched with anthocyanins in the grain.

Supplementary Materials

The following supporting information can be downloaded at: https://www.mdpi.com/article/10.3390/agronomy14061231/s1, Figure S1: electropherograms of PCR products obtained using molecular markers for genes Ant1, Ant2, and HvMyc2; Figure S2: electropherograms of PCR products obtained using molecular markers for genes Ant1, Ant2, and HvMyc2 from the DNA of parental genotypes and their resulting F2 hybrids; Figure S3: scatter plots of the genotypes of newly developed barley NILs and their parental cultivars in the space of the first two components derived from SNP data of the genomes retrieved by GBS analysis; Figure S4: the number of donor SNPs and total number of SNPs per megabase pair; Table S1: Segregation of the Ant1, Ant2, and HvMyc2 genes in F2 populations developed by crossing recurrent cultivars with the donor lines; Table S2: SNPs identified by GBS in chromosomes of the newly developed NILs; Table S3: effects of different factors on the TAC, TPC, and AOA according to the Kruskal–Wallis H test; Table S4: Spearman’s coefficients of correlation between the TAC, TPC, and AOA in the grains assessed in the combined dataset or datasets collected from grains harvested in the greenhouse or in the field processed individually; Table S5: characteristics of the anthocyanin-rich NILs and their parental recurrent cultivars; Table S6: eigenvalues, eigenvectors, and percentages of variance explained by the principal components assessed for five traits in 11 barley genotypes evaluated in the greenhouse and in the field.

Author Contributions

Conceptualization, E.K.K. and O.Y.S.; investigation, T.V.K., C.A.M., I.V.T., and G.V.V.; formal analysis, T.V.K., C.A.M., and O.Y.S.; writing—original draft, T.V.K., C.A.M., and O.Y.S.; methodology, G.V.V.; software, A.Y.P. and D.A.A.; writing—review and editing, D.A.A., G.V.V., and E.K.K.; visualization, T.V.K. and C.A.M.; supervision and funding acquisition, O.Y.S. All authors have read and agreed to the published version of the manuscript.

Funding

This research was funded by the Russian Science Foundation, grant number 21-76-10024.

Data Availability Statement

The data on GBS for the developed NILs and their parental cultivars/lines can be found in online repository https://www.ncbi.nlm.nih.gov/, BioProject accession number: PRJNA1120403.

Acknowledgments

The authors thank Galina V. Generalova, Olga V. Zakharova, and Nadezhda A. Nikonova (ICG SB RAS) for technical assistance and Nikolai A. Shevchuk for comments and proofreading. The GBS data analysis was performed on computational resources of the multi-access computational center Bioinformatics (ICG SB RAS). Barley hybrids and resultant lines were grown using resources of the Greenhouse Core Facility supported by ICG, project number FWNR-2022-0017.

Conflicts of Interest

The authors declare no conflicts of interest.

Abbreviations

AOA: antioxidant activity; CAPS: cleaved amplified polymorphic sequences; DPPH: 2,2-diphenyl-1-picrylhydrazyl; GBS: genotyping-by-sequencing; MAS: marker-assisted selection; NIL: near-isogenic line; STS: sequence-tagged sites; TAC: total anthocyanin content; TPC: total phenolic content.

References

  1. Geng, L.; Li, M.; Zhang, G.; Ye, L. Barley: A Potential Cereal for Producing Healthy and Functional Foods. Food Qual. Saf. 2022, 6, fyac012. [Google Scholar] [CrossRef]
  2. Sullivan, P.; Arendt, E.; Gallagher, E. The Increasing Use of Barley and Barley By-Products in the Production of Healthier Baked Goods. Trends Food Sci. Technol. 2013, 29, 124–134. [Google Scholar] [CrossRef]
  3. Baik, B.-K.; Ullrich, S.E. Barley for Food: Characteristics, Improvement, and Renewed Interest. J. Cereal Sci. 2008, 48, 233–242. [Google Scholar] [CrossRef]
  4. Iannucci, A.; Suriano, S.; Codianni, P. Genetic Diversity for Agronomic Traits and Phytochemical Compounds in Coloured Naked Barley Lines. Plants 2021, 10, 1575. [Google Scholar] [CrossRef]
  5. Abdel-Aal, E.-S.M.; Young, J.C.; Rabalski, I. Anthocyanin Composition in Black, Blue, Pink, Purple, and Red Cereal Grains. J. Agric. Food Chem. 2006, 54, 4696–4704. [Google Scholar] [CrossRef]
  6. Kim, M.-J.; Hyun, J.-N.; Kim, J.-A.; Park, J.-C.; Kim, M.-Y.; Kim, J.-G.; Lee, S.-J.; Chun, S.-C.; Chung, I.-M. Relationship between Phenolic Compounds, Anthocyanins Content and Antioxidant Activity in Colored Barley Germplasm. J. Agric. Food Chem. 2007, 55, 4802–4809. [Google Scholar] [CrossRef]
  7. Li, D.; Wang, P.; Luo, Y.; Zhao, M.; Chen, F. Health Benefits of Anthocyanins and Molecular Mechanisms: Update from Recent Decade. Crit. Rev. Food Sci. Nutr. 2017, 57, 1729–1741. [Google Scholar] [CrossRef]
  8. Loskutov, I.G.; Khlestkina, E.K. Wheat, Barley, and Oat Breeding for Health Benefit Components in Grain. Plants 2021, 10, 86. [Google Scholar] [CrossRef]
  9. Francavilla, A.; Joye, I.J. Anthocyanins in Whole Grain Cereals and Their Potential Effect on Health. Nutrients 2020, 12, 2922. [Google Scholar] [CrossRef]
  10. Suriano, S.; Savino, M.; Codianni, P.; Iannucci, A.; Caternolo, G.; Russo, M.; Pecchioni, N.; Troccoli, A. Anthocyanin Profile and Antioxidant Capacity in Coloured Barley. Int. J. Food Sci. Tech. 2019, 54, 2478–2486. [Google Scholar] [CrossRef]
  11. Gryaznov, A.A.; Letjago, J.A.; Belkina, R.I.; Ponomareva, E.I. Obtaining of bread with the use of mixtures of wheat flour of the highest grade and wholemeal from the grain pigmented barley varieties Granal 32. Vestn. VGUIT Proc. VSUET 2019, 81, 196–200. [Google Scholar] [CrossRef]
  12. King, C. New Possibilities with Purple Wheat; Top Crop Manager: Saskatoon, ON, Canada, 2017. [Google Scholar]
  13. Khlestkina, E. Molecular Markers in Genetic Studies and Breeding. Russ. J. Genet. Appl. Res. 2014, 4, 236–244. [Google Scholar] [CrossRef]
  14. Shoeva, O.Y.; Strygina, K.V.; Khlestkina, E.K. Genes determining the synthesis of flavonoid and melanin pigments in barley. Vestn. VOGiS 2018, 22, 333–342. [Google Scholar] [CrossRef]
  15. Shoeva, O.Y.; Kukoeva, T.V.; Khlestkina, E.K. Set of DNA Markers for the Selection of Barley with a High Content of Anthocyanins in the Pericarp of the Caryopsis. Russian Patent RU 2 774 444 C1, 21 June 2022. [Google Scholar]
  16. Shoeva, O.Y.; Kukoeva, T.V. Relationship between the anthocyanin content values in the leaf sheath base of barley cultivars and in the grain of the hybrids derived from them. Proc. Appl. Bot. Genet. Breed. 2022, 183, 152–162. [Google Scholar] [CrossRef]
  17. Strygina, K.V.; Börner, A.; Khlestkina, E.K. Identification and Characterization of Regulatory Network Components for Anthocyanin Synthesis in Barley Aleurone. BMC Plant Biol. 2017, 17, 184. [Google Scholar] [CrossRef]
  18. Druka, A.; Franckowiak, J.; Lundqvist, U.; Bonar, N.; Alexander, J.; Houston, K.; Radovic, S.; Shahinnia, F.; Vendramin, V.; Morgante, M.; et al. Genetic Dissection of Barley Morphology and Development. Plant Physiol. 2011, 155, 617–627. [Google Scholar] [CrossRef]
  19. Plaschke, J.; Ganal, M.W.; Röder, M.S. Detection of Genetic Diversity in Closely Related Bread Wheat Using Microsatellite Markers. Theor. Appl. Genet. 1995, 91, 1001–1007. [Google Scholar] [CrossRef]
  20. Poland, J.A.; Brown, P.J.; Sorrells, M.E.; Jannink, J.-L. Development of High-Density Genetic Maps for Barley and Wheat Using a Novel Two-Enzyme Genotyping-by-Sequencing Approach. PLoS ONE 2012, 7, e32253. [Google Scholar] [CrossRef]
  21. Pronozin, A.Y.; Salina, E.A.; Afonnikov, D.A. GBS-DP: A Bioinformatics Pipeline for Processing Data Coming from Genotyping by Sequencing. Vavilovskii Zhurnal Genet. Sel. Vavilov J. Genet. Breed. 2023, 27, 737–745. [Google Scholar] [CrossRef]
  22. Sharma, P.; Gujral, H.S. Antioxidant and Polyphenol Oxidase Activity of Germinated Barley and Its Milling Fractions. Food Chem. 2010, 120, 673–678. [Google Scholar] [CrossRef]
  23. Abdel-Aal, E.-S.M.; Hucl, P. A Rapid Method for Quantifying Total Anthocyanins in Blue Aleurone and Purple Pericarp Wheats. Cereal Chem. J. 1999, 76, 350–354. [Google Scholar] [CrossRef]
  24. Hammer, O.; Harper, D.A.T.; Ryan, P.D. PAST: Paleontological Statistics Software Package for Education and Data Analysis. Palaeontol. Electron. 2001, 4, 1–9. [Google Scholar]
  25. Jayakodi, M.; Padmarasu, S.; Haberer, G.; Bonthala, V.S.; Gundlach, H.; Monat, C.; Lux, T.; Kamal, N.; Lang, D.; Himmelbach, A.; et al. The Barley Pan-Genome Reveals the Hidden Legacy of Mutation Breeding. Nature 2020, 588, 284–289. [Google Scholar] [CrossRef]
  26. Hossain, F.; Jaiswal, S.K.; Muthusamy, V.; Zunjare, R.U.; Mishra, S.J.; Chand, G.; Bhatt, V.; Bhat, J.S.; Das, A.K.; Chauhan, H.S.; et al. Enhancement of Nutritional Quality in Maize Kernel through Marker-Assisted Breeding for Vte4, crtRB1, and Opaque2 Genes. J. Appl. Genet. 2023, 64, 431–443. [Google Scholar] [CrossRef]
  27. Zhang, T.; Ma, J.; Wu, X.; Hao, Z.; Dun, C.; Chen, C. Qualitative and Semi-Quantitative Assessment of Anthocyanins in Tibetan Hulless Barley from Different Geographical Locations by UPLC-QTOF-MS and Their Antioxidant Capacities. Open Chem. 2021, 19, 1–8. [Google Scholar] [CrossRef]
  28. Diczházi, I.; Kursinszki, L. Anthocyanin Content and Composition in Winter Blue Barley Cultivars and Lines. Cereal Chem. 2014, 91, 195–200. [Google Scholar] [CrossRef]
  29. Jin, H.-M.; Dang, B.; Zhang, W.-G.; Zheng, W.-C.; Yang, X.-J. Polyphenol and Anthocyanin Composition and Activity of Highland Barley with Different Colors. Molecules 2022, 27, 3411. [Google Scholar] [CrossRef]
  30. Shoeva, O.Y.; Mursalimov, S.R.; Gracheva, N.V.; Glagoleva, A.Y.; Börner, A.; Khlestkina, E.K. Melanin Formation in Barley Grain Occurs within Plastids of Pericarp and Husk Cells. Sci. Rep. 2020, 10, 179. [Google Scholar] [CrossRef]
  31. Lee, C.; Han, D.; Kim, B.; Baek, N.; Baik, B.-K. Antioxidant and Anti-Hypertensive Activity of Anthocyanin-Rich Extracts from Hulless Pigmented Barley Cultivars. Int. J. Food Sci. Technol. 2013, 48, 984–991. [Google Scholar] [CrossRef]
  32. Vasko, N.; Mykhailenko, E. Anthocyanins in Naked Pigmented Barley Grain as a Source of Antioxidant Activity. Food Sci. Nutr. Tech. 2023, 8, 000301. [Google Scholar] [CrossRef]
  33. Zhang, Y.; Yin, L.; Huang, L.; Tekliye, M.; Xia, X.; Li, J.; Dong, M. Composition, Antioxidant Activity, and Neuroprotective Effects of Anthocyanin-Rich Extract from Purple Highland Barley Bran and Its Promotion on Autophagy. Food Chem. 2021, 339, 127849. [Google Scholar] [CrossRef]
  34. Sumina, A.V.; Polonskiy, V.I.; Shaldaeva, T.M.; Shulbaeva, M.T. The content of antioxidants in the products of Khakass national cuisine based on barley grain. Vestn. Krasn. SAU 2019, 12, 125–131. [Google Scholar] [CrossRef]
  35. Gordeeva, E.; Shoeva, O.; Mursalimov, S.; Adonina, I.; Khlestkina, E. Fine Points of Marker-Assisted Pyramiding of Anthocyanin Biosynthesis Regulatory Genes for the Creation of Black-Grained Bread Wheat (Triticum aestivum L.) Lines. Agronomy 2022, 12, 2934. [Google Scholar] [CrossRef]
  36. Poljsak, B.; Kovač, V.; Milisav, I. Antioxidants, Food Processing and Health. Antioxidants 2021, 10, 433. [Google Scholar] [CrossRef]
  37. Scalbert, A.; Williamson, G. Dietary Intake and Bioavailability of Polyphenols. J. Nutr. 2000, 130, 2073S–2085S. [Google Scholar] [CrossRef]
  38. Pratyusha, S. Phenolic Compounds in the Plant Development and Defense: An Overview. In Plant Stress Physiology-Perspectives in Agriculture; IntechOpen: Rijeka, Croatia, 2022; ISBN 978-1-83969-867-5. [Google Scholar]
  39. Tena, N.; Martín, J.; Asuero, A.G. State of the Art of Anthocyanins: Antioxidant Activity, Sources, Bioavailability, and Therapeutic Effect in Human Health. Antioxidants 2020, 9, 451. [Google Scholar] [CrossRef]
  40. Treutter, D. Significance of Flavonoids in Plant Resistance: A Review. Environ. Chem. Lett. 2006, 4, 147–157. [Google Scholar] [CrossRef]
  41. Wang, X.; Ji, Z.; Cai, J.; Ma, L.; Li, X.; Yang, C. Construction of Near Isogenic Lines for Pericarp Color and Evaluation on Their Near Isogenicity in Rice. Rice Sci. 2009, 16, 261–266. [Google Scholar] [CrossRef]
  42. Garg, M.; Chawla, M.; Chunduri, V.; Kumar, R.; Sharma, S.; Sharma, N.K.; Kaur, N.; Kumar, A.; Mundey, J.K.; Saini, M.K.; et al. Transfer of Grain Colors to Elite Wheat Cultivars and Their Characterization. J. Cereal Sci. 2016, 71, 138–144. [Google Scholar] [CrossRef]
  43. Ji, Z.-J.; Wang, X.-G.; Zeng, Y.-X.; Ma, L.-Y.; Li, X.-M.; Liu, B.-X.; Yang, C.-D. Comparison of Physiological and Yield Traits between Purple- and White-Pericarp Rice Using SLs. Breed. Sci. 2012, 62, 71–77. [Google Scholar] [CrossRef]
  44. Zhou, H.; Pan, D.; Fan, Z. Research and application of Guangdong special rice and investigation on breeding problems. J. Guangdong Agric. Sci. 2005, 6, 19–21. [Google Scholar] [CrossRef]
  45. Gordeeva, E.; Shamanin, V.; Shoeva, O.; Kukoeva, T.; Morgounov, A.; Khlestkina, E. The Strategy for Marker-Assisted Breeding of Anthocyanin-Rich Spring Bread Wheat (Triticum aestivum L.) Cultivars in Western Siberia. Agronomy 2020, 10, 1603. [Google Scholar] [CrossRef]
Figure 1. The backcross breeding scheme for the creation of barley NILs rich in anthocyanins. The near-isogenic and inbred lines—BW648 and BW418—carrying dominant alleles of genes Ant1, Ant2, and HvMyc2, responsible for purple and blue pigmentation of the grain, respectively, were utilized as donors. Purple-grained F2 plants homozygous for genes Ant1 and Ant2 were selected based on the presence of pigmentation in leaf sheath bases (i) and donor-like alleles of genes Ant2 (ii) and Ant1 (iii). Blue-grained F2 plants homozygous for the HvMyc2 gene were selected based on the presence of a donor-like allele of this gene. The selected plants underwent six-time backcrossing with the recurrent parents; at each step of the backcrossing, only heterozygous BCxF1 plants (where x is an ordinal number of a backcross), were pollinated by pollen of recurrent parents. BC6F1 hybrids were self-pollinated to obtain BC6F2 hybrids, among which homozygous plants were selected according to the same principles as those used to choose F2 plants. The selected plants were propagated up to generation BC6F6 and the resultant NILs were genotyped and characterized in terms of grain quality and productivity in the field and under greenhouse conditions. DL: donor line; RC: recurrent cultivar; MAS: marker-assisted selection. The gray arrows show the stages of the breeding scheme, at which the MAS was applied.
Agronomy 14 01231 g001
Figure 2. Seeds of parental cultivars Aley (1), Tanay (2), and Vorsinsky-2 (3) with a yellow (Y) color, and seeds of the anthocyanin-accumulating NILs (developed in the genetic background of these parents) with a purple (P) or blue (B) color.
Agronomy 14 01231 g002
Figure 3. The distribution of donors’ SNPs along chromosomes of barley NILs having the magenta or blue color of the grain. The SNPs of recurrent cultivars are highlighted in yellow, while those inherited from BW648 and BW418 are highlighted in purple and blue, respectively. Positions of genes Ant1, Ant2, and HvMyc2 are indicated on chromosomes 7H, 2H, and 4H, respectively. The gaps denote nonpolymorphic sites.
Agronomy 14 01231 g003
Figure 4. The TAC (A), TPC (B), and AOA (C) of methanol extracts of whole-grain flour of barley plants grown in the greenhouse or in the field. Parameters of parental cultivars are shown in yellow; those of purple- and blue-grained lines are highlighted in red or blue, respectively. Different letters (a–c) denote the lines developed in the same genetic background significantly differing at p < 0.05 while comparing their parameters by median test. No letters mean an absence of the significant differences between the lines. The difference in the parameter value of the NILs relative to the yellow-grained recurrent cultivars is indicated as a percentage. DW: dry weight, FAE: ferulic acid equivalent.
Agronomy 14 01231 g004
Figure 5. A PCA biplot chart of the two principal components (which together explain 82.4% of variance) for five active variables (parameters) and 11 active observations (genotypes). The polyhedrons highlight sets of lines based on Aley (green), Tanay (yellow), or Vorsinsky-2 (red) and Bowman-derived donor lines (blue).
Agronomy 14 01231 g005
Table 1. The recurrent parental cultivars used in the breeding program.
Cultivar/LinePedigreeCharacterizationOrigin
cv. AleySignal/Karina//Dina/Bagan///Vorsinsky-2Medium ripening, moderately resistant to stone and loose smutFederal Altai Research Center of Agrobiotechnology
(Barnaul, Russia)
cv. TanayG-20275/G-20191Mid-early ripening, resistant to stone and loose smutSiberian Research Institute of Plant Production and Breeding (Krasnoobsk, Russia)
cv. Vorsinsky-2Signal//Irene/GusarMedium ripening, moderately tolerant to drought, melting cultivar, valuable in terms of qualityAltai Scientific Research Institute of Agriculture
(Barnaul, Russia)
Table 2. The molecular markers polymorphic among donor lines BW648 and BW418 and recipient cultivars used for MAS breeding of anthocyanin-rich barley lines.
Grain ColorGeneChrPrimers (5′→3′),
Restriction Enzymes
PCR Product Length (Restriction Fragment Length) in
Donor/Recurrent Cultivar, bp
Reference
PurpleAnt17HF: GCGGCTTGATTTGTTTCATA
R: TTTAAATGGCGAGGTAAGGT
488/455[15,16]
Ant22HF: GCTGGAACACACGTACAAGA
R: CTTTGAGCTATGGAGACCAAGAA
514/719[15,16]
BlueHvMyc24HF: CAAGTAGGTCCGAAGGCTCT
R: CGGGCACTTTACCTCCAACA
Restriction enzyme: Bse1I
610/611 (485 + 125/611)[17]
Table 3. The crosses and numbers of plants obtained and assessed during the MAS breeding.
Crossing CombinationsTotal Number of F2 HybridsNumber of F2 Hybrids with Red Leaf Sheath BasesNumber of F2 Hybrids Homozygous for Donor-Like Alleles of Ant1 and Ant2 or HvMyc2Number of F2 (BC1F1-BC6F1) Hybrids Chosen for BackcrossingNumber of Hybrids Chosen in BC6F2 and the Resultant BC6F6 Lines
Breeding of purple-grained lines
cv. Aley × BW648654954 (2–15)10
cv. Tanay × BW6488964146 (2–15)3
cv. Vorsinsky-2 × BW648614376 (1–15)10
Breeding of blue-grained lines
cv. Aley × BW41883n.a.316 (1–15)12
cv. Tanay × BW41872n.a.256 (5–15)14
cv. Vorsinsky-2 × BW41864n.a.296 (4–15)15
n.a.: not analyzed.
Table 4. SNPs identified by GBS in the newly developed NILs.
NILNumber of SNPsSNP Density (Number of SNPs per Mbp)Number of Donors’ SNPsFrequency of Donors’ SNPs, %
pAley22,3115.3220259.08
bAley23,8585.6910914.57
pTanay26,4816.3122188.38
bTanay29,6497.0719306.51
pVorsinsky-225,7696.14314812.22
bVorsinsky-230,2897.22532317.57
Average26,3936.2926239.72
Disclaimer/Publisher’s Note: The statements, opinions and data contained in all publications are solely those of the individual author(s) and contributor(s) and not of MDPI and/or the editor(s). MDPI and/or the editor(s) disclaim responsibility for any injury to people or property resulting from any ideas, methods, instructions or products referred to in the content.

