Article

Qfhb.yzu.3B.1 and Qfhb.yzu.6B.3 Are Stable Quantitative Trait Loci for Wheat Resistance to Fusarium Head Blight with Diverse Genetic Backgrounds

by
Zhengxi Sun
1,2,
Hongyan Ye
1,2,
Xiang Chen
1,2,
Jiale Cheng
1,2,
Fanfan Zhu
1,2,
Dapeng Yang
1,2,
Sijia Hu
1,2,
Lei Li
1,2 and
Tao Li
1,2,*
1
Jiangsu Key Laboratory of Crop Genomics and Molecular Breeding/Key Laboratory of Plant Functional Genomics of the Ministry of Education/Jiangsu Key Laboratory of Crop Genetics and Physiology, Agricultural College of Yangzhou University, Yangzhou 225009, China
2
Jiangsu Co-Innovation Center for Modern Production Technology of Grain Crops, Yangzhou University, Yangzhou 225009, China
*
Author to whom correspondence should be addressed.
Agronomy 2024, 14(6), 1230; https://doi.org/10.3390/agronomy14061230
Submission received: 5 May 2024 / Revised: 26 May 2024 / Accepted: 5 June 2024 / Published: 6 June 2024
(This article belongs to the Section Crop Breeding and Genetics)

Abstract

:
Fusarium head blight (FHB) can cause serious yield loss and significant mycotoxin contamination, which seriously threaten global food security and safety. Breeding stable and durable cultivars that are resistant to FHB is one of the most effective approaches to controlling this disease. Fhb1 is a well-known genetic locus for FHB resistance, but its resistance is not always effective across diverse wheat genetic backgrounds. To achieve a high and durable level of resistance, the discovery and use of additional quantitative trait loci (QTL) for FHB resistance are essentially needed in breeding programs. In this study, two independent wheat natural populations of different origins were used for mining resistance QTL with a major and stable effect. Using genome-wide association analysis (GWAS), a total of 58 marker–trait associations (MTAs) on chromosomes 1A, 2B, 3A, 3B, 4A, 4B, 4D, 5A, 5B, 5D, 6A, 6B, 6D, 7A and 7B were found to be significant for type II resistance to FHB. These 58 MTAs represent 24 putative QTL. Among these QTL, Qfhb.yzu.3B.1 and Qfhb.yzu.6B.3 were stably detected in the two natural populations across three consecutive experimental years. The favorable haplotypes at the two QTL could significantly reduce the disease severity, either individually or in combination. These two QTL are also additive to Fhb1 in cultivars with different genetic backgrounds. Breeder-friendly markers were designed to differentiate the contrasting alleles at these two loci, thus proving very useful for improving FHB resistance in wheat by marker-assisted selection.

1. Introduction

Fusarium head blight (FHB), caused primarily by Fusarium graminearum species complex, is a worldwide devastating disease of wheat, barley and other small grain cereals. The degree of FHB infection is mainly determined by the host resistance, environmental temperature and humidity, and it may be also subject to the flowering date and plant height. The accumulation of mycotoxin such as deoxynivalenol (DON) caused by FHB poses a threat to the food industry and human health. In the past two decades, the disease has been spreading from the middle and lower reaches of the Yangtze River toward the Yellow and Huai River valleys, and it is becoming one of the most important wheat diseases in China [1]. Developing wheat cultivars with good resistance to FHB is challenging due to its low heritability and the substantial efforts needed for precise phenotypic assessment.
In wheat, four types of FHB resistance have been reported: resistance to initial infection (type I), resistance to fungal spread within a spike (type II), resistance to mycotoxin accumulation (type III), and resistance to kernel infection (type IV) [2,3,4,5]. Among the four resistance types, type II has been extensively studied because it is a relatively stable type of resistance. The inheritance of type II resistance is controlled by multiple quantitative trait loci (QTL) [6,7]. To date, hundreds of QTL on all 21 wheat chromosomes have been reported for type II resistance [8,9]. A highly effective and robust locus, designated as Qfhs.ndsu-3BS, also known as Fhb1, for type II resistance to FHB has been identified on the short arm of chromosome 3B [10,11,12]. Although the candidate genes for Fhb1 have been cloned [13,14,15], they remain controversial. In addition to Fhb1, there are two more QTL associated with type II resistance on chromosome 3B, one located near the centromere region on the short arm (3BSc) [16,17,18] and another on the long arm (3BL) [19,20,21,22].
Although Fhb1 is the major locus for FHB resistance, previous studies have revealed that cultivars’ genetic backgrounds influence the expression of FHB resistance [23]. Recently, two Fhb1-inhibiting loci were identified [24]. However, to date, few additional QTL were reported to possess a stable effect on wheat resistance to FHB across different genetic backgrounds or to have additive effect with Fhb1. Thus, to achieve a high and durable level of resistance, breeding programs should not rely on only Fhb1, and additional QTL with a major and robust effect also need to be identified. Pyramiding these QTL with Fhb1 could achieve high and durable resistance.
In addition to traditional bi-parental mapping methods, genome-wide association analysis (GWAS) is a powerful technology for identifying genetic variants associated with specific traits. GWAS addresses the parental limitations of QTL analysis by identifying variants within natural populations [25]. It has also been used for the identification of genomic loci controlling resistance to FHB [26,27,28]. However, most of the FHB-associated loci identified through GWAS have a small genetic effect and are lacking reproducibility due to phenotyping problems and the population structure. In order to identify additional QTL with a major effect on FHB resistance across different genetic backgrounds, we used two natural populations with different wheat origins. Type II resistance was evaluated over the course of three continuous growing years. These two distinct populations were genotyped with 55K SNP and transcriptome SNP, respectively. As a result, two QTL of high confidence were identified. The results of this research will provide valuable information that can be utilized to develop new wheat germplasm with enhanced FHB resistance.

2. Materials and Methods

2.1. Plant Materials

The GWAS was performed in two independent natural populations of wheat varieties. Population 1 consists of 124 varieties, with 113 varieties being collected from different regions of China and 11 varieties being introduced from abroad, which were kindly provided by Guihua Bai at Kansas State University, USA. Population 2 consists of 120 varieties. The wheat varieties in population 1 are mostly from the middle and lower reaches of the Yangtze River, China, and were selected under high selection pressure for FHB resistance. Even though some varieties lack Fhb1, they still demonstrate good resistance to FHB. All the varieties in population 2 do not carry Fhb1, and they were introduced from a wide range of sources, which were used to verify the QTL detected in population 1. The two populations were planted in the experimental field of Yangzhou University in three continuous growing years from 2021 to 2023. Both populations were planted as hill plots with two replicates per year to ensure fifteen spikes per cave that can be inoculated.

2.2. FHB Inoculation and Phenotypic Evaluation

The wheat spikes were inoculated with macroconidia of highly virulent Fusarium graminearum strain F1312, which was provided by Huaigu Chen from the Jiangsu Academy of Agricultural Sciences. The macroconidia were produced in mung bean broth following the protocol described by Bai et al. [29]. For each wheat variety, 15 spikes were inoculated at the flowering date by injecting a 10 μL spore suspension (100 conidia μL−1) into the 2 bilateral florets of the sixth spikelet from the top of spike. The disease severity was estimated by the percentage of symptomatic spikelets in a spike (PSS, calculated by the number of diseased spikelets/total number of spikelets in a spike) at 25 days after inoculation.

2.3. DNA Extraction and Genotyping

The genomic DNA of 124 varieties in population 1 was extracted from fresh leaf tissue using the cetyltrimethylammonium bromide (CTAB) method [30]. The wheat 55K SNP array from the China Golden Marker Biotechnology Corporation (Beijing, China) was applied for genotyping. The SNP genotype calling was processed with the apt-genotype-axiom, ps-metrics and ps-classification models of the Affymetrix (Thermo Fisher, Waltham, MA, USA) AxiomAnalysisSuite software (version 4.0). To prevent spurious marker–trait associations (MTAs), SNP markers with a minor allele frequency (MAF) less than 0.05 and missing data exceeding 10% were excluded from further analyses. In total, 32,663 SNPs was used for the association mapping. The physical positions of the SNP markers were determined according to the reference genome sequence of Chinese Spring (IWGSC RefSeq v1.0, http://www.wheatgenome.org/, accessed on 12 April 2021).

2.4. RNA Extraction and Genotyping

The RNA of 120 varieties in population 2 was extracted from spikes at the anthesis stage using RNAiso plus reagent (TAKARA BIO INC, Shiga, Japan) according to the manual’s instructions. The total RNA quantification was evaluated by a NanoDrop 2000c spectrophotometer (Thermo Fisher Scientific, Lenexa, KS, USA), and the RNA quality was examined with an Agilent 2100 bioanalyzer (Thermo Fisher Scientific, Waltham, MA, USA). Library construction and sequencing of the mRNA were performed on the BGIseq500 platform (BGI, Shenzhen, China). Based on the comparison results of the Chinese Spring genome reference sequence, GATK was utilized to identify the SNPs for each sample [31]. In total, 139,061 SNPs were employed in the association mapping. The physical positions of the SNP markers were determined according to the Chinese Spring genome reference sequence.

2.5. Statistical Analysis

The statistical software SPSS (version 19.0, IBM, Armonk, NY, USA) was utilized for conducting the ANOVA analysis. The Pearson correlation analysis of the PSS was conducted by the R package “PerformanceAnalytics”. The best linear unbiased prediction (BLUP) values across three repetitions were calculated using the R package “lme 4”.

2.6. GWAS Analysis

The GWAS analysis was performed utilizing the GAPIT package (Version 3) [32] based on the phenotypic data for each year and the BLUP analysis over the three years. The kinship matrix was employed in a Mixed Linear Model (MLM). A threshold of −log10 (p) value > 3.0 was set for significant associations between marker and trait. Manhattan plots and quantile–quantile (QQ) plots were generated utilizing the “CMplot” package https://github.com/YinLiLin/CMplot (accessed on 15 September 2023) in the R package. A chromosome region with an associated SNP ± 5 Mb distance for each chromosome was considered a quantitative trait locus.

2.7. Linkage Disequilibrium and Haplotype Analysis

Haplotype blocks and linkage disequilibrium among the markers were generated using Haploview software (version 4.1). The statistical analyses of the haplotypes were performed using SPSS (version 19.0) and GraphPad Prism software (version 8.0.2). Haplotypes associated with a significant reduction in the PSS were classified as resistant or favorable haplotypes; otherwise, they were categorized as susceptible or unfavorable haplotypes.

2.8. Development of Derived Cleaved Amplified Polymorphic Sequence (dCAPS) Markers and Validation

The derived cleaved amplified polymorphic sequence (dCAPS) markers were developed using the design tool developed by Li et al. [33]. Polymerase chain reaction (PCR) amplification was performed in a C1000 TouchTM Thermal Cycler (Bio-Rad, Hercules, CA, USA) in a 20 µL volume containing 1× PCR buffer (Mg2+), 0.2 mM of dNTP, 2 µM of each primer (Table S6), 1 unit of Taq DNA polymerase, and 1 µL of DNA template. The PCR was carried out with an initial denaturation at 94 °C for 3 min, 40 cycles of 30 s at 94 °C, 30 s at 58 °C (48 °C for 6BL754), 30 s (2min for TaHRC) at 72 °C, and a final extension for 5 min at 72 °C. The PCR products of TaHRC were separated in 2% agarose gel and photographed. The PCR products of the two markers, 3BL650 and 6BL754, were digested by the restriction enzyme EcoR I and EcoR V, respectively, and the enzyme-digested products were separated in 5% agarose gel.

2.9. Experimental Design

A flowchart of the experimental design is shown in Figure S1.

3. Results

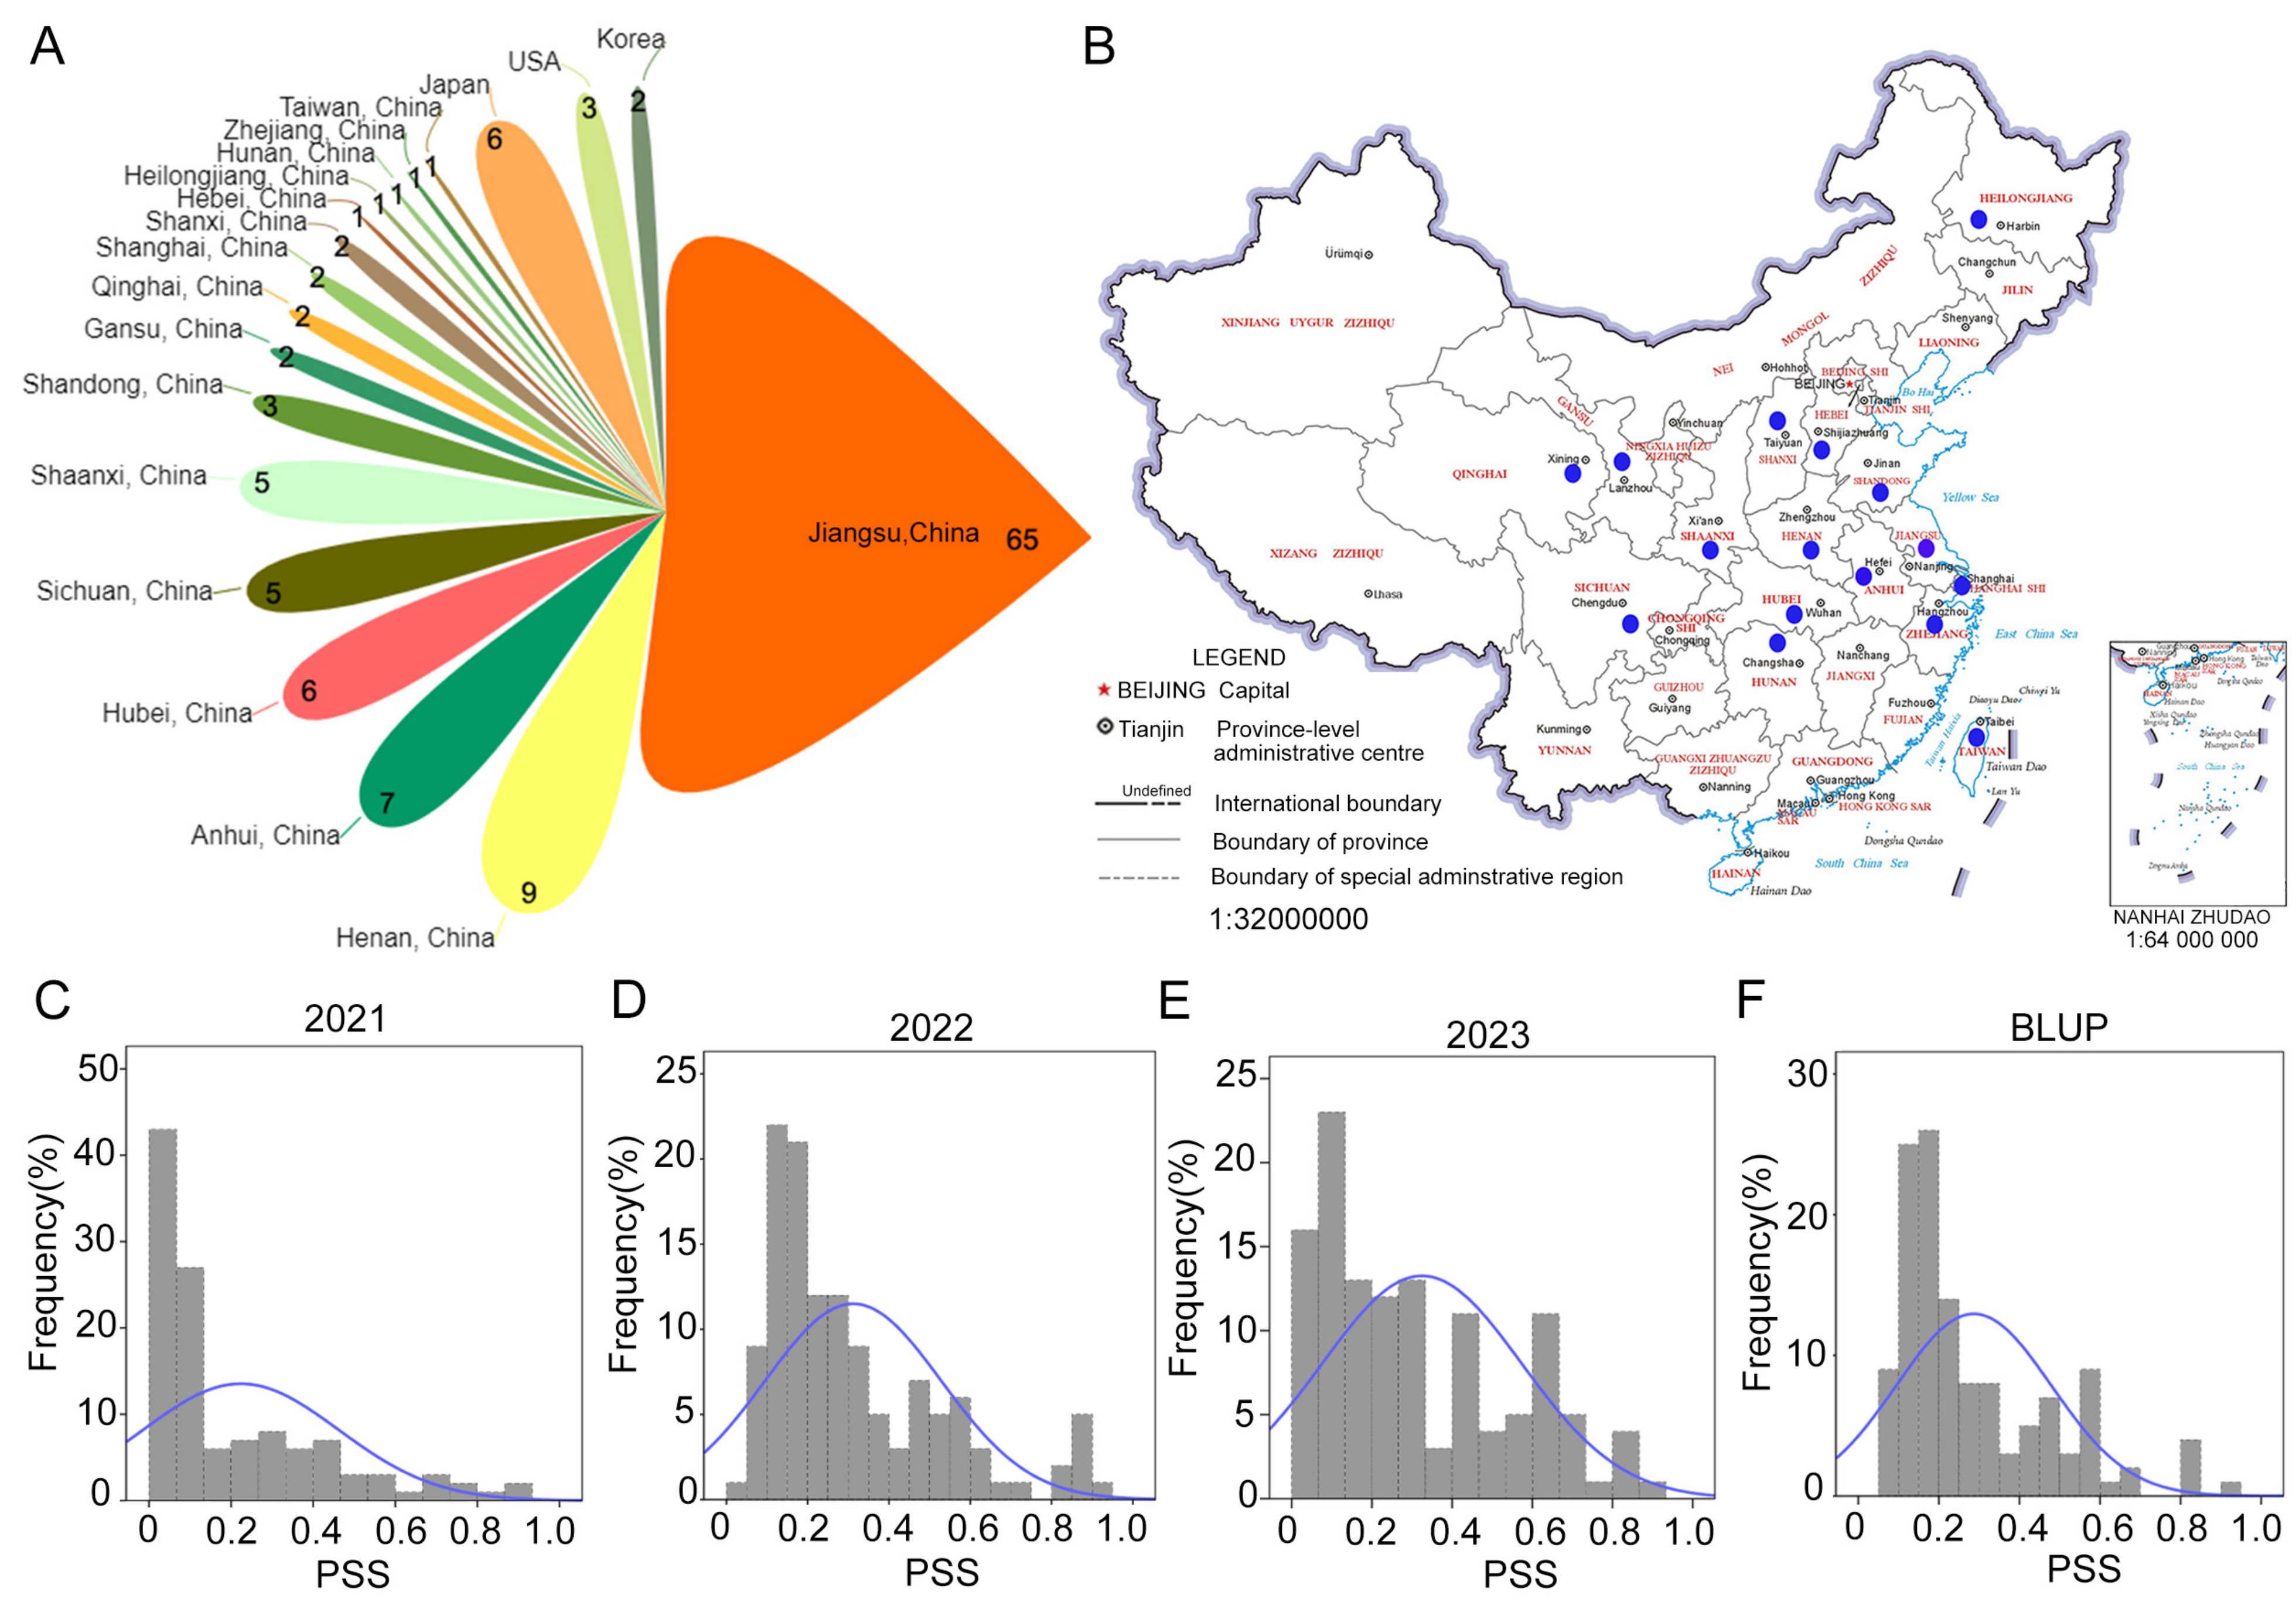
3.1. Phenotypic Variations of Two Independent Populations of Different Origins and Levels of Resistance to FHB

In order to map the resistance QTL other than Fhb1, we constructed two populations with differential resistance to FHB, designated as population 1 and population 2, respectively. A total of 124 wheat varieties were collected in population 1, including 65 varieties from Jiangsu province (Figure 1A) and 47 varieties originating from 14 other provinces in the Yangtze and Yellow River basins (Figure 1B), most of which are domesticated varieties. In population 1, the average PSS was 0.22, 0.31 and 0.32 in the year 2021, 2022 and 2023, respectively (Table S1), and about 60% varieties showed high levels of resistance to FHB, with a PSS less than 0.2 over the three years (Figure 1C–E), and 40 varieties carried Fhb1, accounting for 32% varieties (Table S2). The correlation coefficients for the PSS ranged from 0.74 to 0.92 among the three years and the BLUP value (Table S3). The varieties in population 2 did not carry Fhb1, consisting of 27 foreign varieties and 93 Chinese varieties (Table S4). In population 2, 93 Chinese varieties originated from northern China, such as Shandong, Henan and Shaanxi provinces (Figure S2), where FHB occurs not as frequently as in the Yangtze River region. The average PSS was 0.37, 0.57 and 0.58 in the year 2021, 2022 and 2023, respectively, significantly higher than in population 1 (Figure S3). The correlation coefficients for the PSS ranged from 0.46 to 0.82 (Figure S4) among the three years and the BLUP value. According to the overall phenotypic performance across the three years, population 1 was defined as a resistant panel (moderate to high resistance to FHB) and population 2 was defined as a susceptible panel (moderate to high susceptibility to FHB).

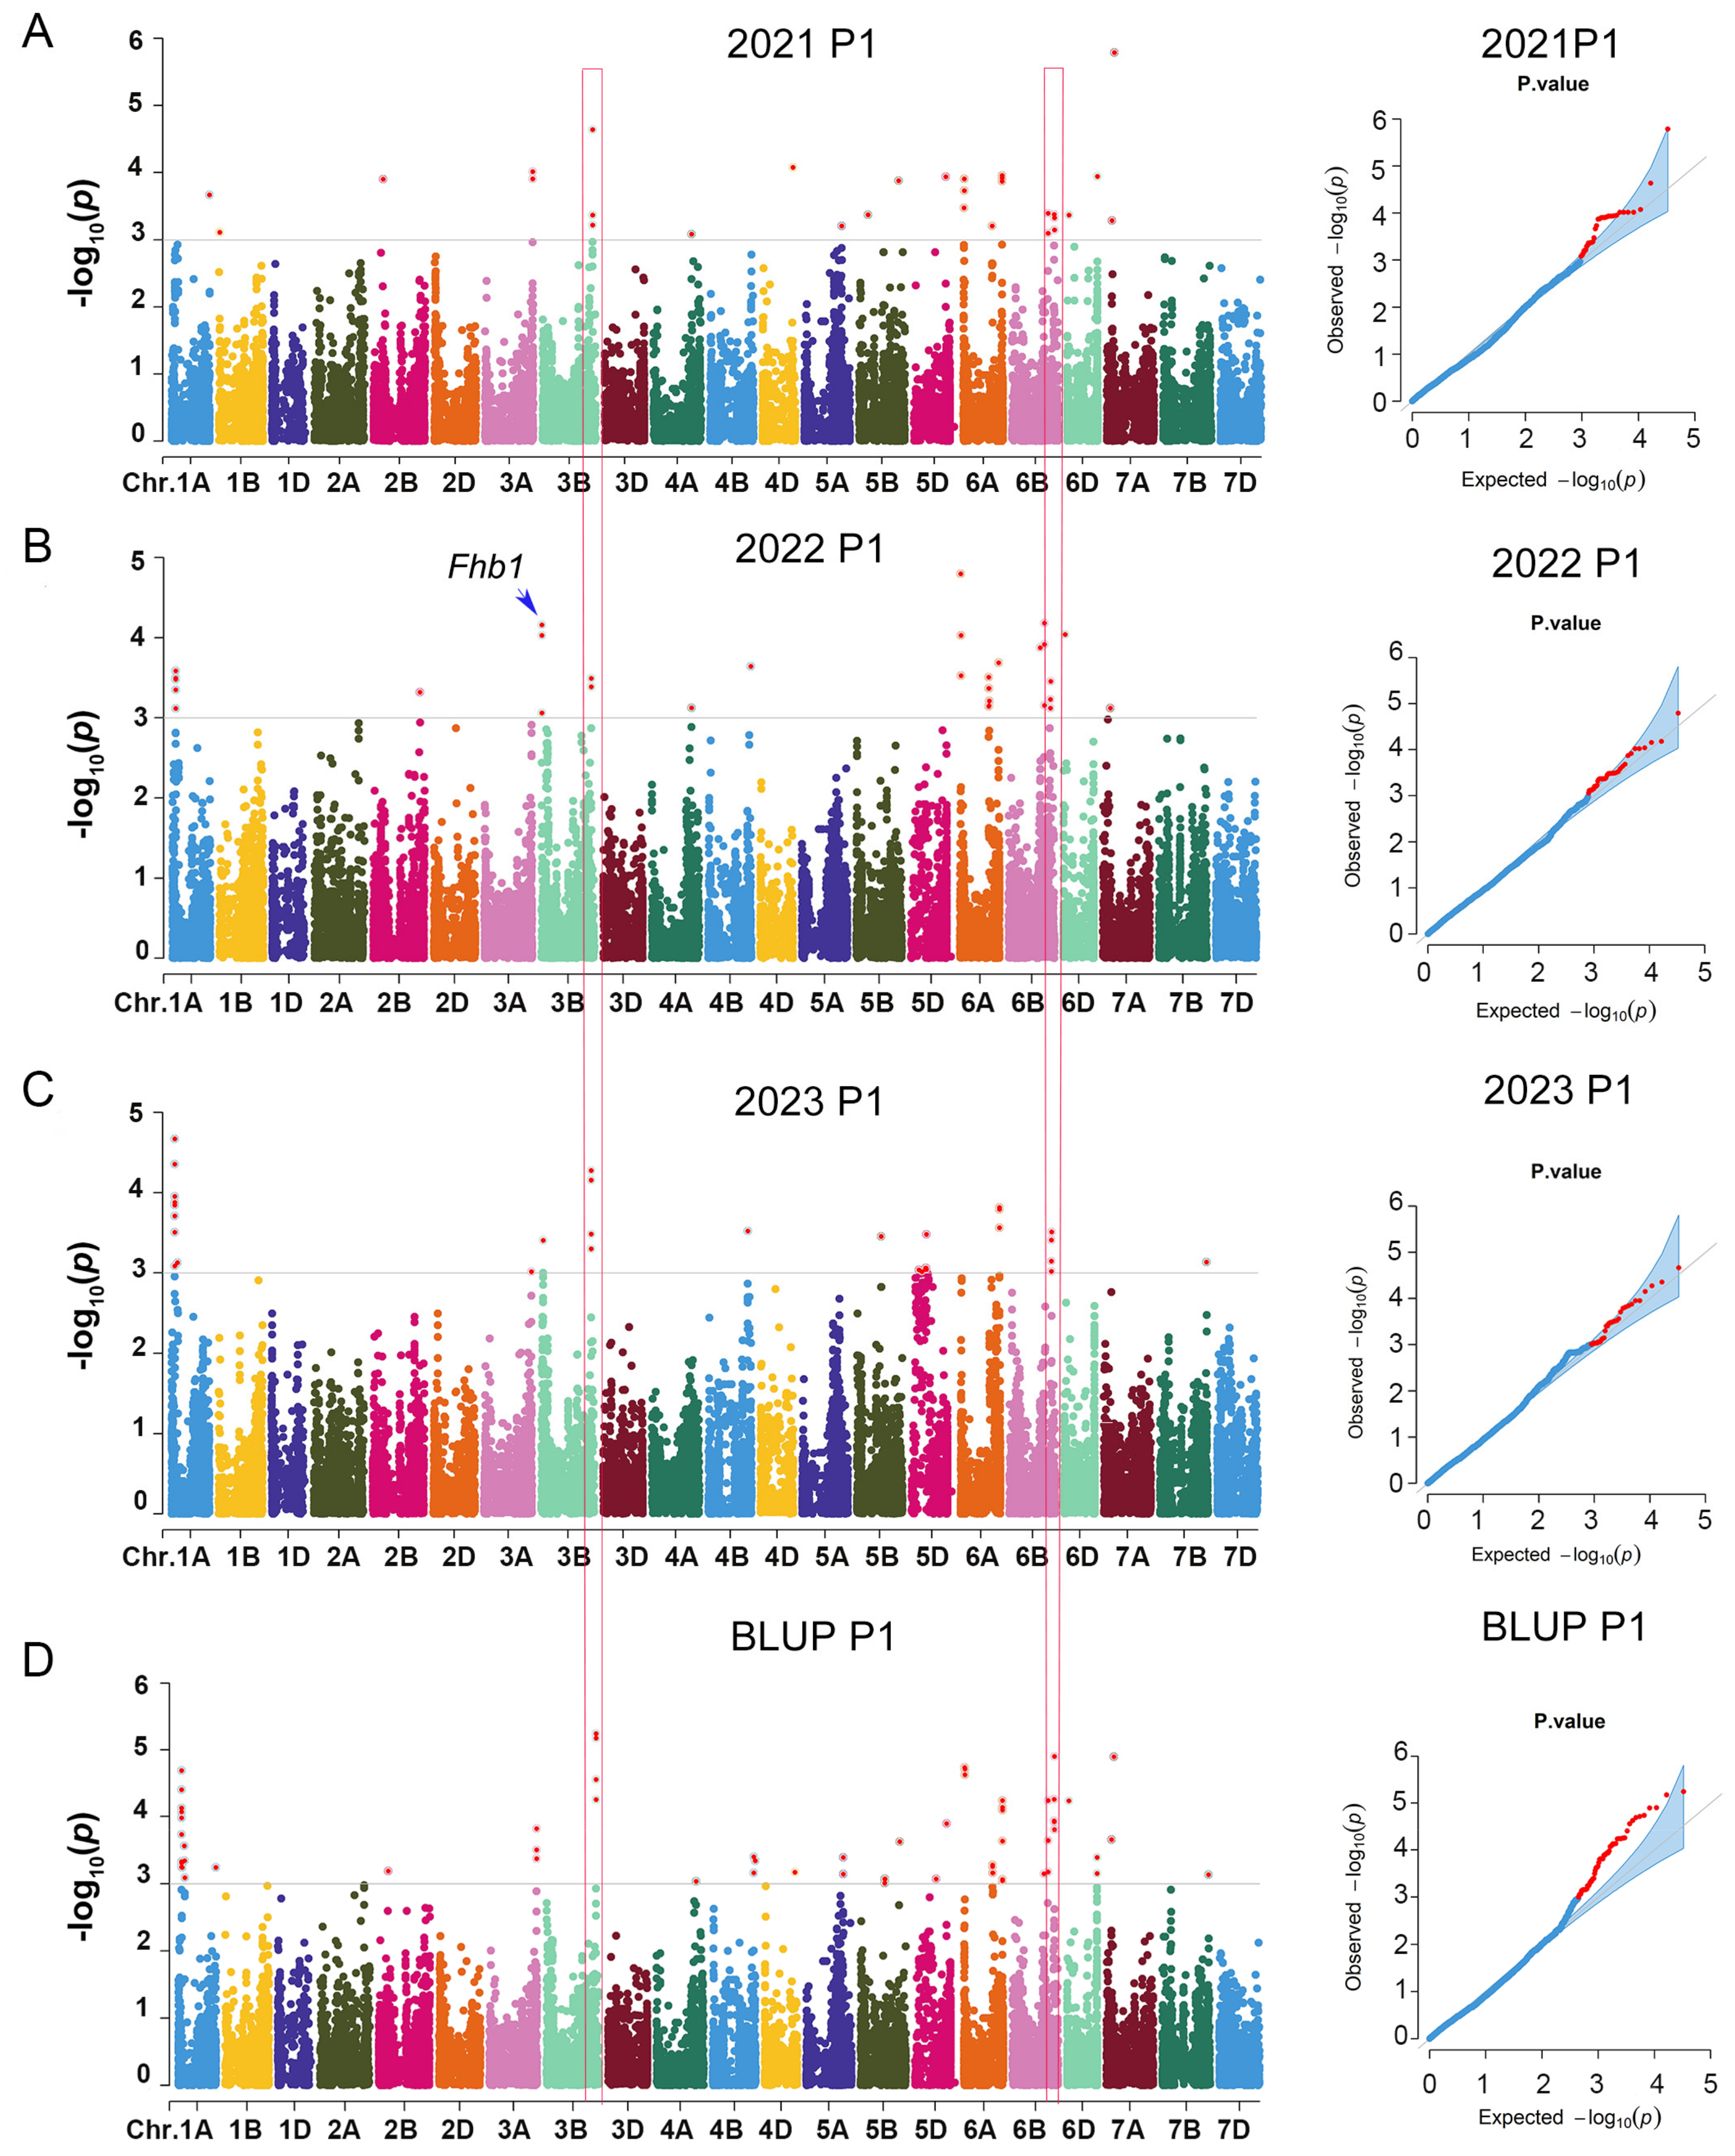
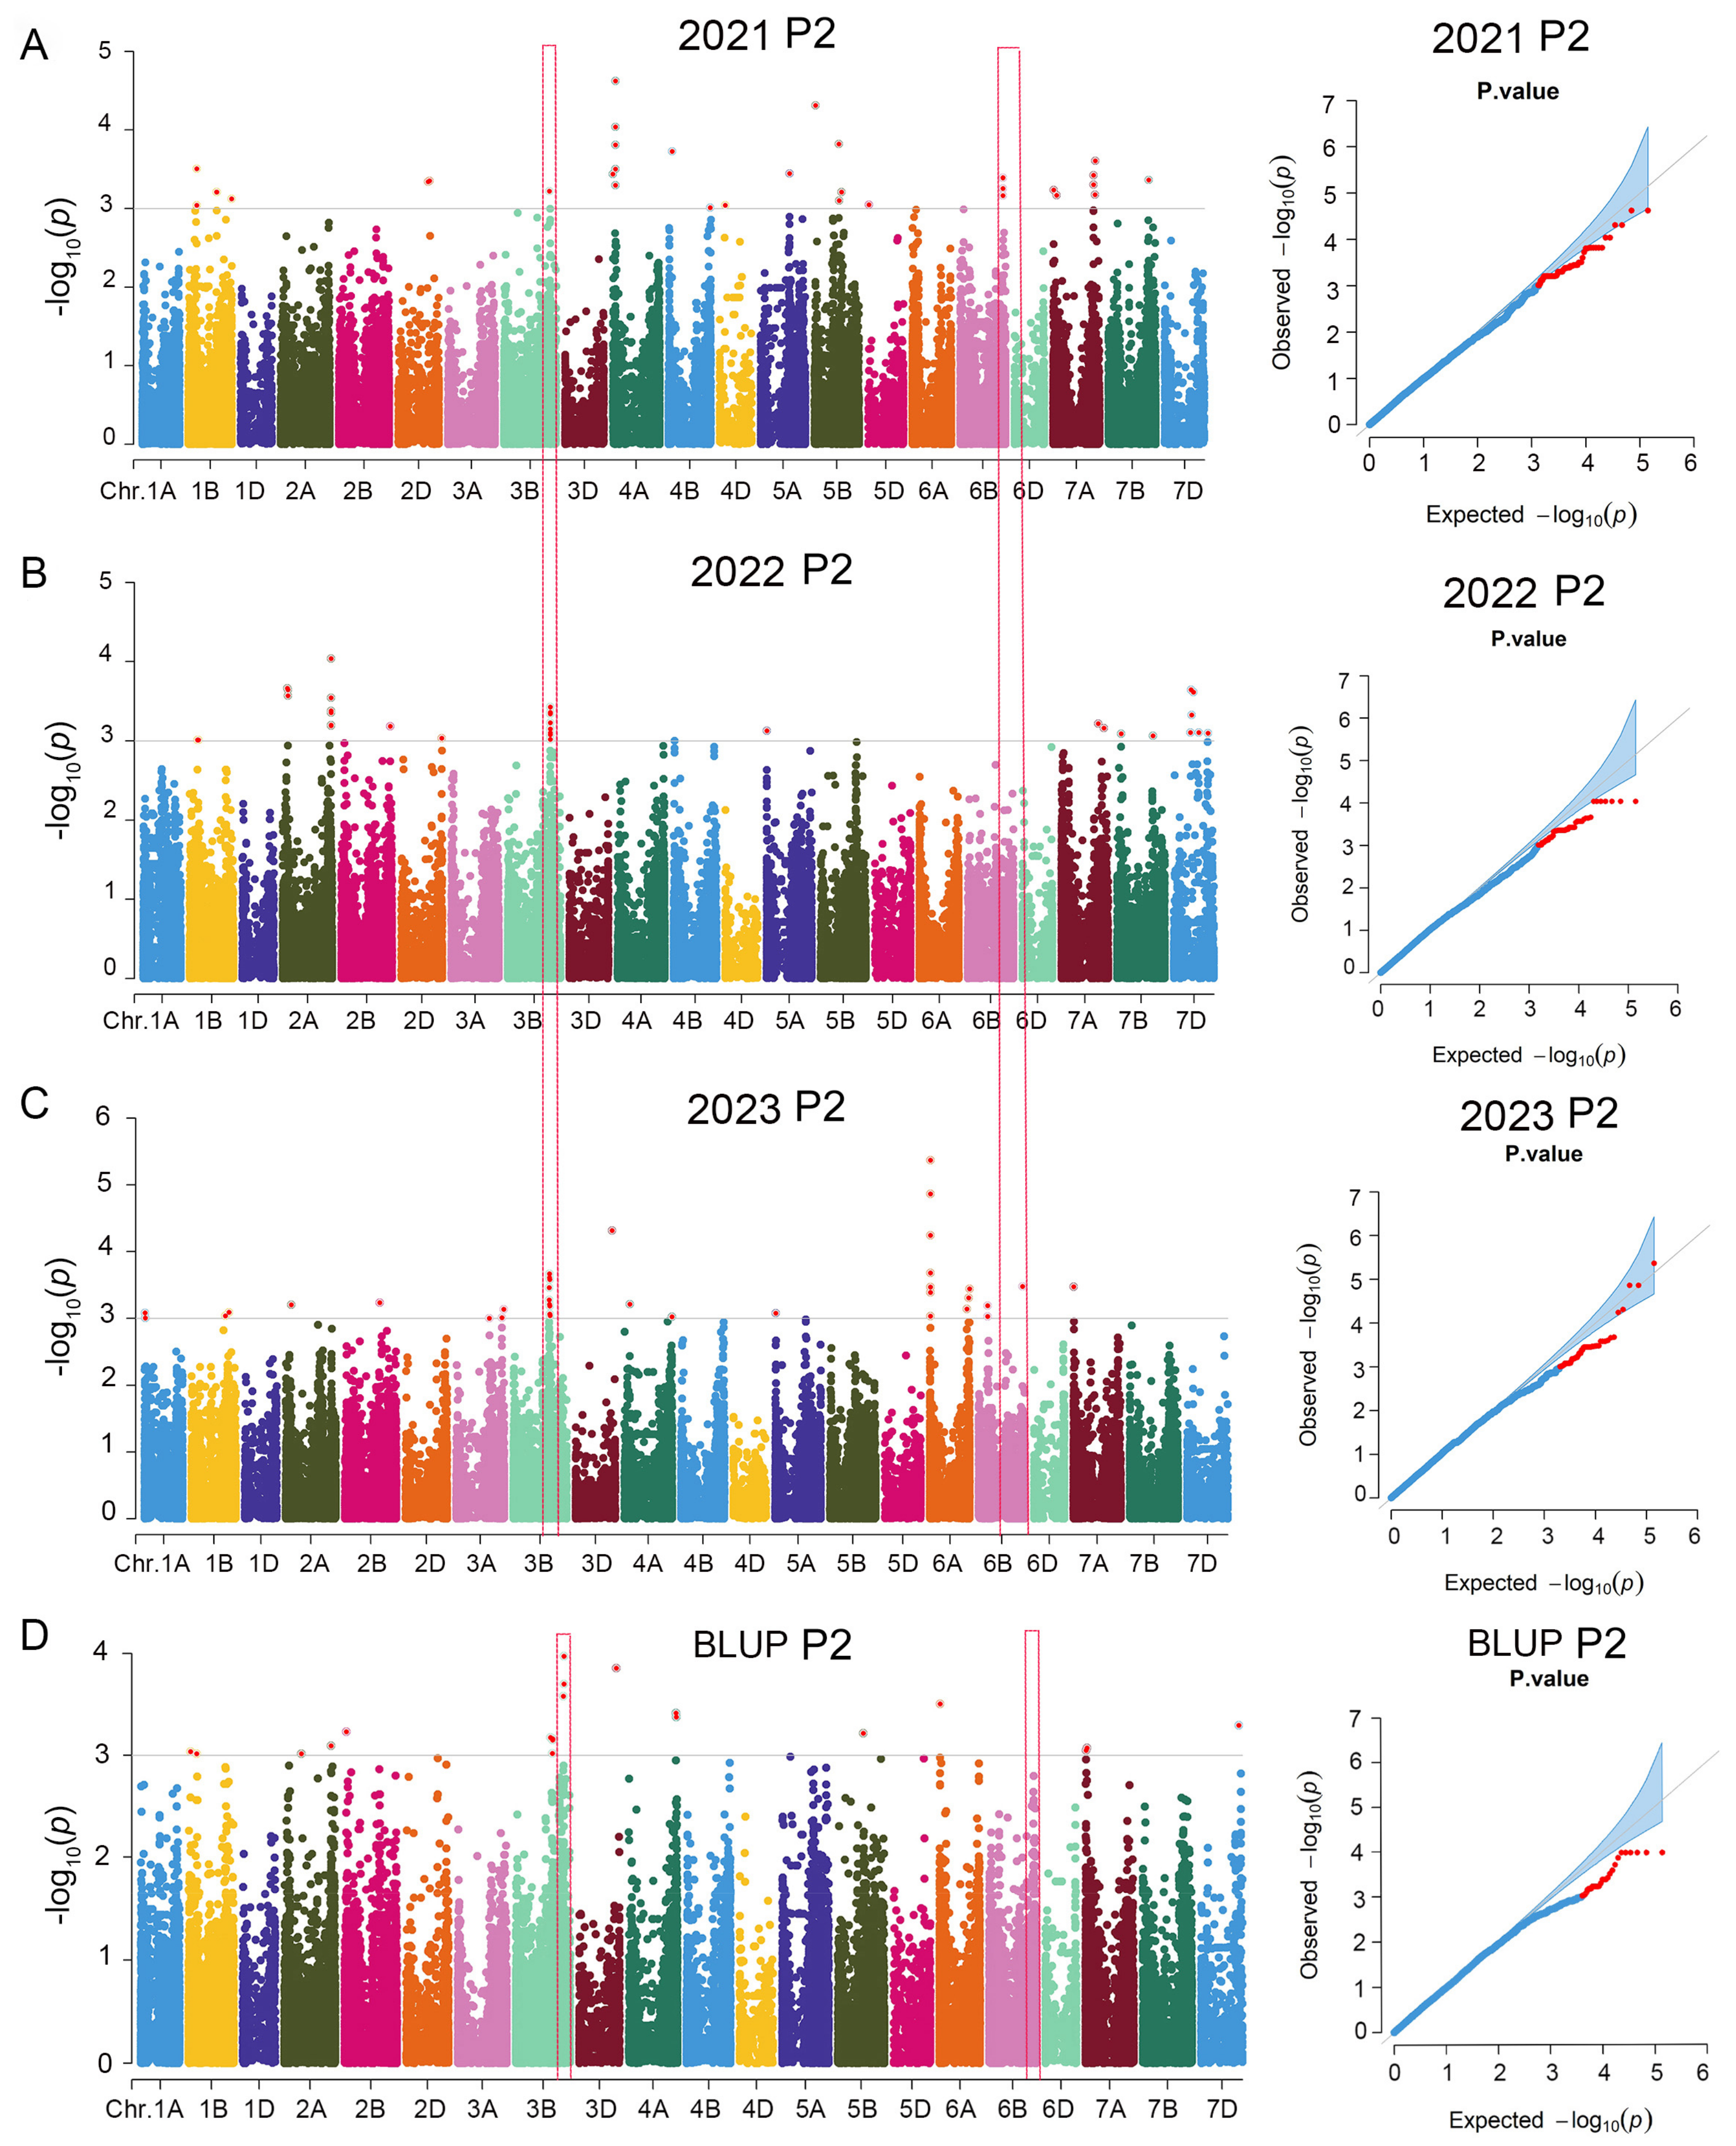
3.2. Significant SNPs for Marker–Trait Associations

In population 1, a total of 58 SNPs were significantly associated with the FHB severity for the BLUP, which were located on chromosomes 1A (9), 2B (1), 3A (6), 3B (4), 4A (1), 4B (1), 4D (1), 5A (1), 5B (2), 5D (2), 6A (15), 6B (10), 6D (2), 7A(2), and 7B (1), representing 24 putative QTL (Figure 2, Table 1). Three of the 58 SNPs were detected across three years, and 25 in two years. Among the 24 putative loci, 7 QTL were located in the known high-confidence QTL region, while the others were first identified here. Qfhb.yzu.3B.1 and Qfhb.yzu.6B.3 were detected across the three years, which were located at 779.97–780.81 Mb on the long arm of chromosome 3B and at 654.80–656.19 Mb on the long arm of chromosome 6B, respectively. The genomic region of Qfhb.yzu.3B.1 had four significantly associated SNPs, explaining 6.19–10.45% of the phenotypic variation. The two SNPs, AX-109890650 and AX-109387464, within a physical interval of about 50 Kb, were consistently detected across the three years (Table 1). The genomic region of Qfhb.yzu.6B.3 had six significantly associated SNPs, which were located within a physical interval of about 1.4 Mb (Table 1). The two SNPs, AX-109481828 and AX-109285181, explained a phenotypic variation up to 24.36%. AX-111041754 was significant across the three years and explained 13.09%–16.94% of the phenotypic variation. In population 2, Qfhb.yzu.3B.1 was also detected across the three years (Figure 3), and Qfhb.yzu.6B.3 was recovered in two of the three years, confirming the authenticity of these two QTL. The other SNPs significant in population 1 were either detectable in one year or not detected in population 2 (Figure 3). These results suggest that Qfhb.yzu.3B.1 and Qfhb.yzu.6B.3 are reliable QTL and that Qfhb.yzu.3B.1 might be a novel locus.

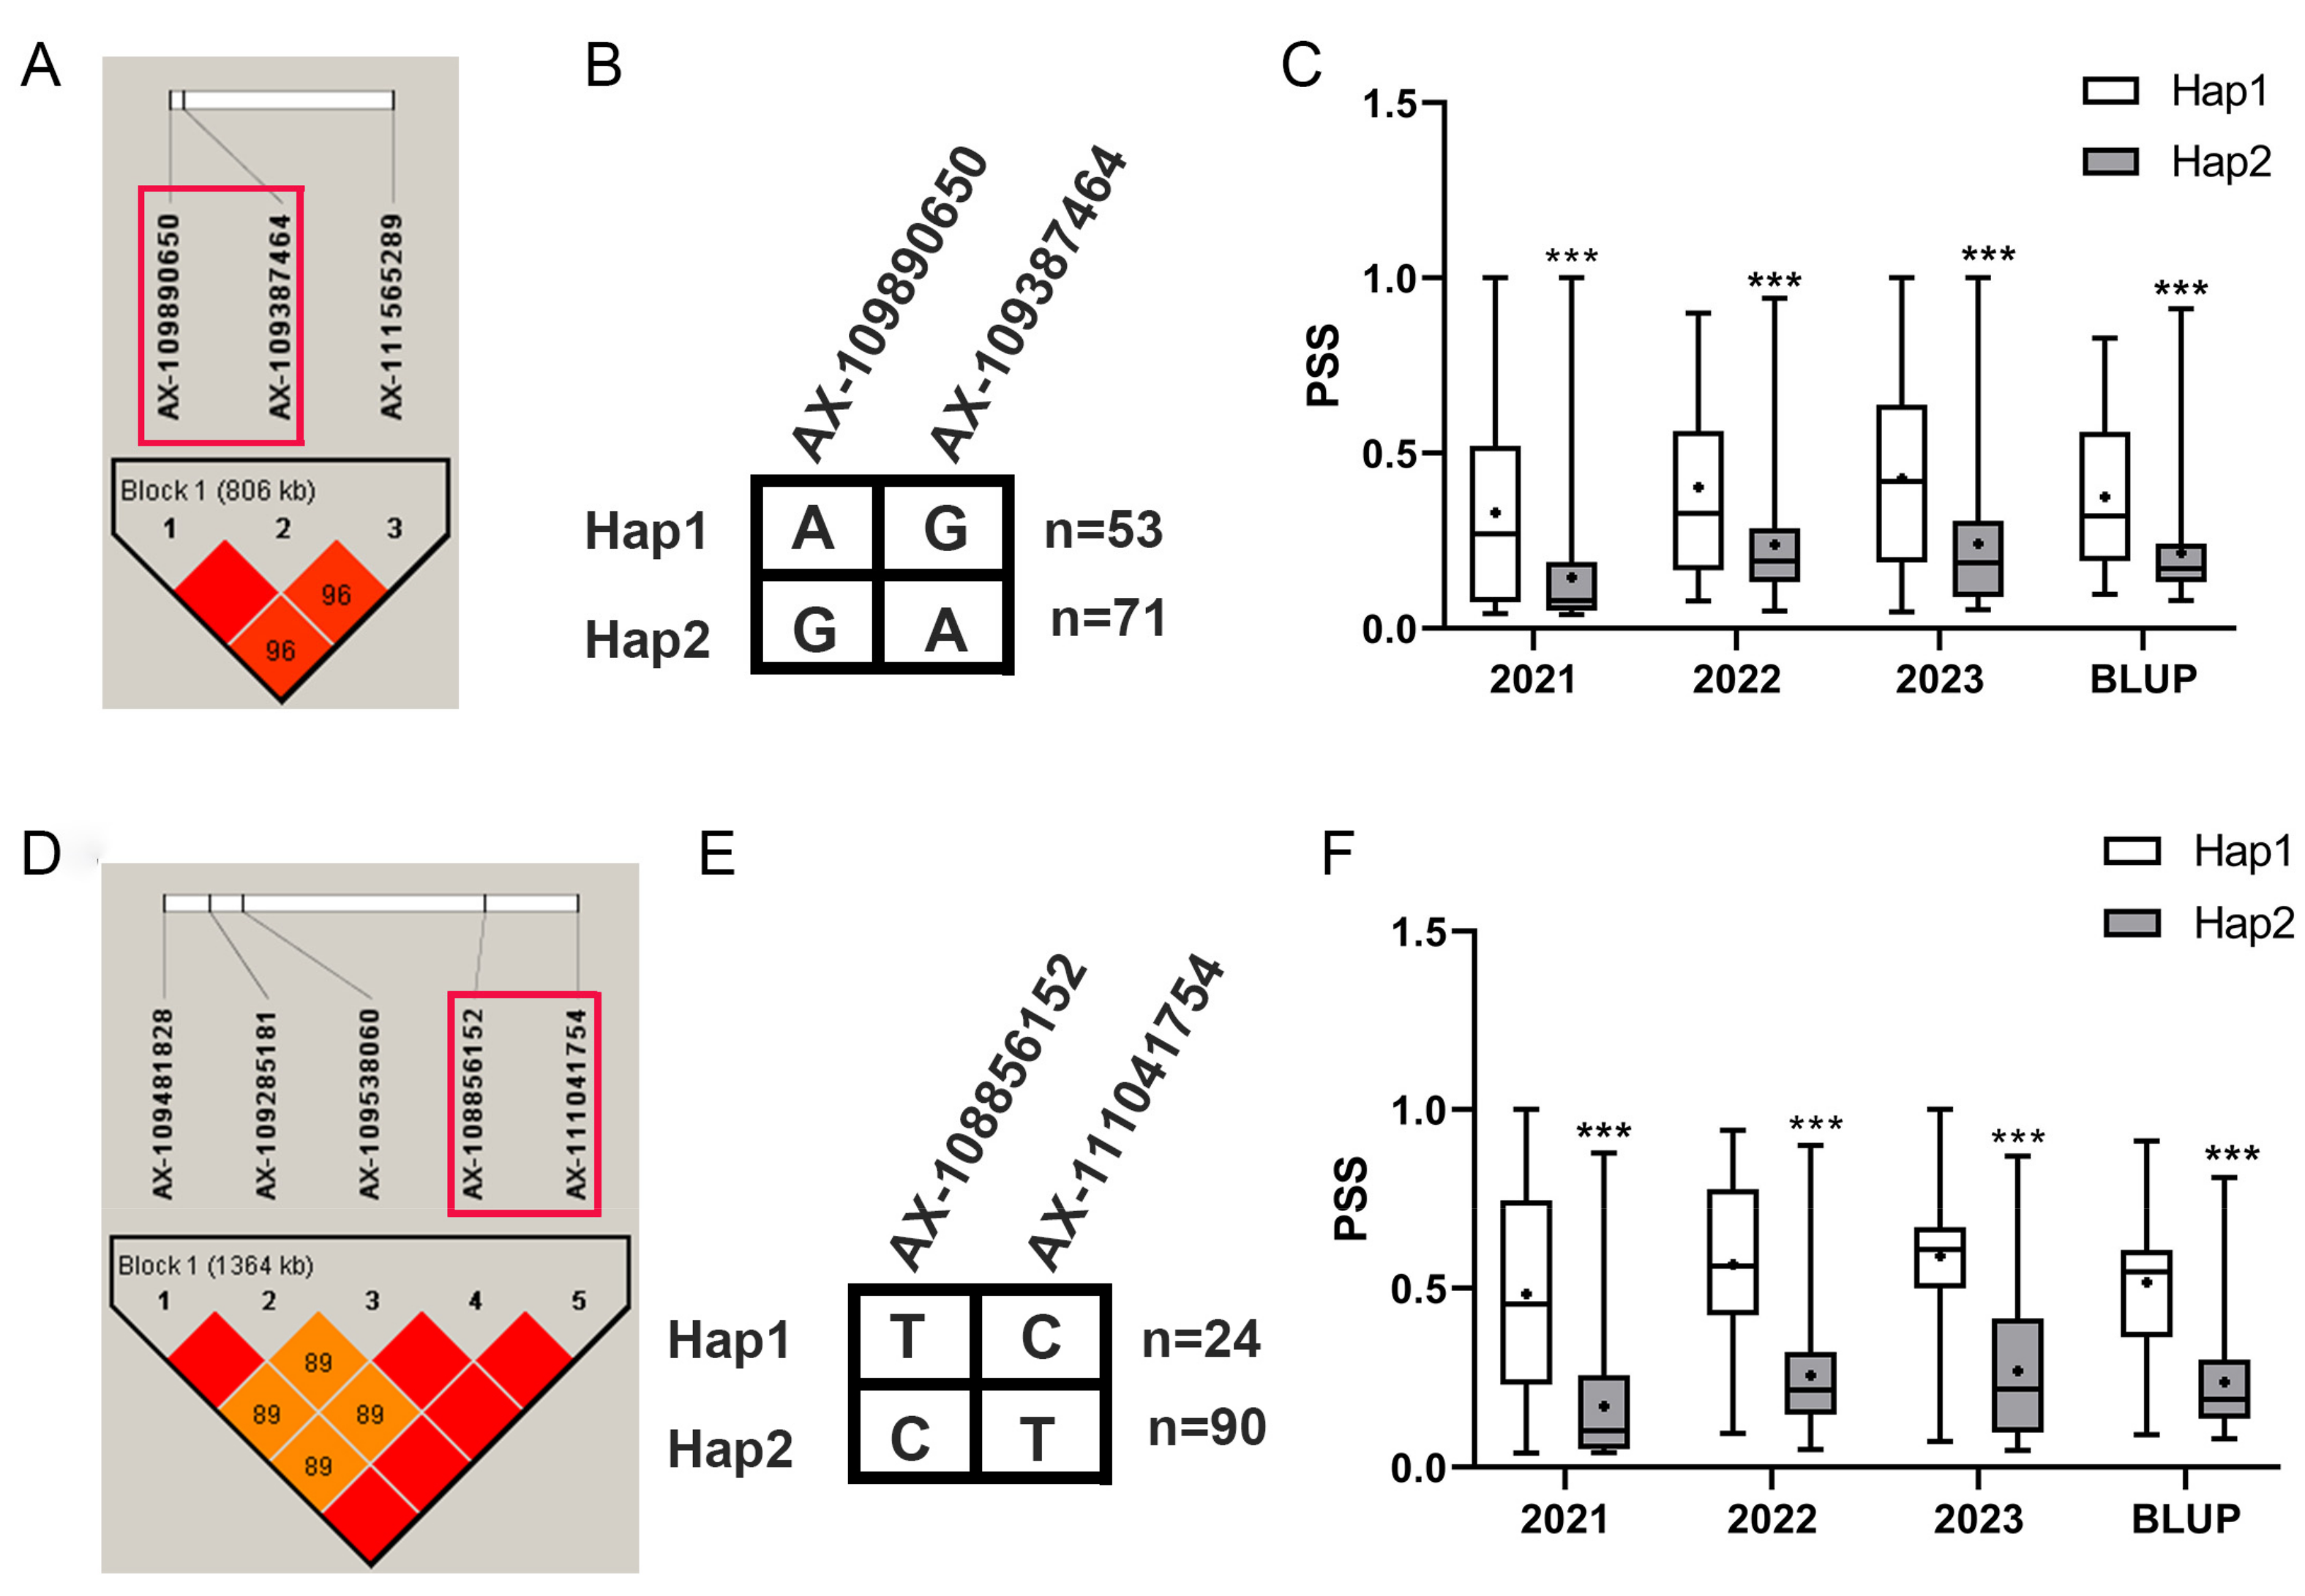
3.3. Favorable Alleles at Qfhb.yzu.3B.1 and Qfhb.yzu.6B.3 Significantly Decreased the Disease Severity

Haplotype analysis of two reproducible QTL across three years was subsequently performed. Linkage disequilibrium (LD) analysis of the QTL with multiple significant SNPs was performed to search for the tag SNP and then its genetic effect was estimated. Qfhb.yzu.3B.1 was located within a physical interval of about 1 Mb, containing three significant SNPs. Both AX-109890650 and AX-109387464 were tag SNPs (Figure 4A,B). The average PSS of the varieties harboring Hap2 (GA) was significantly lower than that of the varieties harboring Hap1 (AG) (Figure 4C), suggesting that Hap2 (GA) is a favorable allele. Qfhb.yzu.6B.3 was located within a physical interval of about 1.3 Mb, containing five significant SNPs. Both AX-108856152 and AX-111041754 were tag SNPs (Figure 4D), and 19% of varieties harbored haplotype Hap1 (TC) and 73% of varieties carried Hap2 (CT) (Figure 4E). The average PSS of the varieties carrying Hap2 was approximately half that of the varieties harboring Hap1 (Figure 4F), implying that Hap2 is also a superior haplotype associated with FHB resistance and might be positively selected during the breeding process.
In summary, Qfhb.yzu.3B.1 and Qfhb.yzu.6B.3 were significantly associated with type II resistance to FHB and their favorable haplotypes might have experienced positive selection or domestication during the breeding process.

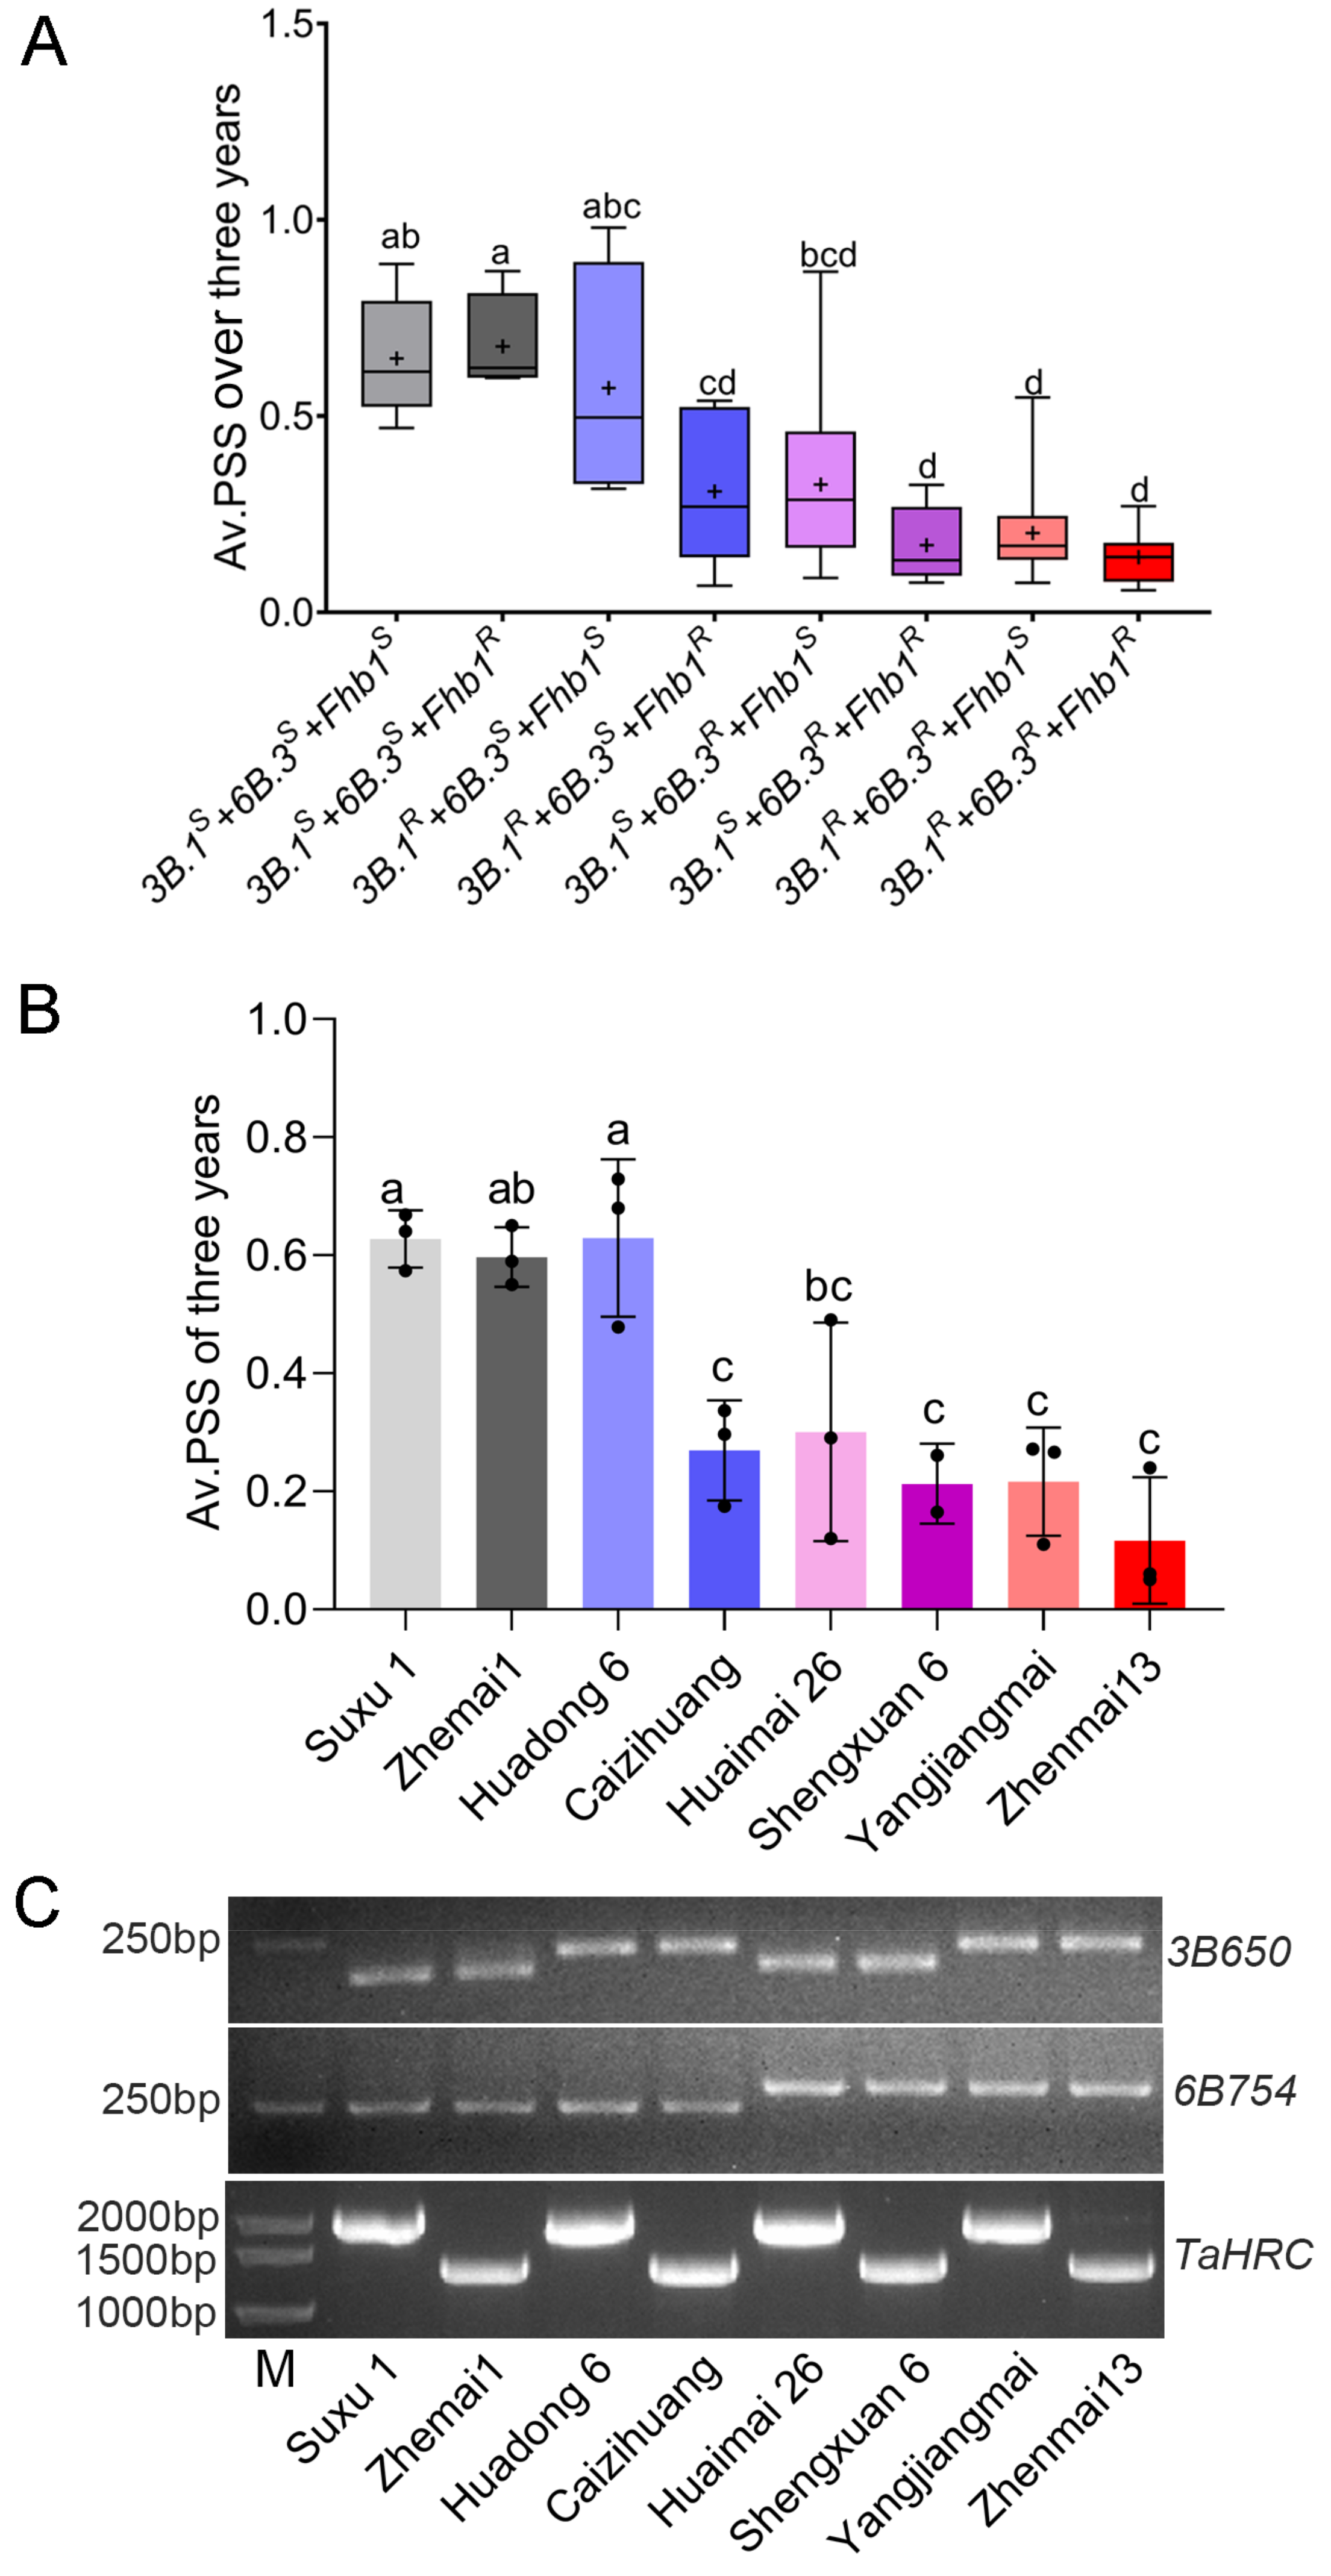
3.4. Pyramiding Favorable Alleles of Qfhb.yzu.3B.1, Qfhb.yzu.6B.3 and Fhb1 Significantly Improved FHB Resistance

In population 1, as expected, the average PSS of the varieties carrying favorable alleles of Fhb1 was significantly lower that of the varieties carrying unfavorable alleles (Figure S5). The effects of the allelic combinations at Qfhb.yzu.3B.1, Qfhb.yzu.6B.3 and Fhb1 for the PSS BLUP values were analyzed. We found that the varieties harboring susceptible haplotypes at both Qfhb.yzu.3B.1 and Qfhb.yzu.6B.3 showed the highest PSS, irrespective of the contrasting haplotypes at Fhb1 (Figure 5A). The PSSs of the varieties were significantly reduced when the resistant haplotypes at Qfhb.yzu.3B.1 and Qfhb.yzu.6B.3 existed at the same time, regardless of the contrasting haplotypes at Fhb1 (Figure 5A and Figure S6). The average PSSs of the combinations of the resistant haplotype at Fhb1 together with the resistant haplotype at either Qfhb.yzu.3B.1 or Qfhb.yzu.6B.3 were significantly reduced. The effects of Qfhb.yzu.3B.1 and Qfhb.yzu.6B.3 were also validated in population 2 (Figure S7). Similar to the performance in population 1, the PSSs of the varieties carrying any one of the resistance haplotypes at Qfhb.yzu.3B.1 or Qfhb.yzu.6B.3 were not significantly reduced, but the PSSs of the varieties were significantly reduced when the resistant haplotypes at Qfhb.yzu.3B.1 and Qfhb.yzu.6B.3 existed at the same time (Figure S7). Eight varieties carrying different combinations of favorable haplotypes at Qfhb.yzu.3B.1, Qfhb.yzu.6B.3 and Fhb1 were selected (Figure 5B, Table S5). Among these varieties, Zhenmai13 carried the favorable alleles at Qfhb.yzu.3B.1, Qfhb.yzu.6B.3 and Fhb1 and the average PSS over three years was 0.12. The dCAPS markers were developed to track the tag SNPs for Qfhb.yzu.3B.1 and Qfhb.yzu.6B.3. The TaHRC marker was used to track the alleles of Fhb1 (Figure 5C).

4. Discussion

4.1. Qfhb.yzu.3B.1 and Qfhb.yzu.6B.3 Are Two Reliable QTL Associated with Resistance to FHB

A reasonable population structure can obtain reliable phenotype–genotype association loci in genome-wide association analysis, and population stratification may lead to a spurious allelic association [34]. In order to identify reliable marker–trait associations, controlling population stratification is necessary. To this end, we designed two relatively independent populations. Population 1 exhibited stratification (Figure S3A), but population 2 was more homogeneous than population 1 (Figure S3B). Therefore, population 2 can be used to verify the causal loci identified in population 1.
Fhb1 is one of the major QTL for wheat resistance to FHB. In population 1, 40 varieties carry the resistant alleles at Fhb1, and about 70 varieties showed high levels of resistance to the disease (Figure 1C–F), indicating that FHB resistance was not mediated by only Fhb1 and that other QTL also contributed to the varietal resistance. We estimated the effect of Fhb1 and found that the favorable haplotype at Fhb1 significantly reduced the disease severity, but the large error bars reveal large phenotypic variation in the varieties with a favorable haplotype at Fhb1 (Figure S5). It is worth noting that not all the varieties carrying Fhb1 have a high level of resistance; for example, Zhemai1 probably carries a favorable allele at Fhb1 but had a high PSS up to 0.59 (Figure 5B,C), suggesting that the effect of Fhb1 may also be subject to the genetic background of the variety.
The Qfhb.yzu.3B.1 and Qfhb.yzu.6B.3 loci were reproducible across two independent populations of different origins (Figure 2 and Figure 3), indicating that these two loci are reliable. The favorable haplotypes of these two QTL could reduce the PSS (Figure 4). Based on the genetic effects of individual QTL and their allelic combinations, and these two QTL might be additive to each other, and also to Fhb1 (Figure 5A and Figure S7).

4.2. Qfhb.yzu.3B.1 Represents a Newly Identified QTL

One locus was reported on the long arm of chromosome 3B; however, its location is near the centromere [19], which poses a challenge for fine mapping and cloning of the locus. Qfhb.yzu.3B.1 was located at around 780 Mb at the end of the long arm of chromosome 3B and was not overlapped with the previously reported QTL interval (Table 1). He et al. mapped a locus for deoxynivalenol (DON) accumulation on 3BL about 80 Mb away from Qfhb.yzu.3B.1 [35]. Therefore, Qfhb.yzu.3B.1 was most likely a novel locus for FHB resistance. A high frequency of recombination is expected at the terminal region on the chromosome, making it advantageous for subsequent fine mapping the QTL and then isolating the candidate genes.

4.3. High Frequencies of Resistance Haplotypes at Qfhb.yzu.6B.3 in the Two Panels

Qfhb.yzu.6B.3 was reproducible across the three years and co-located to a known QTL interval [36,37,38]. In these studies, the QTL explained 10%–20% of the phenotypic variation. Haplotype analysis of Qfhb.yzu.6B.3 in population 1 revealed that the favorable haplotype at this locus reduced the PSS by over 50% (Figure 4F), indicating that the QTL also exhibited superior resistance to FHB. Furthermore, the number of varieties carrying the favorable haplotype was nearly four-fold of the number of the varieties carrying the unfavorable haplotype (Figure 4E), suggesting that Qfhb.yzu.6B.3 might also have experienced a positive selection during the breeding process and that it shows promising potential in the genetic improvement of FHB resistance.

4.4. Qfhb.yzu.3B.1 and Qfhb.yzu.6B.3 Were Additive to Fhb1 in Different Genetic Backgrounds

The challenge in FHB resistance breeding is to combine FHB resistance with superior agronomic and quality traits. Even when Fhb1 is present, the resistance levels to FHB may vary based on the genetic backgrounds [23]. The interactions among QTL may have distinct behavior in terms of different genetic backgrounds [39]. Therefore, understanding the relationship between Fhb1 and other QTL from different genetic backgrounds is crucial for breeding practice. The natural populations used for GWAS in this study exhibited diverse genetic backgrounds (Tables S2 and S5). Qfhb.yzu.3B.1 and Qfhb.yzu.6B.3 could be recovered in different years in two populations (Figure 2 and Figure 3), suggesting that these two QTL are stable and reliable. According to the haplotype analysis in population 1, if a variety carries susceptible haplotypes at both Qfhb.yzu.3B.1 and Qfhb.yzu.6B.3, their negative effects balanced the positive effect of Fhb1 (Figure 5A). The combination of the favorable haplotypes of Qfhb.yzu.3B.1 and Qfhb.yzu.6B.3 with Fhb1 showed a significant increase in resistance to FHB (Figure 5A), suggesting that these two loci were additive to Fhb1 in relation to different genetic backgrounds, especially when combining the favorable haplotype Qfhb.yzu.6B.3 with the favorable haplotype at Fhb1. It was observed that the additive effect of Qfhb.yzu.6B.3 and Fhb1 was significantly higher than that of Qfhb.yzu.3B.1 and Fhb1. Thus, Qfhb.yzu.6B.3 may have a higher breeding value when compared with Qfhb.yzu.3B.1.

5. Conclusions

In this research, we have identified two stable and reliable QTL, Qfhb.yzu.3B.1 and Qfhb.yzu.6B.3, that are associated with resistance against FHB. These QTL have the potential to notably mitigate the severity of FHB when used either separately or in combination. Importantly, the effect of the favorable haplotype in these two QTL could add to the effect of Fhb1 in relation to variable genetic backgrounds. Our findings provide valuable QTL for the development of FHB-resistant wheat varieties and supply insightful data for the prospective cloning of candidate genes.

Supplementary Materials

The following supporting information can be downloaded at https://www.mdpi.com/article/10.3390/agronomy14061230/s1, Figure S1: Schematic diagram of the experimental design. Figure S2: Source and number of the wheat varieties in population 2; Figure S3: The average PSS for population 1 and population 2; Figure S4: Correlations of the PSSs among the three years in population 2; Figure S5: Haplotypes of Fhb1; Figure S6: Effects of different haplotypic combinations at Qfhb.yzu.3B.1, Qfhb.yzu.6B.3 and Fhb1; Figure S7: Effects of different haplotypic combinations of Qfhb.yzu.3B.1, Qfhb.yzu.6B.3 in population 2; Table S1: Phenotypic variation of the PSSs of 124 wheat varieties in population 1; Table S2: Origins of the 124 wheat varieties in population 1; Table S3: Pearson correlations of the PSSs and BLUP values among three years in population 1; Table S4: Origins of the 120 wheat varieties in population 2; Table S5: Phenotypes and haplotypes of eight highly FHB-resistant varieties; Table S6: Primers used in this study.

Author Contributions

Z.S.: Investigation, funding acquisition, formal analysis, writing original draft. H.Y.: Investigation, data curation, visualization. X.C.: Investigation, data curation. J.C.: Software. D.Y.: Investigation, data curation. S.H.: Investigation, data curation. F.Z.: Investigation, formal analysis. L.L.: Methodology. T.L.: Conceptualization, funding acquisition, supervision, writing review and editing. All authors have read and agreed to the published version of the manuscript.

Funding

This work was supported by the Jiangsu Agricultural Science and Technology Innovation Fund (CX(22)2004), National Natural Science Foundation of China (32300431), Important Agricultural Science and Technology Project (NK022060603), Jiangsu Key Project for the Research and Development (BE2022346), and by the Project Funded by the Priority Academic Program Development of Jiangsu Higher Education Institutions (PAPD).

Data Availability Statement

The data presented in this study are available on reasonable request from the corresponding author.

Acknowledgments

The authors would like to thank Shengbao Xu (Northwest A&F University) for kindly providing the materials for population 2.

Conflicts of Interest

The authors declare no conflicts of interest.

References

  1. Zhang, Q.; Men, X.; Hui, C.; Ge, F.; Ouyang, F. Wheat Yield Losses from Pests and Pathogens in China. Agr. Ecosyst. Environ. 2022, 326, 107821. [Google Scholar] [CrossRef]
  2. Schroeder, H.W.; Christensen, J.J.; Christensen, J.D.; Platz-Christensen, J.; Schroeder, H.W.J.P. Factors Affecting Resistance of Wheat to Scab Caused by Gibberella zeae. Phytopathology 1963, 53, 831–838. [Google Scholar]
  3. Mesterhazy, A. Types and Components of Resistance to Fusarium Head Blight of Wheat. Plant Breed. 1995, 114, 377–386. [Google Scholar] [CrossRef]
  4. Mesterhazy, A. Updating the Breeding Philosophy of Wheat to Fusarium Head Blight (FHB): Resistance Components, QTL Identification, and Phenotyping—A Review. Plants 2020, 9, 1702. [Google Scholar] [CrossRef] [PubMed]
  5. Gong, X.; He, X.; Zhang, Y.; Li, L.; Sun, Z.; Bai, G.; Singh, P.K.; Li, T. Development of an Evaluation System for Fusarium Resistance in Wheat Grains and Its Application in Assessment of the Corresponding Effects of Fhb1. Plant Dis. 2020, 104, 2210–2216. [Google Scholar] [CrossRef] [PubMed]
  6. Windels, C.E. Economic and Social Impacts of Fusarium Head Blight: Changing Farms and Rural Communities in the Northern Great Plains. Phytopathology 2000, 90, 17–21. [Google Scholar] [CrossRef] [PubMed]
  7. Bai, G.; Shaner, G. Management and Resistance in Wheat and Barley to Fusarium Head Blight. Annu. Rev. Phytopathol. 2004, 42, 135–161. [Google Scholar] [CrossRef] [PubMed]
  8. Zheng, T.; Hua, C.; Li, L.; Sun, Z.; Yuan, M.; Bai, G.; Humphreys, G.; Li, T. Integration of Meta-QTL Discovery with Omics: Towards a Molecular Breeding Platform for Improving Wheat Resistance to Fusarium Head Blight. Crop J. 2020, 9, 739–749. [Google Scholar] [CrossRef]
  9. Cai, J.; Wang, S.; Su, Z.; Li, T.; Zhang, X.; Bai, G. Meta-analysis of QTL for Fusarium Head Blight Resistance in Chinese Wheat Landraces. Crop J. 2019, 7, 784–798. [Google Scholar] [CrossRef]
  10. Liu, S.; Zhang, X.; Pumphrey, M.O.; Stack, R.W.; Gill, B.S.; Anderson, J.A. Complex Microcolinearity among Wheat, Rice, and Barley Revealed by Fine Mapping of the Genomic Region Harboring a Major QTL for Resistance to Fusarium Head Blight in Wheat. Funct. Integr. Genom. 2006, 6, 83–89. [Google Scholar] [CrossRef]
  11. Schweiger, W.; Steiner, B.; Vautrin, S.; Nussbaumer, T.; Siegwart, G.; Zamini, M.; Jungreithmeier, F.; Gratl, V.; Lemmens, M.; Mayer, K.F.; et al. Suppressed Recombination and Unique Candidate Genes in the Divergent Haplotype Encoding Fhb1, a Major Fusarium Head Blight Resistance Locus in Wheat. Theor. Appl. Genet. 2016, 129, 1607–1623. [Google Scholar] [CrossRef] [PubMed]
  12. Waldron, B.L.; Moreno-Sevilla, B.; Anderson, J.A.; Stack, R.W.; Frohberg, R.C. RFLP Mapping of QTL for Fusarium Head Blight Resistance in Wheat. Crop. Sci. 1999, 39, 805–811. [Google Scholar] [CrossRef]
  13. Su, Z.; Bernardo, A.; Tian, B.; Chen, H.; Wang, S.; Ma, H.; Cai, S.; Liu, D.; Zhang, D.; Li, T.; et al. A Deletion Mutation in TaHRC Confers Fhb1 Resistance to Fusarium Head Blight in Wheat. Nat. Genet. 2019, 51, 1099–1105. [Google Scholar] [CrossRef]
  14. Li, G.; Zhou, J.; Jia, H.; Gao, Z.; Fan, M.; Luo, Y.; Zhao, P.; Xue, S.; Li, N.; Yuan, Y.; et al. Mutation of a Histidine-Rich Calcium-Binding-Protein Gene in Wheat Confers Resistance to Fusarium Head Blight. Nat. Genet. 2019, 51, 1106–1112. [Google Scholar] [CrossRef] [PubMed]
  15. Rawat, N.; Pumphrey, M.O.; Liu, S.; Zhang, X.; Tiwari, V.K.; Ando, K.; Trick, H.N.; Bockus, W.W.; Akhunov, E.; Anderson, J.A.; et al. Wheat Fhb1 Encodes a Chimeric Lectin with Agglutinin Domains and a Pore-Forming Toxin-Like Domain Conferring Resistance to Fusarium Head Blight. Nat. Genet. 2016, 48, 1576–1580. [Google Scholar] [CrossRef] [PubMed]
  16. Islam, M.S.; Brown-Guedira, G.; Van Sanford, D.; Ohm, H.; Dong, Y.; McKendry, A.L. Novel QTL Associated with the Fusarium Head Blight Resistance in Truman Soft Red Winter Wheat. Euphytica 2015, 207, 571–592. [Google Scholar] [CrossRef]
  17. Zhang, X.; Pan, H.; Bai, G. Quantitative Trait Loci Responsible for Fusarium Head Blight Resistance in Chinese Landrace Baishanyuehuang. Theor. Appl. Genet. 2012, 125, 495–502. [Google Scholar] [CrossRef] [PubMed]
  18. Zhou, W.; Kolb, F.L.; Yu, J.; Bai, G.; Boze, L.K.; Domier, L.L. Molecular Characterization of Fusarium Head Blight Resistance in Wangshuibai with Simple Sequence Repeat and Amplified Fragment Length Polymorphism Markers. Genome 2004, 47, 1137–1143. [Google Scholar] [CrossRef] [PubMed]
  19. Liu, S.; Griffey, C.A.; Hall, M.D.; McKendry, A.L.; Chen, J.; Brooks, W.S.; Brown-Guedira, G.; Van Sanford, D.; Schmale, D.G. Molecular Characterization of Field Resistance to Fusarium Head Blight in Two US Soft Red Winter Wheat Cultivars. Theor. Appl. Genet. 2013, 126, 2485–2498. [Google Scholar] [CrossRef] [PubMed]
  20. Paillard, S.; Schnurbusch, T.; Tiwari, R.; Messmer, M.; Winzeler, M.; Keller, B.; Schachermayr, G. QTL Analysis of Resistance to Fusarium Head Blight in Swiss Winter Wheat (Triticum aestivum L.). Theor. Appl. Genet. 2004, 109, 323–332. [Google Scholar] [CrossRef] [PubMed]
  21. Holzapfel, J.; Voss, H.H.; Miedaner, T.; Korzun, V.; Haberle, J.; Schweizer, G.; Mohler, V.; Zimmermann, G.; Hartl, L. Inheritance of Resistance to Fusarium Head Blight in Three European Winter Wheat Populations. Theor. Appl. Genet. 2008, 117, 1119–1128. [Google Scholar] [CrossRef] [PubMed]
  22. Yu, J.B.; Bai, G.H.; Zhou, W.C.; Dong, Y.H.; Kolb, F.L. Quantitative Trait Loci for Fusarium Head Blight Resistance in a Recombinant Inbred Population of Wangshuibai/Wheaton. Phytopathology 2008, 98, 87–94. [Google Scholar] [CrossRef] [PubMed]
  23. Li, T.; Zhang, H.; Huang, Y.; Su, Z.; Deng, Y.; Liu, H.; Mai, C.; Yu, G.; Li, H.; Yu, L.; et al. Effects of the Fhb1 Gene on Fusarium Head Blight Resistance and Agronomic Traits of Winter Wheat. Crop J. 2019, 7, 799–808. [Google Scholar] [CrossRef]
  24. Li, G.; Yuan, Y.; Zhou, J.; Cheng, R.; Chen, R.; Luo, X.; Shi, J.; Wang, H.; Xu, B.; Duan, Y.; et al. FHB Resistance Conferred by Fhb1 is under Inhibitory Regulation of Two Genetic Loci in Wheat (Triticum aestivum L.). Theor. Appl. Genet. 2023, 136, 134. [Google Scholar] [CrossRef] [PubMed]
  25. Korte, A.; Farlow, A. The Advantages and Limitations of Trait Analysis with GWAS: A Review. Plant Methods 2013, 9, 29. [Google Scholar] [CrossRef] [PubMed]
  26. Gaire, R.; Brown-Guedira, G.; Dong, Y.; Ohm, H.; Mohammadi, M. Genome-Wide Association Studies for Fusarium Head Blight Resistance and Its Trade-Off with Grain Yield in Soft Red Winter Wheat. Plant Dis. 2021, 105, 2435–2444. [Google Scholar] [CrossRef] [PubMed]
  27. Arruda, M.P.; Brown, P.; Brown-Guedira, G.; Krill, A.M.; Thurber, C.; Merrill, K.R.; Foresman, B.J.; Kolb, F.L. Genome-Wide Association Mapping of Fusarium Head Blight Resistance in Wheat Using Genotyping-by-Sequencing. Plant Genome 2016, 9. [Google Scholar] [CrossRef] [PubMed]
  28. Tessmann, E.W.; Dong, Y.; Van Sanford, D.A. GWAS for Fusarium Head Blight Traits in a Soft Red Winter Wheat Mapping Panel. Crop Sci. 2019, 59, 1823–1837. [Google Scholar] [CrossRef]
  29. Bai, G.; Kolb, F.L.; Shaner, G.; Domier, L.L. Amplified Fragment Length Polymorphism Markers Linked to a Major Quantitative Trait Locus Controlling Scab Resistance in Wheat. Phytopathology 1999, 89, 343–348. [Google Scholar] [CrossRef] [PubMed]
  30. Saghai-Maroof, M.A.; Soliman, K.M.; Jorgensen, R.A.; Allard, R.W. Ribosomal DNA Spacer-length Polymorphisms in Barley: Mendelian Inheritance, Chromosomal Location, and Population Dynamics. Proc. Natl. Acad. Sci. USA 1984, 81, 8014–8018. [Google Scholar] [CrossRef]
  31. McKenna, A.; Hanna, M.; Banks, E.; Sivachenko, A.; Cibulskis, K.; Kernytsky, A.; Garimella, K.; Altshuler, D.; Gabriel, S.; Daly, M.; et al. The Genome Analysis Toolkit: A MapReduce Framework for Analyzing Next-Generation DNA Sequencing Data. Genome Res. 2010, 20, 1297–1303. [Google Scholar] [CrossRef] [PubMed]
  32. Lipka, A.E.; Tian, F.; Wang, Q.; Peiffer, J.; Li, M.; Bradbury, P.J.; Gore, M.A.; Buckler, E.S.; Zhang, Z. GAPIT: Genome Association and Prediction Integrated Tool. Bioinformatics 2012, 28, 2397–2399. [Google Scholar] [CrossRef] [PubMed]
  33. Li, L.; Liu, J.; Xue, X.; Li, C.; Yang, Z.; Li, T. CAPS/dCAPS Designer: A Web-Based High-Throughput dCAPS Marker Design Tool. Sci. China. Life. Sci. 2018, 61, 992–995. [Google Scholar] [CrossRef] [PubMed]
  34. Cardon, L.R.; Palmer, L.J. Population Stratification and Spurious Allelic Association. Lancet 2003, 361, 598–604. [Google Scholar] [CrossRef] [PubMed]
  35. He, X.; Dreisigacker, S.; Singh, R.P.; Singh, P.K. Genetics for Low Correlation Between Fusarium Head Blight Disease and Deoxynivalenol (DON) Content in a Bread Wheat Mapping Population. Theor. Appl. Genet. 2019, 132, 2401–2411. [Google Scholar] [CrossRef]
  36. Ágnes, S.H.; Szabolcs, L.K.; Mónika, V.; László, P.; János, P.; Csaba, L.; Ákos, M. Differential Influence of QTL Linked to Fusarium Head Blight, Fusarium-Damaged Kernel, Deoxynivalenol Contents and Associated Morphological Traits in a Frontana-Derived Wheat Population. Euphytica 2014, 200, 9–26. [Google Scholar] [CrossRef]
  37. Basnet, B.R.; Glover, K.D.; Ibrahim, A.M.H.; Yen, Y.; Chao, S. A QTL on Chromosome 2DS of ‘Sumai 3’ Increases Susceptibility to Fusarium Head Blight in Wheat. Euphytica 2011, 186, 91–101. [Google Scholar] [CrossRef]
  38. Ghavami, F.; Elias, E.M.; Mamidi, S.; Ansari, O.; Sargolzaei, M.; Adhikari, T.; Mergoum, M.; Kianian, S.F. Mixed Model Association Mapping for Fusarium Head Blight Resistance in Tunisian-Derived Durum Wheat Populations. G3 2011, 1, 209–218. [Google Scholar] [CrossRef] [PubMed]
  39. Clark, A.J.; Sarti-Dvorjak, D.; Brown-Guedira, G.; Dong, Y.; Baik, B.K.; Van Sanford, D.A. Identifying Rare FHB-Resistant Segregants in Intransigent Backcross and F2 Winter Wheat Populations. Front. Microbiol. 2016, 7, 277. [Google Scholar] [CrossRef] [PubMed]
Figure 1. Structure and variation of the FHB severity of population 1. (A) Source and number of wheat varieties collected. (B) Geographic distribution of Chinese wheat varieties. (CF) Phenotypic distributions of the PSS (percentages of symptomatic spikelets) in three years, 2021, 2022 and 2023, and the BLUP (best linear unbiased predictions) value over the three years.
Agronomy 14 01230 g001
Figure 2. Significant markers for type II resistance to FHB. (AC) Manhattan plot (left) and quantile–quantile (QQ) plot (right) of type II resistance in the year 2021, 2022 and 2023, respectively. (D) Manhattan and QQ plots of type II resistance to FHB for the BLUP values. The gray line in the Manhattan plot indicates the threshold −log10(p) value of 3.0. The markers above the lines were considered to be significantly associated with type II resistance. The red box includes SNPs that were repeated across the three years and for the BLUP value. “P1” represents population 1.
Agronomy 14 01230 g002
Figure 3. Qfhb.yzu.3B.1 and Qfhb.yzu.6B.3 were validated in population 2. (AC) Manhattan plot (left) and quantile-quantile (QQ) plot (right) of type II resistance in the year 2021, 2022 and 2023, respectively. (D) Manhattan and QQ plots of type II resistance to FHB for the BLUP values. The gray line in the Manhattan plot indicates the threshold −log10(p) value of 3.0. The markers above the lines were considered to be significantly associated with type II resistance The red box includes significant SNPs for Qfhb.yzu.3B.1 and Qfhb.yzu.6B.3. “P2” represents population 2.
Agronomy 14 01230 g003
Figure 4. Haplotypes for Qfhb.yzu.3B.1 and Qfhb.yzu.6B.3. (A) Linkage disequilibrium (LD) of SNPs in the Qfhb.yzu.3B.1 region. Markers within the red box represents tag SNPs. (B) Haplotypes (Hap) for the variants of the marker allele at AX-109890650 and AX-109387464. (C) Boxplots of the PSSs based on the haplotypes. (D) LD of SNPs in the Qfhb.yzu.6B.3 region. Markers within the red box represent tag SNPs. (E) Haplotypes (Hap) for the allelic variation at the markers AX-108856152 and AX-111041754. (F) Boxplots of the PSSs based on the haplotypes. n, the number of varieties carrying Hap1 or Hap2. The number in the red diamond represents the R-squared value of the LD. The red diamond without a number is a D’ value of 100% in LD heatmap. A significant difference between two haplotypes was determined using Student’s t test (*** p < 0.001).
Agronomy 14 01230 g004
Figure 5. Pyramiding the favorable alleles at Qfhb.yzu.3B.1, Qfhb.yzu.6B.3 and Fhb1 improved the FHB resistance. (A) Effects of different haplotypic combinations of Qfhb.yzu.3B.1, Qfhb.yzu.6B.3 and Fhb1, where 3B.1 is the abbreviation for Qfhb.yzu.3B.1; 6B.3 is the abbreviation for Qfhb.yzu.6B.3; a superscript “R” means a resistant haplotype; a superscript “S” means a susceptible haplotype; Fhb1R represents the resistant haplotype of TaHRC; and Fhb1S represents the susceptible haplotype of TaHRC. (B) The varieties carrying different haplotypic combinations at Qfhb.yzu.3B.1, Qfhb.yzu.6B.3 and Fhb1. Av. PSS, average PSS over three years, and different letters indicate significant differences based on the ANOVA analysis under Tukey’s multiple test (p < 0.05). (C) dCAPS markers for Qfhb.yzu.3B.1, Qfhb.yzu.6B.3 and Fhb1, where 3B650 represents the dCAPS marker for AX-109890650 at Qfhb.yzu.3B.1; 6B754 represents the dCAPS marker for AX-111041754 at Qfhb.yzu.6B.3; TaHRC, the genic marker for Fhb1.
Agronomy 14 01230 g005
Table 1. QTL for FHB resistance in natural population 1.
QTLMarkerChr.Pos.
(Mb)
−LOG10(P)Effect (%)Meta-QTL
202120222023BLUP202120222023BLUP
Qfhb.yzu.1A.1AX-1109717551A49.57 3.49 3.95 4.13 9.36 12.91 9.73 No
AX-1110733291A49.62 3.48 3.84 4.07 9.20 12.51 9.46
AX-1087258291A49.90 3.49 3.95 4.13 9.36 12.91 9.73
AX-1088350101A49.96 3.59 3.71 3.73 9.94 13.02 9.50
AX-1116748221A50.29 3.35 3.88 3.98 9.41 13.16 9.78
AX-1104645701A51.68 3.50 4.67 4.69 10.28 15.67 11.52
AX-1109602341A51.96 3.12 4.36 4.40 9.74 15.10 11.28
AX-1094339771A52.94 3.09 3.24 11.09 8.30
Qfhb.yzu.1A.2AX-1106704781A92.47 3.13 3.56 12.72 9.67 No
Qfhb.yzu.2B.1AX-1093691752B144.59 3.90 3.19 16.77 10.24 No
Qfhb.yzu.3A.1AX-1087575843A737.18 3.01 3.37 9.73 7.24 No
AX-1087309583A738.80 4.02 3.82 8.29 6.02
AX-1093187173A738.82 4.02 3.82 8.29 6.02
AX-1100218433A738.86 3.91 3.50 8.16 5.73
AX-1105812933A738.90 4.02 3.82 8.29 6.02
AX-1116538913A738.94 4.02 3.82 8.29 6.02
Qfhb.yzu.3B.1AX-1110694663B779.97 3.30 4.25 7.89 6.57 No
AX-109890650 *3B780.00 3.22 3.49 4.28 5.18 7.53 6.19 8.95 7.25
AX-109387464 *3B780.05 3.37 3.39 4.16 5.24 8.07 6.33 9.13 7.61
AX-1115652893B780.81 4.64 3.48 4.55 10.45 8.30 7.23
Qfhb.yzu.4A.1AX-1114793074A621.78 3.13 3.03 6.48 5.97 No
Qfhb.yzu.4B.1AX-1087813904B661.68 3.64 3.34 14.99 13.22 No
Qfhb.yzu.4D.1AX-1119213004D469.76 4.08 3.17 13.80 8.75 No
Qfhb.yzu.5A.1AX-1115355205A576.10 3.20 3.39 12.44 9.09 No
Qfhb.yzu.5B.1AX-1105774745B379.72 3.46 3.00 13.79 9.42 No
Qfhb.yzu.5B.2AX-1100770805B611.68 3.88 3.62 16.34 10.98 Yes
Qfhb.yzu.5D.1AX-1106390625D495.06 3.94 3.89 32.85 23.05 No
AX-1114813795D495.06 3.94 3.89 16.42 11.53
Qfhb.yzu.6A.1AX-1115073916A10.50 3.48 4.80 4.74 25.01 23.87 21.73 Yes
AX-1093331556A11.59 3.73 4.03 4.71 14.17 11.13 11.46
AX-1109423996A11.87 3.91 3.53 4.63 14.45 10.26 11.32
Qfhb.yzu.6A.2AX-1109859516A447.42 3.37 3.16 10.92 9.93 Yes
AX-1106865726A447.56 3.51 3.28 11.06 10.02
AX-1099837526A447.60 3.37 3.16 10.92 9.93
AX-1089466836A447.62 3.20 3.26 17.34 12.16
AX-1115394626A447.81 3.37 3.16 10.92 9.93
AX-1117017256A448.19 3.37 3.16 10.92 9.93
AX-1089562126A448.66 3.37 3.16 10.92 9.93
AX-1116954486A453.12 3.37 3.16 10.92 9.93
Qfhb.yzu.6A.3AX-1105324056A599.83 3.96 3.69 4.24 21.97 15.29 15.80 No
AX-1089448736A601.26 3.92 3.82 4.14 15.40 15.13 11.17
AX-897731916A601.26 3.87 3.79 4.10 15.17 14.86 11.00
AX-1114632776A601.48 3.56 3.63 14.37 10.25
Qfhb.yzu.6B.1AX-1088266736B491.96 3.87 3.15 10.63 8.80 No
Qfhb.yzu.6B.2AX-1104809336B559.36 3.10 3.92 3.64 9.28 8.49 7.52 Yes
AX-1093931296B559.46 3.15 3.17 8.33 7.90
AX-1098169266B560.98 3.39 4.18 4.24 11.19 9.43 8.93
Qfhb.yzu.6B.3AX-1094818286B654.80 3.12 3.02 3.94 19.21 24.36 20.52 Yes
AX-1092851816B654.95 3.12 3.02 3.94 19.21 24.36 20.52
AX-1095380606B655.06 3.37 3.15 3.92 12.55 12.01 9.79
AX-1088561526B655.86 3.23 3.41 4.26 10.22 13.66 11.22
AX-111041754 *6B656.16 3.15 3.45 3.51 4.90 13.91 13.09 16.97 14.72
AX-1088347616B656.19 3.33 3.80 18.68 14.05
Qfhb.yzu.6D.1AX-1113799596D25.03 3.37 4.04 4.24 12.49 10.24 9.92 No
Qfhb.yzu.6D.2AX-1099852146D465.51 3.94 3.39 17.06 10.60 No
Qfhb.yzu.7A.1AX-1105056447A79.74 3.29 3.66 15.05 11.29 No
Qfhb.yzu.7A.2AX-1094495657A117.27 5.79 3.12 4.90 19.33 10.11 12.32 Yes
Qfhb.yzu.7B.1AX-1099151967B725.37 3.13 3.13 11.43 8.23 Yes
BLUP, best linear unbiased predictions. The markers detected across three years are marked with “*”.
Disclaimer/Publisher’s Note: The statements, opinions and data contained in all publications are solely those of the individual author(s) and contributor(s) and not of MDPI and/or the editor(s). MDPI and/or the editor(s) disclaim responsibility for any injury to people or property resulting from any ideas, methods, instructions or products referred to in the content.

