Article

Effects of Waterlogging Stress on Root Growth and Soil Nutrient Loss of Winter Wheat at Seedling Stage

1
College of Hydraulic and Environmental Engineering, China Three Gorges University, Yichang 443000, China
2
Engineering Research Center of Eco-Environment in Three Gorges Reservoir Region, Ministry of Education, Yichang 443000, China
3
State Key Laboratory of Simulation and Regulation of Water Cycle in River Basin, China Institute of Water Resources and Hydropower Research, Beijing 100000, China
4
College of Environment, Liaoning University, Shenyang 110000, China
5
College of Water Resources and Hydropower, Hebei University of Engineering, Handan 056000, China
*
Author to whom correspondence should be addressed.
Agronomy 2024, 14(6), 1247; https://doi.org/10.3390/agronomy14061247
Submission received: 22 April 2024 / Revised: 29 May 2024 / Accepted: 4 June 2024 / Published: 8 June 2024
(This article belongs to the Special Issue Safe and Efficient Utilization of Water and Fertilizer in Crops)

Abstract

:
With global climate change, flooding events are becoming more frequent. However, the mechanism of how waterlogging stress affects crop roots needs to be studied in depth. Waterlogging stress can also lead to soil nitrogen and phosphorus loss, resulting in agricultural surface pollution. The aim of this study is to clarify the relationship between soil nitrogen and phosphorus distribution, root growth characteristics, and nitrogen and phosphorus loss in runoff water under waterlogging stress during the winter wheat seedling stage. In this paper, Zhengmai 136 was selected as the experimental material, and two water management methods (waterlogging treatment and non-waterlogging control treatment) were set up. Field experiments were conducted at the Wudaogou Hydrological Experimental Station in 2022 to assess the nitrogen and phosphorus concentrations in runoff water under waterlogging stress. The study also aimed to analyze the nitrogen and phosphorus content and the root distribution characteristics in different soil layers under waterlogging stress. The results showed as the following: 1. Waterlogging stress increased the characteristic parameters of winter wheat roots in both horizontal and vertical directions. Compared with the control treatment, the root length increased by 1.2–29.9% in the waterlogging treatment, while the root surface area and volume increased by an average of 3.1% and 41.9%, respectively. 2. Nitrogen and phosphorus contents in waterlogged soils were enriched in the 0–20 cm soil layer, but both tended to decrease in the 20–60 cm soil layer. Additionally, there was an inverse relationship between the distribution of soil nutrients and the distribution of wheat roots. 3. During the seedling stage of winter wheat, nitrogen loss was the main factor in the runoff water. In addition, nitrate nitrogen concentration averaged 55.2% of the total nitrogen concentration, while soluble phosphorus concentration averaged 79.1% of the total phosphorus concentration. 4. The results of redundancy analysis demonstrated that available phosphorus in the soil was the key environmental factor affecting the water quality of runoff water. Total phosphorus and dissolved phosphorus in the water were identified as the dominant factors influencing root growth.

1. Introduction

Over the past few decades, the number of flooding events on agricultural land has increased globally due to intense climate change and the frequency of unpredictable rainfall events [1]. Waterlogging disasters are significant limiting factors that affect wheat yield worldwide [2]. According to statistics, about two-thirds of China’s land is affected by varying degrees of waterlogging [3]. In the Huaihe River Basin alone, there is an average annual area of 1.85 million hectares of waterlogged-prone farmland, leading to a decrease in winter wheat production by approximately 10%. In years with more severe waterlogging, the winter wheat production loss exceeds 20% [4]. Waterlogging disasters not only severely impact the growth and productivity of crops but also affect the soil and water environment of farmland [5]. The impact of waterlogging stress on plants is attributed to the low-oxygen environment created by waterlogging, which hinders the aerobic respiration of plant roots. This leads to a reduction in metabolic capacity, resulting in a significant decrease in root growth, weakening the absorption capacity, and affecting the uptake of nutrients by plants (Figure 1). Waterlogging stress also triggers the generation of signaling molecules in the plant that activate or modulate the signaling pathways associated with it, ultimately influencing physiological responses and adaptations in the plant [6]. It creates a hypoxic environment in the soil [5]. It also reduces the soil redox potential, alters the pH and mineralization rate, and affects the efficiency of soil nitrogen and phosphorus. Furthermore, it raises the likelihood of nitrogen loss through increased denitrification and soil leaching [7]. Additionally, it enhances the solubility of phosphorus, leading to higher crop uptake and mineral leaching [8].
Waterlogging issues are closely associated with the temporal and geographical properties of precipitation. When precipitation exceeds the water requirement of wheat due to uneven distribution in both area and time, it can lead to field waterlogging and nutrient loss in the soil and water [9]. De-Campos et al. [10] conducted short-term waterlogging stress experiments on soils over a period of 14 days. They found that redox-sensitive substances (e.g., NO3, Fe, and Mn) that can be stabilized under aerobic conditions are susceptible to reduction reactions during waterlogging stress and are released from the soil into the water. When Sánchez et al. [11] exposed a 1 kg weight of sandy clay soil to a prolonged waterlogging stress scenario for two months, they observed that the plants increased the rate of phosphorus release, resulting in a loss of 1.3 mg of phosphorus per mesocosm. The losses of Fe, NH4+, and DON were measured at 15 mg, 16 mg, and 28 mg per mesoscale, respectively. In the Taihu Lake Basin, Xu et al. [12] conducted multi-site field studies at different fertility stages of rice and discovered that the peak of pollution loading from the runoff occurred during the seedling stage. The characteristics of nutrient loss from wheat fields with surface runoff under varying rainfall intensities were investigated by Yan et al. [13]. The findings indicated that the main factors contributing to nitrogen and phosphorus loss were nitrate nitrogen and particulate phosphorus. The nutrient concentration peaked in the early stage of runoff, while the nutrient loss rate was highest during the middle and late stages of runoff. From a plant physiological perspective, much of the damage to crops caused by waterlogging can be attributed to restricted aerobic respiration in the root system, increased root and leaf senescence [14], and nutrient loss [15], which in turn inhibit crop growth and reduce grain yield [16]. Feng et al. found specific morphological and physiological adaptations in wheat following waterlogging stress, such as the development of aerated tissues and adventitious root growth [17]. Mendoza et al. found that waterlogging stress significantly reduced the root biomass of Lotus corniculatus at the seedling stage but increased the effective nitrogen and phosphorus content in the soil, thereby enhancing the nutrient supply to the waterlogged crops [18]. Crops can compensate for growth by absorbing more nitrogen or phosphorus [19]. According to Jiang et al. [20], waterlogging stress during winter wheat growth would lower root activity, making it harder for roots to absorb nutrients, decreasing the amount of dry matter accumulated in the wheat, altering the ratio of dry matter transported and distributed to different organs, and ultimately lowering wheat yield. Zhou Sumei et al. [21] demonstrated that waterlogging significantly increased the number of secondary roots of winter wheat at the seedling stage. In contrast, Ghobadi et al. [22] subjected various types of wheat to seedling waterlogging stress and discovered that the root growth of winter wheat was significantly inhibited by this stress.
The main wheat variety in the Huaibei Plain, Zhengmai 136, which possesses high yield, disease resistance, and lodging resistance, was selected as the test material. We implemented waterlogging treatment during the seedling stage of winter wheat. From an agroecological perspective, the major objectives of the present study were to focus on the following aspects: (1) the changes and distribution characteristics of roots of winter wheat under waterlogging stress, (2) the changes in nitrogen and phosphorus content in different soil layers under waterlogging stress, and (3) the loss of nitrogen and phosphorus in runoff water under waterlogging stress. The study aims to investigate the dynamic relationship between nitrogen and phosphorus transport in the root–soil–water system of farmland under waterlogging stress. The results of this study are not only important for targeted nutrient mitigation strategies but also helpful in understanding the response and adaptation strategies of winter wheat to waterlogging stress in the Huaibei Plain. They provide a theoretical basis for mitigating nutrient loss and enhancing ecosystem stability in the region.

2. Materials and Methods

2.1. Overview of the Experimental Area

The experiment was conducted at the Wudaogou Hydrological Experimental Station (117°21′ E, 33°09′ N) in Xinmaqiao Town, Bengbu City, Anhui Province, from 2022 to 2023. The average annual precipitation at the station from 1963 to 2022 was 930 mm [8], and the maximum rainfall intensity was about 100 mm/h. During the waterlogging period of the winter wheat seedling stage, the average temperature was 13.7 °C, and the relative humidity was 89.1%. The soil type in the test area is lime concretion black soil developed from calcareous sediments of river and lake facies. The profile configuration consists of a black soil layer, a detached layer, and a lime concretion layer. It belongs to metamorphic soil in the soil classification system formulated by the Food and Agriculture Organization (FAO) of the United Nations. The soil texture is mainly silty loam, with poor air permeability and a tendency to harden easily [23]. Before seeding, deep plowing, rotary tillage, and fertilization were performed. Table 1 displays the basic fertility of the soil layers. Within the test area, there are eight distinct experimental zones, each measuring 5.3 m × 3.8 m. The winter wheat variety selected for testing was Zhengmai 136, planted in rows with a spacing of approximately 25 cm between each row. Compound fertilizer (N-P2O5-K2O = 24:15:6) and urea (N ≥ 46.0%) were applied as basal fertilizer in a single application within each field at rates of 750 kg/hm2 and 150 kg/hm2, respectively.

2.2. Configuration of Experimental Facilities

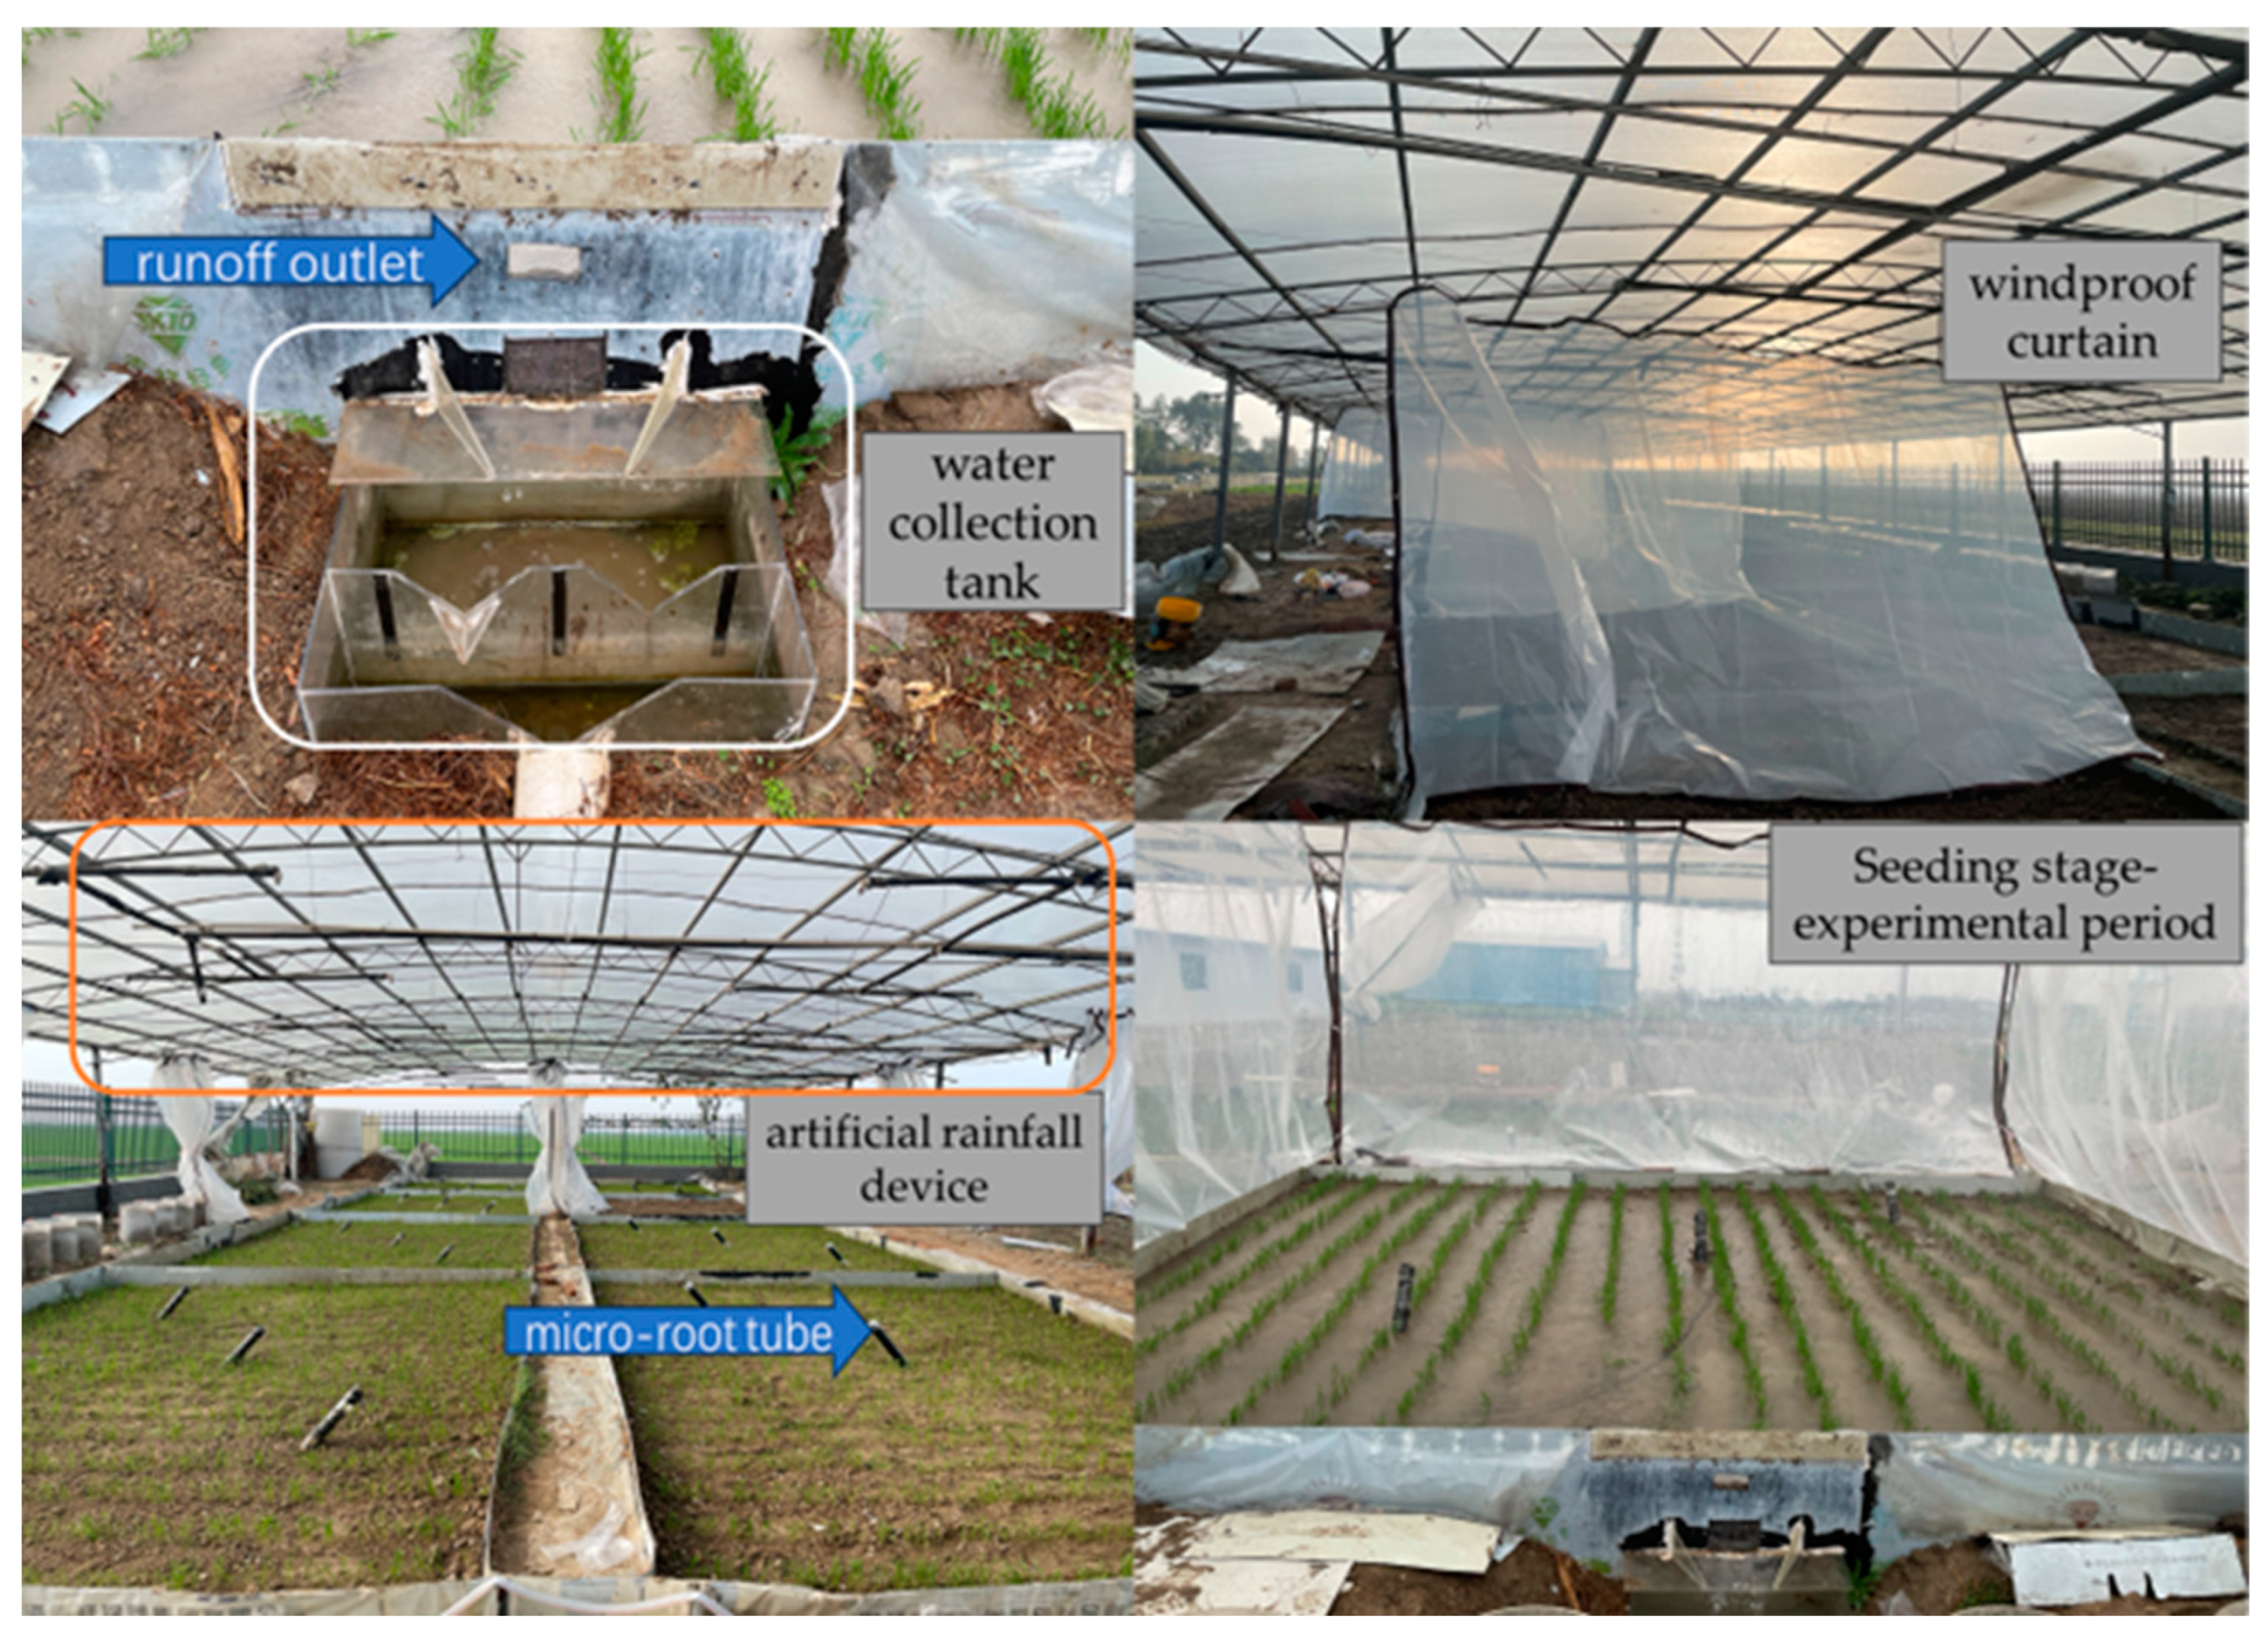
The experimental area comprises an artificial rainfall device, windproof curtain, waterproof baffle, water collection tank, and micro-root tube. (Figure 2) The artificial rainfall device is located at the top of the plot, 4 m high, in an I-shaped arrangement. The windproof curtain is made of transparent polyethylene rain cloth and is hung around the community. Around the trial area, a waterproof baffle is vertically inserted with an aluminum-plastic plate at a depth of 1 m. The water collection tank was a plexiglass tank measuring 0.6 m × 0.45 m × 0.3 m, and samples of runoff water were collected using a triangular weir [24]. The micro-root tube is installed at a 45° angle with the ground, with a tube length of 1m and approximately 40 cm exposed above the ground. The installation positions are successively placed at 0 cm, 5 cm, and 10 cm from the wheat row.

2.3. Experimental Plan Design

Artificial rainfall was used to simulate waterlogging during the seedling stage of winter wheat on the 12th day after sowing (BBCH 13). Two water management systems were set up: a waterlogged treatment (WT; Figure 3, A1 field) and a control treatment without waterlogging (CK; Figure 3, B4 field). It is possible to ensure at least three replications of the experimental data (soil nitrogen and phosphorus content, nitrogen and phosphorus concentration in runoff water, and root characterization parameters). The simulated rainfall intensity was set to 40 mm/h to replicate the conditions of a thunderstorm in the Huaihe River Basin. According to the “Agricultural Meteorological Observation Specification for Winter Wheat”, [25] the depth of waterlogging during waterlogging stress in the reproductive period of winter wheat was determined to be 5 cm, for 3 days.

2.4. Test Sample Collection

On the waterproof baffle in the field, a water outlet was opened 5 cm above the ground. From the beginning of runoff to the stable generation of runoff, water samples were collected every 30 min using sterile sampling bottles. After the runoff stabilized, water samples were collected at 8:00 every morning and evening, with 200 mL of water samples collected each time. A total of 10 bottles of runoff water samples were collected to determine the levels of total nitrogen, total phosphorus, nitrate nitrogen, ammonia nitrogen, and dissolved phosphorus in the water. Total nitrogen, total phosphorus, and dissolved phosphorus in water were determined using an ultraviolet–visible spectrophotometer (UV-2700i, Shimadzu, Kyoto, Japan). Determination of total nitrogen in water was performed using the alkaline potassium persulfate–ultraviolet spectrophotometric method. Determination of total phosphorus in water was carried out by using the potassium persulfate digestion–ammonium molybdate spectrophotometric method. Using a 0.45 μm filter membrane for filtration, potassium persulfate digestion, and ammonium molybdate spectrophotometry, the concentration of dissolved phosphorus in the water was determined. Water nitrate nitrogen and water ammonia nitrogen were measured using a flow injection analyzer (iFIA7, Beijing Jitian Instrument Co., Ltd., Beijing, China) after being filtered through a 0.45 μm filter membrane.
The physical and chemical characteristics of the soil reached a steady state on the fifth day after the waterlogging stress was relieved [26]. Composite sampling was conducted using a soil drill based on depth, employing the five-point method in the 0–20 cm soil layer of the arable layer, the 20–40 cm layer of the black soil layer, and the 40–60 cm soil layer of the sand-ginger layer. Soils at the same depth were combined, purified, air-dried, and stored for analyzing soil organic matter, total nitrogen, total phosphorus content, and other indicators. Determination of total and alkaline nitrogen content in soil was carried out by using the Kjeldahl Nitrogen Determination Instrument (KDY-9820, Beijing Tongrunyuan Electromechanical Technology Co., Ltd., Beijing, China) with the semi-micro Kjeldahl method (NY/T 1121.24-2012) and the alkaline dissolved diffusion method (LY/T 1228-2015), respectively. Organic matter content was determined using the external heating method with potassium dichromate. Soil total phosphorus and available phosphorus were determined using an ultraviolet–visible spectrophotometer (UV-2700i, Shimadzu, Japan). The detection methods employed were the acid dissolution–molybdenum antimony colorimetric method for total phosphorus and the sodium bicarbonate leaching molybdenum blue colorimetric method for available phosphorus.
The root data acquisition and soil sample collection for winter wheat were conducted on the same day. Additionally, the initial observation and data collection time for different treatments were also on the same day. The AZR-200 Root Ecological Observation System (Beijing Aozuo Ecological Instrument Co., Ltd., Beijing, China) was used to observe the root characteristics of the control treatment and the waterlogging treatment. During the measurement, the camera was inserted into the embedded micro-root tube, and a set of images was captured every 10 cm. Eight pictures were taken at the same depth with a rotation angle of 45°, and the measurement depth was 60 cm (Figure 4). The root image was analyzed and processed using WinRHIZOTron (2020b) software to extract root morphological parameters, including root length (RL), root volume (RV), and root surface area (RS).

2.5. Data Processing and Analysis

The results of the experimental data are presented as average values. All data were subjected to the Kolmogorov–Smirnov (K-S) test, and those with a p-value < 0.05 were logarithmically transformed to base 10 to normalize the data distribution. One-way ANOVA was used to compare the differences in nitrogen and phosphorus contents among various soil layers. Relationships among the variables for root morphology, soil nitrogen, soil phosphorus, and runoff water quality were assessed using Pearson’s correlation analysis. Redundancy analysis was conducted using CANOCO 5 software. The RDA method was used to analyze the primary soil factors influencing nitrogen and phosphorus levels in runoff waters, as well as the key water factors affecting root morphology growth. For the graphs or figures, Excel 2019 and Origin 2021 were used.

3. Results

3.1. The Distribution Law of Winter Wheat Seedling Roots in Different Soil Layers

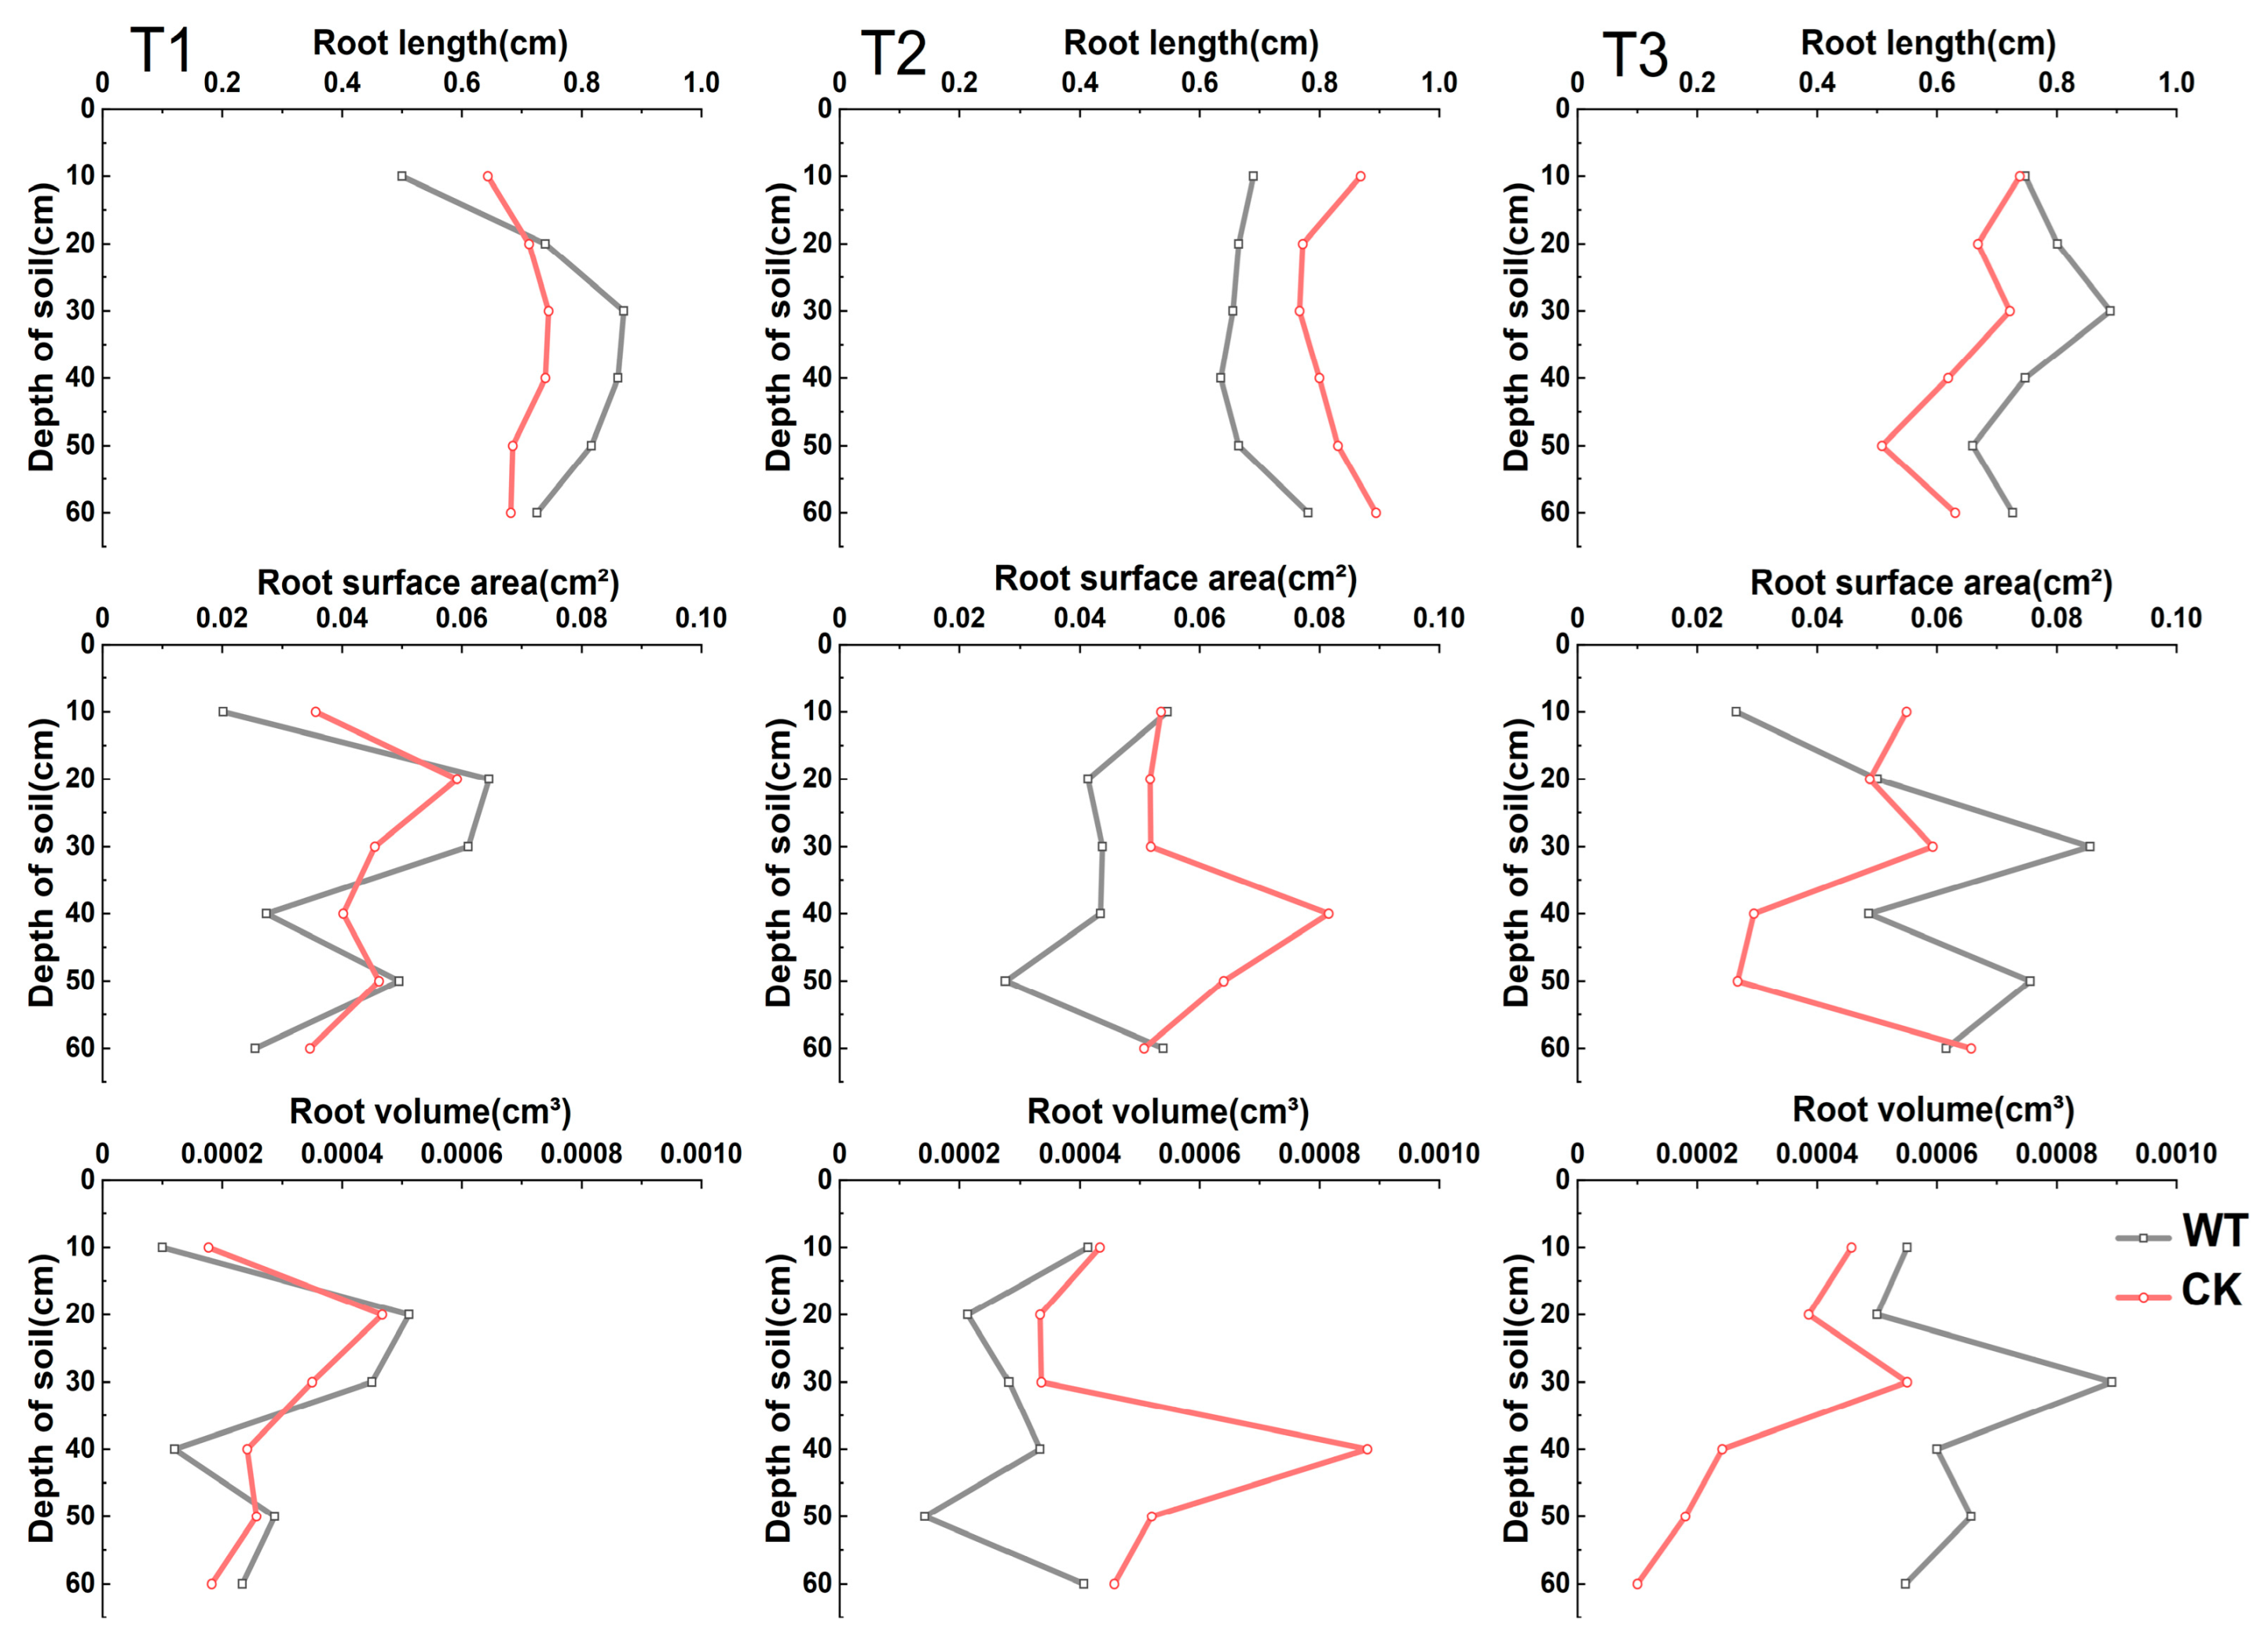
From a vertical perspective, the root distribution in the waterlogged treatment (A1 field) was primarily concentrated in the 10–30 cm soil layer. There was a significant variation in root morphology, with the maximum and minimum values of root morphology parameters co-existing in the 10–30 cm soil layer. In contrast, the root distribution in the control treatment (B4 field) was mainly in the 30–40 cm soil layer. Horizontally, in terms of root volume, at 0 cm row spacing, the root volume of flooded winter wheat was similar to that of the control treatment. At a 5 cm row spacing, the root volume of all layers of flooded winter wheat was significantly smaller than that of the control, with parameter values ranging from 27.3% to 95.4% of the root volume of the control treatment. At a 10 cm row spacing, the root volume of flooded winter wheat was significantly larger than that of the control, with parameter values ranging from 1.2 to 5.4 times (Figure 5).

3.2. Variation Characteristics of Nitrogen and Phosphorus Content in Different Soil Layers

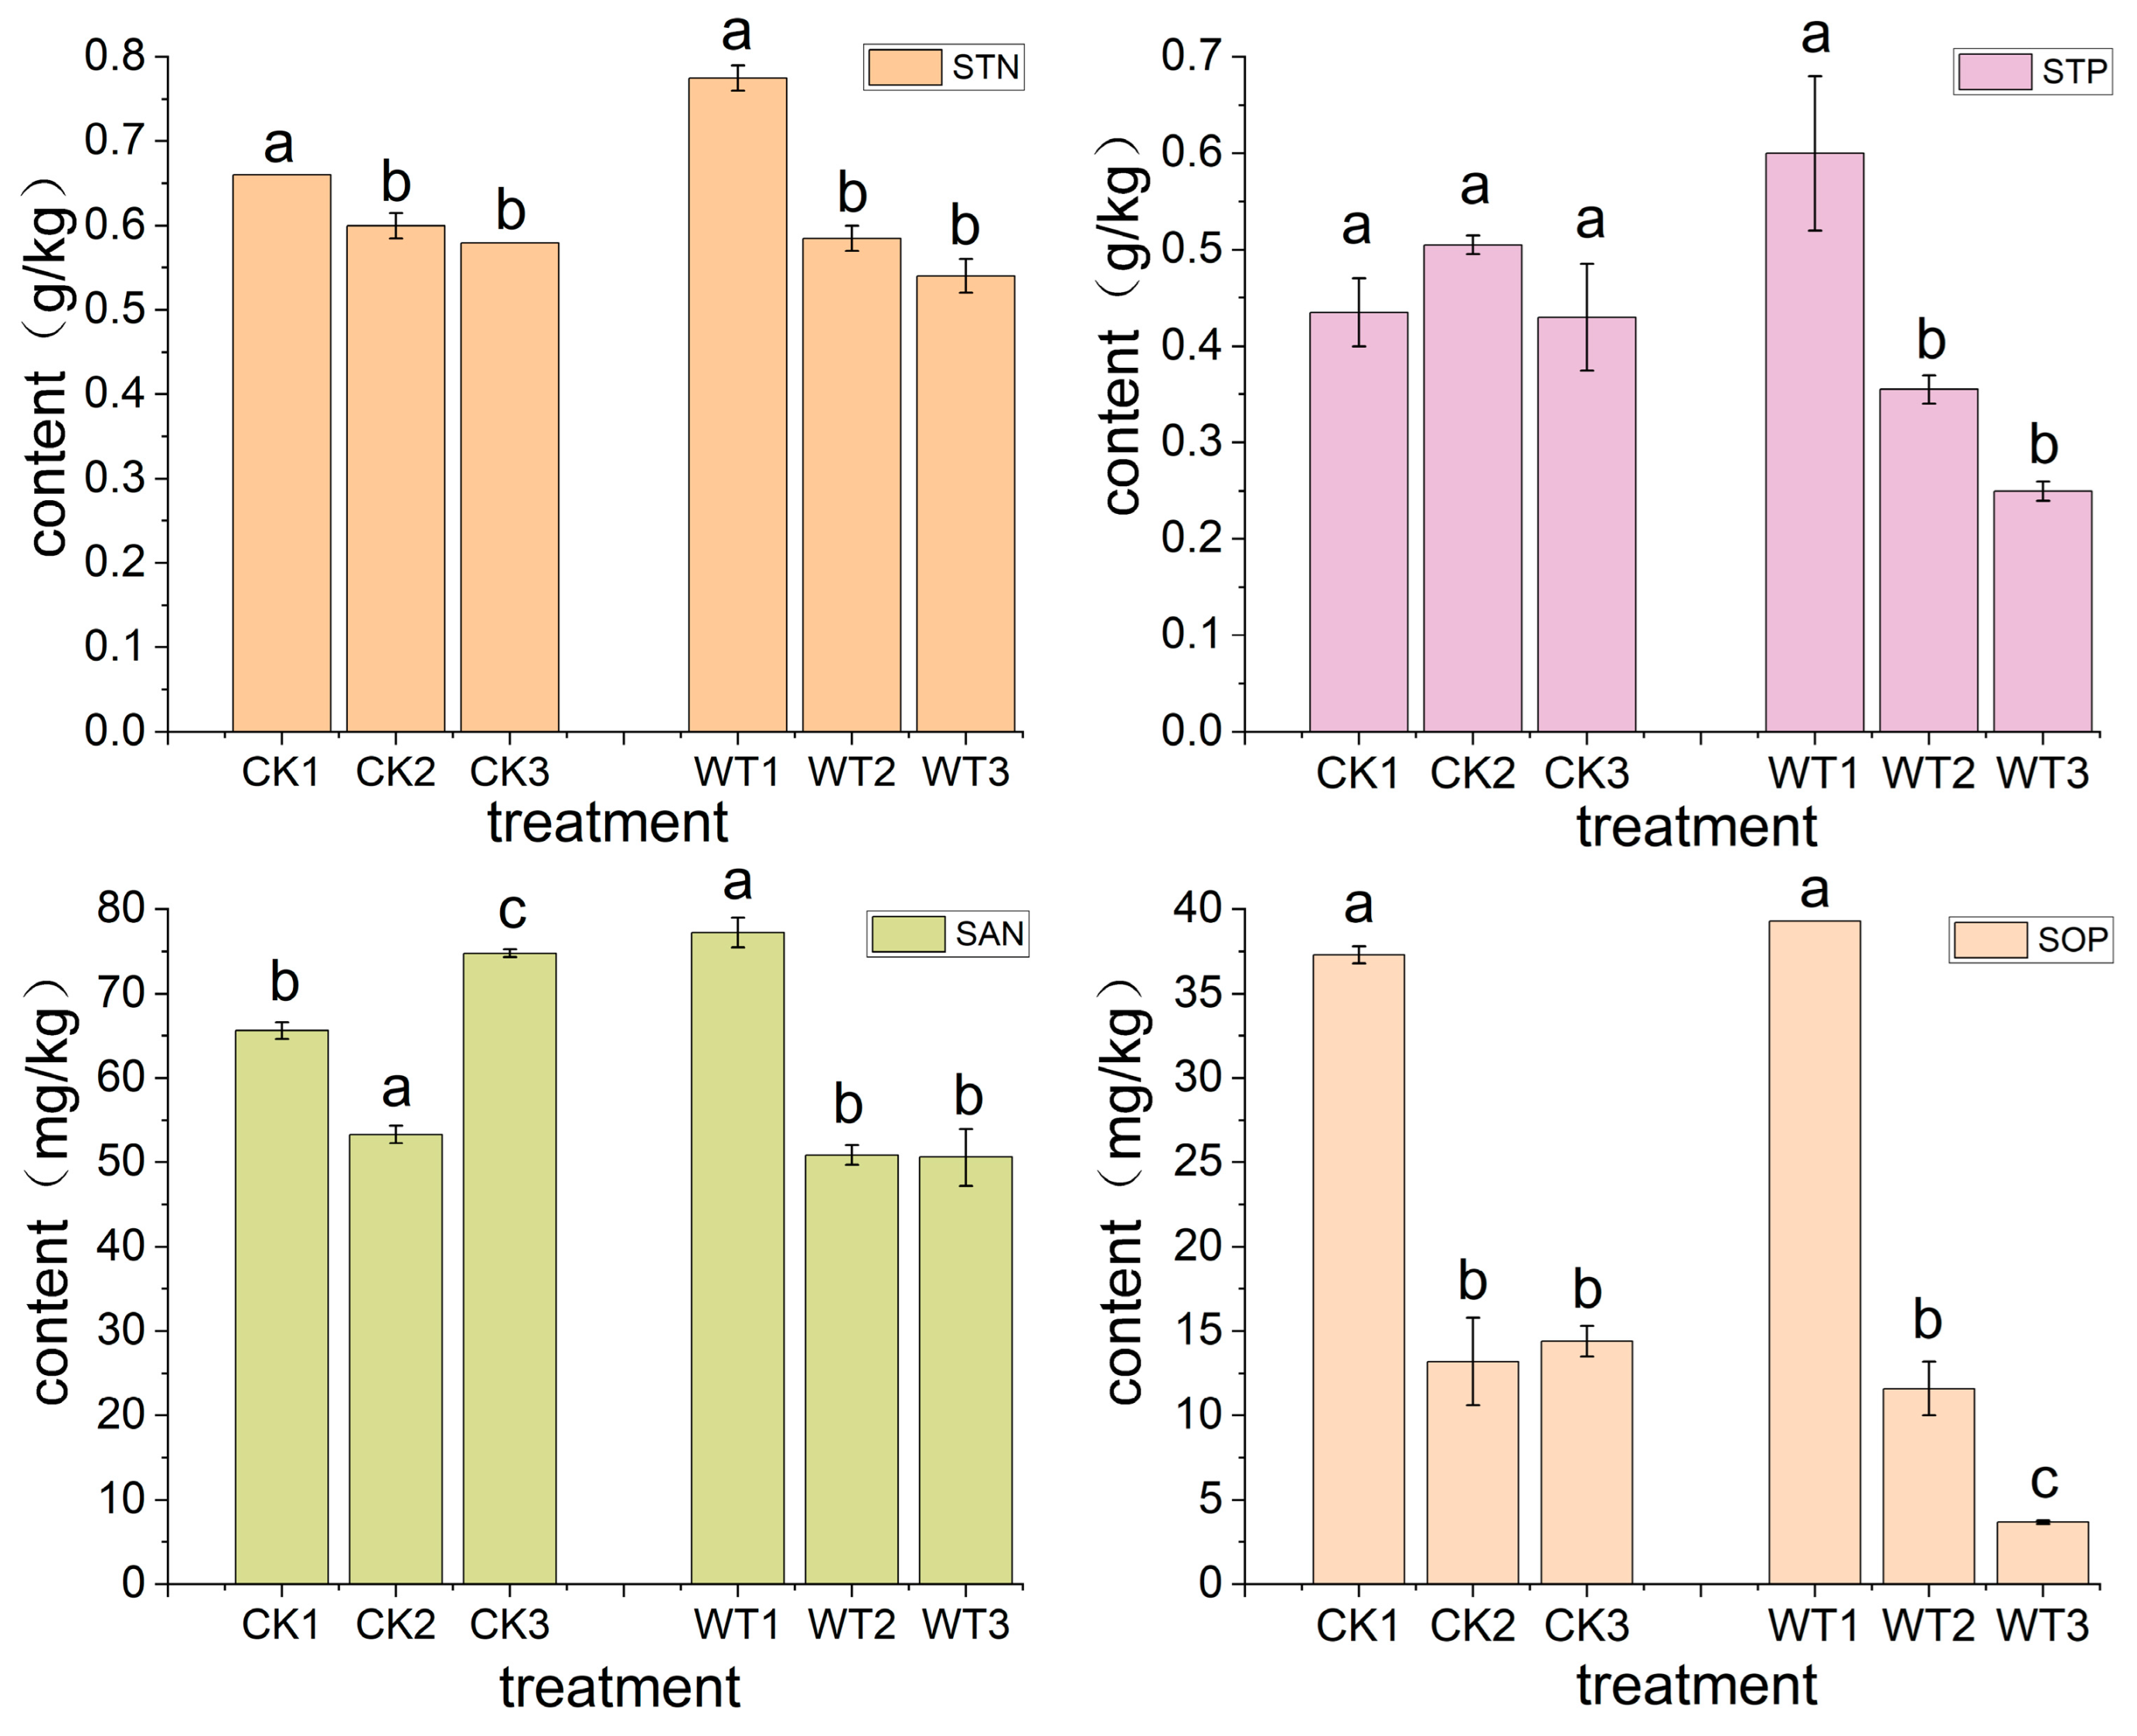
When comparing the waterlogging treatment (A1 field) to the control treatment (B4 field), the content of total nitrogen, total phosphorus, alkaline nitrogen, and accessible phosphorus in the 0~20 cm soil increased by 17.4%, 37.9%, 17.8%, and 5.4%, respectively. In the 20–60 cm soil layer, the nitrogen and phosphorus contents of the waterlogged soil were reduced compared to the control treatment. In the control treatment, various forms of soil nitrogen and phosphorus were enriched in different soil layers (Figure 6). Specifically, total nitrogen and available phosphorus were enriched in the 0–20 cm soil layer, alkaline nitrogen content was enriched in the 40–60 cm soil layer, and total phosphorus content was enriched in the 20–40 cm soil layer. Conversely, in waterlogged soils, nitrogen and phosphorus content were found to be enriched in the 0–20 cm soil layer.

3.3. The Variation Law of Nitrogen and Phosphorus Loss Concentration in Runoff Water

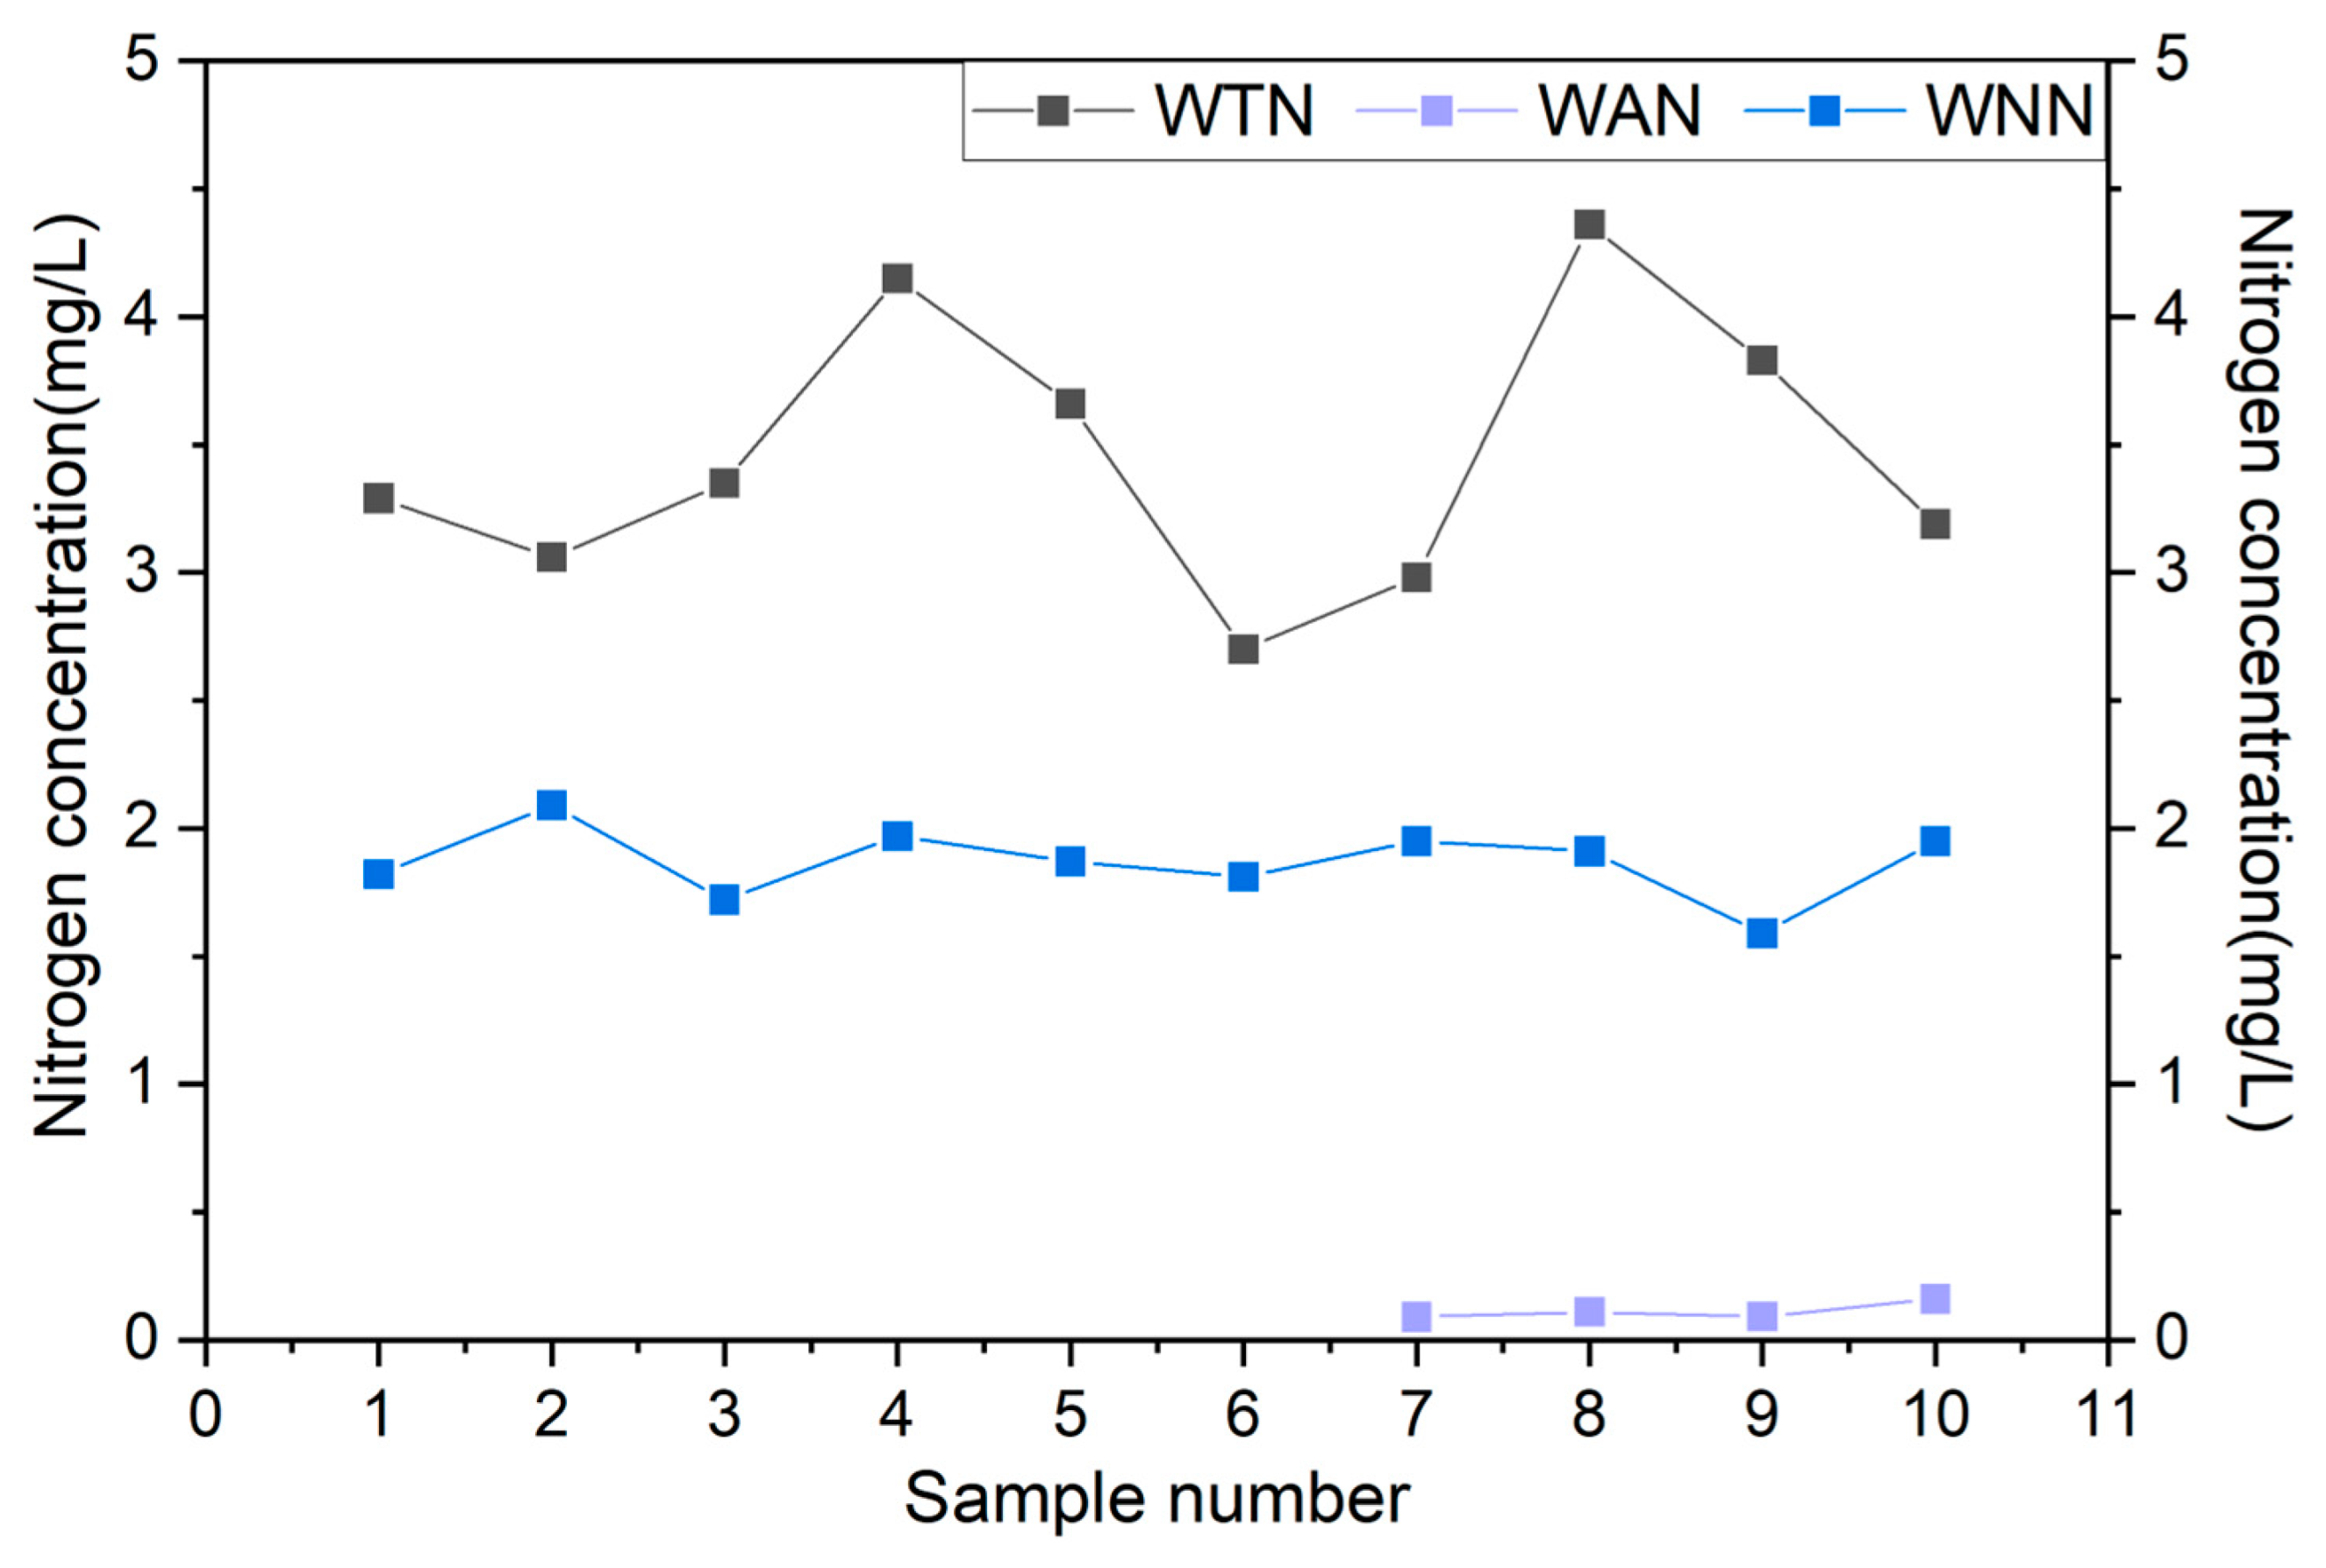
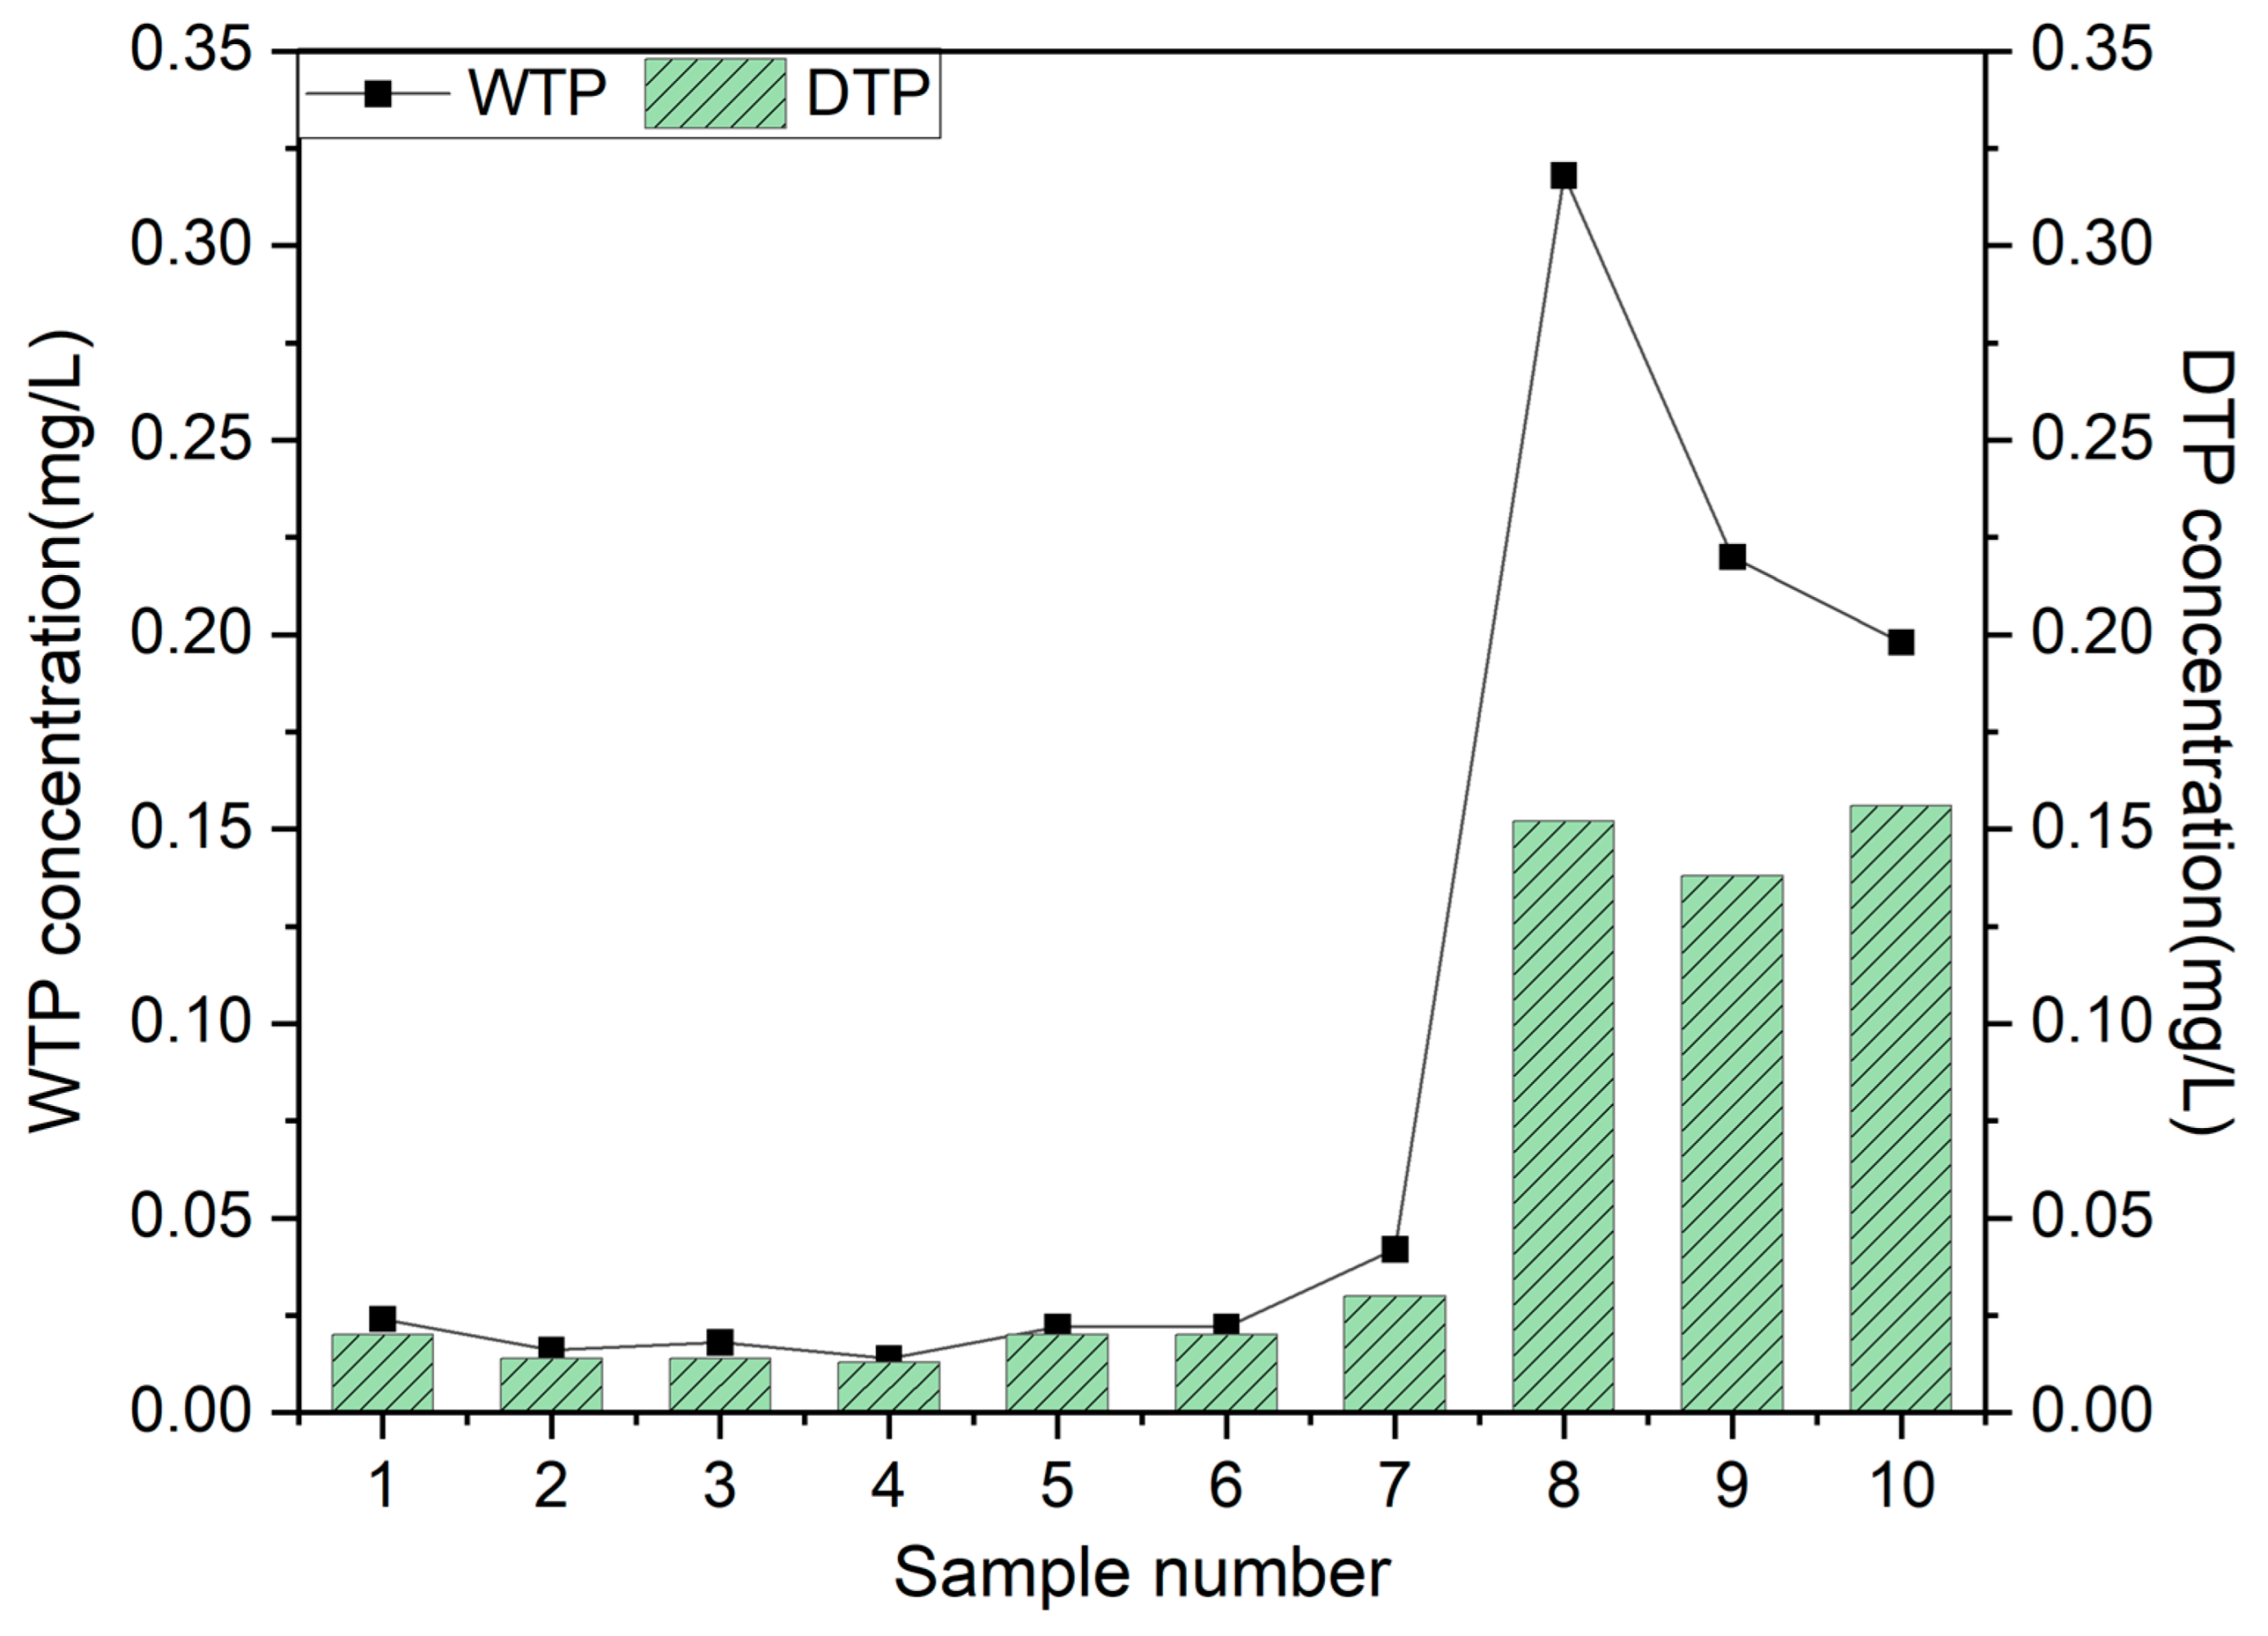
As the rainfall increased, there were significant fluctuations in the concentrations of total nitrogen and total phosphorus in the runoff water (Figure 7 and Figure 8). The peak of total nitrogen loss concentration appeared at the end of unstable runoff and on the third day of waterlogging stress, respectively. Nitrate nitrogen was the main form of nitrogen loss in runoff water, accounting for between 41.53% and 67.04% of the total nitrogen concentrations. The total phosphorus concentration reached its maximum on the second day of waterlogging stress. The average concentration of dissolved phosphorus accounted for 78.40% of the total phosphorus concentration. The research results above indicate that the total nitrogen concentration in the runoff water during the winter wheat seedling stage is significantly higher than the total phosphorus concentration. The predominant forms of nitrogen and phosphorus loss are mainly soluble, with the nitrate nitrogen concentration surpassing the ammonium nitrogen concentration.

3.4. Correlation Analysis between Wheat Root Morphology and Soil Nutrients

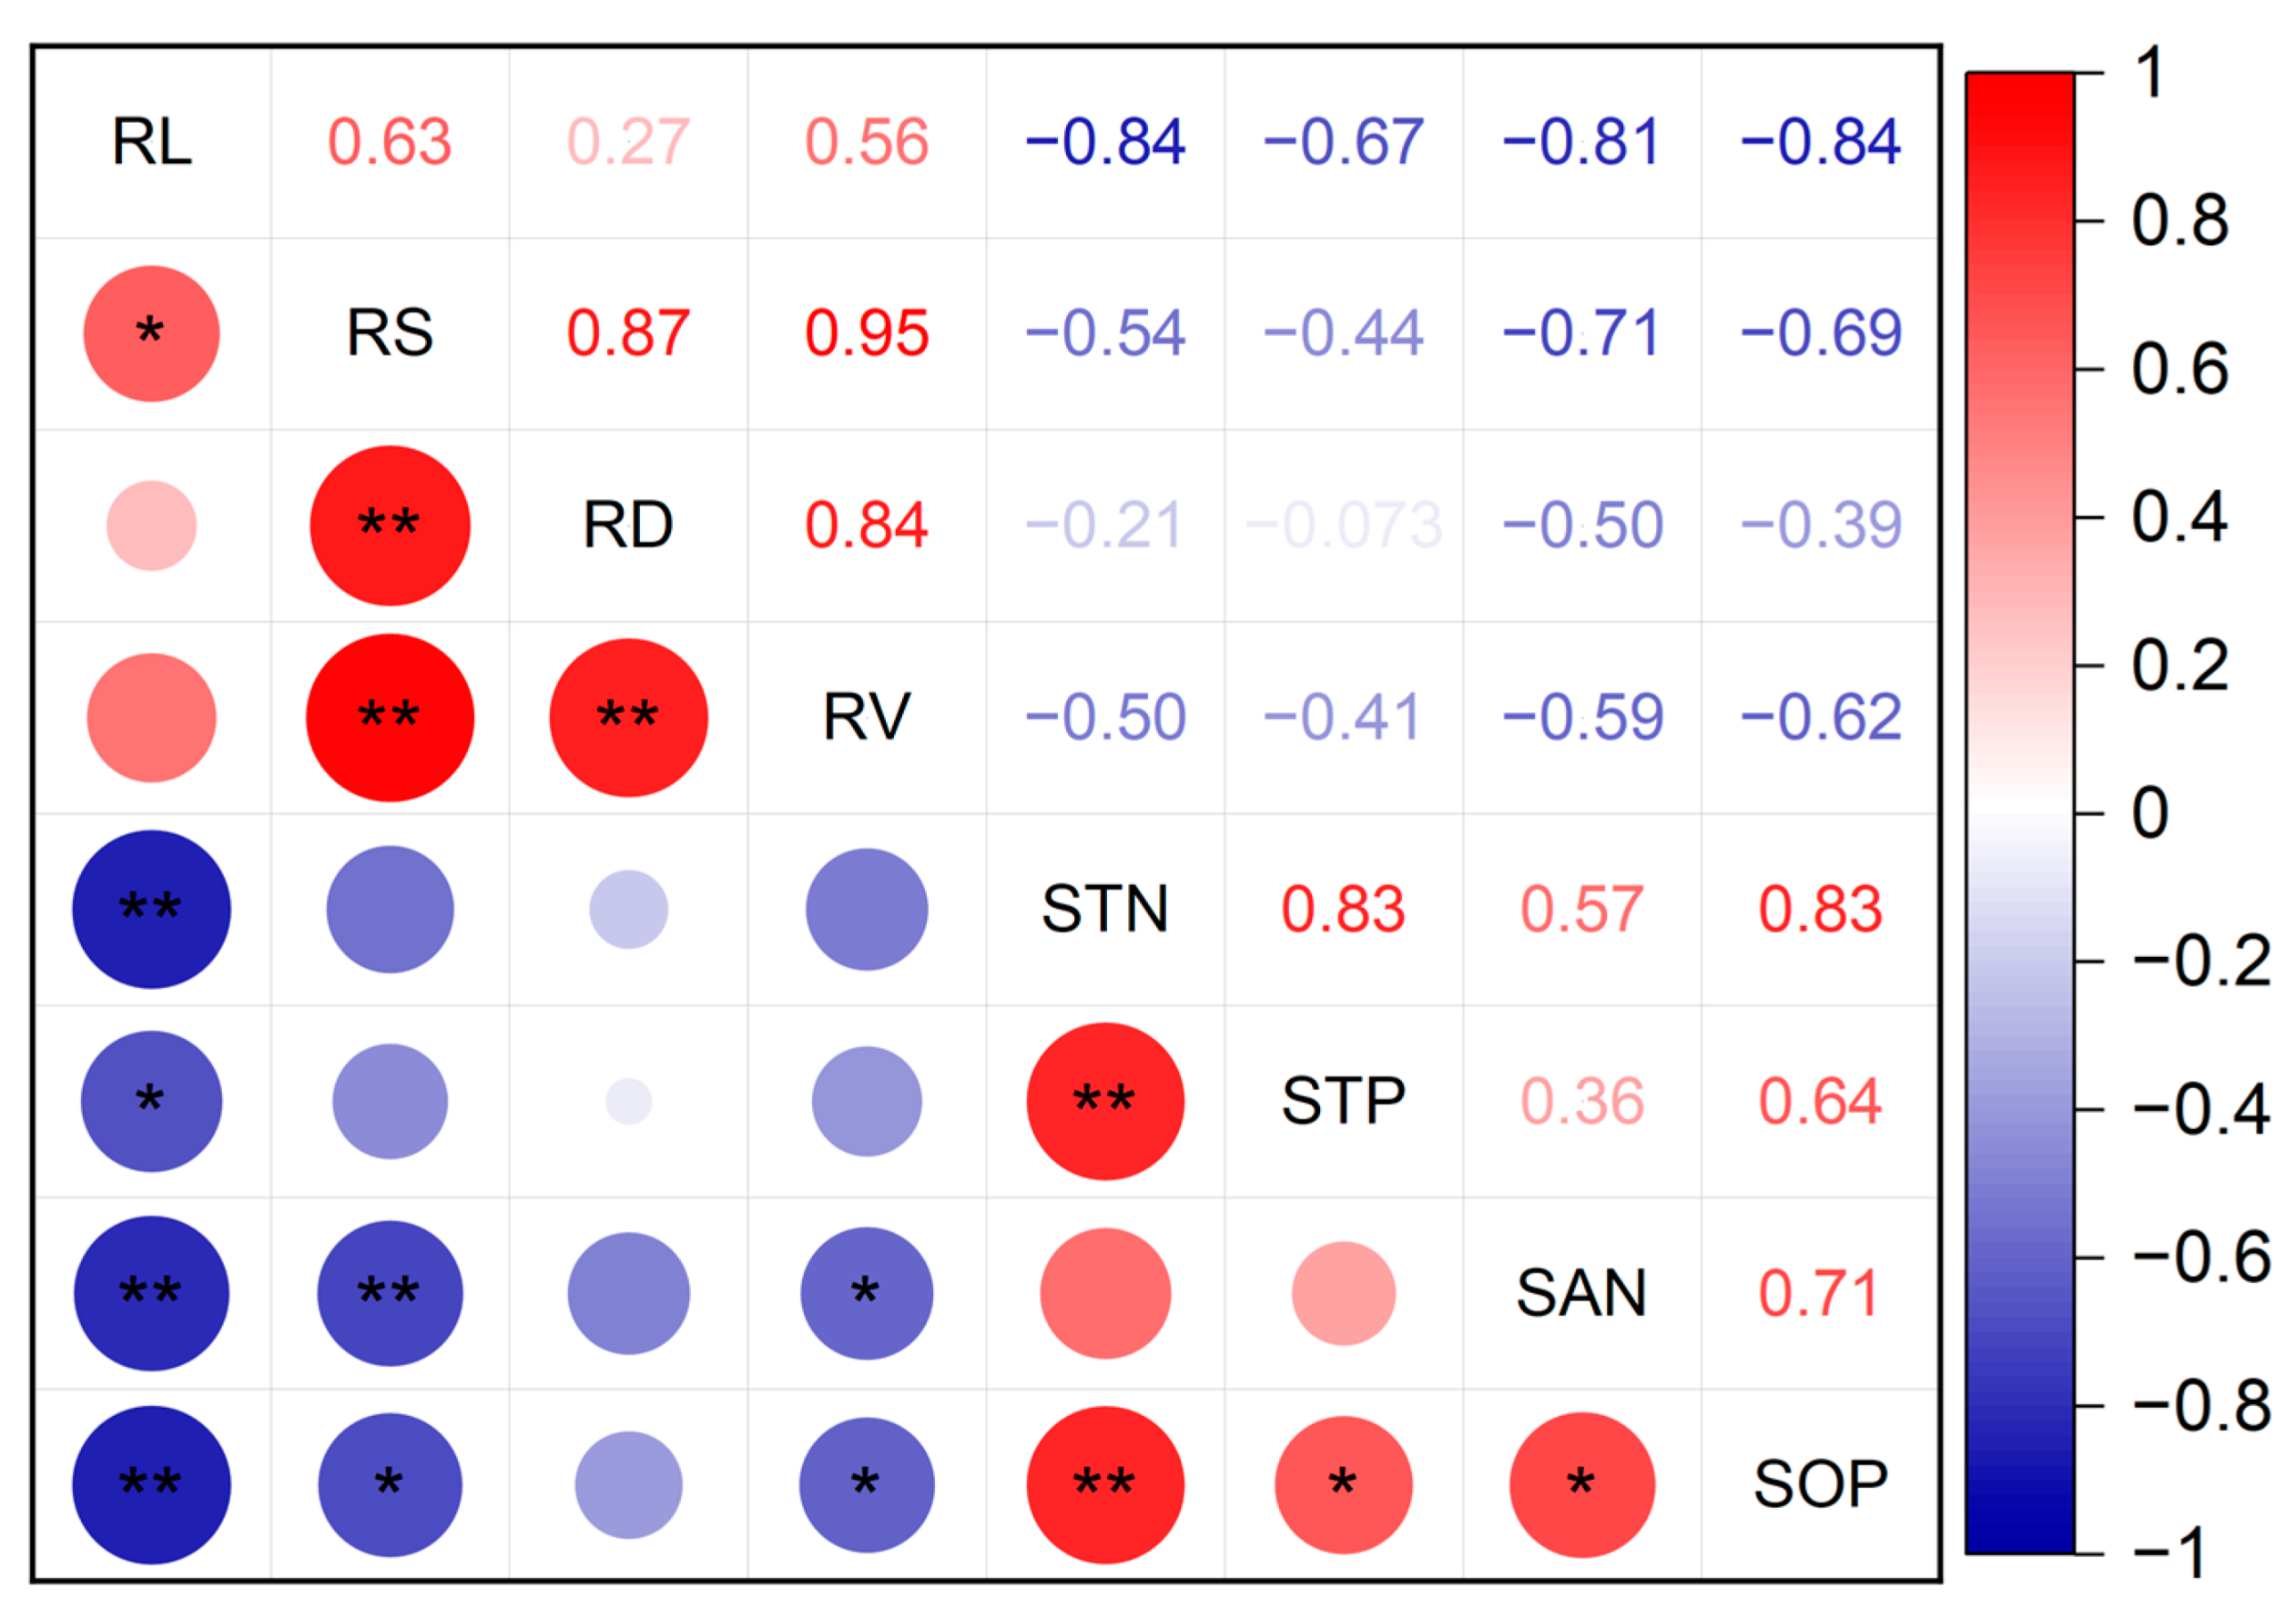
In order to elucidate the effects of waterlogging stress at the seedling stage on root and nutrient distribution of wheat in different soil layers, we examined the correlation between wheat root morphology in the 0–60 cm soil layer and the soil nutrient content in the corresponding soil layer. According to Pearson’s correlation analysis (Figure 9), the root length of winter wheat seedlings exhibited a highly significant negative correlation with soil total nitrogen, soil alkaline nitrogen, and soil available phosphorus, as well as a significant negative correlation with soil total phosphorus. The root surface area of winter wheat seedlings exhibited a highly significant negative correlation with soil alkaline nitrogen and a significant negative correlation with soil available phosphorus. The root volume of winter wheat seedlings exhibited a significant negative correlation with soil alkaline nitrogen and soil available phosphorus.

3.5. Analysis of the Influence of Soil Nutrients and Runoff Water Quality

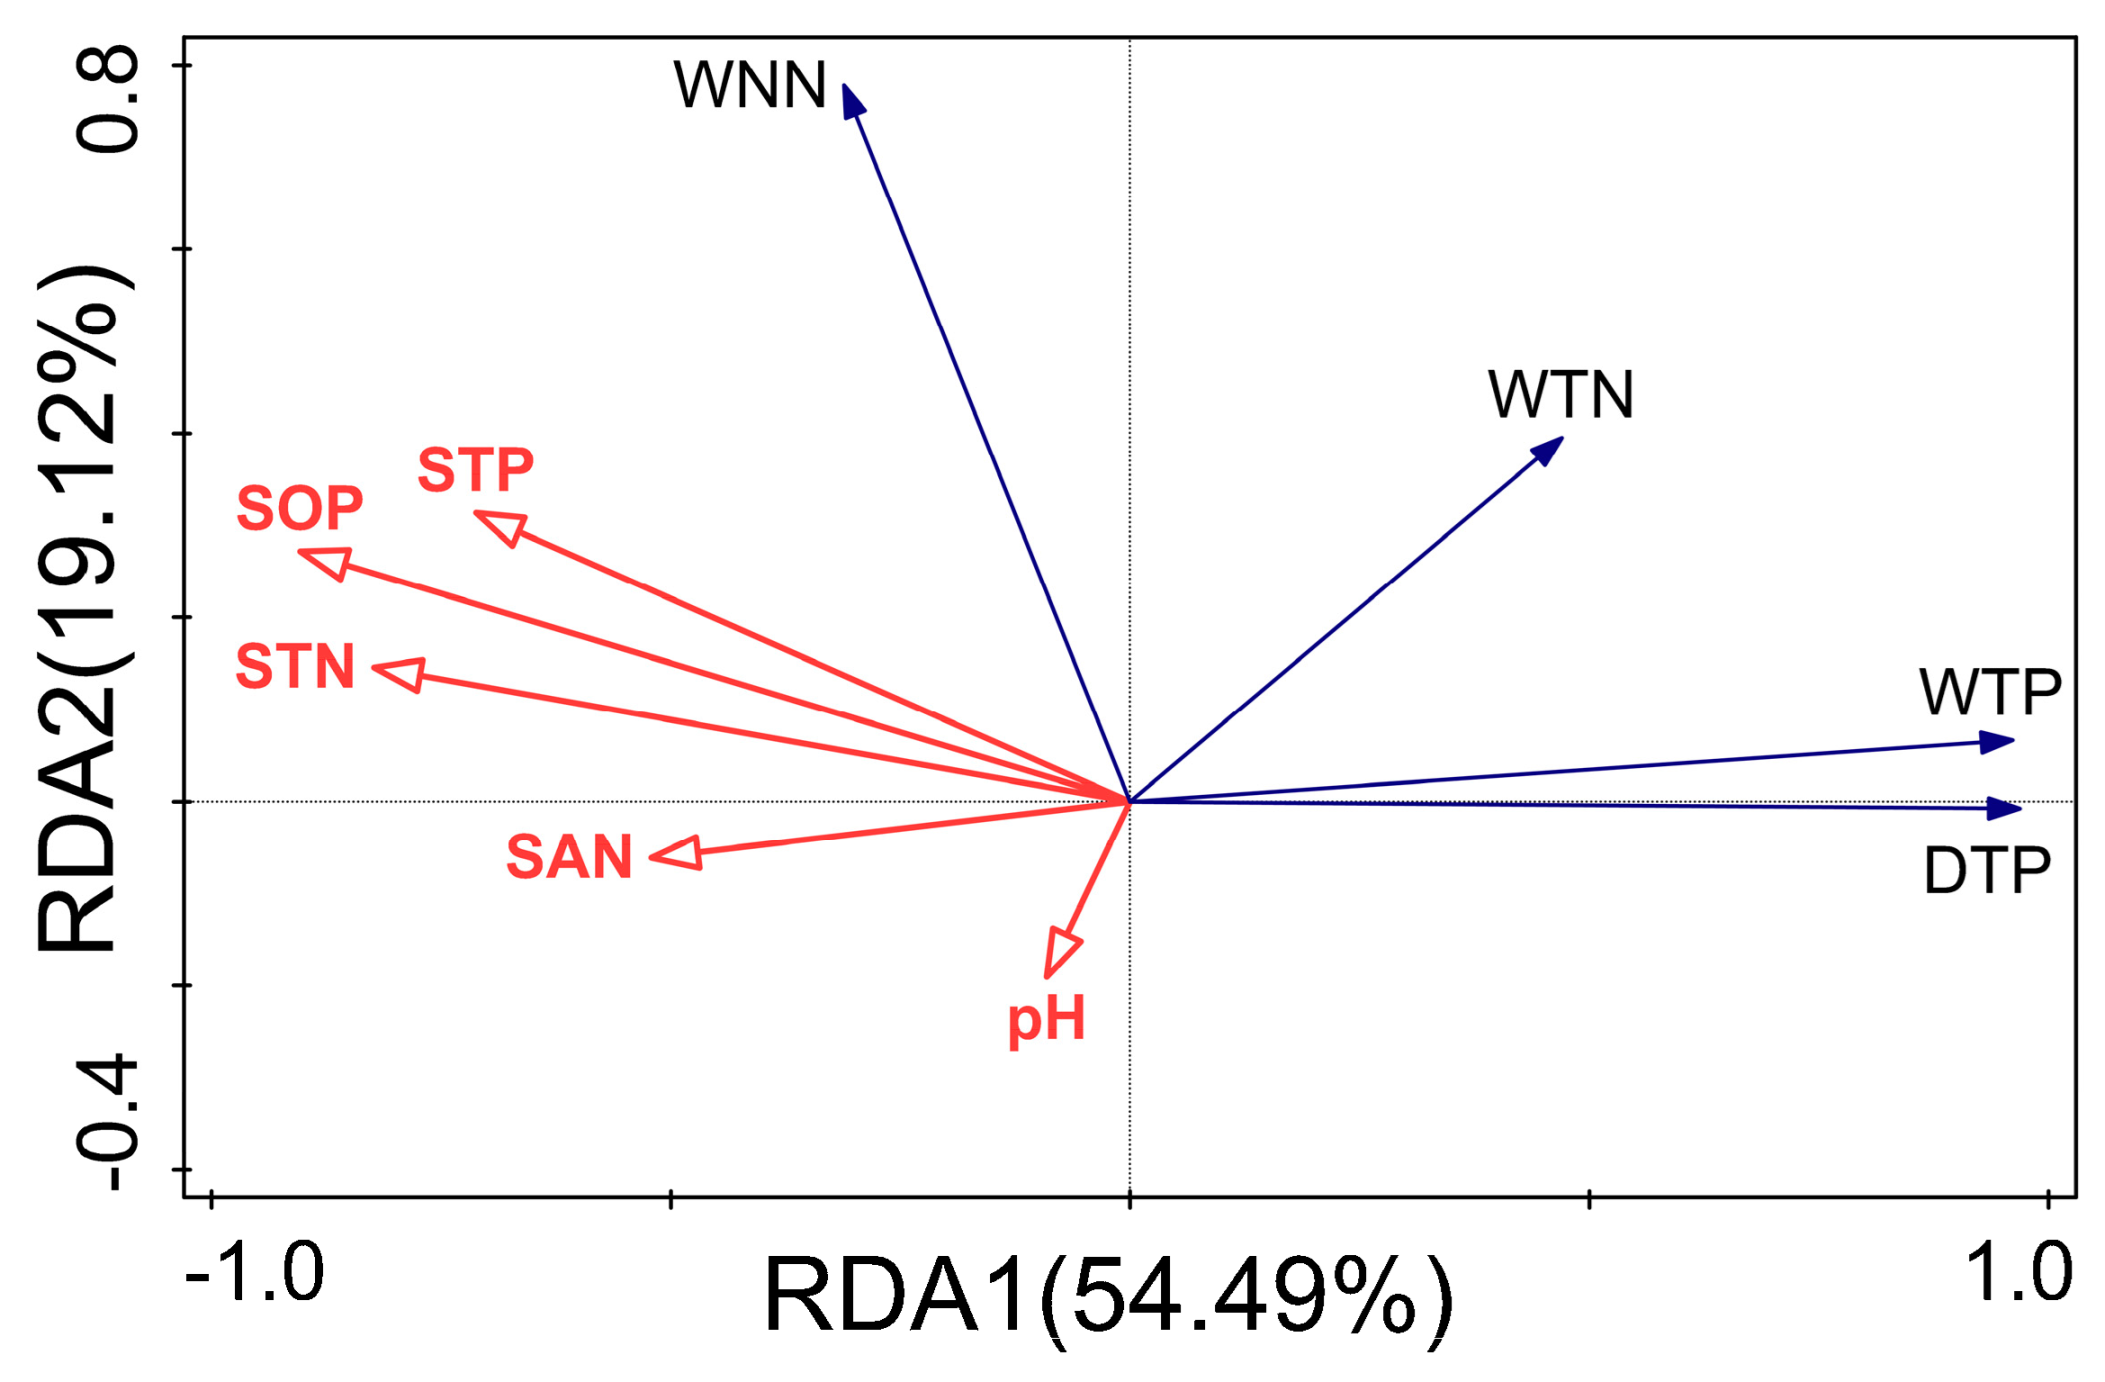
The results showed that the response of various forms of nitrogen and phosphorus in the runoff water to soil nitrogen and phosphorus differed (Figure 10). The cumulative explanation of the response variable by the first two axes reached 73.61%. This indicates that the two-dimensional linear relationship formed by the first two axes can adequately describe the response relationship reflecting the water quality of winter wheat seedling runoff and the soil environment. Utilizing the Monte Carlo replacement test for quantitative identification, the findings demonstrated that soil available phosphorus had a strong explanatory power, with an explanatory rate of 45.9%, and was a highly significant environmental factor influencing the water quality of runoff. Soil total nitrogen and alkaline nitrogen followed, with respective rates of 13.3% and 10.5%, respectively.

3.6. Analysis of the Influence of Runoff Water Quality and Wheat Root Morphology

According to the results in Figure 11, the first two ordination axes explained 80.64% of the variation in root growth morphology, providing a more accurate reflection of the relationship between root growth morphology and runoff water quality. Combined with Figure 9, it was shown that root length was significantly positively correlated with total phosphorus and dissolved phosphorus in water. Additionally, root surface area and root volume were significantly positively correlated with the total phosphorus content in runoff water. The Monte Carlo replacement test showed that total phosphorus and dissolved phosphorus in water were the dominant factors affecting root growth. Among these factors, total phosphorus in water had the most significant impact on root growth variation, explaining 48.3% of the variance. This was followed by dissolved phosphorus, nitrate nitrogen, and total nitrogen in water, accounting for 24.7%, 6.3%, and 1.7%, respectively.

4. Discussion

4.1. Effects of Waterlogging Stress on Root Morphology and Soil of Winter Wheat

As the main organ for water and nutrient absorption and transport in winter wheat, the function of the root system is closely related to the morphology and physiological characteristics of the root [27,28]. Waterlogging stress leads to reduced oxygen levels in the soil, inhibited gas exchange between roots and the atmosphere, and decreased root respiration rates. When the oxygen concentration in the soil drops below the critical value of 0.12 mol/m3, the crop root system enters a hypoxic state. Under hypoxic conditions, the plant root system shifts from aerobic respiration to anaerobic fermentation. This transition restricts energy production, leading to an “energy crisis” that hinders root growth [29]. Plants have various adaptive mechanisms to cope with waterlogging stress. They enhance oxygen diffusion to the root organs by producing aerated tissues, forming adventitious roots, and increasing root porosity [30,31]. These adaptations improve oxygen conditions within the plant and help alleviate the lack of root energy. In this study, it was found that the root morphology (root length, root surface area, and root volume) of waterlogged winter wheat tended to increase and then decrease with increasing soil depth vertically after the waterlogging water stress was removed. The increase in root morphology parameters may be related to the rise in ethylene levels in the root system caused by short-term waterlogging stress [32,33]. The transport of growth hormones in the plant was impeded, leading to an increase in the values of its root morphology parameters to ensure the normal growth of the crop. This is consistent with the results of Liu et al., indicating that the significant increase in root length and root surface area contributes to the enhancement of crop nitrogen uptake efficiency [34]. Jackson also observed that recently generated adventitious roots can temporarily replace waterlogged primary roots for aerobic respiration, providing stressed plants with energy [35]. Day et al. [36] also explained this phenomenon: in response to waterlogging stress, the root system of plants shows an aerobic growth response, increasing the number of roots on the soil surface to facilitate the uptake of oxygen from the atmosphere. The reduction in root morphological parameters could be a result of hypoxic stress. Waterlogging stress causes anaerobic conditions in the deep soil, reducing oxygen supply to the root system, promoting denitrification, and facilitating iron and sulfur reduction, which ultimately results in root stunting and decay [37,38,39]. After the alleviation of waterlogging stress, when viewed horizontally, in the 20–60 cm soil layer, the root length and root volume of winter wheat subjected to waterlogging with a row spacing of 0 cm and 10 cm exhibited an increasing trend compared to the control treatment. The root surface area of winter wheat at a row spacing of 5 cm was lower than that of the control treatment. It indicates that waterlogging stress has a greater inhibitory effect on the surface area of winter wheat roots, while root length shows some ability to recover after the waterlogging stress is alleviated. It has been suggested that root systems experiencing waterlogging stress will preferentially allocate nutrient resources to root growth after the stress is lifted [37]. Root recovery growth is rapid, with relative growth rates that can be 30–40% higher compared to well-drained root systems [40,41]. Ultimately, the roots recover to levels greater than or close to those of control plants [42,43]. Root morphology can influence crop water and nutrient uptake [44]. Conversely, soil moisture and nutrient effectiveness can shape root morphology and its physiological activity [45,46]. Therefore, root morphology can reflect the root system’s ability to absorb nutrients and water, as well as the extent of the interaction between the plant and the soil environment [47]. King et al. [48] concluded that the distribution of nutrient content in the soil layer during the early growth stage influences the nitrogen uptake capacity of crop roots. Comfort et al. [49] indicated that increased nitrogen efficiency results in decreased root density in deeper soils. Rubio et al. [50] reported that waterlogging increases the effectiveness of soil phosphorus. They also found that the root systems of waterlogged crops are longer and finer compared to those of non-waterlogged crops, which leads to an increased uptake of essential nutrients through the roots. The results of this study showed that the root length of waterlogged winter wheat gradually decreased in the 30–60 cm soil layer at 0 cm from the wheat rows. The corresponding inter-root soil nutrients also exhibited a decreasing trend with increasing depth. These findings indicate that the root distribution of winter wheat is spatially specific, correlating with the spatial variability of soil nutrients. In other words, the variances in the spatial distribution of soil nutrients are likely to impact the trend of root growth.
In addition, the results of Pearson’s correlation analysis (Figure 9) showed a significant negative correlation between the root morphological parameters of winter wheat seedlings and soil nutrient content. This suggests that waterlogging stress leads to compensatory proliferation of the winter wheat root system, which promotes the uptake of nutrients to sustain growth. The results of studies by Sauter et al. [51] and Steffens et al. [52] found that adventitious root formation is a plant adaptation to waterlogging stress. Adventitious roots have a higher nutrient uptake capacity, facilitating the transport of gases, water, and nutrients, which ensures plant survival. Our findings contribute to elucidating this compensatory occurrence, indicating that the root growth parameters of winter wheat seedlings surpassed those of the corresponding control during the same phase of development following waterlogging stress.
The morphology of roots interacts with and impacts the concentration of soil nutrients. Waterlogging stress promotes organic matter mineralization and soil phosphorus activation, leading to an increase in alkaline nitrogen and available phosphorus content in the soil layer. Winter wheat seedlings are currently in the nutrient growth stage, during which the root system can compensate for reduced growth by continuously absorbing available phosphorus and alkaline nitrogen from the soil after the waterlogging stress is alleviated. Wu et al. [53] concluded that soil nitrogen use efficiency was positively correlated with root length and root surface area density, similar to the results of this study. In addition, the accumulation of total nitrogen and total phosphorus in the root system of waterlogged winter wheat was 24.1% and 74.0% higher, respectively, than in the control treatment (unpublished data). Taken together, these findings suggest that waterlogged winter wheat increased seedling root growth and nutrient uptake to some extent under waterlogging stress.

4.2. Effects of Waterlogging Stress on Soil Nutrients and Runoff Water Quality

Nitrogen and phosphorus loss in runoff water is the result of the interaction of soil nutrients with rainfall and runoff, and its output pattern undergoes dynamic changes [54]. This study found that the concentration of NH4+-N exhibited a delayed outflow phenomenon, while the concentration of NO3-N in the runoff water of winter wheat seedlings initially increased and then decreased. The following are the causes: Firstly, when plants develop to absorb nitrogen, they can directly use NO3-N, whereas NH4+-N must first be transformed to be utilized by the plants. Secondly, the wet conditions accelerated the pace at which soil organic matter mineralized [55]. This phenomenon also helped to explain why the total and alkaline nitrogen contents of the first soil layer were higher than those of the control treatment. Additionally, NH4+ is easily adsorbed by colloids and has a weak migratory capacity, which can lead to its accumulation in the soil in large quantities [56]. On the other hand, NO3 has a strong migratory capacity, especially under the influence of conditions like rain or irrigation, making it prone to being easily lost in surface runoff [57,58]. Last but not least, the emergence of the phenomenon is linked to the unique soil environment. Prolonged waterlogging causes hypoxia in the soil environment, which lowers the redox potential [7], inhibits nitrification in the soil, increases the concentration of NH4+-N in the water, enhances denitrification, and reduces migration to the overlying water. Prolonged waterlogging exacerbates the loss of NO3-N by causing water to seep through the soil, which reduces the amount of NO3-N in runoff water. Previous research findings have also shown that in anaerobic soil conditions, the concentration of soil NO3-N decreases as waterlogging time increases, while the concentration of soil NH4+-N increases [7,59,60,61]. Furthermore, in line with the findings of this investigation, other studies have stated that NO3-N is the primary factor of nitrogen loss in runoff water in dryland systems [62,63,64].
After one day of waterlogging, the total phosphorus concentration in the runoff water increased significantly, and the available phosphorus content in the topsoil layer was higher compared to the control treatment. This could be because the test soil was lime concretion black soil, and the majority of the phosphorus in the soil was inorganic, existing as phosphate bound to iron and calcium. Waterlogging can impact the mineralization and decomposition of soil organic phosphorus, as well as the dissolution processes of phosphorus-containing minerals [65]. This can lead to an increase in available phosphorus and total phosphorus content in the soil [66,67]. According to Xiao et al. [68], the waterlogged treatment resulted in a higher concentration of available phosphorus in the 0–10 cm soil layer compared to the control treatment. According to Geng’s determination of the critical value of phosphorus leaching from this type of soil, the test soil in this study is 1.1 times the critical value of leaching from soils in this area (the two study areas are only 20 km apart) [69]. Therefore, waterlogging stress leads to an increase in the available phosphorus content of the soil as well as an increase in the risk of phosphorus loss. In this study, the total phosphorus concentration in the runoff water showed an increasing and then decreasing trend, with dissolved phosphorus being the primary form of loss. These findings are consistent with previous research conducted by Yang et al. [70] and Jiao et al. [71] on the phosphorus and nitrogen loss from farms in the Huaibei Plain.
Based on the redundancy analysis of soil nutrients and runoff water quality, soil available phosphorus had the highest explanatory power for runoff water quality, followed by soil total nitrogen and soil available nitrogen. This suggests that the nitrogen and phosphorus concentrations in runoff water were significantly influenced by soil available nutrients. This finding aligns with previous correlation analyses of nitrogen and phosphorus in water and soil, indicating that waterlogging conditions facilitate the gradual migration and transformation of nitrogen and phosphorus from soil to runoff water [72,73,74]. In general, the total phosphorus concentration in the runoff water during the winter wheat seedling stage is low, while the total nitrogen concentration exceeds the V class surface water quality standard. Therefore, the non-point source pollution control during the wheat field seedling stage should focus on nitrogen. However, the total phosphorus concentration in the runoff water increased significantly on the second day of waterlogging stress. This reminds us to pay attention to the risk of phosphorus loss caused by long-term waterlogging stress.

4.3. Effects of Runoff Water Quality on Root Growth of Winter Wheat under Waterlogging Stress

The results of this study showed that the average concentration of total phosphorus in the runoff waters was 0.11 mg/kg, the average concentration of dissolved phosphorus was 0.07 mg/kg, and the average concentration of total nitrogen was 3.46 mg/kg. This is nearly twice as much as the experimental results of Li et al. in the same study area [75]. This difference may be attributed to the ability of winter wheat to absorb nitrogen and phosphorus nutrients from the water to sustain growth during waterlogging stress, which explains that total and dissolved phosphorus in the water are the primary factors influencing root growth. It may also be due to the fact that the results of Li et al. were obtained under a rainfall intensity of 50 mm/h, which is much greater than the rainfall intensity in this study. Yang et al. [76] and Li et al. [77] reported that rainfall intensity is the primary factor influencing nitrogen and phosphorus loss. They found that the nitrogen and phosphorus concentration of runoff is positively correlated with rainfall intensity, indicating that higher rainfall intensity leads to greater nitrogen and phosphorus loss. There was a significant positive correlation between root morphology and total phosphorus as well as dissolved phosphorus in water. This occurred because Fe2+ was reduced to Fe3+ under waterlogged conditions, resulting in the dissolution of insoluble phosphate bound to iron [78]. The concentration of dissolved phosphorus in water increased, as did the concentration of total phosphorus in water. Phosphate ions are the primary form of phosphorus in water, and plants can directly absorb and utilize them. Under waterlogging stress, the impact of root biomass is greater than that of aboveground biomass [79]. Winter wheat needs to absorb more phosphorus by increasing root morphology to compensate for growth. Khan et al. [74] found that waterlogging stress significantly increased the concentration of various forms of dissolved phosphorus in water. Gu et al. [80] found that waterlogging stress increased the phosphorus content in plants. Rubio et al. [50] also reported that the phosphorus absorption rate in the roots of waterlogged plants was higher than that of non-waterlogged plants. In conclusion, the concentration of nitrogen and phosphorus in runoff water during waterlogging is correlated with both the amount of nutrients in the soil and the uptake and utilization of crops. Winter wheat often adapts to variations in soil moisture and nutrient availability by altering the structure of its roots.

5. Conclusions

This study utilized a simulated rainfall experiment to investigate the correlation between waterlogging stress on winter wheat water quality, root morphological growth, and soil nutrient distribution. The following are the outcomes:
(1). Winter wheat root systems recover well from waterlogging in the seedling stage, and root distribution is influenced by a combination of soil nutrients and soil moisture. In the vertical direction, the root distribution of waterlogged winter wheat and the corresponding rhizosphere soil nutrients showed a decreasing trend with increasing depth. Horizontally, with a 10 cm row spacing, the root morphology parameters of waterlogged winter wheat were significantly larger than those of the control.
(2). Waterlogging stress increases the risk of nitrogen and phosphorus loss. The total phosphorus and alkaline nitrogen contents of waterlogged soils in the 20–60 cm soil layer were significantly lower than those of the control treatment, with reductions ranging from 4.7% to 32.4% and 29.7% to 41.0%, respectively. Nitrogen was the primary element lost in the runoff water. The total phosphorus concentration in the runoff water increased significantly on the second day of waterlogging stress. Being mindful of the risk of phosphorus loss caused by prolonged waterlogging stress is important.
This study offers an insight into the response and adaptation strategies of winter wheat to waterlogging stress in the Huaibei Plain. It also establishes a theoretical foundation for reducing nutrient loss and enhancing ecosystem stability in farmland within the Huaibei Plain.

Author Contributions

Conceptualization, H.L. and X.Z.; methodology, H.L. and S.L.; software, H.L.; formal analysis, W.L. and L.X.; writing—original draft preparation, H.L.; writing—review and editing, Y.S., T.Q. and S.X.; funding acquisition, T.Q. All authors have read and agreed to the published version of the manuscript.

Funding

This research was funded by the National Science Fund Project (Grant No. 52130907), the Five Major Excellent Talent Programs of IWHR (WR0199A012021), the National Foundation Program for Postdoctoral Researchers (GZC20233115), the China Postdoctoral Science Foundation (2023M733885).

Data Availability Statement

The data presented in this study are available on request from the corresponding author due to privacy.

Conflicts of Interest

The authors declare no conflicts of interest.

References

  1. AghaKouchak, A.; Chiang, F.; Huning, L.S.; Love, C.A.; Mallakpour, I.; Mazdiyasni, O.; Moftakhari, H.; Papalexiou, S.M.; Ragno, E.; Sadegh, M. Climate extremes and compound hazards in a warming world. Annu. Rev. Earth Planet. Sci. 2020, 48, 519–548. [Google Scholar] [CrossRef]
  2. Manik, S.N.; Pengilley, G.; Dean, G.; Field, B.; Shabala, S.; Zhou, M. Soil and crop management practices to minimize the impact of waterlogging on crop productivity. Front. Plant Sci. 2019, 10, 140. [Google Scholar] [CrossRef]
  3. Liu, Z.; Zhou, Y.; Yang, B.; Ou, L. Research Progress in Waterlogging of Plant. Hubei Agric. Sci. 2015, 54, 4385–4389+4393. [Google Scholar] [CrossRef]
  4. Chen, Y.; Huang, J.; Song, X.; Gao, P.; Wan, S.; Shi, L.; Wang, X.Z. Spatiotemporal Characteristics of Winter Wheat Waterlogging in the Middle and Lower Reaches of the Yangtze River, China. Adv. Meteorol. 2018, 2018, 3542103. [Google Scholar] [CrossRef]
  5. Furtak, K.; Wolińska, A. The impact of extreme weather events as a consequence of climate change on the soil moisture and on the quality of the soil environment and agriculture—A review. CATENA 2023, 231, 107378. [Google Scholar] [CrossRef]
  6. Liu, Z.; Li, G.; Zhang, H.; Zhang, Y.; Zhang, Y.; Duan, S.; Sheteiwy, M.S.A.; Zhang, H.; Shao, H.; Guo, X. TaHsfA2-1, a new gene for thermotolerance in wheat seedlings: Characterization and functional roles. J. Plant Physiol. 2020, 246, 153135. [Google Scholar] [CrossRef]
  7. Nguyen, L.; Osanai, Y.; Anderson, I.; Bange, M.; Braunack, M.; Tissue, D.T.; Singh, B.K. Impacts of waterlogging on soil nitrification and ammonia-oxidizing communities in farming system. Plant Soil 2018, 426, 299–311. [Google Scholar] [CrossRef]
  8. Bi, W.; Weng, B.; Yan, D.; Wang, M.; Wang, H.; Wang, J.; Yan, H. Effects of drought-flood abrupt alternation on phosphorus in summer maize farmland systems. Geoderma 2020, 363, 114147. [Google Scholar] [CrossRef]
  9. Yin, Y.; Chen, H.; Wang, G.; Xu, W.; Wang, S.; Yu, W. Characteristics of the precipitation concentration and their relationship with the precipitation structure: A case study in the Huai River basin, China. Atmos. Res. 2021, 253, 105484. [Google Scholar] [CrossRef]
  10. De-Campos, A.B.; Huang, C.-H.; Johnston, C.T. Biogeochemistry of terrestrial soils as influenced by short-term flooding. Biogeochemistry 2012, 111, 239–252. [Google Scholar] [CrossRef]
  11. Sánchez-Rodríguez, A.R.; Hill, P.W.; Chadwick, D.R.; Jones, D.L. Typology of extreme flood event leads to differential impacts on soil functioning. Soil Biol. Biochem. 2019, 129, 153–168. [Google Scholar] [CrossRef]
  12. Xu, Y.; Su, B.; Wang, H. Development of a Runoff Pollution Empirical Model and Pollution Machine Learning Models of the Paddy Field in the Taihu Lake Basin Based on the Paddy In Situ Observation Method. Water 2022, 14, 3277. [Google Scholar] [CrossRef]
  13. Yan, L.; Xue, L.; Petropoulos, E.; Qian, C.; Hou, P.; Xu, D.; Yang, L. Nutrient loss by runoff from rice-wheat rotation during the wheat season is dictated by rainfall duration. Environ. Pollut. 2021, 285, 117382. [Google Scholar] [CrossRef]
  14. Yeung, E.; Bailey-Serres, J.; Sasidharan, R. After the deluge: Plant revival post-flooding. Trends Plant Sci. 2019, 24, 443–454. [Google Scholar] [CrossRef]
  15. Kaur, G.; Singh, G.; Motavalli, P.P.; Nelson, K.A.; Orlowski, J.M.; Golden, B.R. Impacts and management strategies for crop production in waterlogged or flooded soils: A review. Agron. J. 2020, 112, 1475–1501. [Google Scholar] [CrossRef]
  16. Pan, J.; Sharif, R.; Xu, X.; Chen, X. Mechanisms of waterlogging tolerance in plants: Research progress and prospects. Front. Plant Sci. 2021, 11, 627331. [Google Scholar] [CrossRef]
  17. Feng, K.; Wang, X.; Zhou, Q.; Dai, T.; Cao, W.; Jiang, D.; Cai, J. Waterlogging Priming Enhances Hypoxia Stress Tolerance of Wheat Offspring Plants by Regulating Root Phenotypic and Physiological Adaption. Plants 2022, 11, 1969. [Google Scholar] [CrossRef]
  18. Mendoza, R.; Escudero, V. Plant growth, nutrient acquisition and mycorrhizal symbioses of a waterlogging tolerant legume (Lotus glaber Mill.) in a saline-sodic soil. Plant Soil 2005, 275, 305–315. [Google Scholar] [CrossRef]
  19. Yuan, L.; Chen, M.; Wang, L.; Sasidharan, R.; Voesenek, L.A.; Xiao, S. Multi-stress resilience in plants recovering from submergence. Plant Biotechnol. J. 2023, 21, 466–481. [Google Scholar] [CrossRef]
  20. Jiang, M.; Xuan, S.; Muneer, M.A.; Sun, B.; Shi, C.; Liu, F.; Wu, R. Response of dry matter partition and yield components to waterlogging and sunlight shortage in different growth stages of wheat. Nat. Hazards 2022, 110, 1133–1152. [Google Scholar] [CrossRef]
  21. Zhou, S.; Wang, C.; Zhang, Z.; He, D. Effect of Waterlogging on the Growth and Nutrient Metabolism of the Root System of Winter Wheat. Acta Agronmica Sin. 2001, 27, 673–679. [Google Scholar]
  22. Ghobadi, M.E.; Ghobadi, M.; Zebarjadi, A. Effect of waterlogging at different growth stages on some morphological traits of wheat varieties. Int. J. Biometeorol. 2017, 61, 635–645. [Google Scholar] [CrossRef]
  23. Lv, Z.Y.; Qin, T.L.; Liu, S.S.; Nie, H.J.; Liu, F.; Wang, J.W. Porous-fiber module increases infiltration and reduces runoff. Agron. J. 2020, 112, 4420–4436. [Google Scholar] [CrossRef]
  24. Li, W.; Liu, S.; Qin, T.; Xiao, S.; Li, C.; Zhang, X.; Wang, K.; Abebe, S.A. Experiment Study of Porous Fiber Material on Infiltration and Runoff of Winter Wheat Farmland in Huaibei Plain, China. Front. Earth Sci. 2022, 10, 817084. [Google Scholar] [CrossRef]
  25. Administration, C.M. Specifications of Agrometeorological Observation-Winter Wheat; China Meteorological Press: Beijing, China, 2015; Volume QX/T 299-2015. [Google Scholar]
  26. Wang, X.; Zhao, C.; Zhao, M. Effects of different flooding duration on soil physical properties of upland rice. J. Hebei Agric. Univ. 2022, 45, 32–38. [Google Scholar] [CrossRef]
  27. Chen, Y.; Li, S.; Zhang, Y.; Li, T.; Ge, H.; Xia, S.; Gu, J.; Zhang, H.; Lü, B.; Wu, X.; et al. Rice root morphological and physiological traits interaction with rhizosphere soil and its effect on methane emissions in paddy fields. Soil Biol. Biochem. 2019, 129, 191–200. [Google Scholar] [CrossRef]
  28. Liu, K.; Li, T.T.; Chen, Y.; Huang, J.; Qiu, Y.Y.; Li, S.Y.; Wang, H.; Zhu, A.; Zhuo, X.X.; Yu, F.; et al. Effects of root morphology and physiology on the formation and regulation of large panicles in rice. Field Crops Res. 2020, 258, 107946. [Google Scholar] [CrossRef]
  29. Zúñiga-Feest, A.; Bustos-Salazar, A.; Alves, F.; Martinez, V.; Smith-Ramírez, C. Physiological and morphological responses to permanent and intermittent waterlogging in seedlings of four evergreen trees of temperate swamp forests. Tree Physiol. 2017, 37, 779–789. [Google Scholar] [CrossRef]
  30. Qi, X.; Li, Q.; Ma, X.; Qian, C.; Wang, H.; Ren, N.; Shen, C.; Huang, S.; Xu, X.; Xu, Q. Waterlogging-induced adventitious root formation in cucumber is regulated by ethylene and auxin through reactive oxygen species signalling. Plant Cell Environ. 2019, 42, 1458–1470. [Google Scholar] [CrossRef]
  31. Eysholdt-Derzsò, E.; Sauter, M. Hypoxia and the group VII ethylene response transcription factor HRE2 promote adventitious root elongation in Arabidopsis. Plant Biol. 2019, 21, 103–108. [Google Scholar] [CrossRef]
  32. Visser, E.J.; Voesenek, L.A. Acclimation to soil flooding-sensing and signal-transduction. Plant Soil 2005, 274, 197–214. [Google Scholar] [CrossRef]
  33. Vidoz, M.L.; Loreti, E.; Mensuali, A.; Alpi, A.; Perata, P. Hormonal interplay during adventitious root formation in flooded tomato plants. Plant J. 2010, 63, 551–562. [Google Scholar] [CrossRef]
  34. Liu, L.; Zhang, H.; Ju, C.; Xiong, Y.; Bian, J.; Zhao, B.; Yang, J. Changes in grain yield and root morphology and physiology of mid-season rice in the Yangtze River basin of China during the last 60 years. J. Agric. Sci. 2014, 6, 1. [Google Scholar] [CrossRef]
  35. Jackson, M.B. Ethylene and responses of plants to soil waterlogging and submergence. Annu. Rev. Plant Physiol. 1985, 36, 145–174. [Google Scholar] [CrossRef]
  36. Day, K.J.; John, E.A.; Hutchings, M.J. The effects of spatially heterogeneous nutrient supply on yield, intensity of competition and root placement patterns in Briza media and Festuca ovina. Funct. Ecol. 2003, 17, 454–463. [Google Scholar] [CrossRef]
  37. Herzog, M.; Striker, G.G.; Colmer, T.D.; Pedersen, O. Mechanisms of waterlogging tolerance in wheat—A review of root and shoot physiology. Plant Cell Environ. Sci. 2016, 39, 1068–1086. [Google Scholar] [CrossRef]
  38. Setter, T.L.; Waters, I.; Sharma, S.K.; Singh, K.N.; Kulshreshtha, N.; Yaduvanshi, N.P.; Ram, P.C.; Singh, B.N.; Rane, J.; McDonald, G.; et al. Review of wheat improvement for waterlogging tolerance in Australia and India: The importance of anaerobiosis and element toxicities associated with different soils. Ann. Bot. 2009, 103, 221–235. [Google Scholar] [CrossRef]
  39. Liesack, W.; Schnell, S.; Revsbech, N.P. Microbiology of flooded rice paddies. FEMS Microbiol. Rev. 2000, 24, 625–645. [Google Scholar] [CrossRef]
  40. Malik, A.I.; Colmer, T.D.; Lambers, H.; Schortemeyer, M. Changes in physiological and morphological traits of roots and shoots of wheat in response to different depths of waterlogging. Aust. J. Plant Physiol. 2001, 28, 1121–1131. [Google Scholar] [CrossRef]
  41. Pedersen, O.; Sauter, M.; Colmer, T.D.; Nakazono, M. Regulation of root adaptive anatomical and morphological traits during low soil oxygen. New Phytol. 2021, 229, 42–49. [Google Scholar] [CrossRef]
  42. Pang, J.; Zhou, M.; Mendham, N.; Shabala, S. Growth and physiological responses of six barley genotypes to waterlogging and subsequent recovery. Aust. J. Agric. Res. 2004, 55, 895–906. [Google Scholar] [CrossRef]
  43. Dresbøll, D.B.; Thorup-Kristensen, K.; McKenzie, B.M.; Dupuy, L.X.; Bengough, A.G. Timelapse scanning reveals spatial variation in tomato (Solanum lycopersicum L.) root elongation rates during partial waterlogging. Plant Soil 2013, 369, 467–477. [Google Scholar] [CrossRef]
  44. Desnos, T. Root branching responses to phosphate and nitrate. Curr. Opin. Plant Biol. 2008, 11, 82–87. [Google Scholar] [CrossRef]
  45. Paez-Garcia, A.; Motes, C.M.; Scheible, W.-R.; Chen, R.; Blancaflor, E.B.; Monteros, M.J. Root traits and phenotyping strategies for plant improvement. Plants 2015, 4, 334–355. [Google Scholar] [CrossRef]
  46. Rich, S.M.; Watt, M. Soil conditions and cereal root system architecture: Review and considerations for linking Darwin and Weaver. J. Exp. Bot. 2013, 64, 1193–1208. [Google Scholar] [CrossRef]
  47. Su, J.; Jing, G.; Jin, J.; Wei, L.; Liu, J. Identifying drivers of root community compositional changes in semiarid grassland on the loess plateau after long-term grazing exclusion. Ecol. Eng. 2017, 99, 13–21. [Google Scholar] [CrossRef]
  48. King, J.; Gay, A.; Sylvester-Bradley, R.; Bingham, I.; Foulkes, J.; Gregory, P.; Robinson, D. Modelling cereal root systems for water and nitrogen capture: Towards an economic optimum. Ann. Bot. 2003, 91, 383–390. [Google Scholar] [CrossRef]
  49. Comfort, S.; Malzer, G.; Busch, R. Nitrogen fertilization of spring wheat genotypes: Influence on root growth and soil water depletion. Agron. J. 1988, 80, 114–120. [Google Scholar] [CrossRef]
  50. Rubio, G.; Oesterheld, M.; Alvarez, C.R.; Lavado, R.S. Mechanisms for the increase in phosphorus uptake of waterlogged plants: Soil phosphorus availability, root morphology and uptake kinetics. Oecologia 1997, 112, 150–155. [Google Scholar] [CrossRef]
  51. Sauter, M. Root responses to flooding. Curr. Opin. Plant Biol. 2013, 16, 282–286. [Google Scholar] [CrossRef]
  52. Steffens, B.; Rasmussen, A. The physiology of adventitious roots. Plant Physiol. 2016, 170, 603–617. [Google Scholar] [CrossRef]
  53. Wu, B.; Zhang, H.; Wang, D. Timely supplemental irrigation changed nitrogen use of wheat by regulating root vertical distribution. J. Plant Nutr. Soil Sci. 2018, 181, 396–408. [Google Scholar] [CrossRef]
  54. Wang, S.; Yan, Y.; Fu, Z.; Chen, H. Rainfall-runoff characteristics and their threshold behaviors on a karst hillslope in a peak-cluster depression region. J. Hydrol. 2022, 605, 127370. [Google Scholar] [CrossRef]
  55. Pan, Y.; Koopmans, G.F.; Bonten, L.T.; Song, J.; Luo, Y.; Temminghoff, E.J.; Comans, R.N. Influence of pH on the redox chemistry of metal (hydr) oxides and organic matter in paddy soils. J. Soils Sediments 2014, 14, 1713–1726. [Google Scholar] [CrossRef]
  56. Jin, X.; Cui, Z.; Wang, S. Nitrogen mineralization processes of sediment and soil under continuously waterlogged incubation conditions. Chin. J. Soil Sci. 2006, 37, 909–915. [Google Scholar] [CrossRef]
  57. Yang, R.; Tong, J.; Li, J.; Wei, W. Numerical simulation of nitrogen loss in surface runoff and leaching from paddy field. J. Irrig. Drain Eng. 2018, 37, 63–69. [Google Scholar] [CrossRef]
  58. Wang, S.; Zhou, M.; Liu, L. Effect of larmland drainage strategy on nitrogen loss. J. Irrig. Drain Eng. 2013, 32, 138–140. [Google Scholar]
  59. Unger, I.M.; Motavalli, P.P.; Muzika, R.-M. Changes in soil chemical properties with flooding: A field laboratory approach. Agric. Ecosyst. Environ. 2009, 131, 105–110. [Google Scholar] [CrossRef]
  60. Hemati Matin, N.; Jalali, M. The effect of waterlogging on electrochemical properties and soluble nutrients in paddy soils. Paddy Water Environ. 2017, 15, 443–455. [Google Scholar] [CrossRef]
  61. Li, X.; Zhang, W.; Liu, T.; Chen, L.; Chen, P.; Li, F. Changes in the composition and diversity of microbial communities during anaerobic nitrate reduction and Fe (II) oxidation at circumneutral pH in paddy soil. Soil Biol. Biochem. 2016, 94, 70–79. [Google Scholar] [CrossRef]
  62. Wang, R.; Min, J.; Kronzucker, H.J.; Li, Y.; Shi, W. N and P runoff losses in China’s vegetable production systems: Loss characteristics, impact, and management practices. Sci. Total Environ. 2019, 663, 971–979. [Google Scholar] [CrossRef]
  63. He, S.Q.; Gong, Y.B.; Zheng, Z.H.; Luo, Z.T.; Tan, B.; Zhang, Y.Q. Effects of rainfall intensities and slope gradients on nitrogen loss at the seedling stage of maize (Zea mays L.) in the purple soil regions of China. Int. J. Agric. Biol. Eng. 2022, 15, 142–148. [Google Scholar] [CrossRef]
  64. Ma, B.; Guan, R.; Liu, L.; Huang, Z.; Qi, S.; Xi, Z.; Zhao, Y.; Song, S.; Yang, H. Nitrogen loss in vegetable field under the simulated rainfall experiments in Hebei, China. Water 2021, 13, 552. [Google Scholar] [CrossRef]
  65. Reddy, K.R.; DeLaune, R.D.; Inglett, P.W. Biogeochemistry of wetlands: Science and applications. Soil Sci. Soc. Am. J. 2022, 73, 692. [Google Scholar] [CrossRef]
  66. Kinsman-Costello, L.E.; O’Brien, J.; Hamilton, S.K. Re-flooding a historically drained wetland leads to rapid sediment phosphorus release. Ecosystems 2014, 17, 641–656. [Google Scholar] [CrossRef]
  67. Maranguit, D.; Guillaume, T.; Kuzyakov, Y. Effects of flooding on phosphorus and iron mobilization in highly weathered soils under different land-use types: Short-term effects and mechanisms. CATENA 2017, 158, 161–170. [Google Scholar] [CrossRef]
  68. Xiao, M.; Miao, Z.; Li, Y. Changes of Root-Zone Soil Environment in Flooded Paddy Field under Controlled Drainage Conditions. Pol. J. Environ. Stud. 2017, 26, 881–892. [Google Scholar] [CrossRef]
  69. Geng, R. Nitrogen and Phosphorus Forms and Loss Risk in a Typical Artificial Woodland North of Huaibei Plain. Master’s Thesis, Hefei University of Technology, Hefei, China, 2017. [Google Scholar]
  70. Yang, J.; Tang, G.; Li, R.; Yuan, X. Loss of nitrogen and phosphorus from soil and surface water in flooded cropland. J. Irrig. Drain Eng. 2018, 37, 71–77. [Google Scholar] [CrossRef]
  71. Jiao, P.; Xu, D.; Wang, S.; Wang, Y. Nitrogen and Phosphorus Runoff Losses from Farmland Under Nature Rainfall. J. Agro-Environ. Sci. 2010, 29, 534–540. [Google Scholar] [CrossRef]
  72. Fan, C.; Zhang, Y.; Wang, J. Effect of pH on the ultraviolet spectra and fluorescence characteristics of dissolved organic matter in the process of straw humification. Spectrosc. Spect. Anal. 2015, 35, 1933–1937. [Google Scholar] [CrossRef]
  73. Vourlitis, G.L.; Hentz, C.S.; Pinto, O.B.; Carneiro, E.; de Souza Nogueira, J. Soil N, P, and C dynamics of upland and seasonally flooded forests of the Brazilian Pantanal. Glob. Ecol. Conserv. 2017, 12, 227–240. [Google Scholar] [CrossRef]
  74. Khan, S.U.; Hooda, P.S.; Blackwell, M.S.; Busquets, R. Effects of drying and simulated flooding on soil phosphorus dynamics from two contrasting UK grassland soils. Eur. J. Soil Sci. 2022, 73, e13196. [Google Scholar] [CrossRef]
  75. Li, W.; Liu, S.; Wang, Y.; Qin, T.; Zhang, X.; Li, C.; Feng, J. Experimental study of rock wool on the farmland soil erosion and crop growth of winter wheat and its comprehensive evaluation. Front. Environ. Sci. 2023, 10, 1090604. [Google Scholar] [CrossRef]
  76. Yang, J.; Liang, J.; Yang, G.; Feng, Y.; Ren, G.; Ren, C.; Han, X.; Wang, X. Characteristics of non-point source pollution under different land use types. Sustainability 2020, 12, 2012. [Google Scholar] [CrossRef]
  77. Li, S.; Wang, X.; Qiao, B.; Li, J.; Tu, J. First flush characteristics of rainfall runoff from a paddy field in the Taihu Lake watershed, China. Environ. Sci. Pollut. Res. 2017, 24, 8336–8351. [Google Scholar] [CrossRef]
  78. Rakotoson, T.; Amery, F.; Rabeharisoa, L.; Smolders, E. Soil flooding and rice straw addition can increase isotopic exchangeable phosphorus in P-deficient tropical soils. Soil Use Manag. 2014, 30, 189–197. [Google Scholar] [CrossRef]
  79. Malik, A.; Ailewe, T.; Erskine, W. Tolerance of three grain legume species to transient waterlogging. AoB Plants 2015, 7, plv040. [Google Scholar] [CrossRef]
  80. Gu, C.; Zhang, S.; Han, P.; Hu, X.; Xie, L.; Li, Y.; Brooks, M.; Liao, X.; Qin, L. Soil Enzyme Activity in Soils Subjected to Flooding and the Effect on Nitrogen and Phosphorus Uptake by Oilseed Rape. Front. Plant Sci. 2019, 10, 368. [Google Scholar] [CrossRef]
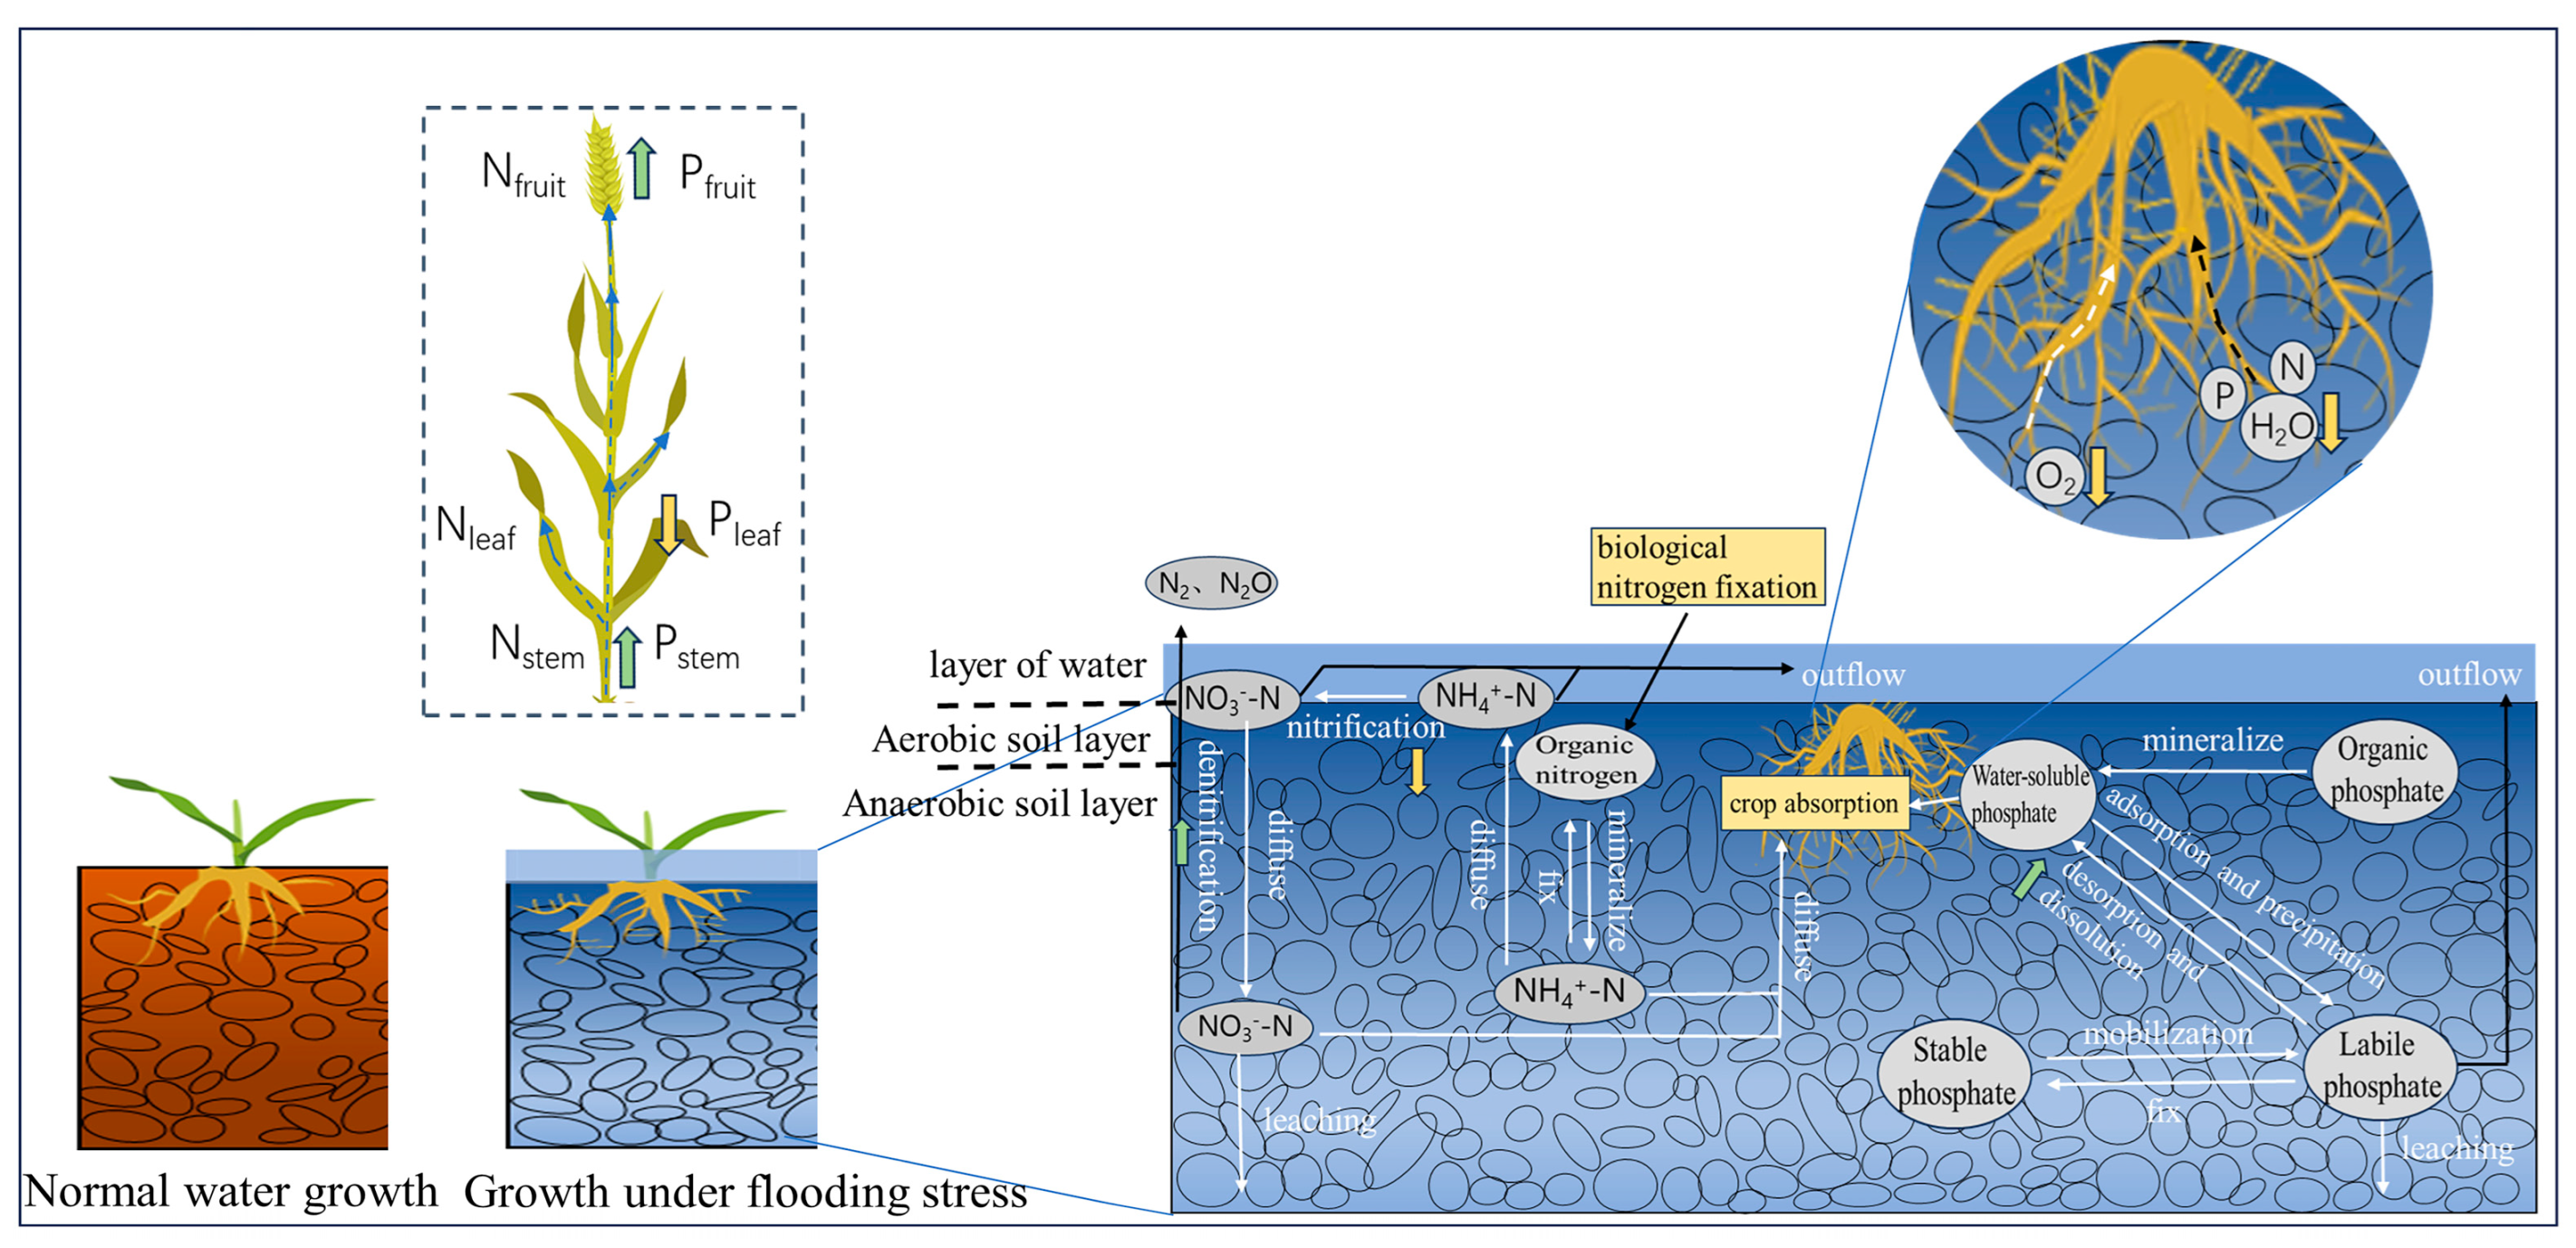
Figure 1. Scientific hypothesis diagram.
Agronomy 14 01247 g001
Figure 2. Overview of the experimental plot.
Agronomy 14 01247 g002
Figure 3. Experimental plot plan.
Agronomy 14 01247 g003
Figure 4. Schematic diagram and observation of minirhizotron.
Agronomy 14 01247 g004
Figure 5. Distribution pattern of winter wheat seedling roots in different soil layers. T1 indicates that the micro-root tube is 0 cm away from the wheat row; T2 is 5 cm away from the wheat row; T3 is 10 cm away from the wheat row. CK: control treatment; WT: waterlogging treatment.
Agronomy 14 01247 g005
Figure 6. The variation characteristics of nitrogen and phosphorus content in soil layer. N = 24. CK: control treatment; WT: waterlogged treatment; STN: soil total nitrogen; STP: soil total phosphorus; SAN: soil alkaline nitrogen; SOP: soil available phosphorus. The numbers represent the soil depth: 0–20 cm, 20–40 cm, and 40–60 cm. At the 0.05 threshold, distinct lowercase letters represent significantly different treatments of the same indicator at different depths. Data are means ± SE (n = 3).
Agronomy 14 01247 g006
Figure 7. Variation characteristics of nitrogen loss concentration in runoff water. WTN: water total nitrogen; WNN: water nitrate nitrogen; WAN: water ammoniacal nitrogen. WAN detection limit: 0.002 mg/L. The samples numbered 1–6 represent water samples collected on the first day of waterlogging stress. Among them, samples 1–4 were taken when the runoff was not stable, while samples 5–6 were collected when the runoff was stable. Samples 7–8 were obtained on the second day of waterlogging stress, and samples 9–10 were collected on the third day of waterlogging stress.
Agronomy 14 01247 g007
Figure 8. Variation characteristics of phosphorus loss concentration in runoff water. WTP: water total phosphorus; DTP: water dissolved phosphorus. The samples numbered 1–6 represent water samples collected on the first day of waterlogging stress. Among them, samples 1–4 were taken when the runoff was not stable, while samples 5–6 were collected when the runoff was stable. Samples 7–8 were obtained on the second day of waterlogging stress, and samples 9–10 were collected on the third day of waterlogging stress.
Agronomy 14 01247 g008
Figure 9. Correlation analysis between root morphology, soil nutrients, and runoff water quality. N (number of samples) = 132. Positive correlation effects are highlighted in red, while negative correlation effects are highlighted in blue. * indicates significance (* p < 0.05, ** p < 0.01). Abbreviated descriptions include root length (RL), root surface area (RS), root volume (RV), soil total nitrogen (STN), soil total phosphorus (STP), soil alkaline nitrogen (SAN), soil available phosphorus (SOP), water total nitrogen (WTN), water total phosphorus (WTP), water dissolved phosphorus (DTP), and water nitrate nitrogen (WNN).
Agronomy 14 01247 g009
Figure 10. RDA ordination diagram of runoff water and soil chemical properties. Abbreviated descriptions include soil total phosphorus (STP), soil total nitrogen (STN), soil alkaline nitrogen (SAN), soil available phosphorus (SOP), water total nitrogen (WTN), water total phosphorus (WTP), water dissolved phosphorus (DTP), and water nitrate nitrogen (WNN).
Agronomy 14 01247 g010
Figure 11. RDA ordination diagram of runoff water quality and winter wheat root morphology. Abbreviated descriptions include root length (RL), root surface area (RS), root volume (RV), root diameter (RD), water total nitrogen (WTN), water total phosphorus (WTP), water dissolved phosphorus (DTP), and water nitrate nitrogen (WNN).
Agronomy 14 01247 g011
Table 1. Background values of soil physical and chemical properties.
STN(g/kg)STP(g/kg)SAN(mg/kg)SOP(mg/kg)SOM(g/kg)pHSP(%)PP(%)CP(%)
0–20 cm0.660.456.627.810.38.041.641.716.7
20–40 cm0.580.334.814.49.18.141.141.317.6
40–60 cm0.600.443.820.37.538.040.642.217.2
Note: Soil total nitrogen (STN); soil total phosphorus (STP); soil alkaline nitrogen (SAN); soil available phosphorus (SOP); soil organic matter (SOM); sand particle (SP); powder particle (PP); clay particles (CP).
Disclaimer/Publisher’s Note: The statements, opinions and data contained in all publications are solely those of the individual author(s) and contributor(s) and not of MDPI and/or the editor(s). MDPI and/or the editor(s) disclaim responsibility for any injury to people or property resulting from any ideas, methods, instructions or products referred to in the content.