Abstract
Drip irrigation is an effective method to utilize waste saline-sodic land with a high water table. For reasonable and sustainable utilization of saline-sodic soil under such conditions, spatiotemporal changes in total nitrogen (TN), total phosphorus (TP), and soil organic matter (SOM) were investigated during the utilization process. The soil was sampled from newly built raised beds before planting (0 y) and beds in three adjacent plots had been planted with Lycium barbarum L. for one (1 y), two (2 y), and three years (3 y), respectively, at the end of the growing season. Soil samples were obtained at four horizontal distances from the drip line (0, 10, 20, and 30 cm) and four vertical soil depths (0–10, 10–20, 20–30, and 30–40 cm). The results showed that the average TN and TP of the soil profile increased with the planting year and were approximately 0.68 and 1.81 g·kg−1 in the soils of 3 y, approximately 84.9 and 42.4% higher than that of 0 y, respectively. SOM decreased in the first growing season and then continuously increased in the following planting years, reaching 8.26 g·kg−1 in the soils of 3 y, which was approximately 38.2% higher than that of 0 y. TN, TP, and SOM contents were high in soils around the drip line and decreased with distance from the drip line. In both horizontal and vertical directions, TN, TP, and SOM varied slightly in soils of 0, 1, and 2 y, while in soils of 3 y, TN and SOM decreased with increased distance in both horizontal and vertical directions and TP decreased obviously only within 10 cm in both directions. This indicated that the contents and distributions of soil nutrients in such saline-sodic soils could be improved with planting year under drip irrigation with local saline groundwater and especially around the drip line as the soil around the dripper was quickly ameliorated.
1. Introduction
The landform of the Yinchuan Plain, located in the Ningxia Hui Autonomous Region, northeast China, consists of the tilted plain of Helan Mountain and the alluvial–proluvial plain of the Yellow River. The Plain dips gently from south to north. It belongs to arid and semiarid regions and is characterized by strong evaporation and low precipitation. In most areas, salts accumulate more than those leached during cultivation, and so saline-sodic soil is widespread in the plain. Local farmers have tried to reclaim and utilize the saline-sodic soils for many years—traditional methods, such as furrow drainage [1,2,3], rice planting or paddy–upland rotation [4,5], and leaching have been used during the reclamation process [6,7]. Results have shown that after long periods of such practices, they succeeded in most areas but failed or were not sustainable along the west side of the Yellow River in the northern part of Yinchuan Plain. In the riverside area, the water table is high, drainage is poor, and seasonal salinization and desalinization frequently alternated due to cultivation and irrigation. In addition, adequate soil drainage, which is in shortage in this area, is considered an essential prerequisite for successful soil amelioration using these methods [8]; therefore, soil salinity in this area worsened after reclamation.
Drip irrigation applies water at a low discharge rate and high frequency, maintains a high water potential in root-zone soil, decreases soil surface evaporation [9,10,11], pushes soil salts toward the fringes of the wetting area, and reduces the concentration of salts in the rooting zone [12]. Drip irrigation could alleviate waterlogging and the raising of the water table as often occurs with surface irrigation or leaching [13] and also prevent the leaf burning caused by sprinkler irrigation with saline water [14]. Furthermore, because of its high application frequency, high matric potential can compensate for the decreasing osmotic potential caused by saline water [10]. In recent years, drip irrigation with fresh water or saline water to utilize saline-sodic soils has been practiced in many areas, and successful achievements, with high production obtained and soil salinity controlled, were reported [15,16,17,18,19].
Based on the previous research and according to the hydrogeological conditions of the riverside, drip irrigation was then employed to utilize the saline-sodic soils along the west side of the Yellow River in the northern part of Yinchuan Plain. Given the condition of no fresh or mild salty water available, leaching of soil salts can be achieved by using abundant highly salty water. Specifically, our drip irrigation system with highly salty groundwater (ECw value at 7.8 dS m−1 or higher) can be used for the enhanced leaching of salts from soils. After several years of this practice, saline-sodic soils were successfully and sustainably utilized: L. barbarum grew very well during the first year and in the following years, and high yield and fruit quality were obtained compared with that planted on productive soil and irrigated with fresh water. This implied that soil was ameliorated during the utilization process.
The feasibility of drip irrigation was the first step in our research, but it is difficult to judge soil quality only from the perspective of crop survival or to provide a basis for how to optimize the irrigation parameters. The evolution of soil quality is the essence of saline-alkali land amelioration. There are many indicators that represent soil quality, including parameters of soil physics, soil chemistry, soil biology, etc. There might be a certain correlation among these indicators. Testing all indicators to comprehensively evaluate changes in soil quality is costly and unnecessary to guide agricultural production. The survival of plants is the most direct indicator, but it is qualitative and does not reflect the changing process of soil quality. Previous studies have shown that there was indeed some association between soil nutrients and soil quality [20,21]. Soil nutrients and soil organic matter (SOM) are soil indicators that directly affect crop growth [22,23,24]. Therefore, they can be used to reflect the changes in soil quality. Studies have shown that the nutrient content of the saline-sodic soil increased due to the improved microbial community structure and C and N cycling in the soil during the ameliorating process [25]. Soil organic matter plays a major role in agricultural soils as an integral part of nutrient cycling, improving soil aggregate stability and soil health, and furthermore, supporting plant production [26]. Research has also shown that soil nutrients and SOM were the material basis of soil fertility, and their content could reflect the availability of soil [27].
Since Lycium barbarum L survived and grew with an increase in planting years, in this study, we hypothesized that in the experiment field, after irrigating with saline water, soil nutrients and soil organic matter (SOM) as important indicators of soil quality might be improved with planting years. The potential for soil utilization could be determined from the viewpoint of soil nutrients and SOM [28]. Therefore, the objectives of this study were to (1) investigate whether the nutrients and SOM contents increased as the soil was irrigated by drip irrigation with saline water and (2) analyze the spatial distribution of nutrients and SOM in the root layer and thus estimate the changes in soil environment conditions. To achieve this goal, soil total nitrogen (TN), total phosphorus (TP), and SOM were monitored and analyzed.
2. Materials and Methods
2.1. Experiment Site
The field experiment was conducted at Lingsha, in Pingluo County, Ningxia Hui Autonomous Region, China (38°59′ N, 106°45′ E, and 1095 m above sea level). The area mainly consists of alluvial–proluvial plains and is characterized by an arid climate. The mean annual temperature is approximately 9 °C. The mean annual precipitation is approximately 185 mm, most of which is received during June–September. The mean annual evaporation is 1825 mm, which is almost ten times the mean annual precipitation. During the test years from 2007 to 2009, the accumulated evaporation in the growing season was 1175.7 mm, 1226.3 mm, and 1279.3 mm, respectively, while precipitation was 141.4 mm, 246.6 mm, and 153.5 mm.
The experiment field was located approximately 4 km from the Yellow River. The soil contained large amounts of salts; the water table was persistently high, with depths of only 30–40 cm below the surface; drainage was poor due to the lack of a feasible drainage system in the area, the presence of a shallow slope, and the high cost of artificial drainage. Fresh water is scarce and the groundwater is highly saline, with total dissolved solids (TDSs) of approximately 7.3 g L−1.
The experimental field was an original saline-sodic soil that had not been exploited, and the water table was approximately 30–40 cm deep. The dominant soil was an aridisol with a silt texture (7.6% sand, 92% silt, and 0.4% clay). The average soil bulk density was 1.32 g·m−3, the gravimetric saturated soil water content was 38.3%, and the SOM content of the 0–40 cm layer was 5.1 g·kg−1. Soil salts mainly accumulated in the surface soil, and the electrical conductivity of the saturated paste extract (ECe) decreased rapidly with depth from 62.3 dS·m−1 (0–10 cm) to <13.5 dS·m−1 (>10 cm) while pH increased from 7.5 to approximately 7.8. Sodium (Na+) was the major cation and chloride (Cl−) was the major anion, representing 87.7% of total cations and 89.5% of total anions in the topsoil (0–10 cm), respectively (as molar ratios) (Table 1).

Table 1.
pH, electrical conductivity of saturated paste extract (ECe), and concentrations of major ions (soil–water = 1:5) in the experimental field.
The groundwater was saline with total dissolved solids of approximately 7.3 g·L−1. The major cation in the groundwater was Na+, accounting for 81.5% of total cations; and the major anions were Cl− and sulfate (SO42−), accounting for 77.7 and 15.0% of total anions, respectively (Table 2).
Table 2.
pH, total dissolved solids (TDS), and ionic concentrations in the irrigation water.
2.2. Agronomic Practice
Before the experiment, the field was a wasteland with sparsely distributed Artemisia anethifolia growing; therefore, experience with the utilization of this site could be a guide for soils in the region. During the utilization process, raised beds (0.8 m high, 75 m long, and 0.6 m wide with a ridge surface) were built with a ridge slope of 58° to relatively lower the groundwater. The distance between the two beds was 3 m. Drip lines with emitters at 0.2 m intervals were placed in the center of each bed. Lycium barbarum L. seedlings were planted adjacent to an emitter at 1-m intervals. Polyethylene mulch, with the same width as the ridge surface, was then applied over the beds along the drip line.
Local saline groundwater was pumped and used as irrigation water to avoid raising the water table by applying externally sourced fresh water, and also to lower the water table as the irrigation water evaporated and was consumed by plants. Irrigation started immediately after mulch covering, with 36 mm of water applied during the first 3 d to decrease the effects of salinity on seedlings. Soils were irrigated twice daily (8:00–10:00 and 18:00–20:00) with a discharge rate of 0.6 L·h−1. At the end of the growing season, approximately 36 mm of water was applied for autumn irrigation to leach soil salts that had accumulated during the growing season and minimize the risk of resalinization during the plants’ dormant stage. Urea, phosphorus acid, and potassium nitrate were fertigated daily with irrigation water from 8:00–10:00. The same irrigation and fertigation scheduling were applied in the following years and also in the newly utilized field. In 2008, irrigation was initiated on 15 April immediately after seeding and implemented according to the irrigation schedule. During the growing season, the irrigation practice was adjusted and suspended when it rained or when the water table was too high following heavy rainfall. Irrigation ceased on 17 October, and the total water applied was approximately 605 mm. Fertigation started on 1 May and ceased on 1 September, with application amounts of approximately 270, 67.5, and 135 kg·ha−1 for urea, phosphorus acid, and potassium nitrate, respectively.
2.3. Experiment Design
The experiment was carried out in 2008 on three adjacent plots: one was originally a wasteland of saline-sodic soil and the other two had been planted for one and two years, respectively. Each plot had an area of 36 m × 75 m that contained 12 beds, with a total area of the experiment field of 0.81 ha. Every four beds were divided as a replicate and each treatment had three replicates. To investigate the changes in soil nutrients during the utilization process according to planting year, soil samples were collected on the newly built bed on the wasteland using an auger (2.5 cm in diameter and 10 cm high) before irrigation (0 y). At the end of the growing season (15 October), soil samples were extracted from the beds planted for one (1 y), two (2 y), and three years (3 y), respectively. The samplings in the bed profile were distributed at four horizontal distances from the drip line (0, 10, 20, and 30 cm) and four vertical soil depths (10 cm intervals within 0–40 cm). There were three replicates of soil samplings from each planting year.
2.4. Measurements
The soil samples were air-dried and passed through a 0.25 mm mesh sieve. The samples were then analyzed for TN (g·kg−1) using the Kjeldahl digestion procedure [29], in which 1.00 g of air-dried soil was weighed and added to 5 mL of concentrated sulfuric acid and then boiled in a digestion furnace. After the sample in the test tube became grayish-white and slightly green, it was boiled for 1 h. After digestion, the sample was cooled and finally distilled. TP (g·kg−1) was determined by molybdenum antimony blue colorimetry after digestion by H2SO4 and HClO4 [30]. SOM (g·kg−1) was determined using the potassium bichromate titrimetric method [31]. One gram of air-dried soil was weighed and added to 5 mL of the K2CrO7 solution of 0.8 mol·L−1, followed by adding 5 mL of concentrated sulfuric acid, and then it was left to stand in a paraffin bath for 5 min. After the sample was transferred to a flask, O-phorphine was added and it was measured via titration.
2.5. Data Analysis
TN, TP, and SOM values for each horizontal position in soils for each planting year were their average contents of all vertical layers under the position; TN, TP, and SOM values for each layer were their average contents of all horizontal positions of the layer.
All data gathered in the study were recorded and classified using Microsoft Office Excel 2023. Analyses of variance (ANOVAs) were conducted using SPSS 26.0 statistical software (SPSS Inc., Chicago, IL, USA). The significance of the effect of all variables was examined by one-way ANOVA. Spatial distributions on the surface according to the distance from the emitters (30 cm) and a depth of 40 cm were created using Surfer 8.0 (Golden Software Inc., Golden, CO, USA).
3. Results
3.1. Spatiotemporal Changes in TN in Soil Profiles
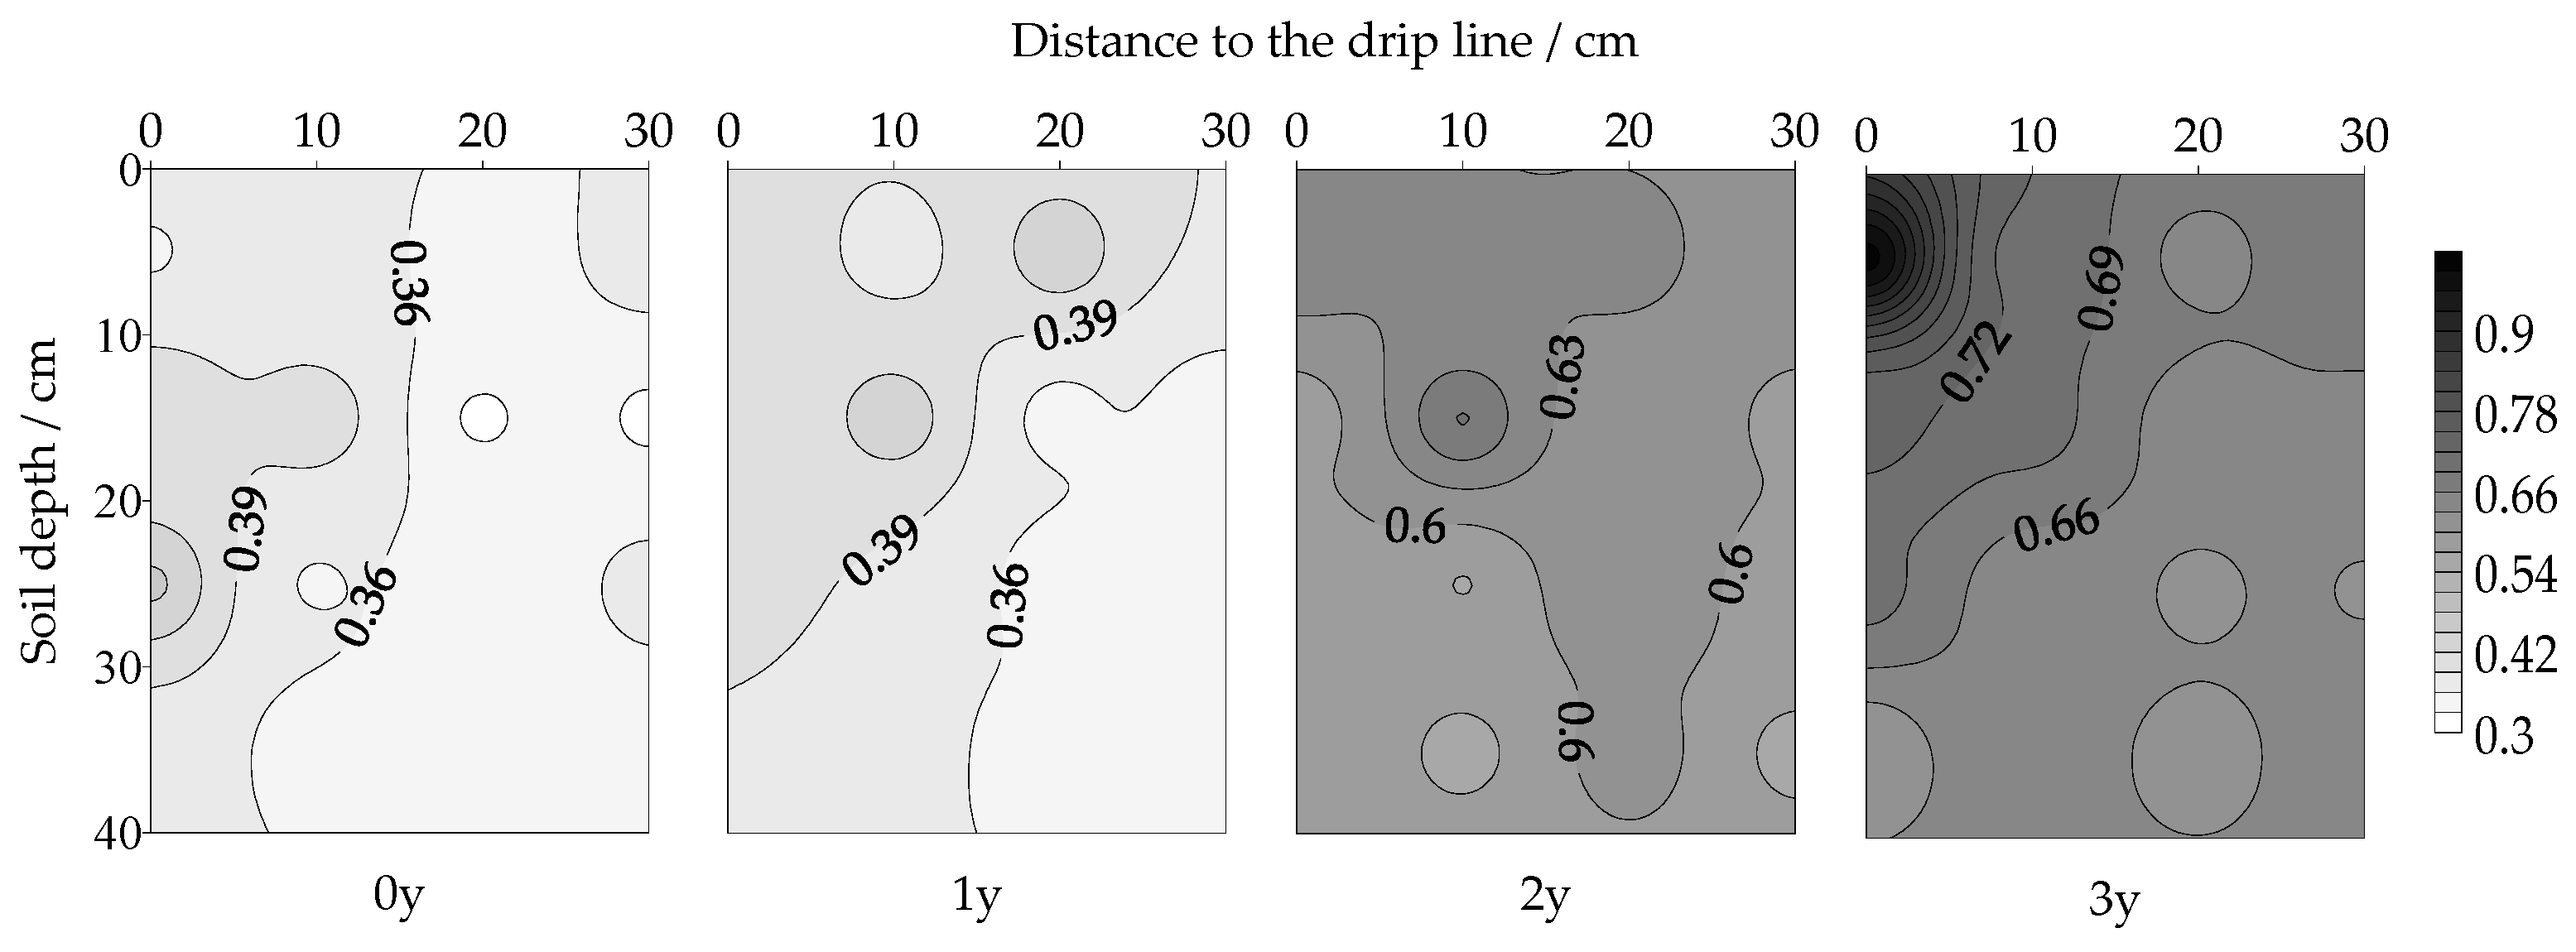
The distribution of TN in soil profiles of 1, 2, and 3 y decreased with distance from the drip tape but was randomly distributed in the soil profile of 0 y (Figure 1). It seemed that the effect of the planting year on the TN distribution in the soil profile was marked during the first growing season as a result of continuous drip irrigation. Once the soil had been planted, the distribution of TN in the soil profile did not vary much in the following years. The gradients of TN in the soil profile increased with planting year (Figure 1), indicating that TN was distributed more unevenly as planting years increased.
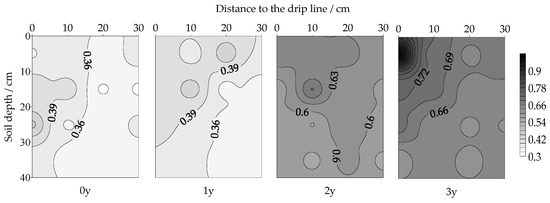
Figure 1.
Distribution of total nitrogen (TN) (g·kg−1) in soil profile for different planting years.
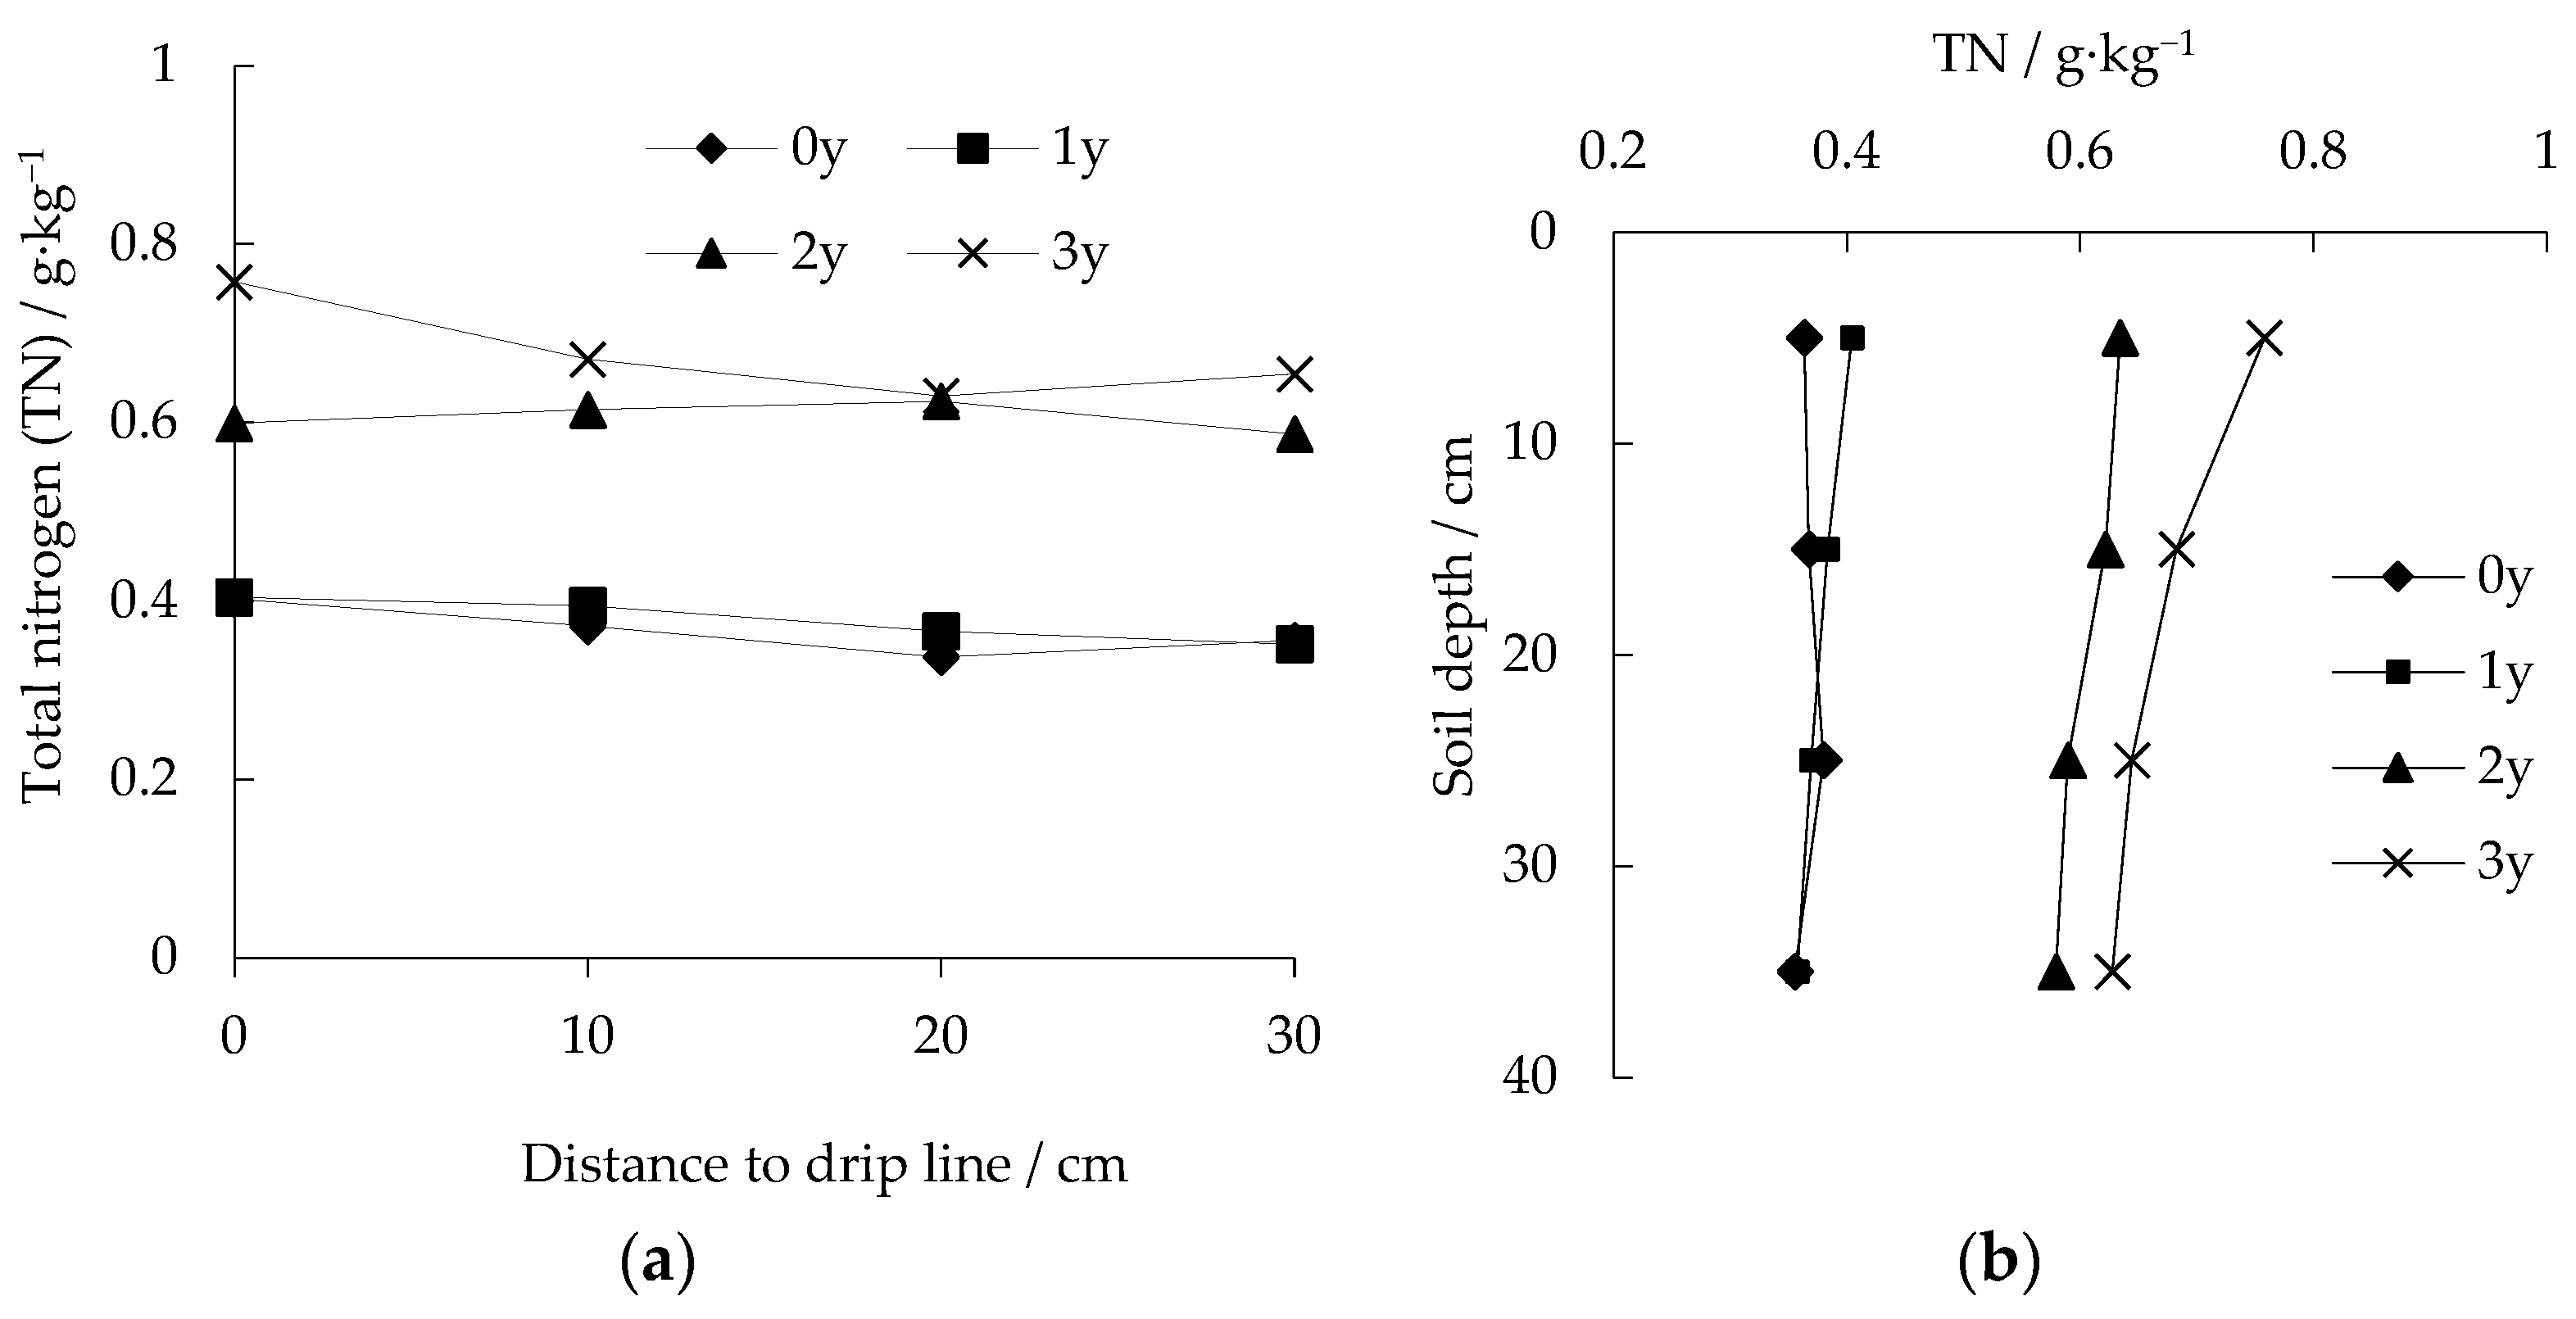
In the horizontal direction, within 30 cm of the drip line, the TN of each position increased slightly during the first growing season; however, TN increased substantially during the second planting year with an increment of >0.2 g·kg−1, and also increased during the third planting year, but with a much more gradual increase as the distance to the drip line increased (Figure 2a). The spatial variation of TN was not obvious in the horizontal direction (Figure 2a). In soils of 0, 1, and 2 y, TN varied within 0.05 g·kg−1, while in soils of 3 y, the TN decreased as the distance to the drip line increased (with variation within 0.1 g·kg−1).

Figure 2.
Changes in TN with horizontal distance (0, 10, 20, and 30 cm) and soil depth (0–10, 10–20, 20–30, and 30–40 cm) for different planting years. (a) Horizontal direction; (b) vertical direction.
Similar to that in the horizontal direction, the TN in all soil layers increased with the planting year. The TN of each soil layer increased slightly (<0.04 g·kg−1) during the first growing season and increased rapidly (approximately 0.22 g·kg−1) during the second planting year. During the third planting year, TN increased markedly by approximately 0.12 g·kg−1 in the top 10 cm layer; however, its increment decreased with soil depth, and in the 30–40 cm layer, TN increased by only approximately 0.05 g·kg−1 (Figure 2b). The changes in TN between layers in the unplanted soil (0 y) were not obvious, and in the planted soils (1, 2, and 3 y), the TN decreased with increased soil depth (Figure 2b). Similar to the variation in the horizontal direction, TN varied within 0.05 g·kg−1 in a vertical direction in soils of 0, 1, and 2 y, but within 0.13 g·kg−1 in soils of 3 y.
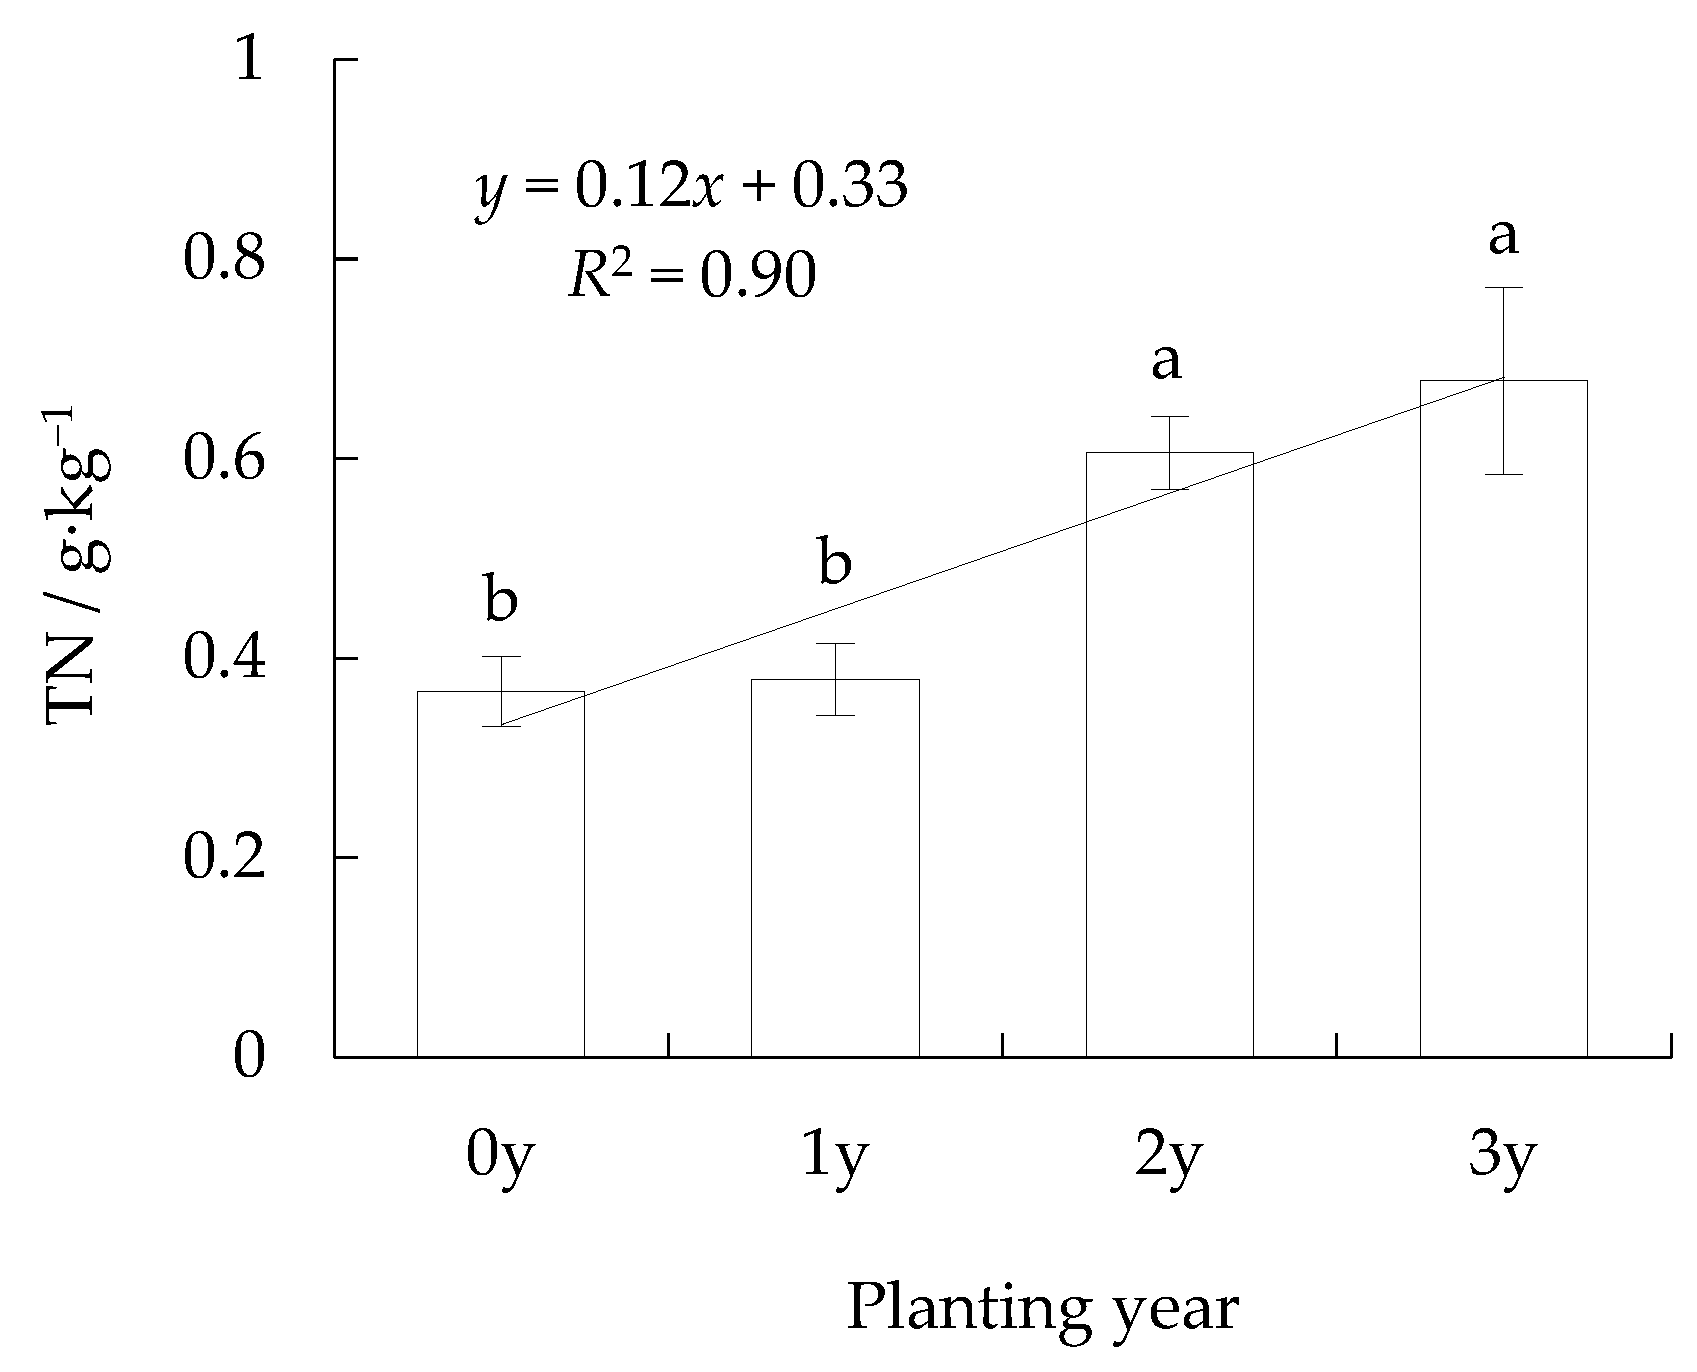
The average TN of the soil profile increased with the planting year (Figure 3). During the first growing season, TN increased slightly; however, in soils of 2 y, TN was larger than for 1 y and increased by approximately 60%; during the third planting year, the increment was less and TN increased by only approximately 0.07 g·kg−1 (i.e., 11.9% of 2 y). Differences between 0 y and 1 y and between 2 y and 3 y were not significant (p < 0.05), while the differences between 0 y and 1 y and between 2 y and 3 y were significant (p < 0.05).
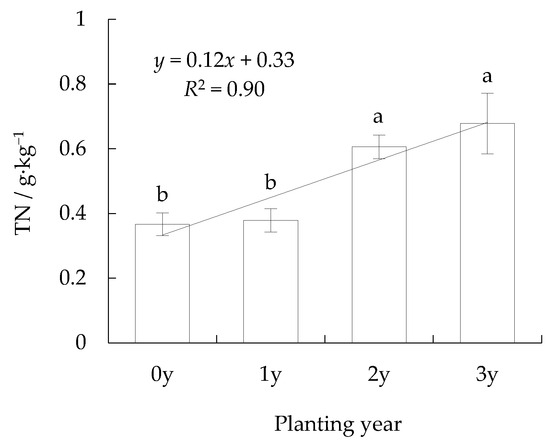
Figure 3.
Changes in average TN of soil profile within planting year (in the fitted function, dependent variable y is the value of corresponding TN and independent variable x stands for planting year; x = 0, 1, 2, 3, 4). Different letters on the error line mean significant correlation at the 0.05 level of probability (bilateral). Error bars indicate standard deviation and specify sample size n = 9.
Regression analysis showed that the relationship between TN of the soil profile and the planting year could be expressed as:
TN = 0.12x + 0.33 R2 = 0.90 p < 0.01
TN is the average TN of the soil profile and x is the planting year, x ∈ {0, 1, 2, 3}.
Surveys showed that, in typical farmland in Pingluo, TN was approximately 1.0 g·kg−1 [32]; therefore, according to the variation tendency, TN of the saline-sodic soil would reach levels of typical farmland after another three years.
3.2. Spatiotemporal Changes TP in Soil Profile
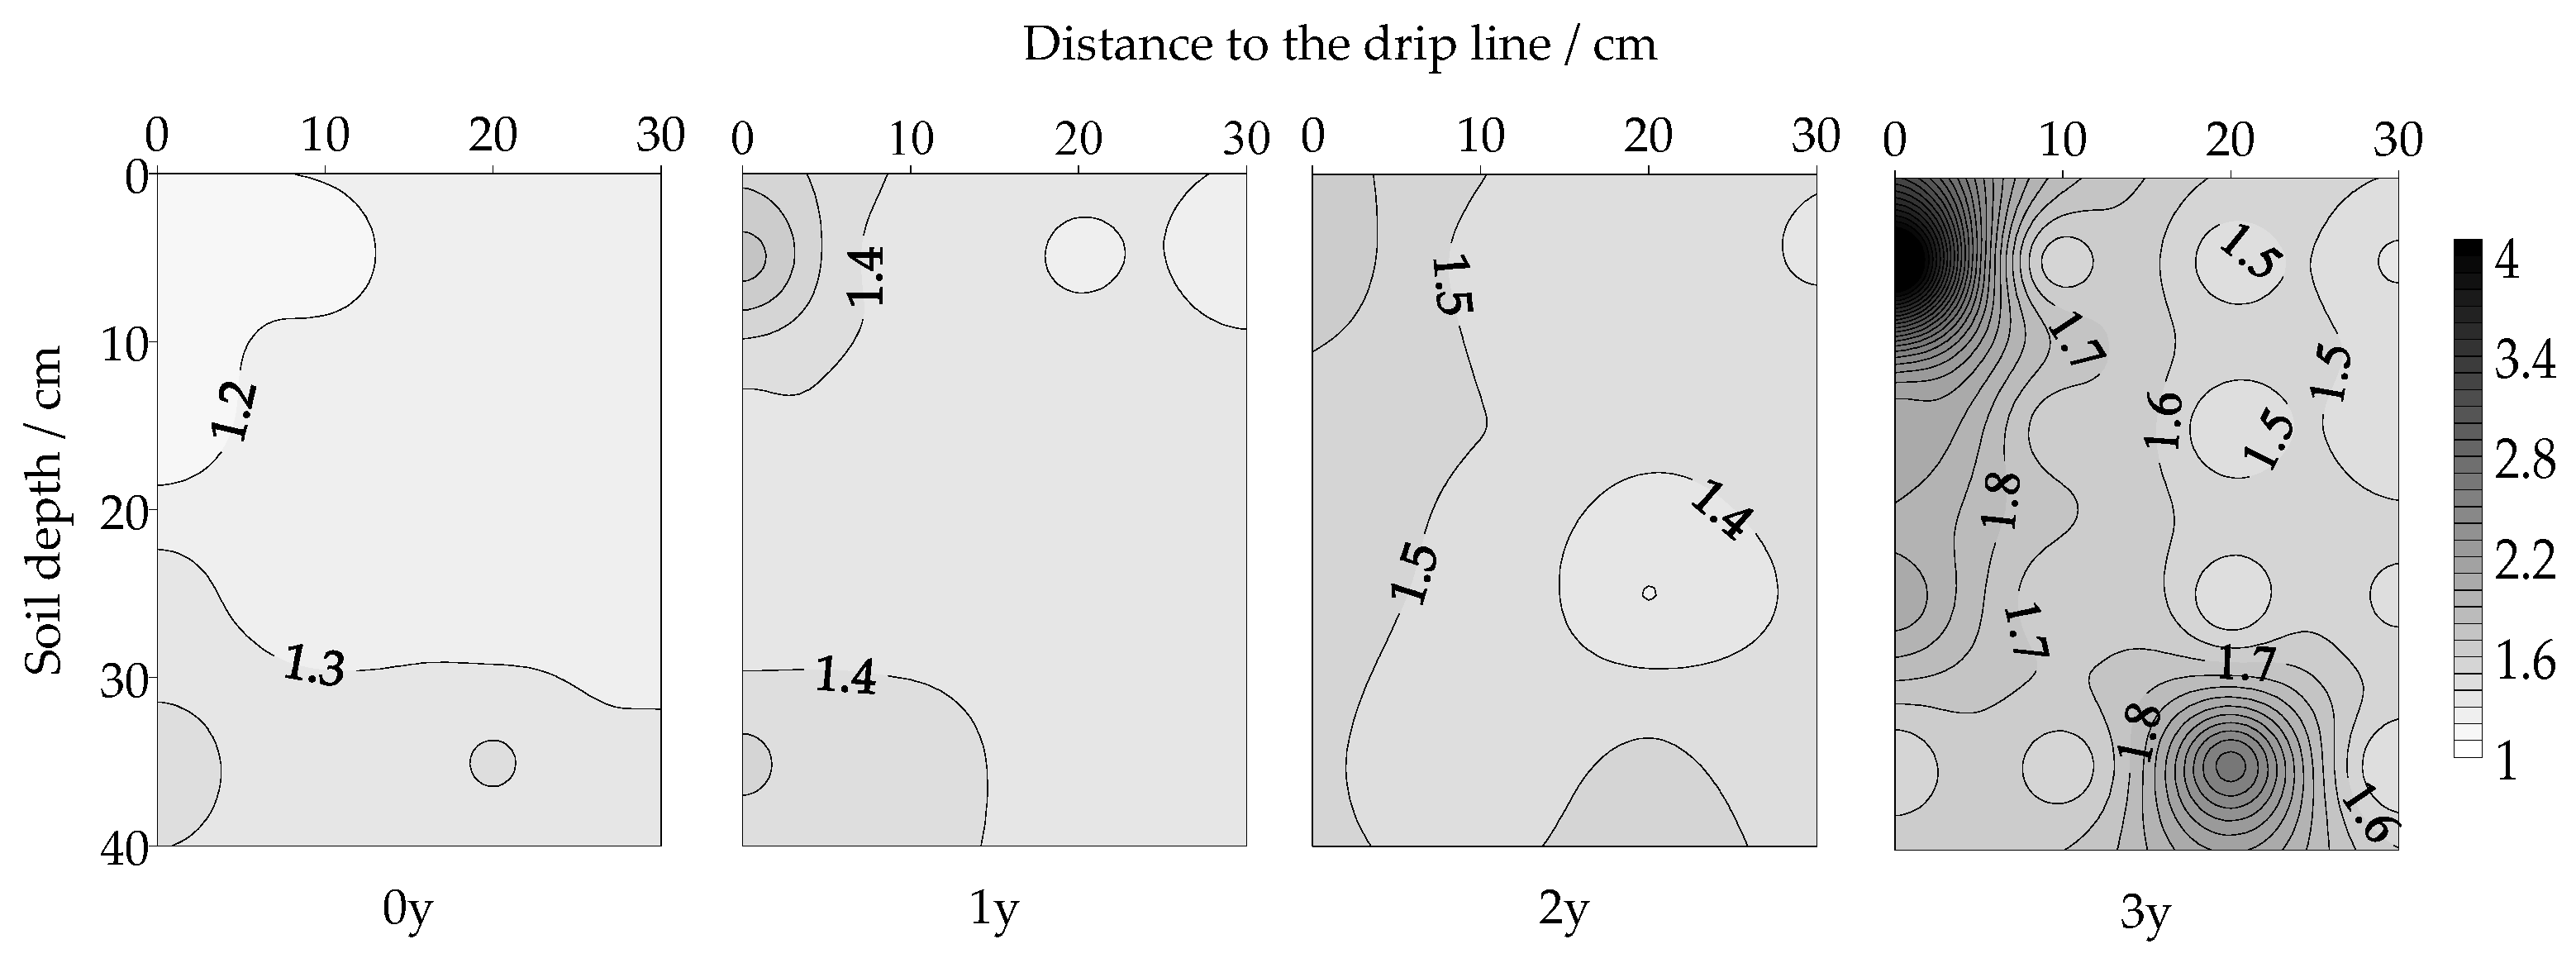
In the profile of unplanted soil, TP was randomly distributed and changed within 0.5 g·kg−1. In soils of 1 y, TP decreased radially from the drip line, and this distribution was relatively stable in the following planting years (Figure 4). The gradient of TP also decreased radially in the soil profiles of 1, 2, and 3 y from the drip line but had a random distribution in the soil profile of 0 y. This indicated that the effect of the planting year on the distribution of TN in the soil profile was high during the first growing season but not thereafter, and that in later years, the influence of the planting year on TN was mainly in changes in content and gradient.
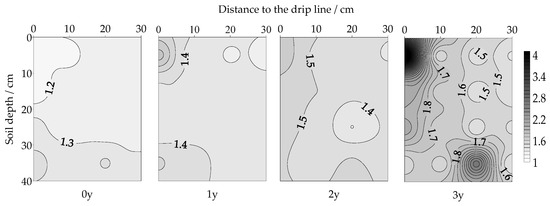
Figure 4.
Distribution of total phosphorous (TP) (g·kg−1) in soil profile for different planting years.
TP increased with planting year at each position in a horizontal direction (Figure 5a). In soils of 1 y, TP increased to 1.49 g·kg−1 immediately under the drip line, approximately 21.7% more than of 0 y; beyond 20 cm from the drip line, the increment decreased with horizontal distance and was not obvious. During the second planting year, in soils within 30 cm of the drip line, TP increased slightly with an increment range of 0.08–0.10 g·kg−1. During the third planting year, the TP of each horizontal position increased more obviously than the previous year, except at 30 cm from the drip line, the farthest position from the drip line, where TP barely changed; however, in soils immediately under the drip line, TP increased rapidly reaching 2.5 g·kg−1, an increase of 59.4% of 2 y. Changes in TP content in the horizontal direction varied with planting year (Figure 5a). In soils of 0 y, TP did not clearly change, with a range of 1.25–1.30 g·kg−1. In soils of 1 and 2 y, TP decreased horizontally with a lower range in variation of approximately 0.16 and 0.13 g·kg−1, respectively. In soils of 3 y, in soils immediately under the drip line, TP was apparently larger than that of other horizontal positions—decreasing rapidly from 2.50 to 1.59 g·kg−1 within 0–10 cm and fluctuating slightly within 10–30 cm.
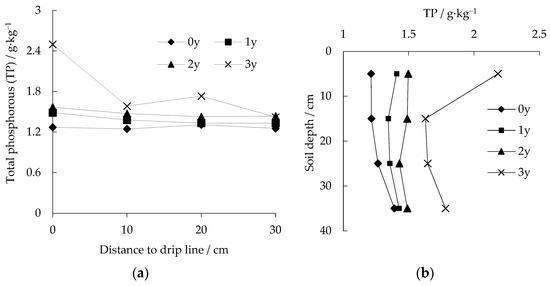
Figure 5.
Changes in TP with horizontal distance (0, 10, 20, and 30 cm) and soil depth (0–10, 10–20, 20–30, and 30–40 cm) for different planting years. (a) Horizontal direction; (b) vertical direction.
In the vertical direction, TP in all soil layers also increased yearly (Figure 5b). During the first growing season, TP of the top 10 cm increased to 116.2% of 0 y, but the increment decreased with soil depth and was only 2.6% for the 30–40 cm layer. During the second planting year, the TP of the 0–20 cm increased more than that of the 20–40 cm layer, and the increments of TP of layers within the depth of 0–40 cm were all <10%. During the third planting year, the increment of TP for each layer was obviously larger than that in previous years, especially in the top 10 cm layer where TP increased by 0.69 g·kg−1, approximately 145.9% compared to that in 2 y. The distribution of TP in a vertical direction varied with planting year (Figure 5b). In soils of 0 y, TP increased with soil depth. In soils of 1 y, TP firstly decreased with soil depth in the top 10 cm and then increased in deeper layers. In soils of 2 y, TP decreased with soil depth in the upper 20 cm layer and then increased deeper than the 20 cm layer. In soils of 3 y, TP in the top 10 cm was obviously larger than in the deeper layers and rapidly decreased within 0–20 cm, from 2.18 to 1.63 g·kg−1 (i.e., a 25.4% reduction)—in the deeper layers, TP increased with depth.
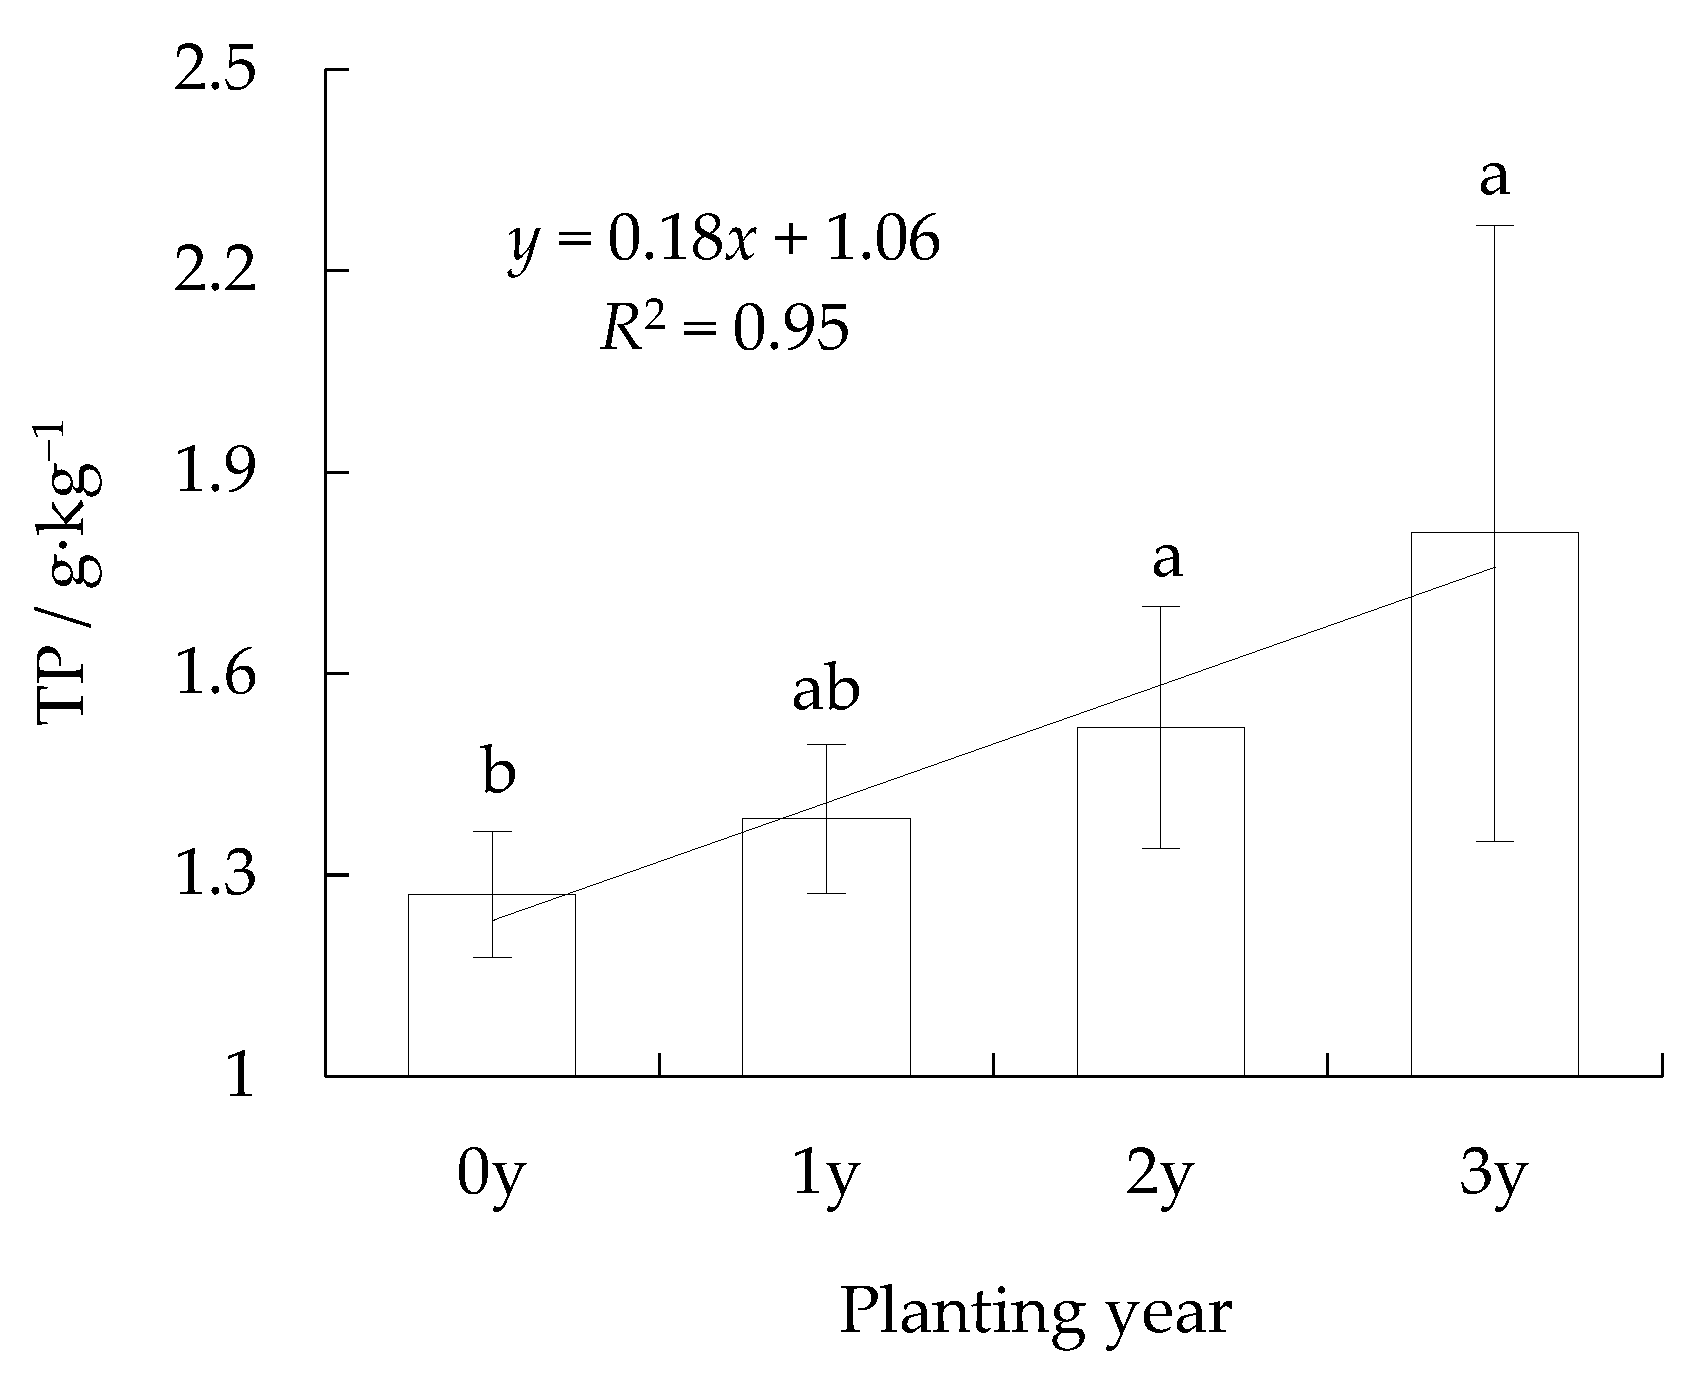
The average TP of the soil profile increased as the planting year increased (Figure 6). The increment was approximately 0.11, 0.14, and 0.29 g·kg−1 during the first, second, and third planting years, respectively, with growth rates of 8.9, 9.9, and 19.1%. The analysis of variance indicated that the TP of 0 y was significantly less than 2 y and 3 y (p < 0.05), and differences between other treatments were not significant (p < 0.05).
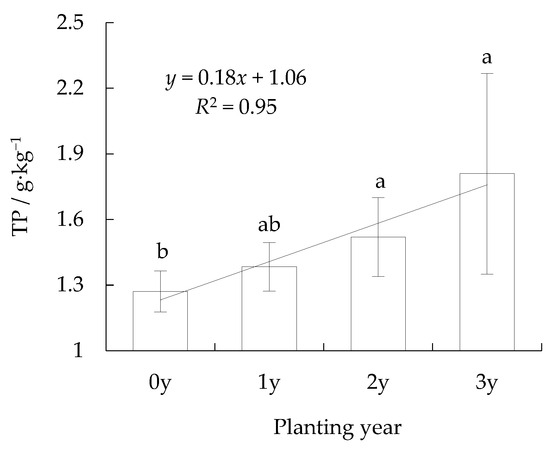
Figure 6.
Changes in average TP of soil profile within planting year (in the fitted function, dependent variable y is the value of corresponding TP and independent variable x stands for planting year; x = 0, 1, 2, 3, 4). Different letters on the error line mean significant correlation at the 0.05 level of probability (bilateral). Error bars indicate standard deviation and specify sample size n = 9.
Regression analysis showed that the relationship between the TP of the soil profile and the planting year could be expressed as:
TP = 0.18x + 1.06 R2 = 0.95 p < 0.01
TP is the average TP of the soil profile and x is the planting year, x ∈ {0, 1, 2, 3}.
Surveys showed that the TP of soils in Ningxia was approximately 0.8 g·kg−1 [33]; thus, TP in the saline-sodic soil was higher than for typical farmland.
3.3. Spatiotemporal Changes in SOM in the Soil Profile
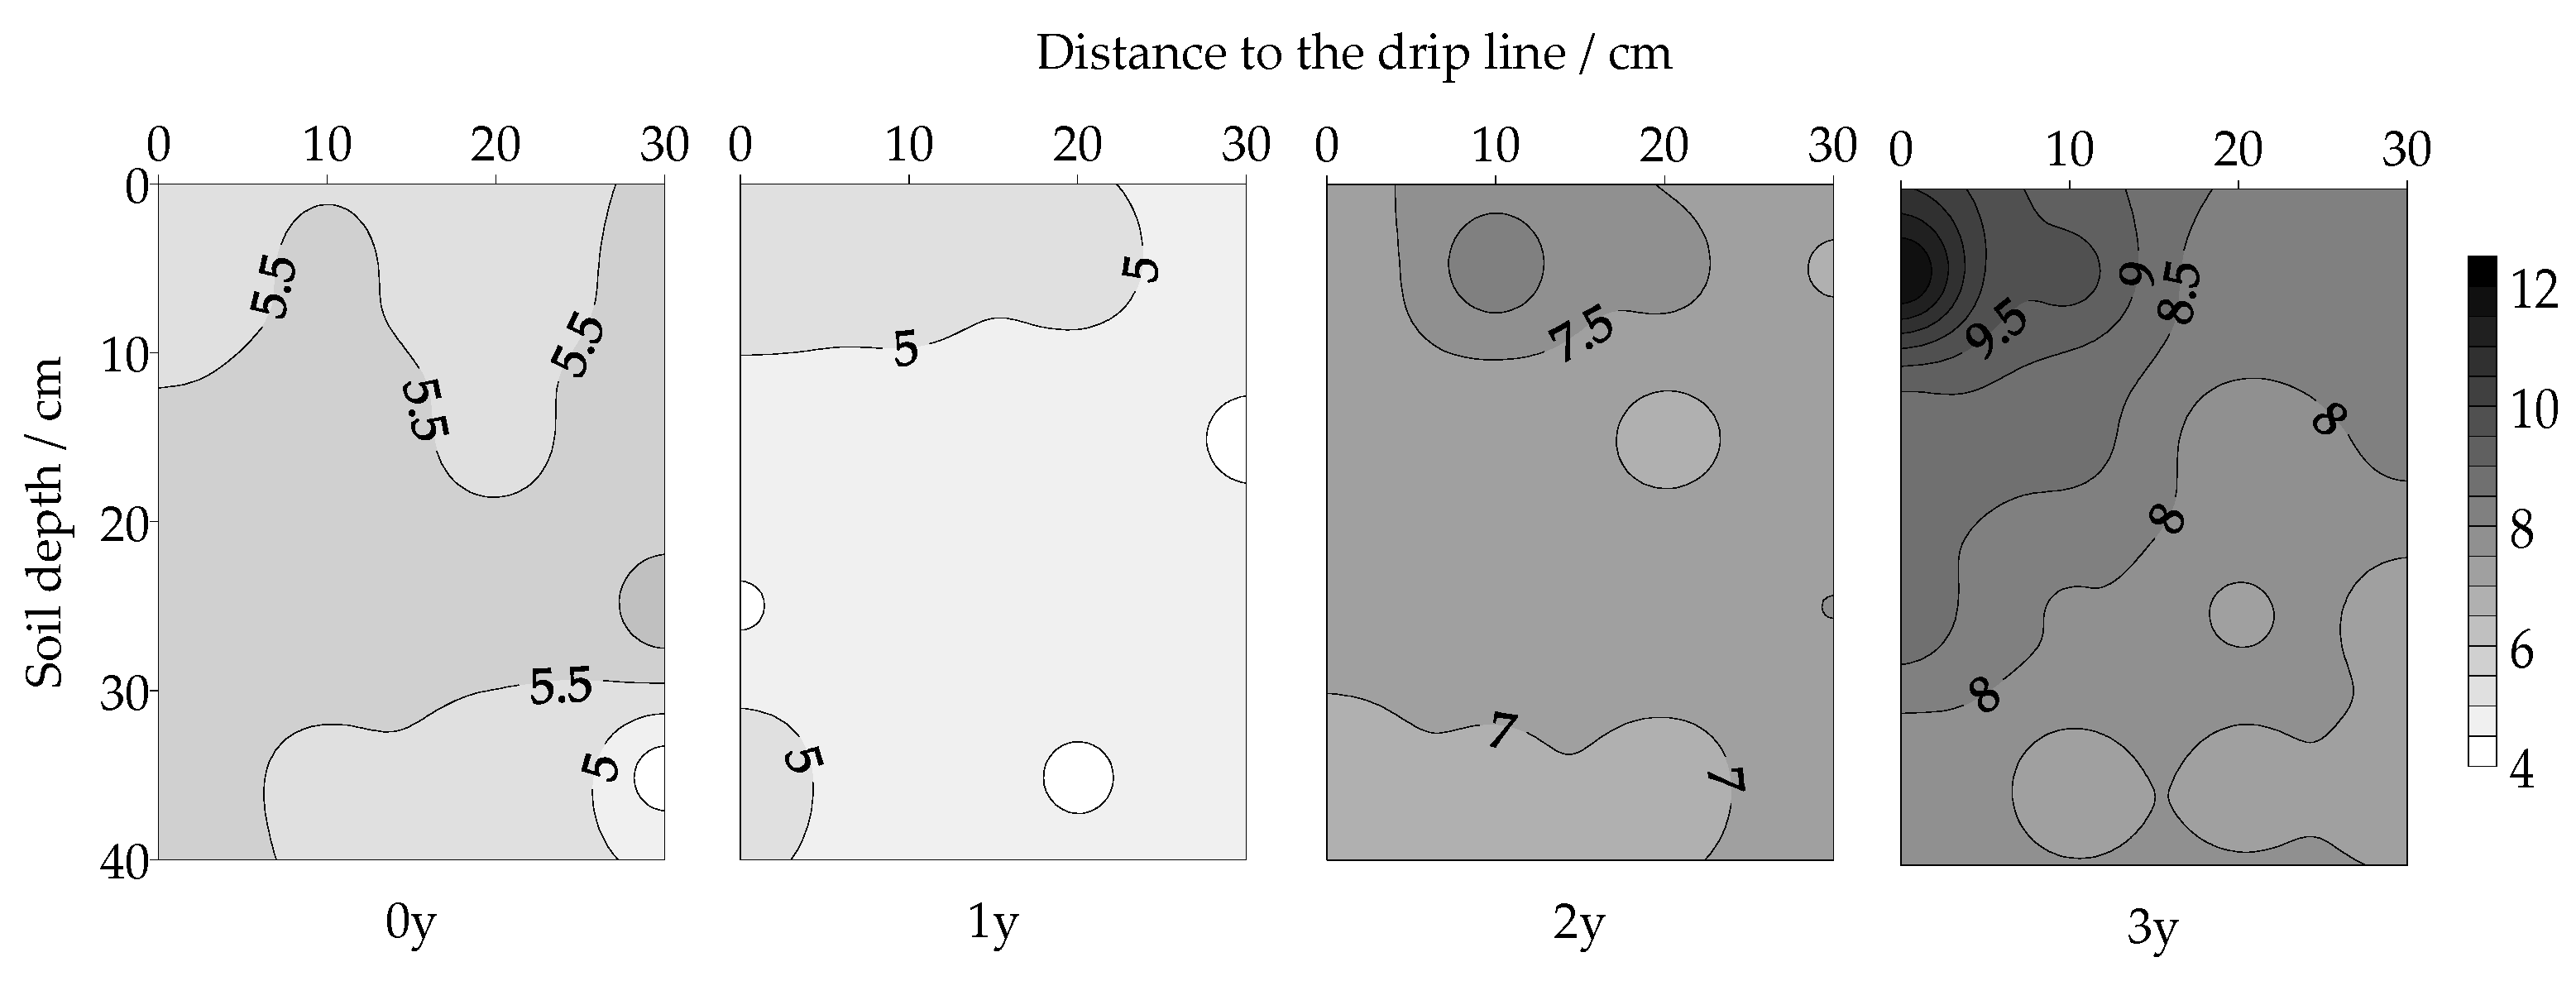
In soils of 0 y, SOM varied within 0.5 g·kg−1 and was randomly distributed in the soil profile (Figure 7). In soils of 1, 2, and 3 y, SOM decreased radially from the area around the drip line and so did its gradient, especially close to the drip line. This indicated that the distribution of SOM, similar to distributions of TN and TP, was mainly formed during the first growing season, and the effects of the planting year on SOM were shown in the increment of SOM content and its gradients in the soil profile.
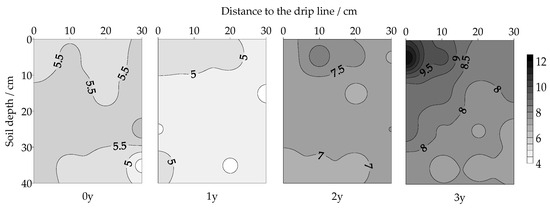
Figure 7.
Distribution of soil organic matter (SOM) (g·kg−1) in soil profile for different planting years.
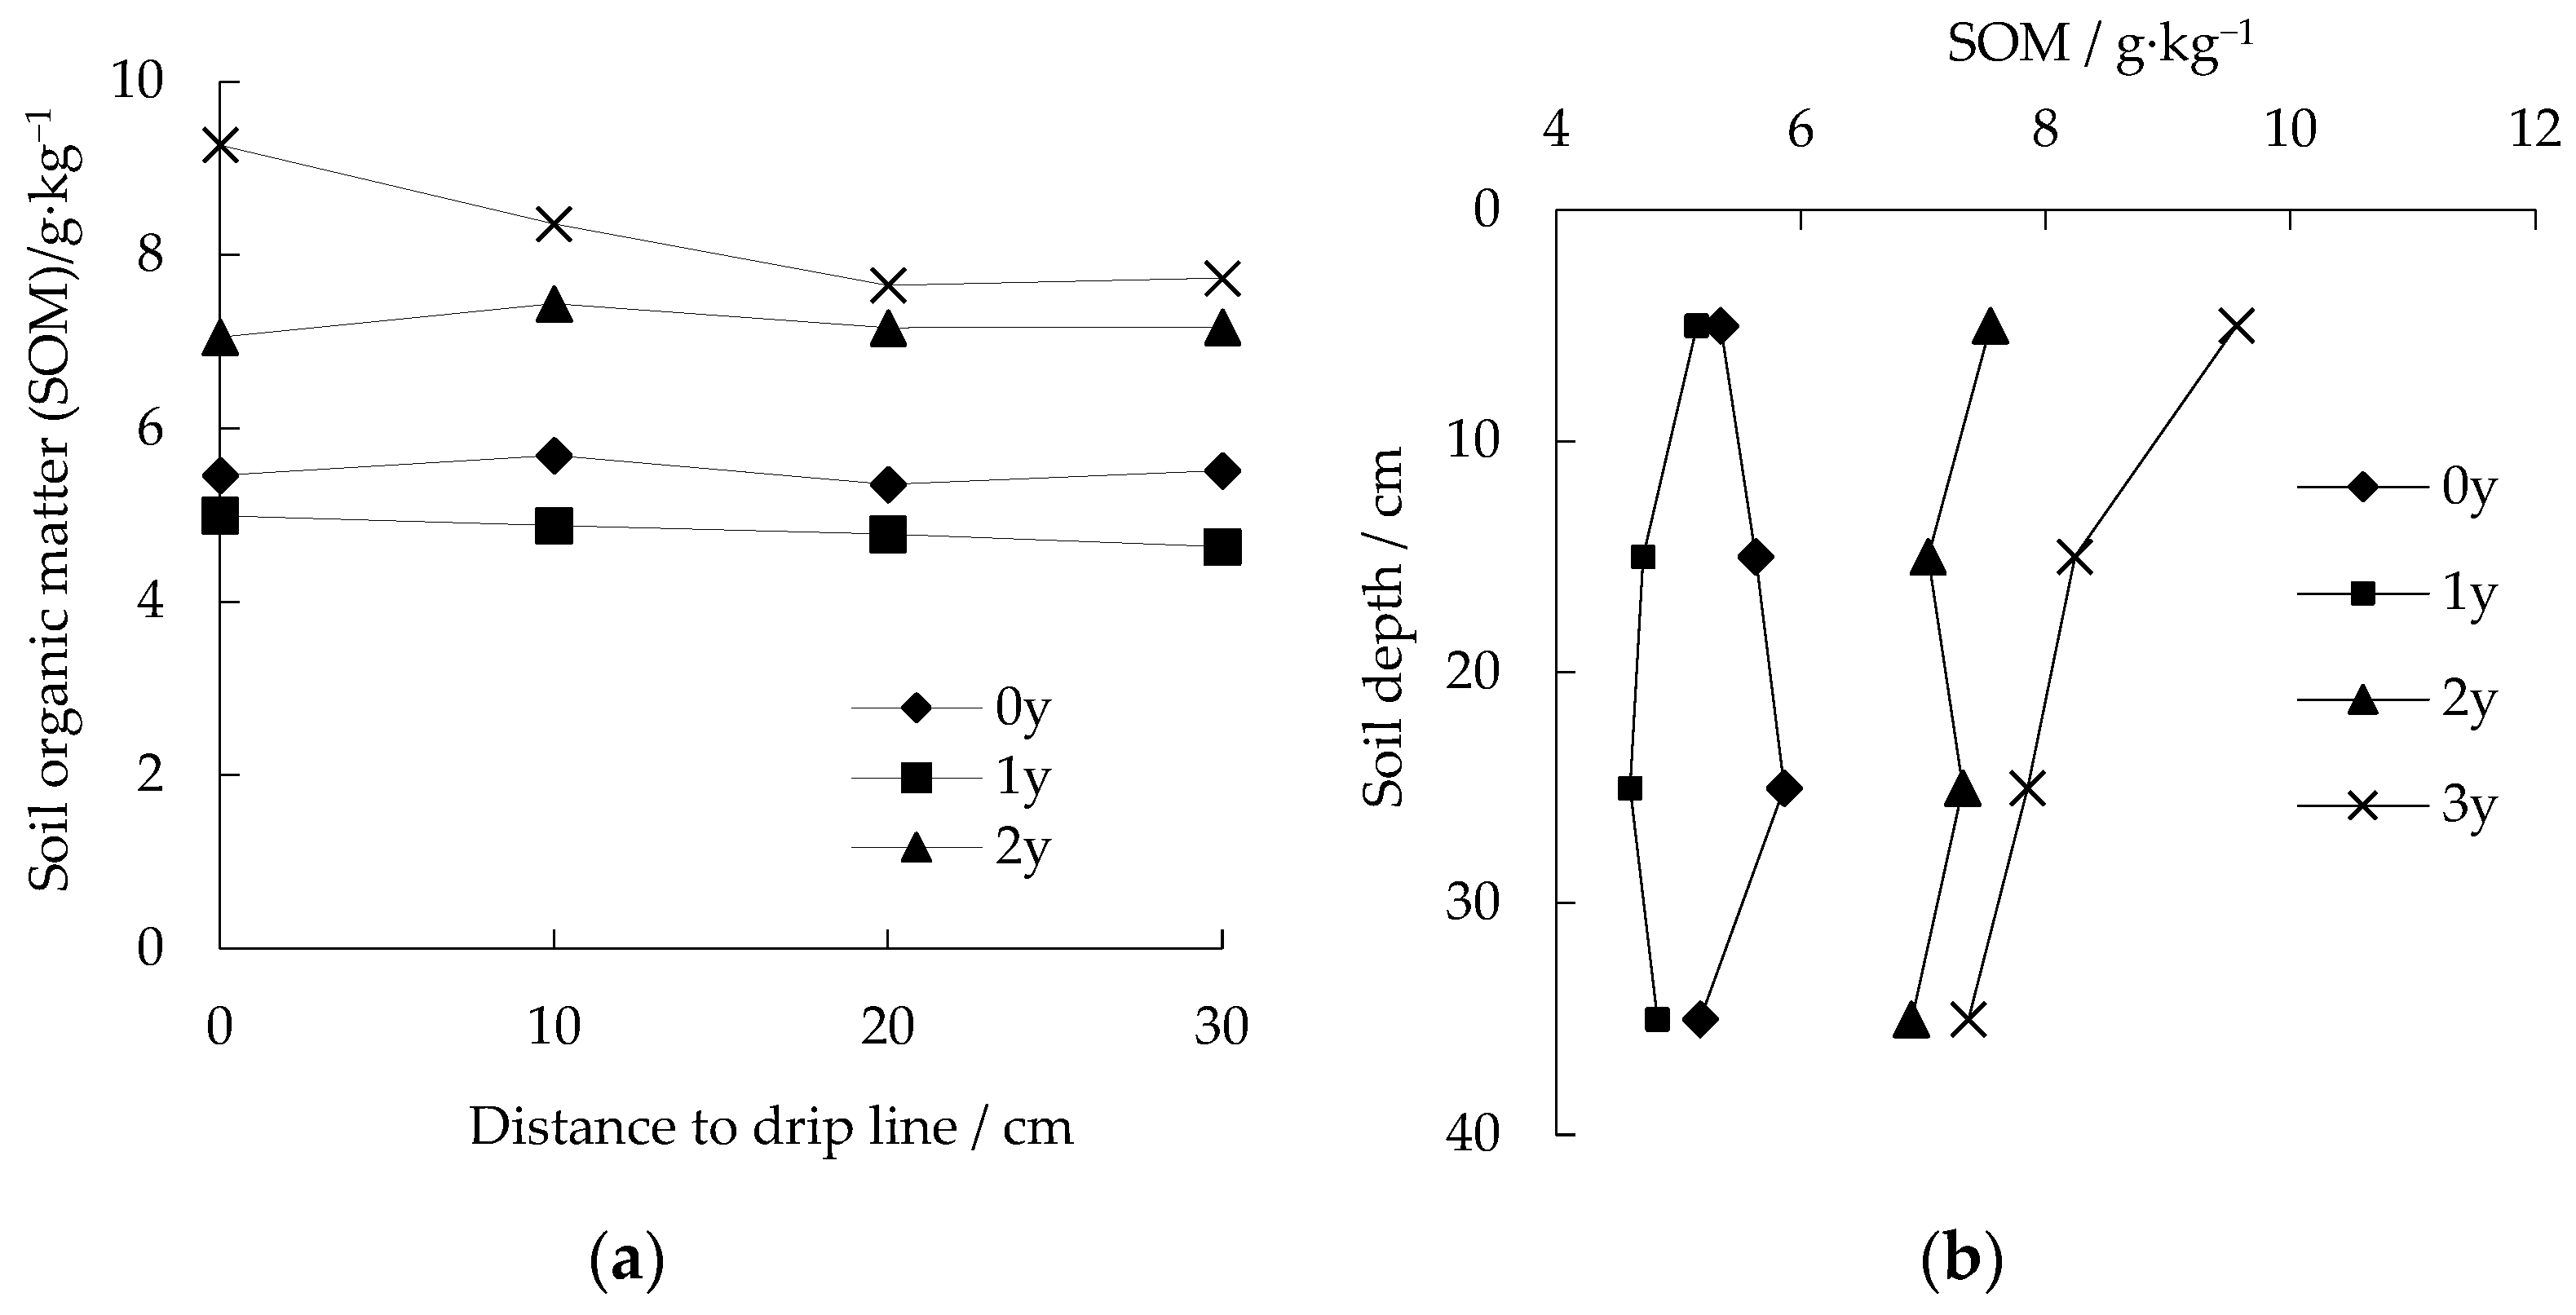
In the horizontal direction, the SOM of each position had the same trend of variation with the planting year, in which it decreased during the first growing season and increased in the following years (Figure 8a). During the first growing season, the changes were clear for the SOM of each position in the horizontal direction, except for the position immediately under the drip line, with a range of reductions in SOM of 0.5–1 g·kg−1. During the second planting year, increments of all positions were within the range 2.0–2.5 g·kg−1 and all changes were clear. During the third planting year, in the soils immediately under the drip line, SOM rapidly increased, with an increment of approximately 2.2 g·kg−1; however, the increment decreased with increased distance from the drip line, and >20 cm was reduced to approximately 0.5 g·kg−1. Differences in SOM content in the horizontal direction were found after soils had been planted for three years (Figure 8a). In soils of 0, 1, and 2 y, SOM changed little with increased distance from the drip line. However, in soils of 3 y, SOM showed a marked decrease within 20 cm of the drip line and only slightly beyond 20 cm; within 30 cm of the drip line, it decreased from 9.27 to 7.65 g·kg−1 (a 17.4% reduction).
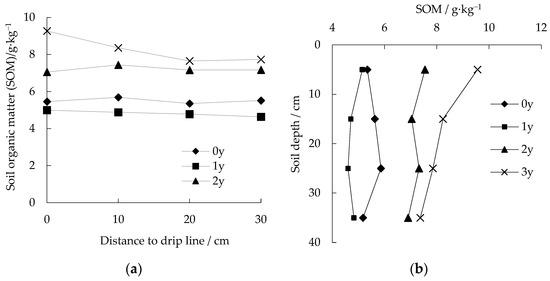
Figure 8.
Changes in SOM with horizontal distance (0, 10, 20, and 30 cm) and soil depth (0–10, 10–20, 20–30, and 30–40 cm) for different planting years. (a) Horizontal direction; (b) vertical direction.
In the vertical direction, the SOM of each soil layer had the same variation tendency with the planting year; however, this decreased during the first growing season and increased in the following years (Figure 8b). The change range of SOM during the second planting year (approximately 2.0–2.7 g·kg−1) was larger than for the other years. During the third year, the SOM increment was unevenly distributed with depth such that SOM decreased as soil depth increased, from 2.0 g·kg−1 in the 0–10 cm layer to 0.5 g·kg−1 in the 20–40 cm layer. Differences in the SOM content in the vertical direction, similar to differences in the horizontal direction, were obvious after soils had been planted for three years. In soils of 3 y, SOM obviously decreased with soil depth from 12 g·kg−1 in the top 10 cm layer to 7.34 g·kg−1 in the 30–40 cm layer (a 22.9% reduction; Figure 8b).
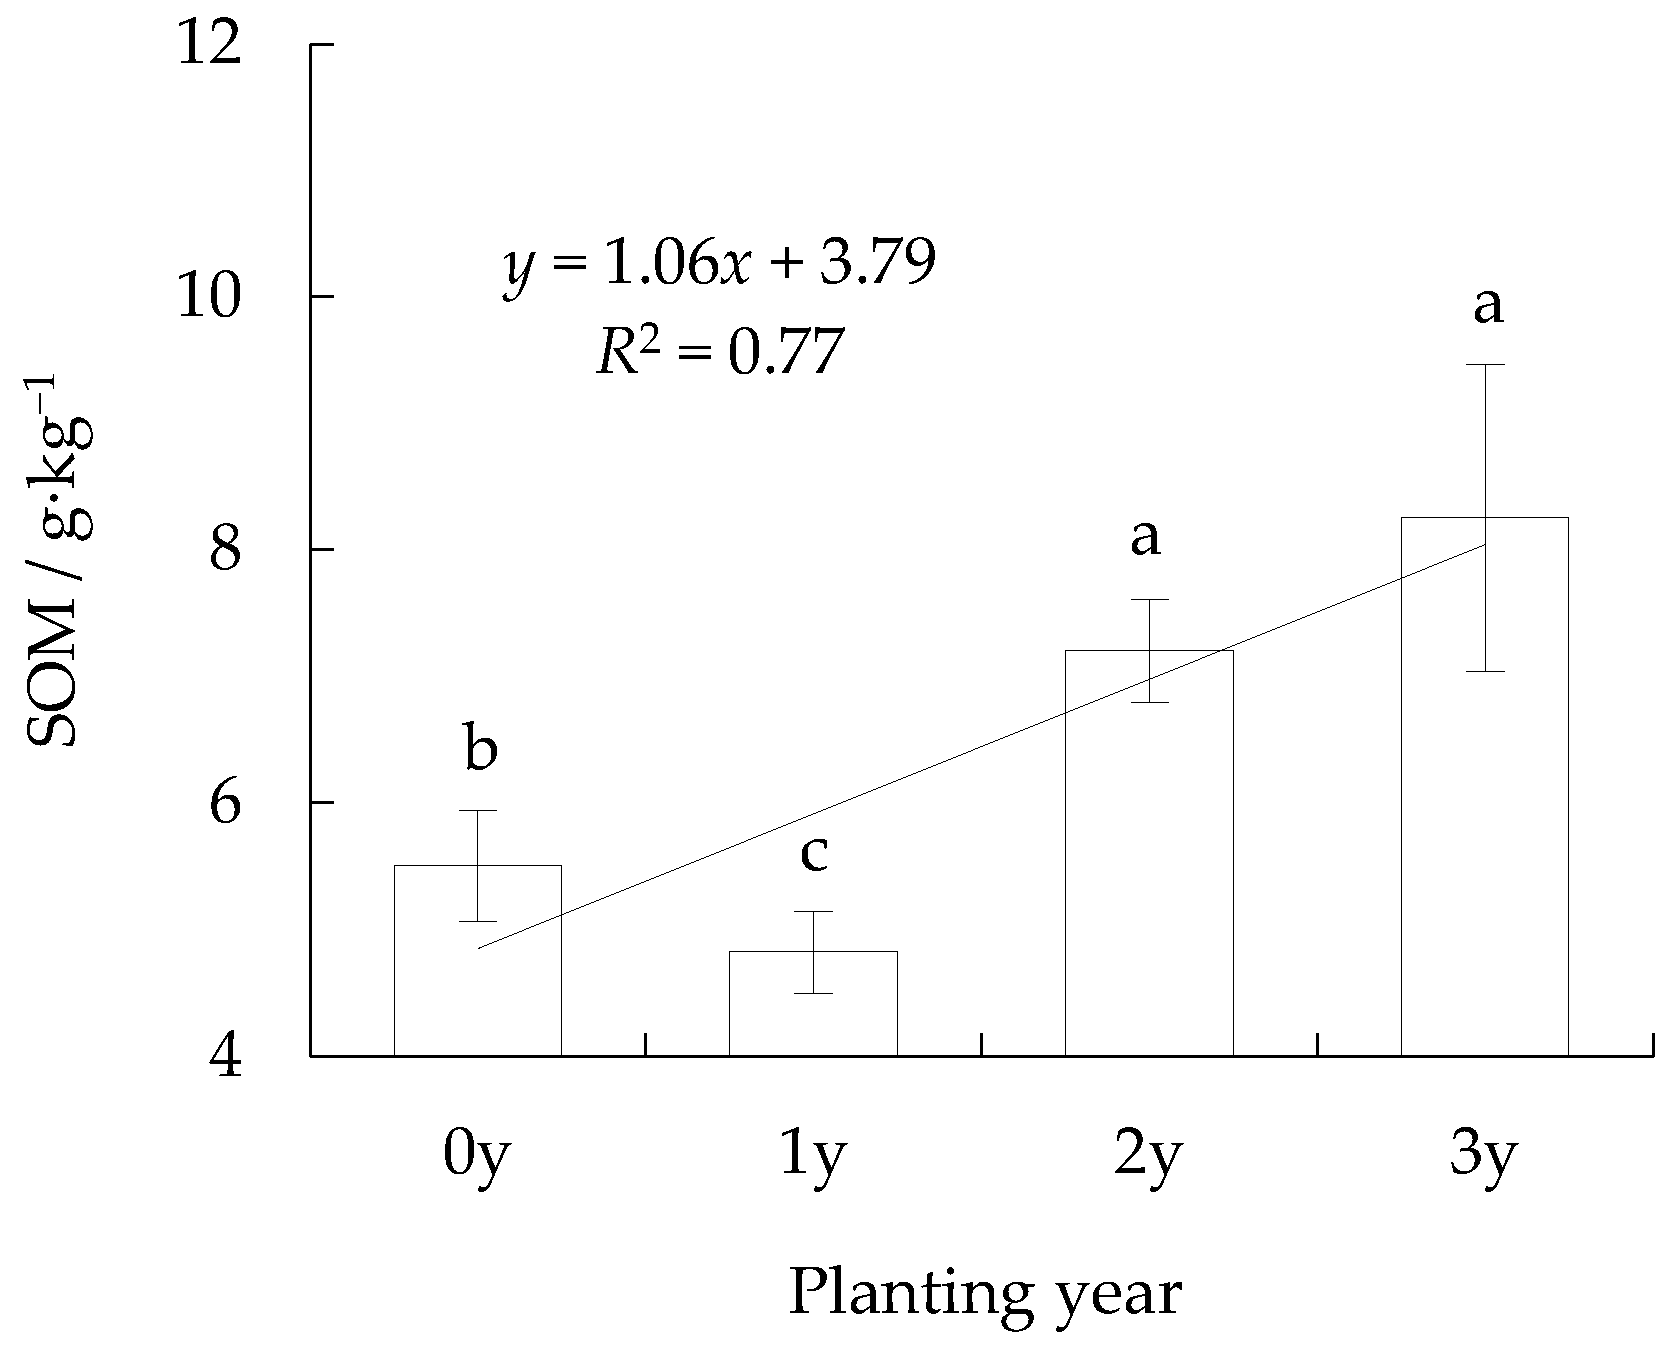
The average SOM content in the soil profile decreased, with a reduction of approximately 0.7 g·kg−1 during the first growing season. During the second planting year, SOM content obviously increased with an increment of approximately 2.4 g·kg−1, approximately 50% more than that of 1 y. During the third planting year, SOM continuously increased but its increment decreased to 1.1 g·kg−1 (Figure 9). The analysis of variance indicated that the SOM of 1 y was significantly less than other years (p < 0.05), and the SOM of 0 y was significantly less than 2 y and 3 y (p < 0.05). The difference between 2 y and 3 y was not significant (p < 0.05).
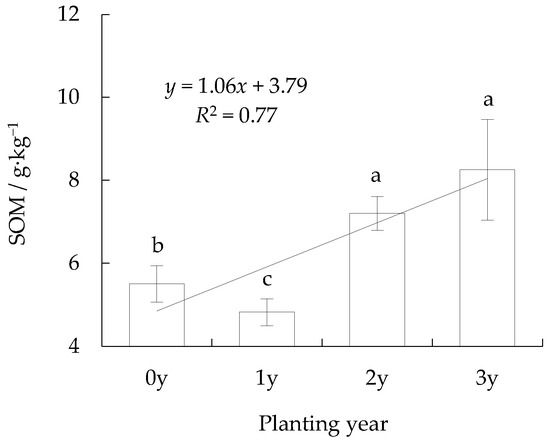
Figure 9.
Changes in average SOM of soil profile within planting year (in the fitted function, dependent variable y is the value of corresponding SOM and independent variable x stands for planting year; x = 0, 1, 2, 3, 4). Different letters on the error line mean significant correlation at the 0.05 level of probability (bilateral). Error bars indicate standard deviation and specify sample size n = 9.
Regression analysis showed that the relationship between the SOM of the soil profile and the planting year could be expressed as:
SOM = 1.06x + 3.79 R2 = 0.77 p < 0.01
SOM is the average SOM of the soil profile and x is the planting year, x ∈ {0, 1, 2, 3}.
Surveys showed that the SOM of typical farmland in Pingluo was approximately 14.0 g·kg−1 [32]; therefore, according to the variation tendency, the SOM of the saline-sodic soil should reach the level of typical farmland after another six years.
4. Discussion
The hallmark of the successful improvement and utilization of saline-sodic soil is that the soil quality gradually improves with the application of the improvement technology, whereby soil structure improves, soil salt content decreases, soil nutrients increase, etc. The improvement of the soil’s physical and chemical properties provided conditions for soil water and fertilizer conservation. Studies have shown that the content of nutrients and organic matter always increases with the age of soil improvement [4,9]. However, some studies have shown that soil nutrients tend to be consumed with an increase in planting years. This depends on the initial soil conditions, the irrigation and fertilization schedule, the regional climate conditions, planting crops, etc.
Nitrogen is one of the major nutrient elements in the soil, and the nitrogen content reflects the soil fertility conditions. Some studies have shown that the soil nitrogen content increased year by year with the improvement of saline-sodic soil, and the increment of the surface layer (0~20 cm) was higher than that of 20~40 cm [34]. Under drip irrigation, the roots of crops were mainly distributed in the surface soil with high moisture content, and the fixation and absorption of soil nitrogen were carried out in the area with high root density, so the soil nitrogen content was rich in the root zone [34]. Meanwhile, the salt content may affect the root growth of crops. The root growth would be inhibited by high soil salt content, and thus the root nitrogen fixation would be inefficient, which increases the risk of nitrogen leaching [35]. TN content increased from 0.3 g·kg−1 to 0.45 g·kg−1 with the increase in planting year duo to the area directly under the emitter gradually desalted [34]. When irrigation water quality varied, the soil nitrogen content changed correspondingly as the leaching water volume changed. In particular, when salt water was used for irrigation, the irrigation amount was an important factor that affected salt accumulation. Only when the irrigation amount reached a certain degree could the upper soil be completely desalted. Therefore, the irrigation amount of salt water should not be too low. Paradoxically, excessive irrigation caused the other extreme, which directly led to the leaching of soil nitrogen [36]. Bowman et al. (2006) pointed out that saltwater irrigation with suitable salinity would not cause the leaching of soil nitrogen and groundwater pollution as long as the irrigation amount was sufficient to prevent the salt in the root area from reaching the level that would be harmful to crops [37]. Our study indicated that TN content in the soil increased with the planting year and was mainly distributed in the wetting body of drip irrigation, findings that are consistent with the above results of previous studies. As there were large numbers of fissures in the newly built beds, urea and nitrate-N were easily leached out of the root layer, and the soil structure might also facilitate the volatilization of ammonium-N into the atmosphere [38,39,40]. Soils, especially around the drip line, may have been continually altered by drip irrigation and swelled, broken, and dispersed, thus impeding the leaching of nitrate and increasing TN in the soil profile [41]. Since saline groundwater was used for drip irrigation in this study, the soil was irrigated at a high frequency to maintain high water potential. Soil water in the wetting body kept moving downward persistently, and soil nitrogen was leached out. However, TN in the wetting body still maintained a high level. This might be because, in this area, the organic N absorbed by crops and soil microorganisms may be the main component of total nitrogen. In addition, the increase in TN of the root layer during the third planting year slowed, possibly due to the uptake by growing plants [42].
P is immobile and easily adsorbed by soil particles, and therefore accumulated around the drip line and did not redistribute uniformly through the soil profile [43,44]. Research has shown that in saline-sodic soil, soil structure was poor before reclamation, and it was ameliorated as the soil was desalted. Since it provided more opportunities for soil particles to absorb phosphate fertilizer, more phosphorus was retained [45,46]. The content of TP was the highest in the layer of 0~10 cm and decreased with soil depth. It increased from 0.6~0.8 g·kg−1 after three years [34]. The results of this paper were consistent with the results of previous studies, as during the earlier planting years, irrigation water moved in larger soil pathways and P was transported with less chance of adsorption. However, during later planting years, irrigation water mainly moved through the macro- and micro-pores of soil and, therefore, a small amount of P moved via matrix flow and mostly accumulated in the surface soil [47]. The accumulation of P increased with planting years as the fertilizer may have exceeded the crop requirements [48,49].
SOM is one of the significant features in soil management. It provides essential information to improve the nutrients of the crops and increase the soil properties in agriculture. After the salt was effectively leached, the growth of plants was gradually vigorous, and the plant residues and roots were preserved in the soil [50] so that SOM increased gradually from 3.3 g·kg−1 to 6 g·kg−1 during the three-year period [34]. The results of this paper were consistent with Wang et al. (2014) except the first planting year. Although the irrigation and planting management practices enhanced soil health and allowed sustained agricultural productivity, SOM decreased during the first growing season, possibly because more was disintegrated than returned under the large soil structure and porosity conditions. This conclusion is consistent with other studies, which reported that soil quality can be greatly degraded after cultivating virgin soils [51]. Soil structure may have been ameliorated during the irrigation practice and surface residues, roots, and SOM may have been maintained in the soil profile as no tillage occurred after planting [52,53]. Therefore, SOM showed a marked increase during the following planting year. The SOM affected by soil nutrients and structure also radially decreased from the drip line in the soil profile [54,55,56].
Changes in TN, TP, and SOM indicated that soil nutrient conditions were promoted yearly, especially around the drip line in which roots mostly spread, and that the distribution of nutrients was favorable for root growth. The variation tendencies of TN, TP, and SOM in the soil profile indicated that the soil nutrient conditions would reach levels of typical farmland after a further six years of utilization. However, during the first growing season, small increments in TN and TP meant that improvements due to the use of soil fertilizer were not obvious and a large part of the fertilizer moved and was leached into deeper layers or shallow groundwater, which might lead to environmental risks at the early stage of utilization [57]. Therefore, fertilization scheduling should be optimized, and less fertilizer should be used during the first growing season.
5. Conclusions
This study examined the changes in TN, TP, and SOM in the root layer during the process of utilization of saline-sodic soils via drip irrigation using saline groundwater. TN, TP, and SOM all had a tendency to increase with the planting year. TN increased slightly during the first season but rapidly increased in the second year. TP kept growing at an average rate of 12.6%. SOM slightly decreased during the first growing season and continuously increased in the following years. At the end of the third year, TP reached the level of typical farmland, while according to linear regression analysis, TN and SOM would reach the level of typical farmland after another three and six years, respectively. The distributions of TN, TP, and SOM were formed during this period, in which all of them decreased radially from the dripper with small gradients. During the second planting year, TN and SOM (and also their gradients) in the profile increased, while the gradient of TP only slightly changed. The increment of TP was obvious during the third planting year. TN and SOM also increased, but less than in the previous year. Meanwhile, TN, TP, and SOM accumulated around the dripper, and their gradients were greater than before. The contents of TN, TP, and SOM around the dripper were higher than the level of typical farmland; therefore, it formed a relatively enriched area of soil nutrients and could offer a better soil environment for crops. In both horizontal and vertical directions, TN, TP, and SOM increased in each horizontal position or vertical layer with the planting year. All indexes decreased as the distance to the drip line increased, and they decreased with increasing soil depth except TP. The distribution characteristics showed that TN, TP, and SOM were prone to accumulating under the drip line and in the surface layer. Overall, the soil quality of such heavy saline-sodic soil improved with the planting year using drip irrigation with local saline groundwater. Though the improvement was slow and might take approximately 6~9 years to reach the level of typical farmland, the soil around the dripper was quickly ameliorated.
Author Contributions
Methodology, C.D.; Investigation, C.D. and Y.S.; Writing—original draft, C.D. and X.C.; Writing—review & editing, C.D., Y.L. (Yuping Lv), Y.S., X.C. and Y.L. (Yan Li); Project administration, C.D. All authors have read and agreed to the published version of the manuscript.
Funding
This research was funded by National Natural Science Fund of China, the grant number was 51609208, and by the Priority Academic Program Development of Jiangsu Higher Education Institutions (PAPD).
Data Availability Statement
The original contributions presented in the study are included in the article, and further inquiries can be directed to the corresponding author.
Conflicts of Interest
The authors declare no conflicts of interest.
References
- Heng, T.; He, X.L.; Yang, L.L.; Xu, X.; Feng, Y. Mechanism of Saline–Alkali land improvement using subsurface pipe and vertical well drainage measures and its response to agricultural soil ecosystem. Environ. Pollut. 2022, 293, 118583. [Google Scholar] [CrossRef] [PubMed]
- Muhammad ESh Ibrahim, M.M.; El-Sayed, A. Effects of drain depth on crop yields and salinity in subsurface drainage in Nile Delta of Egypt. Ain Shams Eng. J. 2021, 12, 1595–1606. [Google Scholar] [CrossRef]
- Mukhopadhyay, R.; Fagodiya, R.K.; Prajapat, K.; Narjary, B.; Kumar, S.; Singh, R.K.; Bundela, D.S.; Barman, A. Sub-surface drainage: A win-win technology for achieving carbon neutrality and land amelioration in salt-affected Vertisols of India. Geoderma Reg. 2023, 35, e00708. [Google Scholar] [CrossRef]
- Du, X.J.; Hu, H.; Wang, T.H.; Zou, L.; Zhou, W.F.; Gao, H.X.; Ren, X.Q.; Wang, J.; Hu, S.W. Long-term rice cultivation increases contributions of plant and microbial-derived carbon to soil organic carbon in saline-sodic soils. Sci. Total Environ. 2023, 904, 166713. [Google Scholar] [CrossRef]
- Xu, Z.K.; Shao, T.Y.; Lv, Z.X.; Yue, Y.; Liu, A.H.; Long, X.H.; Zhou, Z.S.; Gao, X.M.; Rengel, Z. The mechanisms of improving coastal saline soils by planting rice. Sci. Total Environ. 2020, 703, 135529. [Google Scholar] [CrossRef] [PubMed]
- Guo, K.; Liu, X. Salt leaching process in coastal saline soil by infiltration of melting saline ice under field conditions. J. Soil. Water Conserv. 2020, 75, 549–562. [Google Scholar] [CrossRef]
- Zhang, C.; Li, X.; Kang, Y.; Wang, X. Salt leaching and response of Dianthus chinensis L. to saline water drip-irrigation in two coastal saline soils. Agric. Water Manag. 2019, 218, 8–16. [Google Scholar] [CrossRef]
- Singh, A. Soil salinization management for sustainable development: A review. J. Environ. Manag. 2021, 277, 111383. [Google Scholar] [CrossRef] [PubMed]
- Rajput, T.B.S.; Patel, N. Water and nitrate movement in drip-irrigated onion under fertigation and irrigation treatments. Agric. Water Manag. 2006, 79, 293–311. [Google Scholar] [CrossRef]
- Dou, C.Y.; Kang, Y.H.; Wan, S.Q.; Hu, W. Soil salinity changes under cropping with Lycium barbarum L. and irrigation with saline-sodic water. Pedosphere 2011, 21, 539–548. [Google Scholar] [CrossRef]
- Wang, R.S.; Kang, Y.H.; Wan, S.Q. Effects of different drip irrigation regimes on saline–sodic soil nutrients and cotton yield in an arid region of Northwest China. Agric. Water Manag. 2015, 153, 1–8. [Google Scholar] [CrossRef]
- Kahlon, M.S.; Josan, A.S.; Khera, K.L. A comparative study on soil and plant parameters under furrow and drip irrigated tomatoes with poor quality water. Res. Crop 2008, 9, 61–72. [Google Scholar]
- Singh, A. Waterlogging and salinity management for sustainable irrigated agriculture. I: Overview, implication, and plant response. J. Irrig. Drain. Eng. 2017, 143, 04017035. [Google Scholar] [CrossRef]
- Yan, H.J.; Hui, X.; Li, M.N.; Xu, Y.C. Development in sprinkler irrigation technology in China. Irrig. Drain. 2020, 69, 75–87. [Google Scholar] [CrossRef]
- Dong, S.D.; Wang, G.M.; Kang, Y.H.; Ma, Q.; Wan, S.Q. Soil water and salinity dynamics under the improved drip-irrigation scheduling for ecological restoration in the saline area of Yellow River basin. Agric. Water Manag. 2022, 264, 107255. [Google Scholar] [CrossRef]
- Kang, Y.H.; Chen, M.; Wan, S.Q. Effects of drip irrigation with saline water on waxy maize (Zea mays L. var. ceratina Kulesh) in North China Plain. Agric. Water Manag. 2010, 97, 1303–1309. [Google Scholar] [CrossRef]
- Dong, S.D.; Wan, S.Q.; Kang, Y.H.; Sun, J.X. Effect of different soil matric potentials on distribution of soil salt and growth of Poplar (Populus) by drip irrigation in low-lying saline area. J. Soil. Water Conserv. 2017, 31, 236–247. [Google Scholar] [CrossRef]
- Dong, S.D.; Wan, S.; Kang, Y.; Li, X.B. Prospects of using drip irrigation for ecological conservation and reclaiming highly saline soils at the edge of Yinchuan Plain. Agric. Water Manag. 2020, 239, 106255. [Google Scholar] [CrossRef]
- Li, D.; Wan, S.; Li, X.; Kang, Y.; Han, X. Effect of water-salt regulation drip irrigation with saline water on tomato quality in an arid region. Agric. Water Manag. 2022, 261, 107347. [Google Scholar] [CrossRef]
- Merril, S.D.; Liebig, M.A.; Tanaka, D.L.; Krupinsky, J.M.; Hanson, J.D. Comparison of soil quality and productivity at two sites differing in profile structure and topsoil properties. Agric. Ecosyst. Environ. 2013, 179, 53–61. [Google Scholar] [CrossRef]
- Askari, M.S.; Holden, N.M. Quantitative soil quality indexing of temperate arable management systems. Soil. Tillage Res. 2015, 150, 57–67. [Google Scholar] [CrossRef]
- Sun, Z.X.; Zheng, J.M.; Sun, W.T. Coupled effects of soil water and nutrients on growth and yields of maize plants in a Semi-Arid region. Pedosphere 2009, 19, 673–680. [Google Scholar] [CrossRef]
- Chen, Y.; Jiang, Z.; Ou, J.; Liu, F.; Cai, G.; Tan, K.; Wang, X. Nitrogen substitution practice improves soil quality of red soil (Ultisols) in South China by affecting soil properties and microbial community composition. Soil. Till Res. 2024, 240, 106089. [Google Scholar] [CrossRef]
- Bouras, H.; Mamassi, A.; Devkota, K.P.; Choukr-Allah, R.; Bouazzama, B. Integrated effect of saline water irrigation and phosphorus fertilization practices on wheat (Triticum aestivum) growth, productivity, nutrient content and soil proprieties under dryland farming. Plant Stress. 2023, 10, 100295. [Google Scholar] [CrossRef]
- Xing, J.; Li, X.Y.; Li, Z.Q.; Wang, X.T.; Hou, B.; Li, D.P. Remediation of soda-saline-alkali soil through soil amendments: Microbially mediated carbon and nitrogen cycles and remediation mechanisms. Sci. Total Environ. 2024, 924, 171641. [Google Scholar] [CrossRef] [PubMed]
- Malone, Z.; Berhe, A.A.; Ryals, R. Impacts of organic matter amendments on urban soil carbon and soil quality: A meta-analysis. J. Clean. Prod. 2023, 419, 138148. [Google Scholar] [CrossRef]
- Shao, W.Y.; Wang, Q.Z.; Guan, Q.Y.; Luo, H.P.; Ma, Y.R.; Zhang, J. Distribution of soil available nutrients and their response to environmental factors based on path analysis model in arid and semi-arid area of northwest China. Sci. Total Environ. 2022, 827, 154254. [Google Scholar] [CrossRef] [PubMed]
- Bünemann, E.K.; Bongiorno, G.; Bai, Z.; Creamer, R.E.; De Deyn, G.; De Goede, R.; Fleskens, L.; Geissen, V.; Kuyper, T.W.; Mäder, P.; et al. Soil quality—A critical review. Soil. Bio Biochem. 2018, 120, 105–125. [Google Scholar] [CrossRef]
- Bremner, J.M.; Tabatabai, M.A. Use of an ammonia electrode for determination of ammonium in Kjeldahl analysis of soils. Commun. Soil. Sci. Plan. 1972, 3, 71–80. [Google Scholar] [CrossRef]
- Murphy, J.; Riley, J.P. A modified single solution method for determination of phosphate in natural waters. Anal. Chim. Acta. 1962, 27, 31–36. [Google Scholar] [CrossRef]
- Powlson, D.S.; Brookes, P.C.; Christensen, B.T. Measurement of soil microbial biomass provides an early indication of changes in total soil organic-matter due to straw incorporation. Soil. Biol. Biochem. 1987, 19, 159–164. [Google Scholar] [CrossRef]
- Guo, B.C.; Ma, Y.N.; Feng, J.; Guan, X.C.; Zhang, W.P. Changing trend of organic matter and nutrient content in cultivated land of the Ningxia irrigation area of Yellow river. J. Agric. Sci. 2006, 27, 1–5, (In Chinese with English Abstract). [Google Scholar]
- Ningxia Agricultural Exploration and Design Institute. Soil of Ningxia Soil; Ningxia People’s Publishing House: Yinchuan, China, 1991. [Google Scholar]
- Wang, R.H.; Kang, Y.H.; Wan, S.Q.; Liu, S.H. Effects of water regulation methods on soil salt, nutrient content and its distribution in overlying saline wasteland. Trans. Chin. Soc. Agric. Eng. 2014, 30, 96–104, (In Chinese with English Abstract). [Google Scholar]
- Barton, L.; Wan, G.G.Y.; Colmer, T.D. Turfgrass (Cynodon dactylon L.) sod production on sandy soils: II. Effects of irrigation and fertiliser regimes on N leaching. Plant Soil. 2006, 284, 147–164. [Google Scholar] [CrossRef]
- Zhu, L.H.; Ma, L.J.; Liu, X.Y.; Zhang, S.J.; Tan, B.; Hou, S.; Hou, Z.A. Leaching and distributions of soil water salt and nitrate in cotton field under drip irrigation with saline water. J. Shihezi Univ. (Nat. Sci.) 2011, 29, 661–669. [Google Scholar]
- Bowman, D.C.; Devitt, D.A.; Miller, W.W. The Effect of Moderate Salinity on Nitrate Leaching from Bermudagrass Turf: A Lysimeter Study. Water Air Soil. Pollut. 2006, 175, 49–60. [Google Scholar] [CrossRef]
- Chen, M.; Wu, H.; Wo, F. Nitrate vertical transport in the main paddy soils of Tai Lake region, China. Geoderma 2007, 142, 136–141. [Google Scholar] [CrossRef]
- Behera, S.N.; Sharma, M.; Aneja, V.P.; Balasubramanian, R. Ammonia in the atmosphere: A review on emission sources, atmospheric chemistry and deposition on terrestrial bodies. Environ. Sci. Pollut. Res. 2013, 20, 8092–8131. [Google Scholar] [CrossRef] [PubMed]
- Fan, Y.Q.; Hao, X.M.; Ding, R.S.; Kang, S.Z. Soil water and nitrogen dynamics from interaction of irrigation and fertilization management practices in a greenhouse vegetable rotation. Soil. Sci. Soc. Am. J. 2020, 84, 901–912. [Google Scholar] [CrossRef]
- Singh, B.; Gahlot, P.; Purohit, D.G.M. Dispersive soils-characterization, problems and remedies. Int. Res. J. Eng. Technol. 2018, 5, 2478–2484. [Google Scholar]
- Mailhol, J.C.; Ruelle, P.; Nemeth, I. Impact of fertigation practices on nitrogen leaching under irrigation. Irrig. Sci. 2001, 20, 139–147. [Google Scholar] [CrossRef]
- Azam, H.M.; Alam, S.T.; Hasan, M.; Yameogo, D.D.S.; Kannan, A.D.; Rahman, A.; Kwon, M.J. Phosphorous in the environment: Characteristics with distribution and effects, removal mechanisms, treatment technologies, and factors affecting recovery as minerals in natural and engineered systems. Environ. Sci. Pollut. Res. Int. 2019, 26, 20183–20207. [Google Scholar] [CrossRef] [PubMed]
- George, T.S.; Hinsinger, P.; Turner, B.L. Phosphorus in soils and plants—Facing phosphorus scarcity. Plant Soil. 2016, 401, 1–6. [Google Scholar] [CrossRef]
- Addiscott, T.M.; Brockie, D.; Catt, J.A.; Christian, D.G.; Harris, G.L.; Howse, K.R.; Mirza, N.A.; Pepper, T.J. Phosphate losses through field drains in a heavy cultivated soil. J. Environ. Qual. 2000, 29, 522–532. [Google Scholar] [CrossRef]
- Mozaffari, M.; Sims, J.T. Phosphorus availability and sorption in an Atlantic coastal plain watershed dominated by animal-based agriculture. Soil. Sci. 1994, 157, 97–107. [Google Scholar] [CrossRef]
- Palacios-Díaz, M.P.; Mendoza-Grimón, V.; Fernández-Vera, J.R.; Rodríguez-Rodríguez, F.; Tejedor-Junco, M.T.; Hernández-Moreno, J.M. Subsurface drip irrigation and reclaimed water quality effects on phosphorus and salinity distribution and forage production. Agric. Water Manag. 2009, 96, 1659–1666. [Google Scholar] [CrossRef]
- Aulakh, M.S.; Garg, A.K.; Kabba, B.S. Phosphorus accumulation, leaching and residual effects on crop yields from long-term applications in the subtropics. Soil. Use Manag. 2010, 23, 417–427. [Google Scholar] [CrossRef]
- Khan, A.; Yang, X.Y.; Sun, B.H.; Zhang, S.L.; He, B.H. Responses of crop and soil phosphorus fractions to long-term fertilization regimes in a Loess soil in Northwest China. Agronomy 2023, 23, 3072. [Google Scholar] [CrossRef]
- Bot, A.; Benites, J. The Importance of Soil Organic Matter: Key to Drought-Resistant Soil and Sustained Food Production; FAO Soils Bulletins: Rome, Italy, 2005. [Google Scholar]
- Elder, J.W.; Lal, R. Tillage effects on physical properties of agricultural organic soils of north central Ohio. Soil. Till. Res. 2008, 98, 208–210. [Google Scholar] [CrossRef]
- Bronick, C.J.; Lal, R. Soil structure and management: A review. Geoderma 2005, 124, 3–22. [Google Scholar] [CrossRef]
- Weldewahid, Y.; Habtu, S.; Taye, G.; Teka, K.; Gessesse, T.A. Effects of long-term irrigation practice on soil quality, organic carbon and total nitrogen stocks in the drylands of Ethiopia. J. Arid. Environ. 2023, 214, 104982. [Google Scholar] [CrossRef]
- Xue, B.; Wu, R.J.; Liu, B.Q.; An, H.; Gao, R.L.; Ma, K.; Ndzana, G.M.; Du, L.T.; Kamran, M. Nutrient supplementation changes chemical composition of soil organic matter density fractions in desert steppe soil in northern China. Soil. Till Res. 2024, 241, 106107. [Google Scholar] [CrossRef]
- Brown, R.W.; Chadwick, D.R.; Bending, G.D.; Collins, C.D.; Whelton, H.L.; Daulton, E.; Covington, J.A.; Bull, I.D.; Jones, D.L. Nutrient (C, N and P) enrichment induces significant changes in the soil metabolite profile and microbial carbon partitioning. Soil. Biol. Biochem. 2022, 172, 108779. [Google Scholar] [CrossRef]
- Schlüter, S.; Sammartino, S.; Koestel, J. Exploring the relationship between soil structure and soil functions via pore-scale imaging. Geoderma 2020, 370, 114370. [Google Scholar] [CrossRef]
- Jordi, G.; Oriol, M.; Lucila, C.; Serrano, L. Nitrate leaching and strawberry production under drip irrigation management. Agric. Ecosyst. Environ. 1995, 56, 121–135. [Google Scholar] [CrossRef]

Disclaimer/Publisher’s Note: The statements, opinions and data contained in all publications are solely those of the individual author(s) and contributor(s) and not of MDPI and/or the editor(s). MDPI and/or the editor(s) disclaim responsibility for any injury to people or property resulting from any ideas, methods, instructions or products referred to in the content. |
© 2024 by the authors. Licensee MDPI, Basel, Switzerland. This article is an open access article distributed under the terms and conditions of the Creative Commons Attribution (CC BY) license (https://creativecommons.org/licenses/by/4.0/).