Article

Effects of Different Crop Intercropping on the Growth, Root System, and Yield of Tiger Nuts

College of Agriculture, Shihezi University, Shihezi 832003, China
*
Authors to whom correspondence should be addressed.
Agronomy 2024, 14(6), 1270; https://doi.org/10.3390/agronomy14061270
Submission received: 4 May 2024 / Revised: 30 May 2024 / Accepted: 11 June 2024 / Published: 12 June 2024
(This article belongs to the Section Innovative Cropping Systems)

Abstract

:
Intercropping is a vital cropping system that can create a conducive growth environment for crops and enhance land productivity. Tiger nuts (Cyperus esculentus L.) have high oil content and are adaptable to various soil types, making them a promising new oil crop with significant development potential. This study evaluated the plant height, leaf area, tiller numbers, biomass, land equivalent ratio (LER), and root morphological characteristics of tiger nuts. The agronomic traits and root distribution of tiger nuts and other crops were further investigated to achieve the goal of high yield for tiger nuts. Seven intercropping systems were implemented in the experiment: maize–tiger nut intercropping (MT), soybean–tiger nut intercropping (ST), cotton–tiger nut intercropping (CT), monoculture tiger nut (T), monoculture maize (M), monoculture soybean (S), and monoculture cotton (C). The results indicated that under different planting systems, the agronomic traits of tiger nuts in MT and ST modes were superior, with plant height and tiller numbers increasing by 7.6% to 11.6%. However, the plant height and Soil Plant Analysis Development (SPAD) values in CT mode were slightly lower than in T mode. Additionally, intercropping reduced the leaf area by 6.2% to 37.9%. Root development was more pronounced in intercropping modes, with the ST mode showing the most significant improvement, increasing the 0–20 cm root length density (RLD) by 12.2% to 45.7%. Therefore, each of the three intercropping modes demonstrated distinct advantages. The LER of the intercropping systems ranged from 1.10 to 1.24, enhancing land utilization, with tiger nuts being the dominant species. Compared to monoculture, the ST mode exhibited the best overall effect. Understanding the impact of different planting systems on tiger nuts provides valuable insights for developing tiger nut cultivation in Xinjiang.

1. Introduction

Tiger nuts (Cyperus esculentus L.), also known as earth-almonds, chufa, edible galangal, yellow nutsedge, and rush nuts [1,2], are annual herbaceous oil crops. Despite their name, they are not true nuts but rather almond-like tubers measuring 1–2 cm in length, which appear globular or egg-like when wet and take on an irregular appearance after drying [3]. Tiger nuts are unique in their ability to accumulate large amounts of oil in their tubers and possess high nutritional value. The oil extracted from tiger nuts is a naturally high-oleic edible oil, which can reduce the levels of total and saturated fats while increasing unsaturated fatty acids, making it widely accepted [4,5,6,7]. Besides oil extraction, tiger nuts can be ground into powder to produce gluten-free noodles. The starch in tiger nuts is beneficial to human health, as it is absorbed slowly in the human body and can promote postprandial blood sugar stability. This specially made tiger nut drink can be used as a functional beverage with antidiabetic potential [5,6,8].
The tiger nut is believed to have originated in northeastern Africa and the eastern Mediterranean and was cultivated as a food source in ancient Egypt [1,9]. In the 1960s and 1970s, tiger nuts were introduced to China by the Soviet Union, Bulgaria, and North Korea, where small-scale planting demonstrations were conducted in marginal areas. In 2019, approximately 100,000 tons of tiger nut tubers were produced on about 20,000 hectares of arable land [10]. The high-yield tiger nut variety produces approximately 7.5 tons per hectare, capable of yielding about 2.25 tons of starch, 1.8 tons of oil, 1.12 tons of sugar, and 0.4 tons of protein per hectare. The high biomass yield and nutrient content of tiger nuts make them a promising resource for food, oil, and feed, addressing growing and diverse global needs [11,12]. As the largest importer and consumer of oil crops, China should actively develop oil crops to reduce its external dependence on these resources.
According to agro-ecological guidelines, intercropping (planting two or more crops on the same land) improves the ecological function of crop systems [13,14], overcomes resource constraints at the whole farmland scale, and enables efficient use of agricultural resources [15]. Additionally, the intercropping system is considered to enhance and maintain crop yield by increasing crop diversity, which can significantly optimize the planting system [16]. The improvement of crop productivity in intercropping systems is usually due to the complementarity of the intercropped crops in terms of time, space, and access to different resources. This reduces niche overlap and competition, promoting mutual benefits between intercropped crops [17]. For example, in legume-based intercropping systems, maize-soybean intercropping is increasingly popular because it effectively transfers fixed nitrogen from soybean to maize, thereby increasing yield and nitrogen use efficiency [18]. Recent studies have shown that intercropping also facilitates the development of different root types, altering the overall distribution and structure of roots [19]. Promoting interactions between plants and roots is particularly important for alleviating stress conditions and increasing yield [20,21,22,23,24]. To date, extensive literature has studied the widespread practice of crop intercropping.
Due to the limited arable land resources in China, intercropping has become a fundamental practice in traditional Chinese agriculture. Increasing the biodiversity of farmland to establish complementary and synergistic relationships has improved the stability of productivity [25,26]. Tiger nut has been introduced as a new oil crop in Xinjiang due to its high oil content and drought resistance. Xinjiang primarily cultivates crops such as cotton, corn, and oil crops. As a new crop in this region, tiger nut is intercropped with traditional crops like corn, soybean, and cotton to enhance tiger nut production and improve land productivity. In the “National Planting Industry Structure Adjustment Plan (2016–2020)” issued by the Ministry of Agriculture of China, it is recommended to utilize more oil crops concurrently, and tiger nuts should be demonstrated and promoted in suitable areas. In February 2022, the No.1 Central Document once again emphasized the importance of “vigorously implementing the soybean and oil production capacity improvement project”. The oil industry holds special significance for the safety of food systems and the development of agricultural production.
Despite its high application value, compared with other vegetable oils, such as olive oil and peanut oil, the development and utilization of tiger nuts are relatively small [27]. China’s strategic response to the shortage of oil crop resources by planting tiger nuts is currently in the development stage [28]. It is very important to carry out relevant research on tiger nuts and find a suitable intercropping system for this crop. The purpose of this study was to understand the growth characteristics, root morphology, and yield content of tiger nuts under different intercropping and monocropping systems, in order to determine the cropping system suitable for yield advantages based on tiger nuts in Xinjiang, China.

2. Materials and Methods

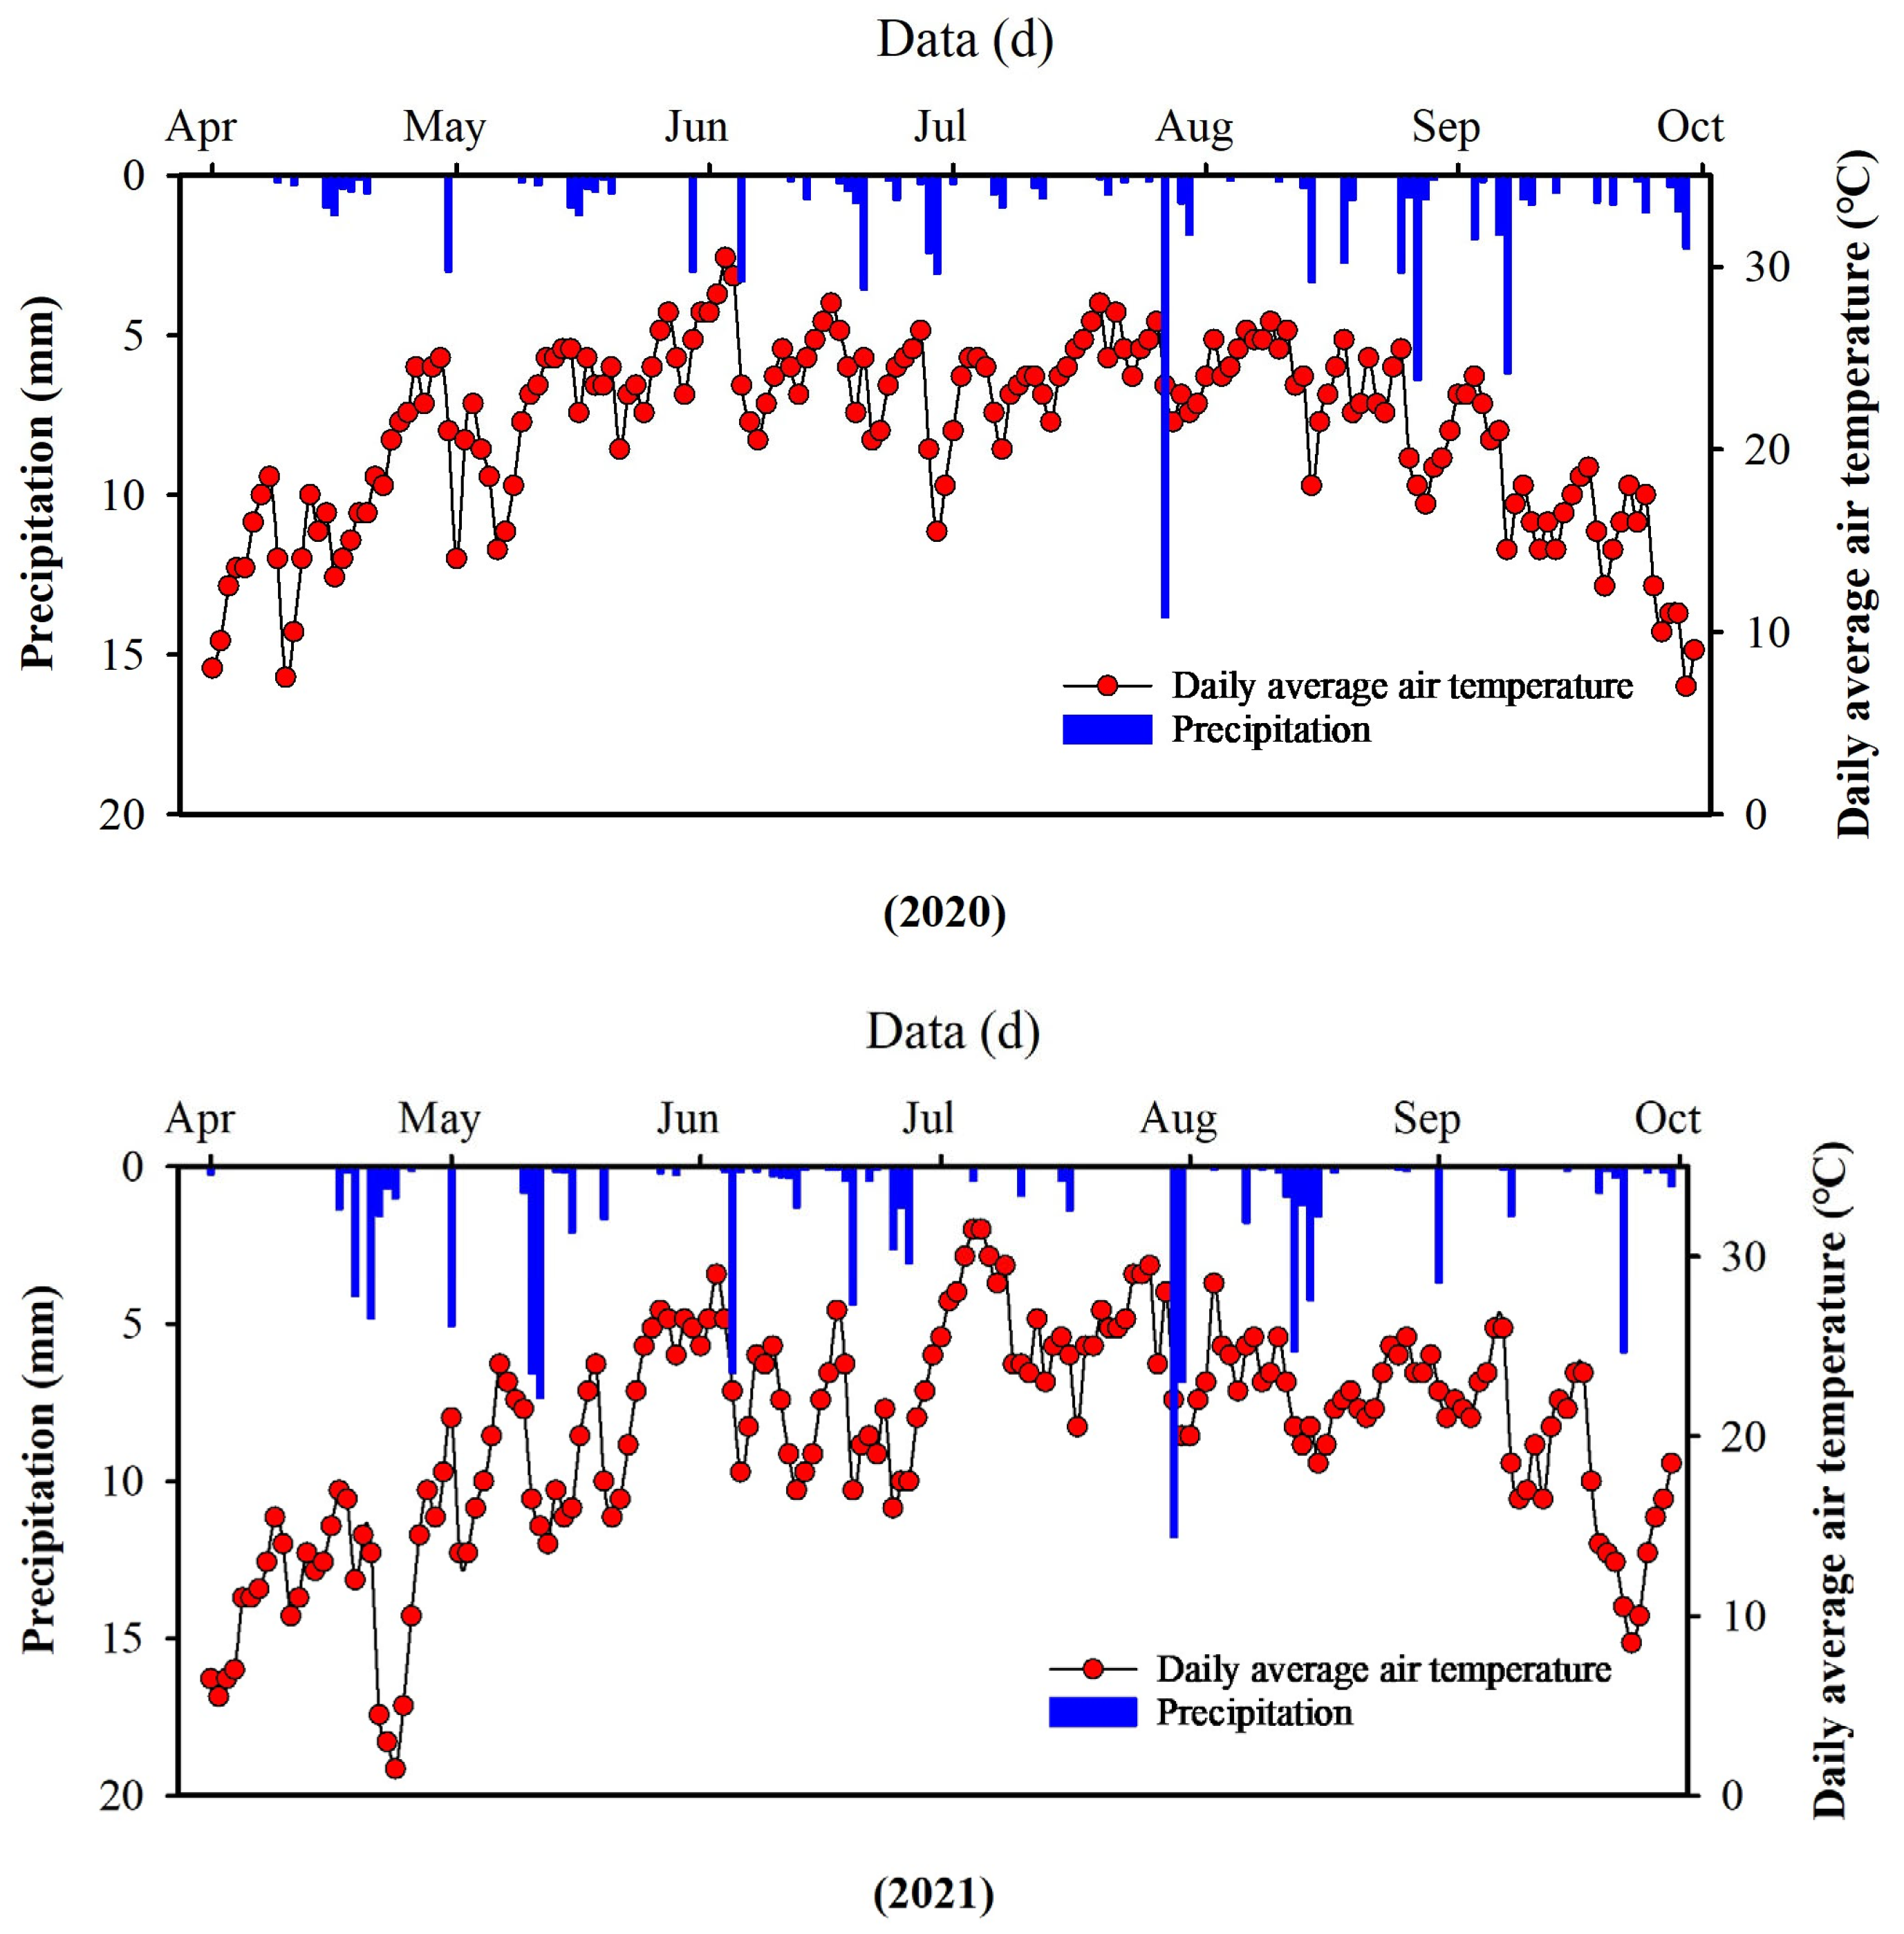
2.1. Experimental Site

The two-year experiment was conducted at the experimental station of the College of Agriculture, Beiyuan New District, Shihezi University (44°19′ N, 86°03′ E) from 2020 to 2021. The climate in this region is temperate continental, characterized by hot summers and cold, dry winters. The soil is sandy loam, with bulk densities of 1.29 g·cm−3 for the 0–20 cm depth and 1.32 g·cm−3 for the 20–40 cm depth. The soil contains 11.21 g·kg−1 of organic matter, 0.73 g·kg−1 of total nitrogen, 0.06 g·kg−1 of alkaline nitrogen, 0.052 g·kg−1 of available phosphorus, and 0.198 g·kg−1 of available potassium.
Weather conditions during the study period are shown in Figure 1. The total rainfall during the growing seasons (April to September) of 2020 and 2021 was 89.80 mm and 93.56 mm, respectively. The highest daily average temperatures and daily rainfall during these two years occurred in June and July.

2.2. Experimental Materials and Experimental Design

The maize variety tested was “Xinyu 93”, the soybean variety was “Xinda 1”, the cotton variety was “Xinluzao 80”, and the tiger nut variety was “Zhongyousha 1”. The experiment, conducted in 2020–2021, employed a single-factor randomized block design with three replicates. The planting systems included four monocultures (monoculture tiger nut (T), monoculture maize (M), monoculture soybean (S), monoculture cotton (C)) and three intercropping systems (maize–tiger nut intercropping (MT), soybean–tiger nut intercropping (ST), and cotton–tiger nut intercropping (CT)). There were a total of 21 plots, each measuring 50 m2 (5 m × 10 m), with 1 m rows set between the plots. The sowing dates for tiger nuts were 28 April 2020 and 30 April 2021. The row spacing for the two crops in the experiment was 40 cm. The planting method used was drip irrigation under film, with the film width being 2.07 m, consisting of one film with three tubes and six rows. The row spacing for tiger nut was 30 cm, and the plant spacing was 25 cm. Maize, soybean, and cotton were planted using local conventional methods (maize row spacing of 40 cm, plant spacing of 20 cm; soybean row spacing of 20 cm, plant spacing of 10 cm; cotton row spacing of 60 cm, plant spacing of 10 cm) under field conditions.
The irrigation method was drip irrigation with one pipe and two rows, totaling 5450 m3·hm−2. Plants were irrigated 12 times during the entire growth period, with irrigation amounts adjusted according to the crop growth stages. Urea (N: 46%), monoammonium phosphate (P2O5: 43%), and potassium sulfate (K2O: 50%) were applied at 400 kg·hm−2, 360 kg·hm−2, and 300 kg·hm−2, respectively, all used as topdressing. The ratios of N fertilizer and PK fertilizer applied at tillering stage, pre-tuber stage, and tuber peak stage were 50% and 25%, 25% and 40%, and 25% and 35%, respectively. Fertilizers were applied with irrigation water each time, and the treatments remained consistent.
As this article focuses on the influence of different planting systems on tiger nuts, the yield of maize, soybean, and cotton was measured only at the maturation stage. Therefore, this article only focuses on four treatments: monoculture tiger nut (T), maize–tiger nut intercropping (MT), soybean–tiger nut intercropping (ST), and cotton–tiger nut intercropping (CT). The plant height, SPAD value, tiller numbers, leaf area, and root system of tiger nuts were sampled at seedling stage, tillering stage, pre-tuber stage, tuber peak stage, and maturation stage. The sampling dates were 25 May, 25 June, 15 July, 10 August, and 15 September 2020, and 2 June, 29 June, 25 July, 25 August, and 20 September 2021.

2.3. Determination of Agronomic Traits

2.3.1. Plant Height and Tillers Number

The samples were collected at the seedling, tillering, pre-tuber, tuber peak, and maturation stages during the growth period of the tiger nut. Under both monocropping and intercropping conditions, five normal plants were randomly selected from each plot. The plant height and number of tillers were measured for these plants. The natural plant height was measured using a tape measure, and the average value was calculated.

2.3.2. Leaf Area and SPAD Value

At the five stages of seedling, tillering, pre-tuber, tuber peak, and maturation, five plants with similar growth and vigor were randomly selected from each plot. Leaf area was measured using an LI-3100C (LI-Cor, Lincoln, NE, USA) digital leaf area meter. SPAD values of leaves were determined using a handheld chlorophyll analyzer SPAD-502 (Beijing, China). Measurements were taken from the middle of the leaf blade, avoiding the veins, at three points on each leaf, and the average value was calculated.

2.4. Root Morphology Parameters

Three random root samples were collected from each plot during the maturation stage. A cylindrical steel soil corer with an inner diameter of 4.5 cm (volume of 141 cm3) was driven into the soil with a sledgehammer to collect soil samples. Root drills were used to vertically extract soil samples from 0–20 cm, 20–40 cm, and 40–60 cm soil layers near the crop roots. The characteristics of root distribution in different planting systems at the tuber stage were studied using the following methods. The root samples collected from each soil collection point were placed in 200 mesh nylon gauze and rinsed under running water, and the roots of tiger nuts were picked out with tweezers. The roots of different crops were separated based on their color, presence of nodules, and odor. The roots of cotton, maize, and soybeans are light brown, white, and gray, respectively. Soybean roots have nodules and the scent of leguminous plants [29], whereas tiger nuts have a refreshing fragrance. WinRHIZO (version 4.0 b, Regent Instruments Inc., Québec City, QC, Canada) root analysis software was used to scan the fresh root samples, and the root lengths of the tiger nuts in different soil layers were measured.

2.5. Root Length Density (RLD)

The RLD (cm·cm−3) was calculated as the total root length of a species divided by the sample volume [30]. The RLD of tiger nuts was calculated in combination with the amount of soil extracted by root drilling (141 cm3).
RLD (cm·cm−3) = RL (cm) / V (141 cm3)
where RL is the root length, and V is the amount of soil extracted from the root drilling (141 cm3). Although some roots fall off during root flushing, this is currently the most accurate method for calculating the RLD.

2.6. Plant Dry Weight

At the maturation stage, five normal plants were randomly selected from each plot and brought back to the laboratory to be washed with clean water. The aboveground part of the plant was separated from the root system. The fresh weight of both parts was then measured separately. The plants were placed in different labeled bags and subjected to an initial fixation at 105 °C for 30 min. Subsequently, they were dried at 85 °C until a constant weight was achieved.

2.7. Yield and Land Equivalent Ratio (LER) and Aggressivity

Yield composition factors: During the maturation period of tiger nuts, five plants were collected from each plot using the “S” shaped five-point sampling method. The number of grains per plant, grain weight per plant, and 100-grain seed weight were measured.
Yield: During the harvest period of tiger nuts, three replicated sampling plots (1 m × 1 m area) were randomly selected from each treatment. The tubers were manually dug, washed, and weighed. The theoretical yield of tiger nuts was calculated based on the actual yield of the sample plot and the plot area.
Similarly, during the harvesting of soybean, maize, and cotton, three replicated sampling plots (1 m × 1 m area) were randomly selected from each treatment. The theoretical yield was calculated from the actual yield and the area of the plot.
The land equivalent ratio (LER) refers to the ratio of the yield of two or more crops grown in the same farmland to the yield of each crop grown in monoculture. It is used as an index to measure the yield advantage of intercropping [31]. The calculation formula is as follows:
L E R = i = 1 m Y i Y i i
In the formula, Yi represents the unit yield of crops during intercropping. Yii represents the unit yield of crops under monoculture. A land equivalent ratio equal to 1 indicates normal production, greater than 1 indicates increased production, and less than 1 indicates reduced production. The greater the land equivalent ratio, the greater the yield increase and the better the effect of intercropping.
Aggressivity refers to the relative yield increase in one crop in the intercropping system being greater than the yield increase in another crop. The specific calculation method of crop erosion is as follows [32]:
A m = Y m i Y m i i / Z m i Y i Y i i / Z i
A s = Y s i Y s i i / Z s i Y i Y i i / Z i
A c = Y c i Y c i i / Z c i Y i Y i i / Z i
In the formula, Am, As, and Ac represent the erosivity of maize, soybean, and cotton in the intercropping system, respectively. Zi, Zmi, Zsi, and Zci represent the planting ratios of intercropping tiger nut, maize, soybean, and cotton, respectively. Am/As/Ac = 0, indicating that the two crops have the same competitiveness; Am/As/Ac > 0, indicating that the competitiveness of maize/soybean/cotton is higher than that of tiger nut. Am/As/Ac < 0, indicating that maize/soybean/cotton is less competitive than tiger nut.

2.8. Data Analysis

Microsoft Excel 2010 and SPSS 26.0 (SPSS, Chicago, IL, USA) were used for data processing and one-way analysis of variance, and the LSD (least significant difference) test was used to evaluate the significance of each treatment (p < 0.05). Sigmaplot 15.0 and Origin 2024 (Northampton, MA, USA) were used for plotting. In order to understand the relationship between different variables (plant height, SPAD value, tiller number, leaf area, root distribution, and yield), the pheatmap package in R 4.3.3 (R Core Team, Vienna, Austria, 2023) was used for correlation analysis and heat map generation.

3. Result

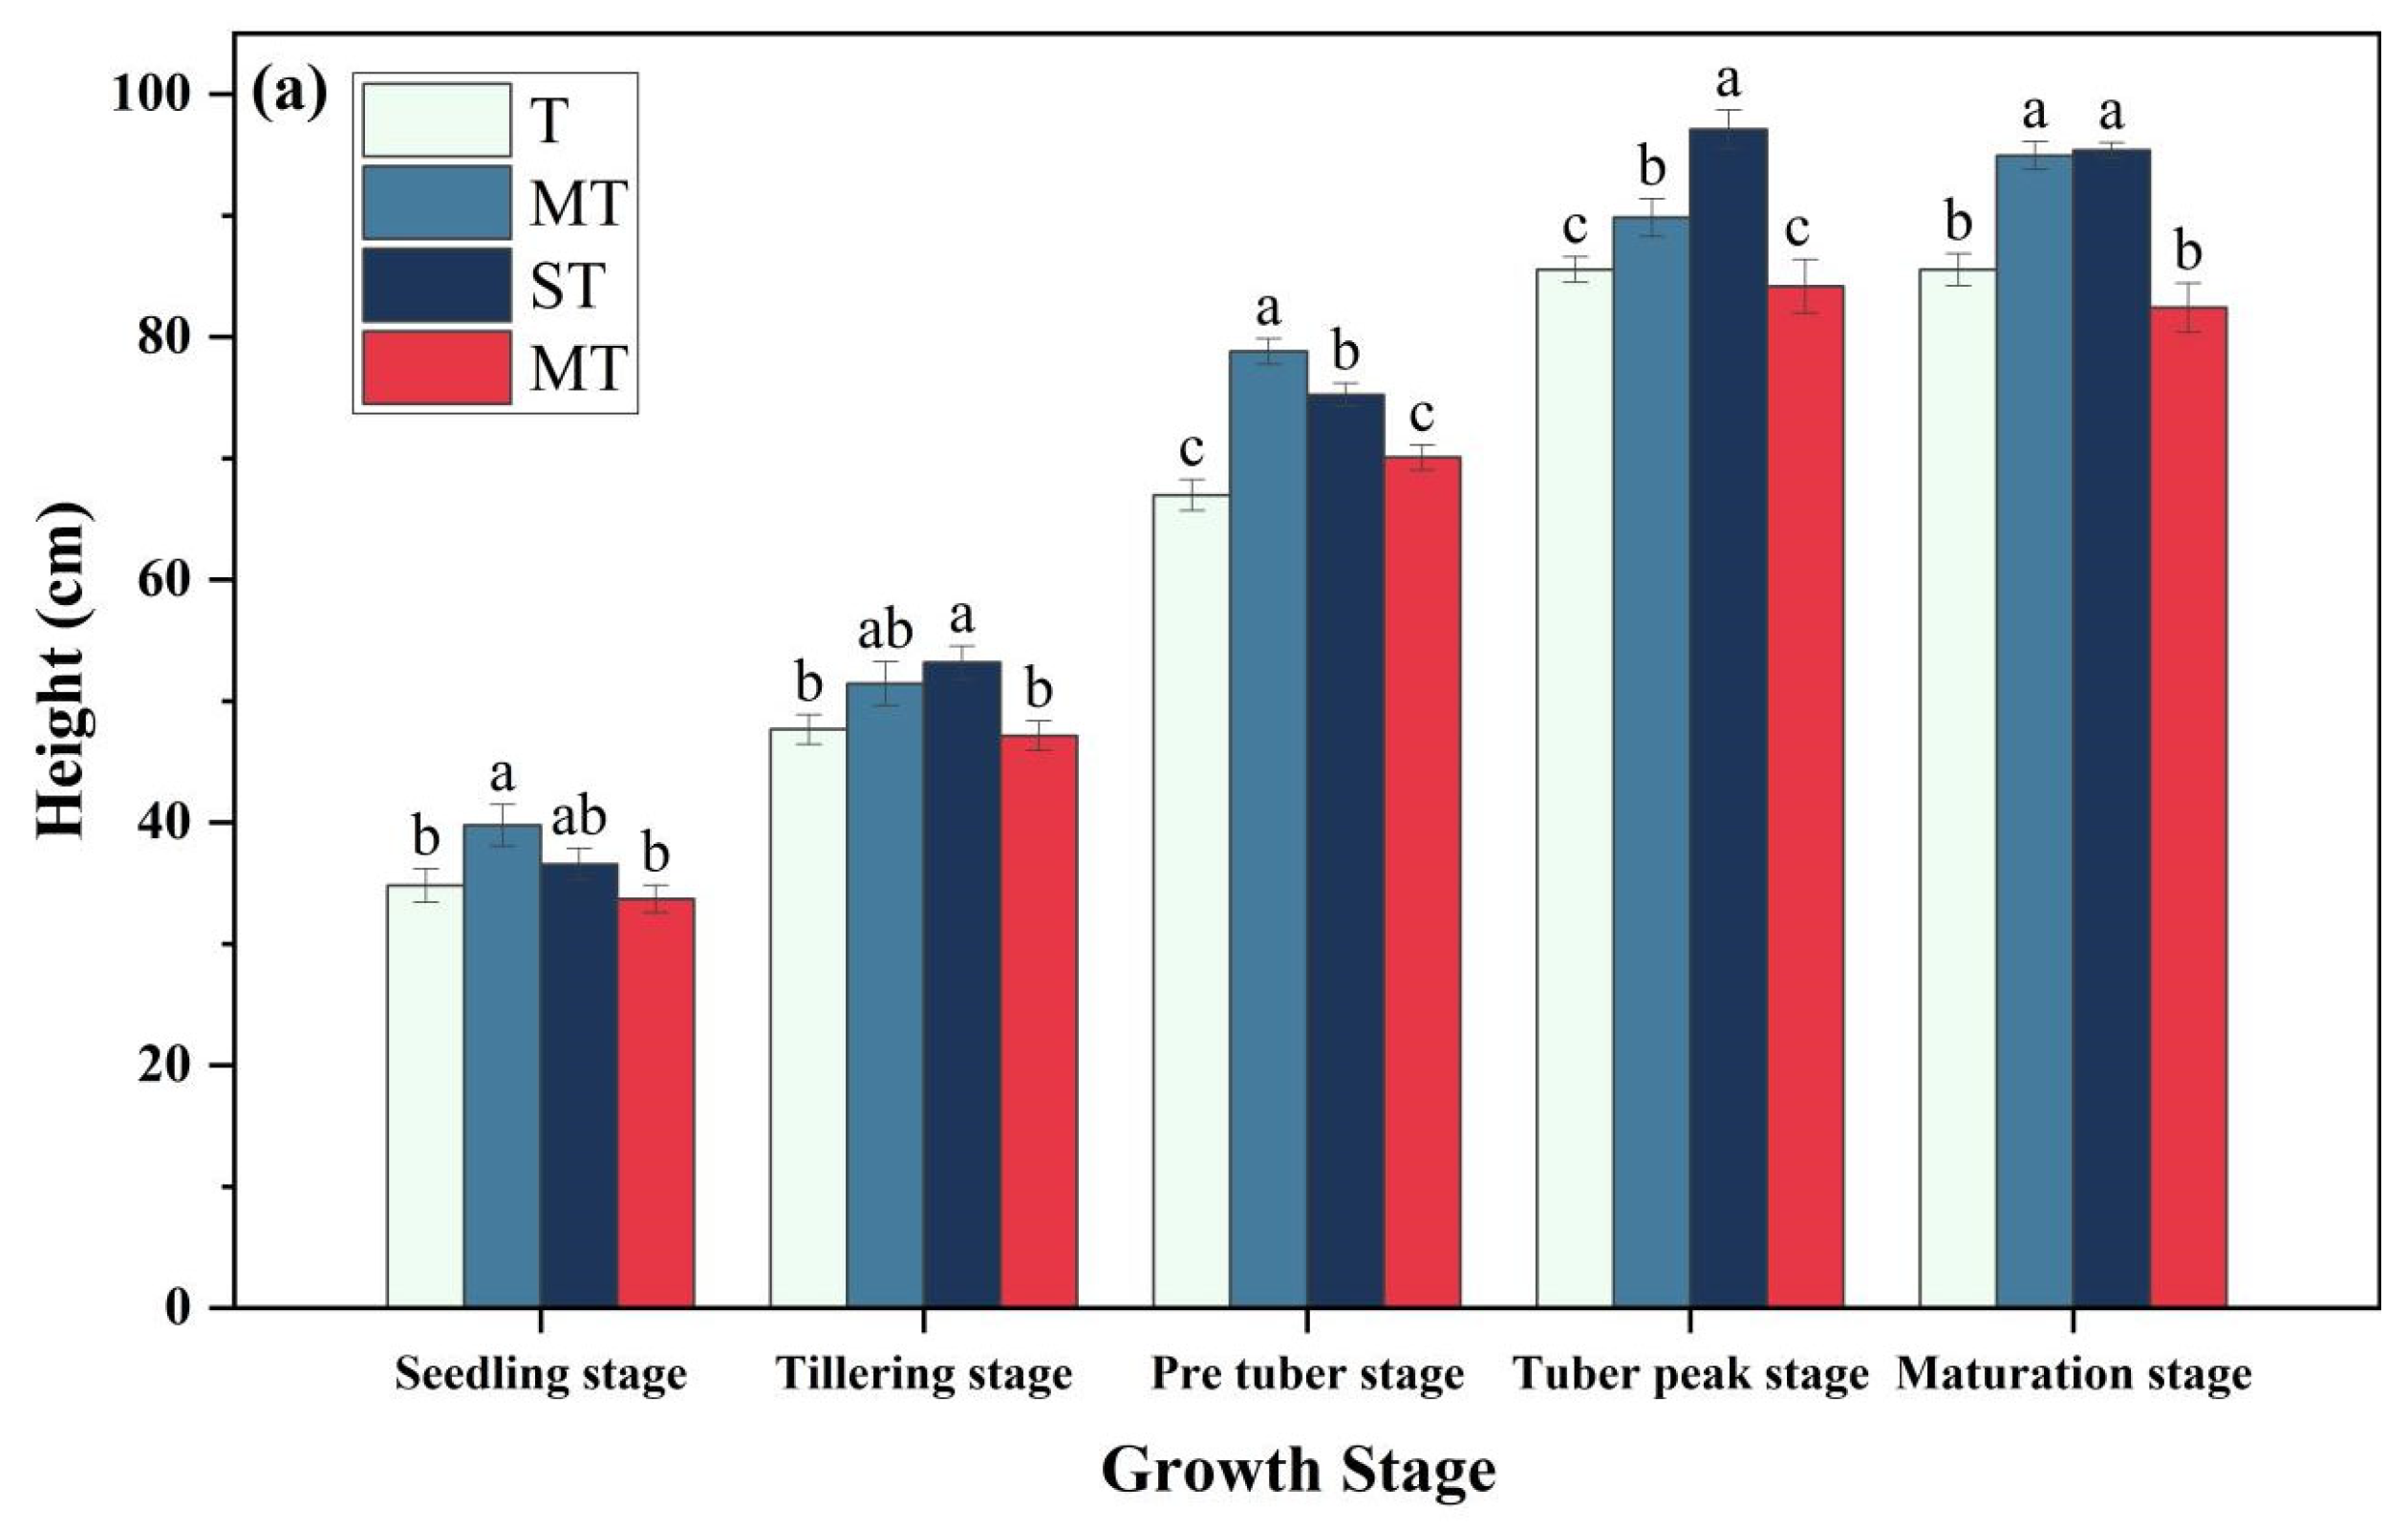
3.1. The Plant Height of Tiger Nuts

During the growth period, the plant height showed an initial trend of rapid increase, followed by a slower increase, and finally a slight decrease (Figure 2). The growth rate of plant height was fastest from the tiller stage to the early tuber stage, followed by the period from early tuber stage to late tuber stage. The plant height decreased slightly from late tuber stage to maturity stage. The results of the two-year experiment indicated that, compared to monoculture, the MT and ST intercropping modes significantly increased plant height, whereas the CT mode did not significantly increase plant height and exhibited a downward trend.
In 2020, the highest plant height in the MT mode was 39.77 cm at the seedling stage, which was significantly higher than that of the CT and T modes by 18.0% and 14.3%, respectively. At the tillering stage, the plant height in the ST mode was the highest (53.17 cm), slightly higher than that in the MT mode by 1.73 cm, but significantly higher than that in the CT and T modes by 12.8% and 11.5%. In the early tuber stage, the plant height in the MT mode was 4.75% higher than in the ST mode but 8.09% lower in the late tuber stage. At maturity, the plant height in the ST mode was higher than in the MT mode, but there was no significant difference. The MT mode was significantly higher than the T and CT modes by 11.0% and 15.2%, while the ST mode was significantly higher than the T and CT modes by 7.6% and 12.1%.
In 2021, the plant height in the MT mode at the seedling stage was the highest, slightly higher than the ST mode by 1.72 cm, and the plant heights in the T and CT modes were similar, with no significant difference between them. The MT and ST modes were significantly higher than the T and CT modes by 15.9% and 28.0%, and 9.5% and 20.9%, respectively. The plant height distribution of tiger nuts under different planting methods at the tillering stage was similar to that at the seedling stage. In the tuber stage, with the growth and development of crops, the differences gradually increased. In the pre-tuber stage, the height in the ST mode was the highest (65.36 cm), significantly higher than that in the MT, T, and CT modes by 4.3%, 8.7%, and 9.5%, respectively. At the tuber peak stage, the plant height in the ST mode remained the highest, significantly higher than that in the T and CT modes by 8.3% and 7.3%, and slightly higher than that in the MT mode by 2.5%, although the difference was not significant. At maturity, the results were similar to those in 2020.

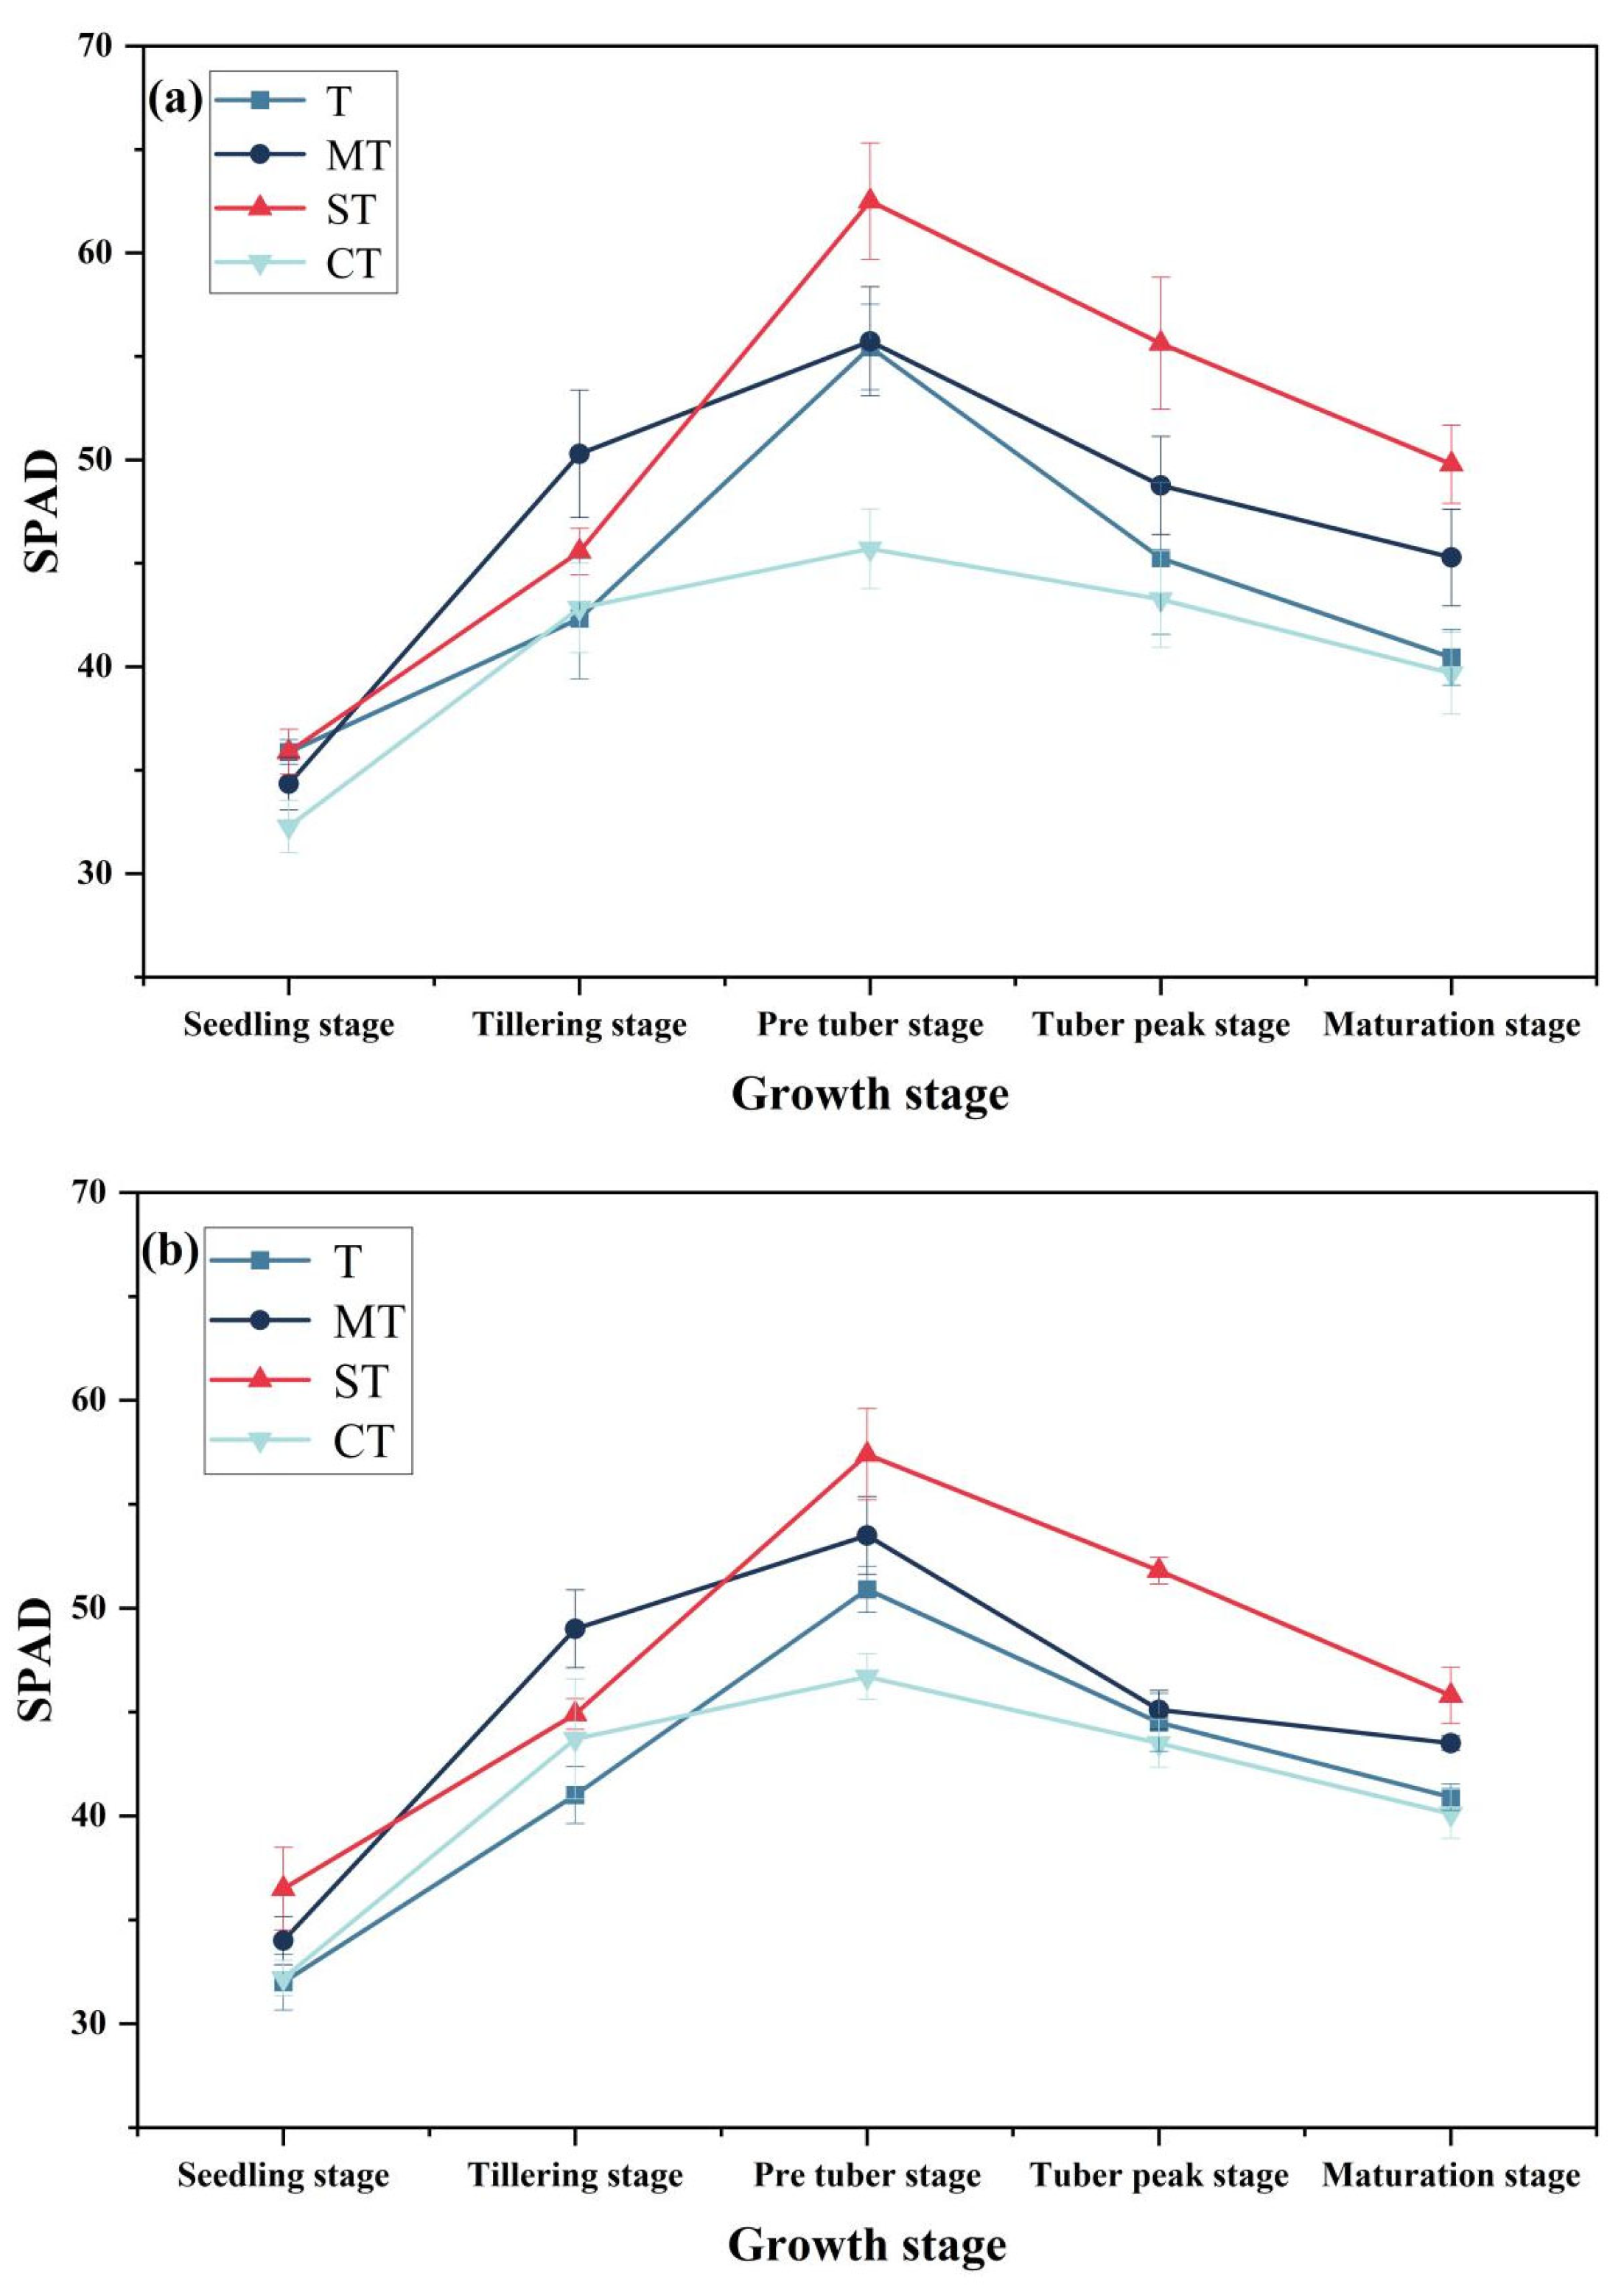
3.2. SPAD Value of Tiger Nuts

The results of the two-year experiment showed that the SPAD value of tiger nuts increased from the seedling stage to the pre-tuber stage under different planting modes, peaking at the pre-tuber stage, and then began to decline slowly (Figure 3). Compared to the other three modes, the SPAD value in the CT mode was consistently the lowest.
In 2020, the SPAD values of the four modes at the seedling stage were not significantly different. The SPAD value of the T mode was the highest (35.99), while the SPAD value of the CT mode was the lowest, being 10.3% lower than that of the T mode. At the tillering stage, the SPAD values of all four modes increased significantly, with the MT mode showing the most obvious increase. The SPAD value of the MT mode was significantly higher than that of the T mode by 9.9%, and the SPAD value of the ST mode was slightly higher than that of the T mode, though the difference was not significant. From the tillering stage to the pre-tuber stage, the SPAD value of the ST mode gradually increased to 64.50, making it higher than that of the other three modes. The growth rate of the SPAD value in the MT mode slowed down, becoming 8.5% lower than that of the T mode. At the tuber peak stage and maturation stage, the SPAD values decreased in all four modes, following the order ST > T > MT > CT.
In 2021, at the seedling stage, the SPAD value of the ST mode was the highest, significantly higher than that of the T and CT modes by 13.9% and 13.4%, respectively. At the tillering stage, the SPAD value of the MT mode began to increase, becoming significantly higher than that of the ST, CT, and T modes by 9.1%, 12.1%, and 19.6%, respectively. In the early tuber stage, the SPAD value of the MT mode began to decrease, slightly lower than that of the ST mode by 3.9%, but the difference was not significant. There was no significant difference between the CT and T modes, but they were significantly lower than the ST mode by 18.6% and 11.3%, respectively. At the tuber peak stage, the SPAD value of the ST mode remained the highest, though there was no significant difference among the MT, CT, and T modes. At the maturation stage, the trend was similar to the tuber peak stage, but the SPAD value of the MT mode was significantly higher than those of the CT and T modes by 8.5% and 6.5%, respectively.

3.3. The Tiller Numbers of Tiger Nuts

The results of the two-year experiment showed that the number of stems and tillers increased during the developmental stages (Table 1). The tiller number increased most rapidly from the tillering stage to the tuber stage, increased steadily from the pre-tuber stage to the tuber peak stage, and tended to stabilize from the full tuber stage to the maturity stage. The tiller number in intercropping modes was higher than in monocropping modes, with the overall performance being ST > MT > CT > T. The tiller numbers reached 30 in the T mode, 34 in the MT mode, 36 in the ST mode, and 32 in the CT mode. Intercropping could promote the tiller number of tiger nuts.

3.4. Leaf Area of Tiger Nuts

The results of the two-year experiment showed that the leaf area increased throughout the growth period (Figure 4). Different planting modes had little effect on the leaf area before the pre-tuber stage, and the growth rate was fastest from the pre-tuber stage to the tuber peak stage. During the growth period, the leaf area of the sole T mode was the highest, and intercropping modes caused the leaf area of tiger nuts to decrease to varying degrees.
In 2020, at the seedling stage, there was no significant difference between the T, MT, and ST modes, but the T and ST modes were significantly higher than the CT mode by 14.4% and 10.4%, respectively. At the tillering stage, the MT, ST, and CT modes were significantly lower than the T mode by 6.2%, 11.3%, and 14.6%, respectively. At the pre-tuber stage, the leaf area under the T mode was still the highest. The leaf area under the MT, ST, and CT modes decreased by 9.7%, 19.0%, and 28.5%, respectively, compared to the T mode. Similarly, at the tuber peak stage, the leaf area under the MT, ST, and CT modes decreased by 12.8%, 18.3%, and 30.1%, respectively, compared to the T mode.
In 2021, the leaf area of the CT mode was the lowest at the seedling stage, being significantly lower than that of the T and MT modes by 17.8% and 4.1%, respectively. At the pre-tuber stage, the leaf area of the CT mode remained the lowest, being significantly lower than that of the T and ST modes by 8.9% and 5.0%, respectively. The changes in leaf area at the tillering stage, tuber peak stage, and maturation stage were similar. There was no significant difference in leaf area between the MT and ST modes. The T mode was significantly higher than the MT, ST, and CT modes by 6.4%, 8.3%, and 18.7% at the tillering stage; 11.6%, 19.6%, and 37.9% at the tuber peak stage; and 7.9%, 10.0%, and 34.2% at the maturation stage, respectively.

3.5. Plant Dry Weight of Tiger Nuts

The results of the two-year experiment showed that the dry weight of the aboveground part was higher than that of the underground part under different planting patterns (Figure 5). Under intercropping, the ratio of underground dry weight to aboveground dry weight increased to varying degrees. In 2020, the aboveground dry weight in the MT and ST modes was significantly higher than that in the CT mode by 11.32% and 17.73%, and higher than that in the T mode by 5.6% and 11.6%, although the difference was not significant. The underground dry weight was still the highest in the ST mode, which was 3.9 g higher than in the MT mode, and significantly higher than in the CT and T modes by 48.2% and 52.2%.
In 2021, the aboveground and underground dry weights in the ST mode were the highest. The aboveground dry weight and underground dry weight in the CT and T modes were significantly lower than those in the ST mode by 17.2%, 18.7% and 35.5%, 41.4%, respectively, and significantly lower than those in the MT mode by 8.7%, 10.4% and 27.3%, 34.0%, respectively.

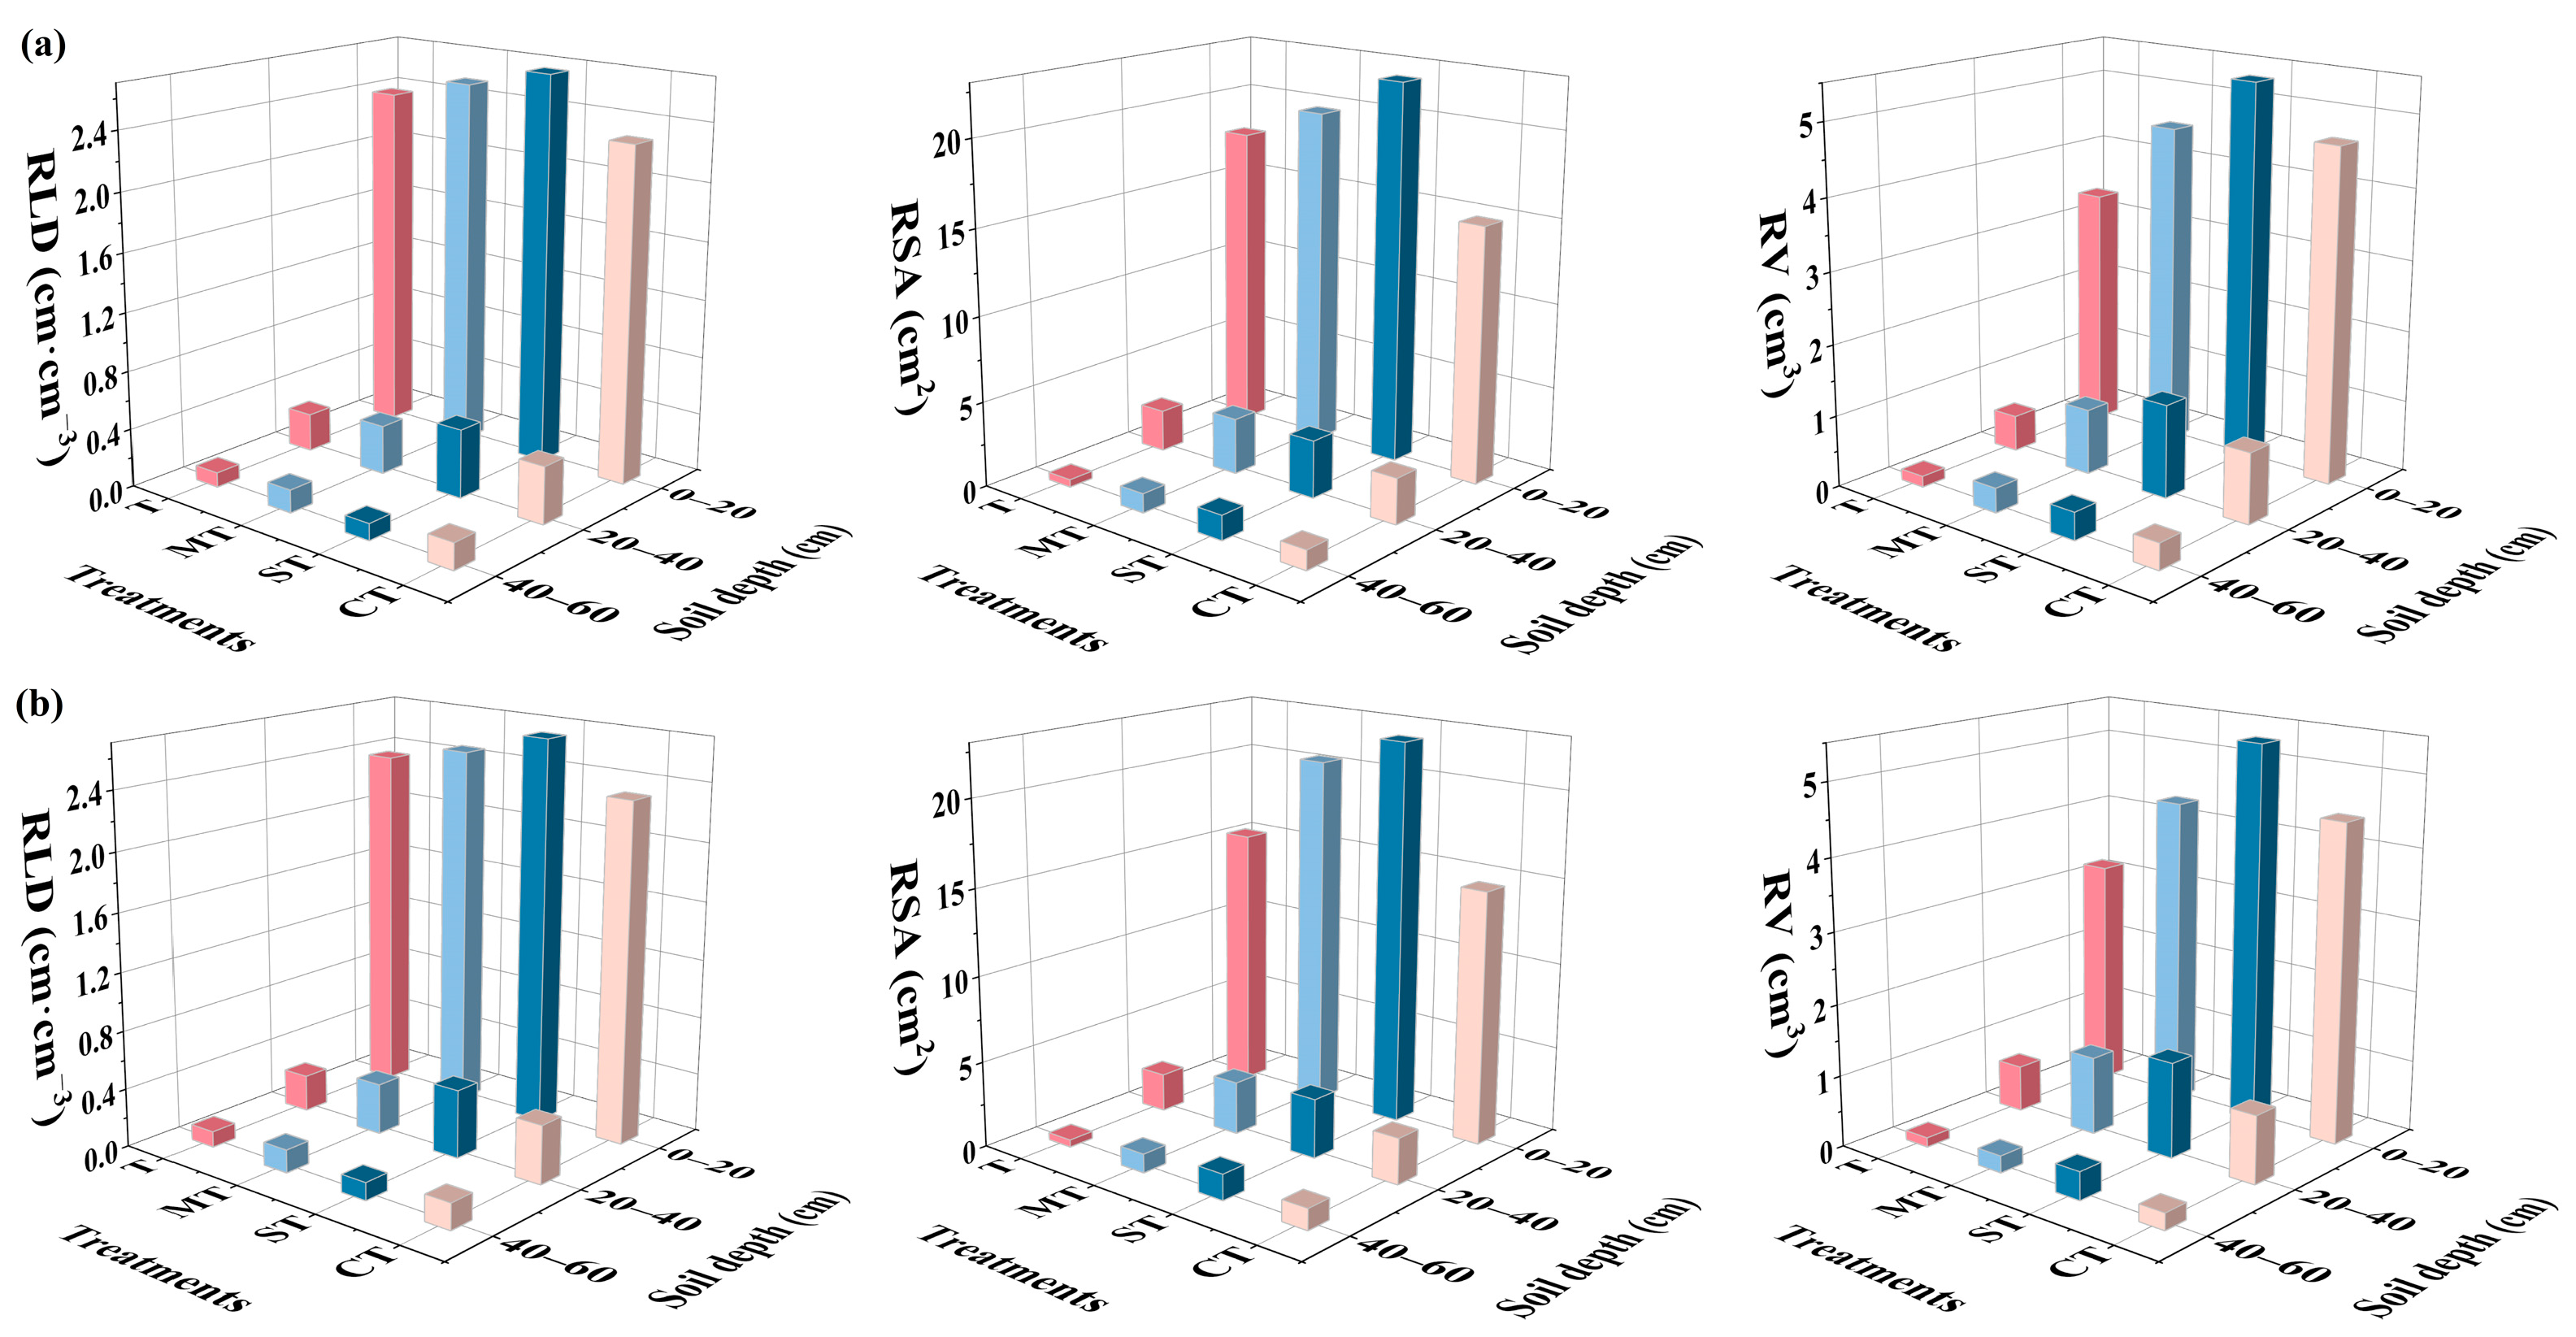
3.6. Root Distribution of Tiger Nuts

The two-year experimental data showed that the roots of tiger nuts were mainly concentrated in the 0–20 cm soil layer, and the Root Length Density (RLD), Root Surface Area (RSA), and Root Volume (RV) showed a downward trend with increasing soil depth (Figure 6). At the same soil depth, the RLD, RSA, and RV of tiger nuts under the MT and ST modes were higher than those under the T mode.
In 2020, in the 0–20 cm soil layer, compared with the T mode, the RLD, RSA, and RV of the MT and ST modes increased by 6.2%, 11.1%, 34.6%, and 12.2%, 25.0%, 58.7%, respectively. In the CT mode, the RLD and RSA of tiger nuts decreased by 3.38% and 15.8%, respectively, while only the RV increased by 38.6%. At 20–40 cm and 40–60 cm depths, the RLD, RSA, and RV in the MT, ST, and CT modes increased significantly. The results of 2021 were similar to those of 2020. The RLD, RSA, and RV of the three intercropping modes increased significantly, while in the 0–20 cm soil layer, only the RLD and RSA of the CT mode decreased by 1.6% and 3.8%, respectively.

3.7. The Yield of Crops and Composition Factors of Tiger Nuts

As shown in Table 2, the test data from the two years indicated that the grain number per plant and grain weight per plant in the MT mode increased by 12.9~13.2% and 0.5~2.3%, respectively. In the ST mode, the number of grains per plant increased, but the difference was not significant, and the grain weight per plant decreased significantly by 10.0~10.8% compared to the T mode. The 100-grain weight decreased under all three intercropping modes. In the CT mode, the number of grains per plant, grain weight per plant, and 100-grain weight were significantly reduced by 8.5~8.8%, 27.8~31.5%, and 23.4~28.6%, respectively.
Under the four planting modes, the yield of tiger nuts in the ST mode was the highest, reaching 11,189.3 kg·hm−2 and 10,826.2 kg·hm−2 over the two years. However, the yield of the ST mode decreased by 8.6~12.5% compared to the first year. The yields in the MT and CT modes decreased in turn and were significantly lower than in the T mode, with decreases of 20.2~25.1% and 26.09~33.4%, respectively.
The yields of intercropping maize, soybean, and cotton had decreased (Table 3). Compared with monoculture, the yield of intercropping maize decreased by 59.4~62.5% in two years. The yield of intercropping soybean decreased by 63.1~70.4% in two years. The cotton yield decreased by 54.9~62.9% in two years.

3.8. Land Equivalent Ratio (LER) and Aggressivity

All three intercropping patterns exhibited intercropping advantages (Table 4). In 2020 and 2021, the LER of the CT mode was 1.12 and 1.10, respectively, the LER of the MT mode was 1.17 and 1.16, and the LER of the ST mode was 1.21 and 1.24. Aggression measures the competition between crops by the degree of difference in the expected yield of the two intercropping crops. This study showed that Am, As, and Ac were all less than 0, indicating that tiger nut was more competitive than other crops, and tiger nut was the dominant species.

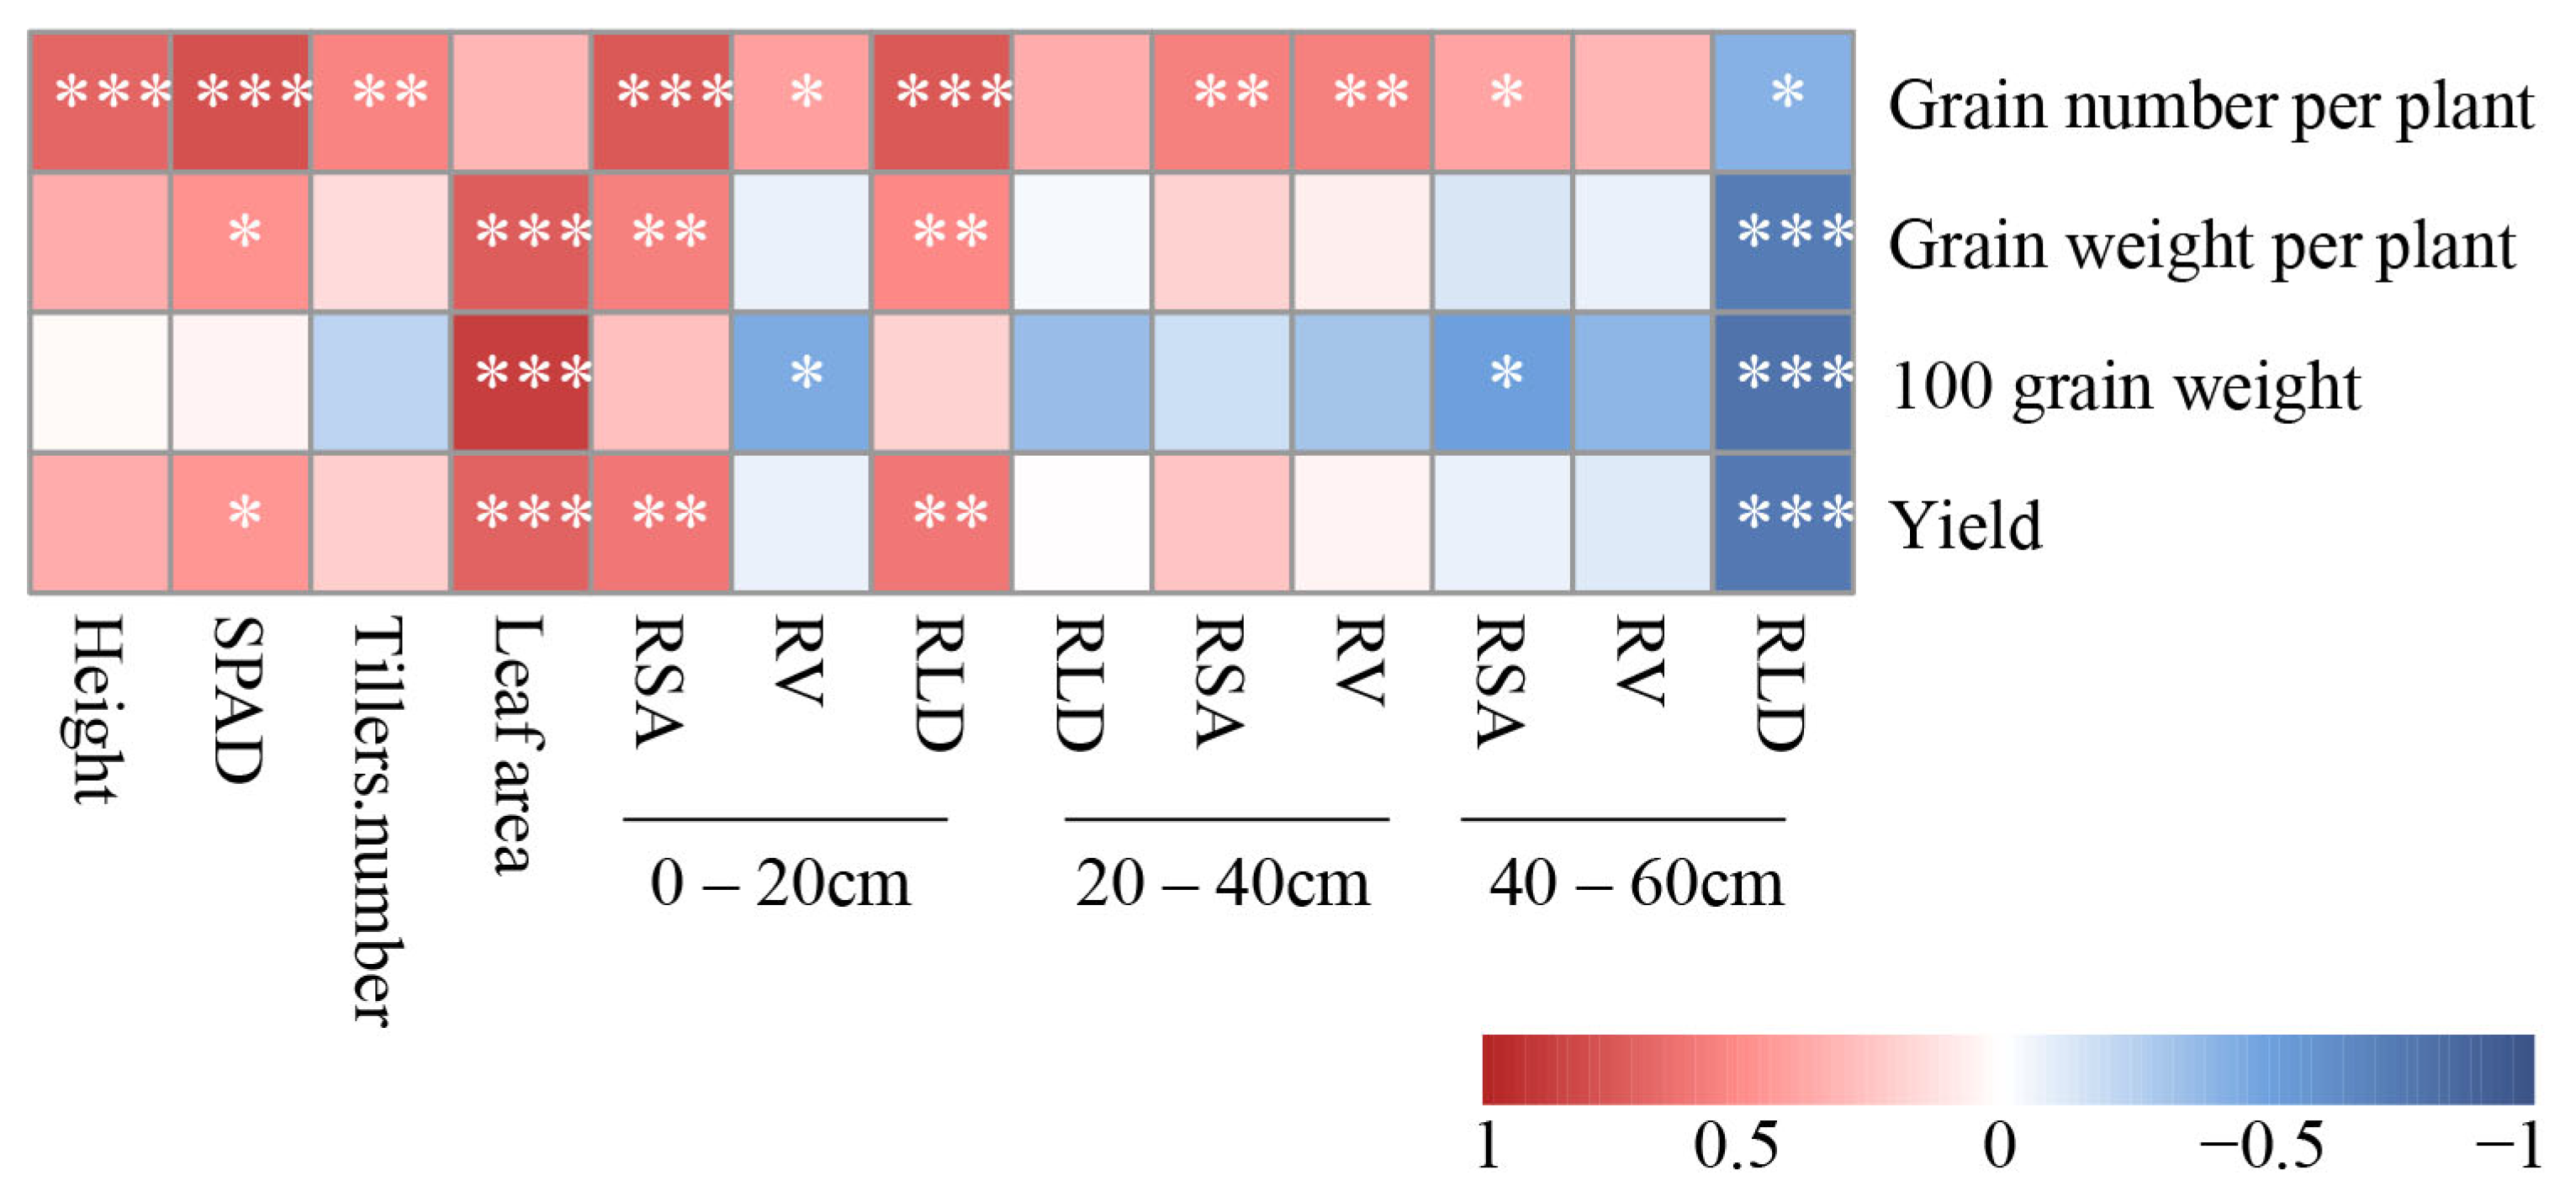
3.9. Correlation between Agronomic Traits and Yield Components

Pearson correlation analysis (Figure 7) showed that plant height, SPAD value, tiller number, and leaf area were significantly positively correlated with grain number per plant, grain weight per plant, and yield (R2 = 0.159~0.787 ***). Among these, plant height, SPAD value, and leaf area were significantly positively correlated with 100-grain weight, while tiller numbers were negatively correlated with 100-grain weight.
At the 0–20 cm soil depth, RSA and RLD were significantly positively correlated with grain number per plant, grain weight per plant, 100-grain weight, and yield (R2 = 0.293~0.755 ***). Conversely, RV was negatively correlated with grain weight per plant, 100-grain weight, and yield. At the 20–40 cm soil depth, RLD, RSA, and RV were significantly positively correlated with grain number per plant, grain weight per plant, and yield (R2 = 0.055~0.571 **). However, RLD, RSA, and RV were negatively correlated with 100–grain weight. At the 40–60 cm soil depth, RSA and RV were positively correlated with grain number per plant and negatively correlated with grain weight per plant, 100-grain weight, and yield. RLD was significantly negatively correlated with grain number per plant, grain weight per plant, 100-grain weight, and yield (R2 = 0.412 *~0.785 ***).

4. Discussion

4.1. The Agronomic Traits of Tiger Nut

Plant height, leaf area, tiller number, and plant fresh weight are important parameters for studying the competitive ability of tiger nuts. Plant height reflects crop growth and development, plant growth speed, and robustness [33]. Chlorophyll, a pigment that reflects the green color of plants, plays a crucial role in the absorption, transmission, and transformation of light energy [34,35]. It is directly related to the potential photosynthetic activity and nutritional status of plants [36].
This study shows that the tiller numbers and plant fresh weight of tiger nuts increased and the plant height and SPAD value of tiger nuts were significantly increased in MT and ST intercropping systems, similar to the findings by Liu et al. [37]. By analyzing SPAD measurements, nitrogen levels in plants can be assessed [38]. Intercropping with leguminous crops, such as soybeans, can provide some of the required nitrogen for tiger nuts through nitrogen fixation, improving nitrogen absorption and utilization efficiency. This may be due to the complementary effects of interspecies interactions, where crops with complementary traits actively interact to enhance growth and development. These interactions are beneficial not only for the growth and development of intercropped crops but also for improving overall crop yield [39]. Therefore, the growth of tiger nut intercropped with soybean was the best. Maize, being a tall crop, competes more effectively for light, water, and nutrients than the shorter tiger nut. Appropriate shading is beneficial for crop growth [40]. Therefore, in the early growth stages of tiger nuts, the lack of significant shading from corn plants made the MT mode beneficial for tiger nut growth. Before the tillering stage, the related agronomic traits in the MT mode were higher than those in the ST mode because soybeans require nodulation and nitrogen fixation in the early stages. As rhizobia cannot fully provide the nitrogen required for soybean growth, soybeans must also obtain nitrogen from the soil, leading to fierce competition with tiger nuts. In the later stages of tiger nut growth in the MT mode, as the growth period progressed, the increased shading from corn plants hindered tiger nut growth, resulting in slower growth in plant height and lower SPAD values [41]. However, the growth and development of soybean plants are slow in the later stages, and rhizobia can provide sufficient nitrogen. Therefore, tiger nuts can fully absorb the elements in the soil, ultimately increasing nutrient uptake in the entire intercropping system. Thus, in the late growth stages, the plant height, SPAD value, number of stems and tillers, and plant fresh weight of tiger nuts under the ST intercropping system were significantly higher than those under the MT mode.
Crops must absorb nutrients such as nitrogen, phosphorus, and potassium during their growth and development. In the CT mode, the growth of tiger nuts was poor, and the SPAD value was lower than in the T mode. This may be due to the competition between cotton and tiger nuts being greater than their interaction, resulting in an unbalanced absorption of nutrients by tiger nuts. Moreover, potassium is involved in many physiological processes [42]. Potassium deficiency can lead to a decrease in the number and size of leaves, thereby reducing the photosynthetic source material and photosynthetic rate [43], resulting in stunted growth of tiger nuts.

4.2. The Morphological Distribution of the Root System of Tiger Nut during the Tuber Stage

The root system is a key area for competition and compensation of crop resources, playing an important role in obtaining soil nutrients and water and restoring plant vitality [44]. The results showed that the vertical distribution of crop roots had a downward trend in each intercropping population. Xia et al. [45] demonstrated that maize and soybean intercropping promoted an increase in root weight and root–shoot ratio in each soil layer compared with their respective monocultures. In this experiment, compared with monoculture, the root–shoot ratio and underground dry weight under MT, ST, and CT modes also increased, indicating that intercropping was beneficial to the growth and development of crop roots. Additionally, Ehrmann et al. [46] showed that the interaction between maize and faba bean expanded the vertical and horizontal spatial niches of both crops, directly increasing root length density, root surface area, and root volume. The results of this study were similar. Compared with the monoculture mode, the RLD, root surface area, and root volume of tiger nuts in different intercropping modes were significantly increased in the 20–40 cm and 40–60 cm soil layers. The root morphology distribution of tiger nuts improved, indicating that intercropping effectively enhanced root morphology. Among them, the root changes under the ST mode were the most significant.
Crop root morphology also affects intercropping competition, and the process is complex [47,48]. When competition occurs, some crops tend to form larger roots, occupying a larger soil volume [49]. Cotton roots, for example, directly penetrate deeply into the soil to obtain more nutrients and compete more effectively [50]. At the same time, Te et al. [51] studied maize intercropping and found that maize roots extended laterally to soybean rows and vertically to a depth of 100 cm, thereby improving nutrient and water absorption under competitive conditions. Maize can more effectively use deep water and nutrients [52]. Therefore, the RLD, root surface area, and root volume of tiger nuts under MT and CT modes were lower than those under the ST mode.

4.3. Yield of Tiger Nut and Intercropping Advantages

Different planting modes have a significant effect on the yield of tiger nuts. However, the implementation of each model varies. From the perspective of crop yield composition and yield, not all intercropping modes have a positive impact. The CT mode not only reduced the number of grains per plant, grain weight per plant, and 100-grain seed weight, but also reduced the overall yield. In the MT mode, the competition effect between maize and tiger nuts was greater than the promotion effect, leading to reduced photosynthetic products due to shading by maize. This resulted in insufficient nutrients [53] for tiger nut growth, decreased 100-grain weight, and ultimately affected the yield of tiger nuts. Only the ST mode increased the number of grains per plant and grain weight per plant, thus increasing the overall yield. The growth and yield of crops are closely related to their root distribution. The plasticity of intercropping crop roots enables effective competition for water and nutrients, playing an important role in yield formation [30,54,55]. Soybean intercropping expanded the root niche of tiger nuts in both horizontal and vertical directions, promoting nitrogen absorption by tiger nut roots, enhancing root activity, and increasing yield. The 100-grain weight in the three intercropping modes decreased because tiger nuts continue to tiller for interspecific competition. Excessive tillering leads to insufficient nutrients in the later stages of plant growth, less effective tillering, lower 100-grain weight, and significantly reduced yield.
Among the three intercropping modes, the LER of the ST mode was the highest, indicating that the nitrogen fixation of legume crops was conducive to the growth and development of intercropped crops [55,56,57]. The relatively weak shading effect of soybean also facilitated the photosynthesis of tiger nuts. However, the LER of MT, ST, and CT modes were all greater than 1, indicating that in the intercropping system, the increased yields of maize and cotton compensated for the loss of tiger nuts, suggesting that the intercropping system still had certain planting advantages.
Despite the long period of cultivation and promotion of tiger nuts in China, the industrial system is still incomplete and in its infancy. In some areas, tiger nuts are considered one of the most harmful weeds [58]. On one hand, due to the lack of promotion, farmers do not see the economic value of tiger nuts, leading to low acceptance and enthusiasm for planting. Additionally, the imperfect industrial system results in a lack of long-term and stable sales and processing channels, and the market acceptance of processed products needs improvement. On the other hand, basic research on tiger nuts in China is insufficient, lacking the technical and theoretical support necessary for achieving high quality and high yield.

5. Conclusions

Crop planting systems and crop selection are crucial factors determining the success of intercropping. Appropriate combinations are conducive to strengthening the positive interactions between crops, reducing competition, and improving productivity. This study found that different planting systems had varying effects on the growth and development of tiger nuts. The agronomic traits (plant height, tiller numbers, SPAD value) of tiger nuts under intercropping modes were improved to varying degrees, except for leaf area. Compared with monoculture, the RLD of intercropped tiger nuts increased, indicating an expanded root distribution range. The intercropping of soybean and tiger nut showed the most significant yield advantage, with a land equivalent ratio of 1.21~1.24.
The cultivation and development of tiger nuts in China face challenges such as insufficient promotion, limited variety, few high-quality varieties, and the risk of degradation. Addressing these issues requires the efforts of relevant stakeholders to fill the fundamental gaps and lay the groundwork for the early industrialization of tiger nuts.

Author Contributions

Conceptualization, W.Z. and Z.L.; methodology, W.Z. and Z.L.; software, Z.L.; validation, W.W.; formal analysis, Z.L.; investigation, Z.L. and T.L.; resources, L.S.; data curation, Z.L.; writing-original draft, Z.L.; writing—review and editing, W.Z.; visualization, Z.L.; supervision, W.Z. and J.W.; project administration, W.Z. and L.L.; funding acquisition, W.Z. All authors have read and agreed to the published version of the manuscript.

Funding

This work was financially supported by the Tianshan Talent Program of Xinjiang province (TTPX202009).

Data Availability Statement

The data presented in this study are available on request from the corresponding author.

Conflicts of Interest

The authors declare no conflicts of interest.

References

  1. Pascual, B.; Maroto, J.V.; López-Galarza, S.; Sanbautista, A.; Alagarda, J. Chufa (Cyperus esculentus L. var. sativus boeck.): An unconventional crop. studies related to applications and cultivation. Econ. Bot. 2000, 54, 439–448. [Google Scholar] [CrossRef]
  2. De-Vries, F.T. Chufa (Cyperus esculentus, cyperaceae): A weedy cultivar or a cultivated weed? Econ. Bot. 1991, 45, 27–37. [Google Scholar] [CrossRef]
  3. Rebezov, M.; Usman Khan, M.; Bouyahya, A.; Imran, M.; Tufail, T.; Loretts, O.; Shariati, M.A. Nutritional and technical aspect of tiger nut and its micro-constituents: An overview. Food Rev. Int. 2023, 39, 3262–3282. [Google Scholar] [CrossRef]
  4. Zhang, Y.; Sun, S. Tiger nut (Cyperus esculentus L.) oil: A review of bioactive compounds, extraction technologies, potential hazards and applications. Food Chem. X 2023, 19, 100868. [Google Scholar] [CrossRef] [PubMed]
  5. Liu, D.; Ji, H.; Yang, Z. Functional characterization of three novel genes encoding diacylglycerol acyltransferase (DGAT) from oil-rich tubers of Cyperus esculentus. Plant Cell Physiol. 2020, 61, 118–129. [Google Scholar] [CrossRef]
  6. Gasparre, N.; Rosell, C.M. Role of hydrocolloids in gluten free noodles made with tiger nut flour as non-conventional powder. Food Hydrocoll. 2019, 97, 105194. [Google Scholar] [CrossRef]
  7. Carvalho Barros, J.; Munekata, P.E.; de Carvalho, F.A.L.; Pateiro, M.; Barba, F.J.; Domínguez, R.; Lorenzo, J.M. Use of tiger nut (Cyperus esculentus L.) oil emulsion as animal fat replacement in beef burgers. Foods 2020, 9, 44. [Google Scholar] [CrossRef] [PubMed]
  8. Badejo, A.A.; Falarunu, A.J.; Duyilemi, T.I.; Fasuhanmi, O.S. Antioxidative and anti-diabetic potentials of tigernut (Cyperus esculentus) sedge beverages fortified with Vernonia amygdalina and Momordica charantia. J. Food Meas. Charact. 2020, 14, 2790–2799. [Google Scholar] [CrossRef]
  9. Bamishaiye, E.; Bamishaiye, O.M. Tiger nut: As a plant, its derivatives and benefits. Afr. J. Food Agric. Nutr. Dev. 2011, 11, 5157–5170. [Google Scholar] [CrossRef]
  10. Yang, X.; Niu, L.; Zhang, Y.; Ren, W.; Yang, C.; Yang, J.; Zhang, J. Morpho-agronomic and biochemical characterization of accessions of tiger nut (Cyperus esculentus) grown in the north temperate zone of China. Plants 2022, 11, 923. [Google Scholar] [CrossRef]
  11. Maduka, N.; Ire, F.S. Tigernut plant and useful application of tigernut tubers (Cyperus esculentus)—A review. Curr. J. Appl. Sci. Tech. 2018, 29, 1–23. [Google Scholar] [CrossRef]
  12. Arafat, S.M.; Gaafar, A.M.; Basuny, A.M.; Nassef, S.L. Chufa tubers (Cyperus esculentus L.): As a new source of food. World Appl. Sci. J. 2009, 7, 151–156. [Google Scholar]
  13. Wezel, A.; Casagrande, M.; Celette, F.; Vian, J.-F.; Ferrer, A.; Peigné, J. Agroecological practices for sustainable agriculture. A review. Agron. Sustain. Dev. 2014, 34, 1–20. [Google Scholar] [CrossRef]
  14. Willey, R.W. Resource use in intercropping systems. Agric. Water Manag. Irrig. Sugarcane Assoc. Crops 1990, 17, 215–231. [Google Scholar] [CrossRef]
  15. Dogliotti, S.; Van Ittersum, M.K.; Rossing, W.A.H. Influence of farm resource endowment on possibilities for sustainable development: A case study for vegetable farms in South Uruguay. J. Environ. Manag. 2006, 78, 305–315. [Google Scholar] [CrossRef] [PubMed]
  16. Pramanick, B.; Kumar, M.; Naik, B.M.; Singh, S.K.; Kumar, M.; Singh, S.V. Soil carbon-nutrient cycling, energetics, and carbon footprint in calcareous soils with adoption of long-term conservation tillage practices and cropping systems diversification. Sci. Total Environ. 2024, 912, 169421. [Google Scholar] [CrossRef] [PubMed]
  17. Raza, M.A.; Zhiqi, W.; Yasin, H.S.; Gul, H.; Qin, R.; Rehman, S.U.; Zhongming, M. Effect of crop combination on yield performance, nutrient uptake, and land use advantage of cereal/legume intercropping systems. Field Crops Res. 2023, 304, 109144. [Google Scholar] [CrossRef]
  18. Du, Q.; Zhou, L.; Chen, P.; Liu, X.M.; Song, C.; Yang, F.; Yong, T. Relay-intercropping soybean with maize maintains soil fertility and increases nitrogen recovery efficiency by reducing nitrogen input. Crop J. 2020, 8, 140–152. [Google Scholar] [CrossRef]
  19. Bargaz, A.; Isaac, M.E.; Jensen, E.S.; Carlsson, G. Intercropping of faba bean with wheat under low water availability promotes faba bean nodulation and root growth in deeper soil layers, procedia. Environ. Sci. 2015, 29, 111–112. [Google Scholar] [CrossRef]
  20. Betencourt, É. Interactions Entre Céréale et Légumineuse en Association et Acquisition de Phosphore du sol: Processus Rhizosphériques Sous-Jacents. Ph.D. Thesis, SupAgro, Montpellier, France, 2012. [Google Scholar]
  21. Hauggaard-Nielsen, H.; Jensen, E.S. Facilitative root interactions in intercrops. Plant Soil 2005, 274, 237–250. [Google Scholar] [CrossRef]
  22. Latati, M.; Blavet, D.; Alkama, N.; Laoufi, H.; Drevon, J.J.; Gérard, F.; Pansu, M.; Ounane, S.M. The intercropping cowpea-maize improves soil phosphorus availability and maize yields in an alkaline soil. Plant Soil 2014, 385, 181–191. [Google Scholar] [CrossRef]
  23. Latati, M.; Bargaz, A.; Belarbi, B.; Lazali, M.; Benlahrech, S.; Tellah, S.; Kaci, G.; Drevon, J.J.; Ounane, S.M. The intercropping common bean with maize improves the rhizobial efficiency, resource use and grain yield under low phosphorus availability. Eur. J. Agron. 2016, 72, 80–90. [Google Scholar] [CrossRef]
  24. Li, L.; Tilman, D.; Lambers, H.; Zhang, F.-S. Plant diversity and overyielding: Insights from belowground facilitation of intercropping in agriculture. New Phytol. 2014, 203, 63–69. [Google Scholar] [CrossRef]
  25. Zhao, D.; Yuan, J.; Hou, Y.; Li, T.; Liao, Y. Tempo-spatial dynamics of AMF under maize soybean intercropping. Chin. J. Eco-Agric. 2020, 28, 631–642. [Google Scholar]
  26. Lithourgidis, A.S.; Dordas, C.A.; Damalas, C.A.; Vlachostergios, D.N. Annual intercrops: An alternative pathway for sustainable agriculture. Aust. J. Crop Sci. 2011, 5, 396–410. [Google Scholar]
  27. Ezeh, O.; Gordon, M.H.; Niranjan, K. Tiger nut oil (Cyperus esculentus L.): A review of its composition and physico-chemical properties. Eur. J. Lipid Sci. Tech. 2014, 116, 783–794. [Google Scholar] [CrossRef]
  28. Zheng, X.; Liu, J.; Cheng, Z.; Sun, Y.; Li, L.; Wang, J. Improving Tuber Yield of Tiger Nut (Cyperus esculentus L.) through Nitrogen Fertilization in Sandy Farmland. Plants 2024, 13, 1063. [Google Scholar] [CrossRef]
  29. Gao, Y.; Duan, A.; Qiu, X.; Liu, Z.; Sun, J.; Zhang, J.; Wang, H. Distribution of roots and root length density in a maize/soybean strip intercropping system. Agric. Water Manag. 2010, 98, 199–212. [Google Scholar] [CrossRef]
  30. Adiku, S.G.K.; Ozier-Lafontaine, H.; Bajazet, T. Patterns of root growth and water uptake of a maize-cowpea mixture grown under greenhouse conditions. Plant Soil 2001, 235, 85–94. [Google Scholar] [CrossRef]
  31. Mead, R.; Willey, R.W. The Concept of a ‘Land Equivalent Ratio’ and Advantages in Yields from Intercropping. Exp. Agric. 1980, 16, 217–228. [Google Scholar] [CrossRef]
  32. Agegnehu, G.; Ghizaw, A.; Sinebo, W. Yield performance and land-use efficiency of barley and faba bean mixed cropping in Ethiopian highlands. Eur. J. Agron. 2006, 25, 202–207. [Google Scholar] [CrossRef]
  33. Verreynne, J.S.; Rabe, E.; Theron, K.I. The effect of combined deficit irrigation and summer trunk girdling on the internal fruit quality of ‘Marisol’ Clementines. Sci. Hortic. 2001, 91, 25–37. [Google Scholar] [CrossRef]
  34. Shu, H.; Wang, Y.; Zhang, S.; Liang, Y.; Lu, J.; Li, D.; Zhu, Y. Effect of light-shading on accumulation of chlorophylls and their precursors in tea shoots. J. Tea Sci. 2012, 32, 115–121. [Google Scholar]
  35. Steckel, L.E.; Sprague, C.L.; Hager, A.G.; Simmons, F.W.; Bollero, G.A. Effects of shading on common waterhemp (Amaranthus rudis) growth and development. Weed Sci. 2003, 51, 898–903. [Google Scholar] [CrossRef]
  36. Zotarelli, L.; Cardoso, E.G.; Piccinin, J.L.; Urquiaga, S.; Boddey, R.M.; Torres, E.; Alves, B.J.R. Calibration of a Minolta SPAD-502 Chlorophyll Meter for Evaluation of the Nitrogen Nutrition of Maize. Pesqui. Agropecuária Bras. 2003, 38, 1117–1122. Available online: http://www.scielo.br/pdf/pab/v38n9/18291 (accessed on 3 February 2024). [CrossRef]
  37. Liu, X.; Rahman, T.; Song, C.; Su, B.; Yang, F.; Yong, T.; Yang, W. Changes in light environment, morphology, growth and yield of soybean in maize-soybean intercropping systems. Field Crop Res. 2017, 200, 38–46. [Google Scholar] [CrossRef]
  38. de Oliveira, A.C.S.; Coelho, F.C.; Vieira, H.D.; Crevelari, J.A.; Rubim, R.F. Growth, nutrient content and SPAD value of corn in monoculture and in intercropping. Am. J. Plant Sci. 2014, 5, 49138. Available online: http://creativecommons.org/licenses/by/4.0/ (accessed on 5 February 2024).
  39. Bethlenfalvay, G.J.; Reyes-Solis, M.G.; Camel, S.B.; Ferrera-Cerrato, R. Nutrient transfer between the root zones of soybean and maize plants connected by a common mycorrhizal mycelium. Physiol. Plant 1991, 82, 423–432. [Google Scholar] [CrossRef]
  40. Statuto, D.; Picuno, P.; Abdel-Ghany, A.M. Shading methods for crop protection under greenhouse in Mediterranean areas. In Proceedings of the 47th International Symposium, Actual Tasks on Agricultural Engineering, Opatija, Croatia, 5–7 March 2019; Available online: https://iris.unibas.it/bitstream/11563/136047/2/Statuto%20et%20al.%2C%20ATAE%202019.pdf (accessed on 3 May 2024).
  41. Liu, W.G.; Ren, M.L. Effects of shade degrees on photosynthesis and lodging resistance degree of different shade tolerance soybean. Sci. Agric. Sin. 2016, 49, 1466–1475. [Google Scholar] [CrossRef]
  42. Prajapati, K.; Modi, H.A. The importance of potassium in plant growth—A review. Indian J. Plant Sci. 2012, 1, 177–186. [Google Scholar]
  43. Pettigrew, W.T. Potassium influences on yield and quality production for maize, wheat, soybean and cotton. Physiol. Plant. 2008, 133, 670–681. [Google Scholar] [CrossRef] [PubMed]
  44. Van Staden, J. Plant Roots—The Hidden Half, 3rd ed.; revised and expanded; Waisel, Y., Eshel, A., Kafkafi, U., Eds.; Marcel Dekker Inc.: New York, NY, USA, 2007; 1120p, including photographs and chemical structures, hardcover; ISBN 0-8247-0631-5. Available online: https://www.taylorandfrancis.com (accessed on 8 February 2024).
  45. Xia, H.Y.; Zhao, J.H.; Sun, J.H.; Bao, X.G.; Christie, P.; Zhang, F.S.; Li, L. Dynamics of root length and distribution and shoot biomass of maize as affected by intercropping with different companion crops and phosphorus application rates. Field Crops Res. 2013, 150, 52–62. [Google Scholar] [CrossRef]
  46. Ehrmann, J.; Ritz, K. Plant: Soil interactions in temperate multi-cropping production systems. Plant Soil 2014, 376, 1–29. [Google Scholar] [CrossRef]
  47. Wei, W.; Liu, T.; Shen, L.; Wang, X.; Zhang, S.; Zhang, W. Effect of maize (Zeal mays) and soybean (Glycine max) intercropping on yield and root development in xinjiang, China. Agriculture 2022, 12, 996. [Google Scholar] [CrossRef]
  48. Kim, B.M.; Horita, J.; Suzuki, J.I.; Tachiki, Y. Resource allocation in tragedy of the commons game in plants for belowground competition. J. Theor. Biol. 2021, 529, 110858. [Google Scholar] [CrossRef] [PubMed]
  49. Schenk, H.J. Root competition: Beyond resource depletion. J. Ecol. 2006, 94, 725–739. [Google Scholar] [CrossRef]
  50. Brown, H.B. Cotton Root Development in Certain South Louisiana Soils. 1932. Available online: https://repository.lsu.edu/cgi/viewcontent.cgi?article=1369&context=agexp (accessed on 12 February 2024).
  51. Te, X.; Din, A.M.U.; Cui, K.; Raza, M.A.; Ali, M.F.; Xiao, J.; Yang, W. Inter-specific root interactions and water use efficiency of maize/soybean relay strip intercropping. Field Crops Res. 2023, 291, 108793. [Google Scholar] [CrossRef]
  52. Ma, L.; Li, Y.; Wu, P.; Zhao, X.; Chen, X.; Gao, X. Effects of varied water regimes on root development and its relations with soil water under wheat/maize intercropping system. Plant Soil 2019, 439, 113–130. [Google Scholar] [CrossRef]
  53. Fan, Y.; Chen, J.; Cheng, Y.; Raza, M.A.; Wu, X.; Wang, Z.; Yang, F. Effect of shading and light recovery on the growth, leaf structure, and photosynthetic performance of soybean in a maize-soybean relay-strip intercropping system. PLoS ONE 2018, 13, e0198159. [Google Scholar] [CrossRef]
  54. Streit, J.; Meinen, C.; Rauber, R. Intercropping effects on root distribution of eight novel winter faba bean genotypes mixed with winter wheat. Field Crops Res. 2019, 235, 1–10. [Google Scholar] [CrossRef]
  55. Zhang, F.; Li, L. Using competitive and facilitative interactions in intercropping systems enhances crop productivity and nutrient-use efficiency. Plant Soil 2003, 248, 305–312. [Google Scholar] [CrossRef]
  56. Hauggaard-Nielsen, H.; Gooding, M.; Ambus, P.; Corre-Hellou, G.; Crozat, Y.; Dahlmann, C.; Jensen, E.S. Pea–barley intercropping for efficient symbiotic N2-fixation, soil N acquisition and use of other nutrients in European organic cropping systems. Field Crops Res. 2009, 113, 64–71. [Google Scholar] [CrossRef]
  57. Li, C.J.; Li, Y.Y.; Yu, C.B.; Sun, J.H.; Christie, P.; An, M.; Li, L. Crop nitrogen use and soil mineral nitrogen accumulation under different crop combinations and patterns of strip intercropping in northwest China. Plant Soil 2011, 342, 221–231. [Google Scholar] [CrossRef]
  58. Lauwers, M.; De Cauwer, B.; Nuyttens, D.; Cool, S.R.; Pieters, J.G. Hyperspectral classification of Cyperus esculentus clones and morphologically similar weeds. Sensors 2020, 20, 2504. [Google Scholar] [CrossRef]
Figure 1. Daily precipitation and average temperature from April to September in 2020 and 2021.
Agronomy 14 01270 g001
Figure 2. (a) Dynamic changes of tiger nut plant height in different planting modes and different growth periods in 2020. (b) Dynamic changes of tiger nut plant height in different planting modes and different growth periods in 2021. T: Tiger nut monoculture; MT: Maize–Tiger nut intercropping; ST: Soybean–Tiger nut intercropping; CT: Cotton–Tiger nut intercropping. Error bars indicate SD. Different lowercase letters indicate significant difference between different treatments in same period (p < 0.05).
Agronomy 14 01270 g002aAgronomy 14 01270 g002b
Figure 3. (a) Dynamic changes of tiger nut SPAD value in different planting modes and different growth periods in 2020. (b) Dynamic changes of tiger nut SPAD value in different planting modes and different growth periods in 2021. T: Tiger nut monoculture; MT: Maize–Tiger nut intercropping; ST: Soybean–Tiger nut intercropping; CT: Cotton–Tiger nut intercropping.
Agronomy 14 01270 g003
Figure 4. (a) Dynamic changes of tiger nut leaf area in different planting modes and different growth periods in 2020. (b) Dynamic changes of tiger nut leaf area in different planting modes and different growth periods in 2021. T: Tiger nut monoculture, MT: Maize–Tiger nut intercropping, ST: Soybean–Tiger nut intercropping, CT: Cotton–Tiger nut intercropping. Different lowercase letters indicate significant difference between different treatments in same period (p < 0.05).
Agronomy 14 01270 g004
Figure 5. (a): Dynamic changes of tiger nut plant free dry weight in different planting modes in 2020. (b): Dynamic changes of tiger nut plant dry weight in different planting modes in 2021. T: Tiger nut monoculture, MT: Maize–Tiger nut intercropping, ST: Soybean–Tiger nut intercropping, CT: Cotton–Tiger nut intercropping. Different lowercase letters indicate significant difference between different treatments in same period (p < 0.05).
Agronomy 14 01270 g005
Figure 6. (a) Dynamic changes of tiger nut root distribution in different planting modes in 2020. (b) Dynamic changes of tiger nut root distribution in different planting modes in 2021. RLD: Root Length Density; RSA: Root Surface Area; RV: Root Volume; T: Tiger nut monoculture, MT: Maize–Tiger nut intercropping; ST: Soybean–Tiger nut intercropping; CT: Cotton–Tiger nut intercropping.
Agronomy 14 01270 g006
Figure 7. Correlation heatmap of grain number per plant, grain weight per plant, 100-grain weight and yield with plant height, SPAD value, tiller number, leaf area and root system were drawn. Note: RSA: Root Surface Area; RV: Root Volume; RLD: Root Length Density. *, p < 0.05; **, p < 0.01; ***, p < 0.001.
Agronomy 14 01270 g007
Table 1. The tillers number of tiger nuts in different planting modes and growth stages in 2020 and 2021 (p < 0.05).
20202021
Growth StageTMTSTCTTMTSTCT
Seedling stage3.8 ± 0.8 b5.0 ± 0.7 a5.0 ± 0.7 a4.4 ± 0.6 ab3.6 ± 0.2 b5.2 ± 0.4 a4.8 ± 0.4 ab4.0 ± 0.6 ab
Tillering stage9.0 ± 1.2 c13.8 ± 1.3 a14.2 ± 0.8 a11.6 ± 0.8 b7.8 ± 0.4 c13.0 ± 0.7 a12.8 ± 0.3 a9.4 ± 0.5 b
Pre-tuber stage20.2 ± 1.5 c25.0 ± 1.0 a25.8 ± 0.8 a22.8 ± 0.9 b19.2 ± 0.6 c26.0 ± 0.7 a25.0 ± 0.5 ab23.8 ± 0.6 b
Tuber peak stage27.2 ± 0.8 d30.1 ± 0.6 b33.0 ± 1.0 a28.6 ± 1.1 c27.2 ± 0.7 c31.0 ± 0.5 b34.0 ± 0.7 a30.6 ± 0.5 b
Maturation stage30.4 ± 1.1 d34.0 ± 0.7 b35.6 ± 0.9 a32.4 ± 0.9 c30.6 ± 0.5 c33.8 ± 0.7 b36.8 ± 0.4 a32.8 ± 0.4 b
Note: T: tiger nut monoculture; MT: Maize–Tiger nut intercropping; ST: Soybean–Tiger nut intercropping, CT: Cotton–Tiger nut intercropping. Means followed by different letters are significantly different at 0.05 levels.
Table 2. The yield and composition factors of tiger nuts under different planting systems.
YearTreatmentGrain Number per PlantGrain Weight per Plant/g100-Grain Weight/gYield/kg·hm−2
2020T132.3 ± 2.7 bc72.8 ± 1.5 a57.1 ± 2.0 a11,189.3 a
MT139.0 ± 3.5 ab65.0 ± 2.3 b47.1 ± 1.1 b8927.2 b
ST149.3 ± 4.3 a73.1 ± 2.0 a49.7 ± 1.5 b10,231.1 a
CT120.7 ± 5.6 c49.9 ± 2.3 c40.8 ± 0.9 c7452.8 c
2021T133.7 ± 3.0 b71.9 ± 2.6 a53.7 ± 1.5 a10,826.2 ab
MT138.3 ± 3.9 b64.2 ± 1.1 b47.0 ± 0.9 b8112.2 b
ST151.3 ± 3.5 a73.5 ± 2.6 a49.6 ± 4.8 ab9468.1 a
CT122.3 ± 3.0 c51.9 ± 3.9 c41.4 ± 1.8 c7916.1 c
Note: Means followed by different letters are significantly different at 0.05 levels.
Table 3. Yield of monocropping and intercropping maize, soybean, and cotton in 2020 and 2021.
YearMTSTCT
Monoculture Maize
Yield/kg·hm−2
Intercropping Maize
Yield/kg·hm−2
Monoculture Soybean
Yield/kg·hm−2
Intercropping Soybean
Yield/kg·hm−2
Intercropping Cotton
Yield/kg·hm−2
Intercropping Cotton
Yield/kg·hm−2
20208839.7 a3312.9 b1664.6 a493.3 b5250.7 a2368.8 a
20219543.9 a3875.6 b1721.3 a634.9 b5658.6 b2097.3 b
Note: Means followed by different letters are significantly different at 0.05 levels.
Table 4. Land Equivalent Ratio (LER) and Aggressivity.
LERAggressivity
MTSTCTAmAsAc
20201.171.211.12−0.22−0.32−0.09
20211.161.241.10−0.21−0.27−0.17
Abbreviations: LER: land equivalent ratio; Am: aggressivity of maize; As: aggressivity of soybean; Ac: aggressivity of cotton.
Disclaimer/Publisher’s Note: The statements, opinions and data contained in all publications are solely those of the individual author(s) and contributor(s) and not of MDPI and/or the editor(s). MDPI and/or the editor(s) disclaim responsibility for any injury to people or property resulting from any ideas, methods, instructions or products referred to in the content.

