Article

The Impact of Environmental Variability on Cotton Fiber Quality: A Comparative Analysis of Primary Cotton-Producing Regions in Türkiye

by
Deniz Istipliler
1,2,
Müge Ekizoğlu
3,
Uğur Çakaloğulları
1 and
Özgür Tatar
1,*
1
Faculty of Agriculture, Department of Field Crops, Ege University, Bornova, Izmir 35100, Turkey
2
Center for Plant Science Innovation, University of Nebraska-Lincoln, Lincoln, NE 68588, USA
3
Izmir Commodity Exchange Laboratory, R&D and Consultancy Services INC, Izmir 35100, Turkey
*
Author to whom correspondence should be addressed.
Agronomy 2024, 14(6), 1276; https://doi.org/10.3390/agronomy14061276
Submission received: 30 April 2024 / Revised: 30 May 2024 / Accepted: 8 June 2024 / Published: 13 June 2024
(This article belongs to the Section Farming Sustainability)

Abstract

:
The quality of cotton fiber plays a pivotal role for both producers and processors, influencing the market value and end-product quality. Certain cotton fiber properties, such as length, strength, micronaire, and uniformity index, are crucial determinants of cotton quality. Despite its prominence as a cotton-producing region, the Aegean region in Türkiye lacks comprehensive studies examining the quality of its cotton fiber across different subregions and seasonal variations. This study aimed to address this gap by investigating the variations in cotton fiber quality across different years and subregions within the Aegean. This study involved the evaluation of a total of 368,686 individual fiber quality analyses conducted over seven years across three subregions within the Aegean in Türkiye. The fiber samples collected from Bergama, Söke, and Menemen underwent high-volume instrument (HVI) analysis to evaluate the variations in cotton fiber quality across years and subregions, considering the phenological stages of cotton and climate conditions. The findings highlighted significant variations in the fiber quality traits among subregions, with environmental factors such as temperature and humidity playing crucial roles. Higher average daily temperatures during the flowering stage to boll formation contributed to higher strength values, while limitations on fiber length were observed due to prevalent high temperatures. Additionally, variations in micronaire values were linked to temperature and humidity conditions during boll development stages. This study underscores the importance of comprehensively considering climatic factors to understand their impacts on cotton fiber quality and suggests further research into the cotton plant’s phenology and specific climate conditions for a more thorough understanding of environmental effects on fiber quality.

1. Introduction

The quality of cotton fiber is important for both cotton producers and processors [1]. For producers, fiber quality is paramount in determining the value of their cotton on the market. Likewise, for processors, especially in the yarn spinning process, fiber quality directly influences the end product [2]. Various properties are utilized by the cotton trade and spinning industry to assess fiber quality, including length, length uniformity, strength, micronaire, color, and trash [3]. Understanding the impact of these fiber quality properties on processing, as well as their genetic and environmental determinants, is essential for developing improvement strategies [4].
According to the Food and Agriculture Organization of the United Nations (FAO), Türkiye ranks as the world’s sixth-largest cotton fiber producer, with an annual production of 800,000 tonnes [5], and the Aegean region stands out as one of its primary cotton production areas [6]. The cotton fiber produced in the Aegean region, known as “Aegean Cotton”, is renowned for its high-quality attributes and is favored by textile producers [7]. Despite numerous studies evaluating the quality characteristics of Aegean cotton [6,8,9], there remains a lack of information regarding its quality properties across multiple years and different subregions.
The quality of cotton fiber is known to be influenced by both genotypic (G) factors [10,11,12] and environmental (E) factors [6,13,14], as well as the interaction between them (G × E) [15,16]. Given the significant dependence of quality on environmental conditions, it is crucial to understand the effects of various climatic factors across different cotton-growing regions on fiber quality traits. Various studies have explored the impact of environmental factors on fiber quality traits [3,17,18]. Among these factors, water limitation and drought conditions are considered the primary environmental constraints on fiber quality [19]. Research by Yağmur et al. [20] indicated that drought stress during early flowering and fiber elongation stages led to reduced fiber length, attributed to adverse effects on cell expansion. However, when the magnitude of the drought was taken into consideration, Basal et al. [21] found no significant fiber quality decrease when the irrigation water amount was reduced to 75% from 100%. Air temperature is another critical factor affecting cotton quality, primarily influencing secondary wall thickening during boll development [22]. This impact stems from constraints on net crop photosynthesis and carbohydrate production, leading to cellulose accumulation in fiber cells [23]. Pettigrew [17] found that fibers produced in warmer temperatures exhibited a 3% increase in strength compared to fibers under control conditions. Lokhande and Reddy [24] explored temperature effects comprehensively, revealing relationships between fiber quality traits and different day/night temperature regimes, observing an increase in micronaire and uniformity up to 26 °C, followed by a decline beyond this temperature, alongside a linear increase in fiber strength with rising temperatures. Additionally, they observed an increase in fiber length up to 22 °C, followed by a decrease. Luo et al. [23] also explored the current effect of increasing temperatures and the potential future effects, projecting an increase in micronaire beyond the optimum range of 3.8–4.5 by 2030 during the boll development stage.
Although numerous studies have explored the environmental effects on fiber quality characteristics, many have primarily focused on air temperature as the sole climatic factor [24,25,26] and evaluated the effects mainly during the boll development stage. A very limited number of studies have deciphered the effects of the climatic conditions during the different growth stages of the plant across various environmental conditions. For instance, relative air humidity within a specific temperature range may lead to variation in primary plant metabolism, including photosynthetic activity [27,28]. Vapor pressure deficit (VPD) as a function of air temperature and relative air humidity [29] strongly affects stomatal regulation and eventually carbohydrate biosynthesis [30]. Furthermore, wind speed has significant impacts on both air temperature and relative humidity overall [31]. Therefore, a comprehensive approach that considers the influence of meteorological factors such as wind speed/direction, relative air humidity, and rainfall at various growth stages of the plant, across multiple years and locations is necessary for a complete understanding of the environmental effects on cotton quality parameters. Thia study aimed to address four main objectives: (1) to investigate whether significant variations exist in cotton fiber quality across different years, considering varying climate conditions in the Aegean region; (2) to assess regional variations in the quality of cotton fiber; (3) to examine the contribution of climate variability, including temperature, air humidity, and wind speed/direction, during various developmental stages of cotton to changes in fiber quality; and (4) to understand the effect of interactions between climate and region on fiber properties.

2. Materials and Methods

2.1. Data Collection

The fiber quality data, comprising 368,686 individual analyses, were provided by Izmir Commodity Exchange R&D Laboratory and Consultancy Inc. (IZLADAS), Izmir, Türkiye. The analyses in this study were carried out by IZLADAS between 2014 and 2020. IZLADAS is a subsidiary of Izmir Commodity Exchange and is a laboratory company that provides analysis services to licensed warehouses authorized by the Ministry of Trade. Samples were collected from three subregions within the Aegean region: Bergama (n = 48,285), Söke (n = 283,353), and Menemen (n = 37,048), over seven years from 2014 to 2020. Quality analyses were conducted using a “Uster M1000 High Volume Instrument (HVI)” system (Uster Technologies AG, Uster, Switzerland). The analyses focused on four key quality traits: micronaire ( M i c ), strength ( S t r ), uniformity index ( U I ), and upper half mean length ( U H M L ). M i c was determined based on the air permeability of a sample, which was influenced by fiber fineness, maturity, and packing density. S t r was measured as the force required to break a fiber bundle and is typically reported in grams per tex or grams per denier. U I was calculated as the ratio of shorter fibers to longer fibers in the sample, U H M L representing the average length of the longer half of fibers in a cotton sample.
Climate data, including average air temperature (°C), maximum air temperature (°C), minimum air temperature (°C), relative air humidity (%), rainfall amount (mm), wind speed (m/s), and wind direction, were obtained from the Turkish State Meteorological Service, provided at daily resolution for each of the three subregions across the seven years (2014–2020).

2.2. Growth Stage Estimation

A comprehensive simulation algorithm utilizing planting dates and growing degree days (GDDs) was employed to accurately predict the timing of five key growth stages of cotton plants described by Oosterhuis [32]: emergence, squaring, boll development, flowering, and maturity. The estimation of the timing of the growth stages involved five consecutive steps, as explained below:
Step 1: Initially, soil temperature for each day was predicted as a function of air temperature using the following regression equation established by Zheng et al. [33]:
T soil = 1 7 i = 1 7 T air f 1 = 1.11 x + 1.32 f 2 = 1.12 x + 0.16 f 3 = 0.89 x + 2.31 f 4 = 0.78 x + 2.87 f 5 = 1.11 x + 3.76 f 6 = 1.27 x 1.14 f 7 = 0.99 x 1.40
where T s o i l represents the estimated soil temperature, and T a i r stands for the average air temperature for a given day. The f values were derived from the regression equations defined by Zheng et al. [33].
Step 2: The initial planting date was then estimated according to Boman and Lemon [34] using the algorithm considering the soil temperature defined below.
P D 0 = T air C u r r e n t s i m u l a t i o n d a t e , T s o i l 10 d a y 18.3 ° C S i m u l a t i o n p r o g r e s s e s , e l s e
The algorithm calculates the average air temperature of the last ten days ( T s o i l 10 d a y ) and defines the initial planting date ( P D 0 ) if the T s o i l 10 d a y is greater than 18.3 °C.
Step 3: The final planting dates for each year–subregion combination were selected based on the precipitation amount during the predefined optimal planting period according to the following algorithm:
P D f = T air P D 0 , P 5 d a y > 3 mm a n d P 10 d a y < 40 mm S i m u l a t i o n p r o g r e s s e s , e l s e
Step 4: Final planting date ( P D f ) was estimated if the total precipitation for the 5 days prior to the initial planting date ( P 5 d a y ) was more than 3 mm and total precipitation for the 10 days prior to P 5 d a y was less than 40 mm.
Step 5: After assigning planting dates, the algorithm estimated the dates corresponding to different growth stages by employing the cumulative Growing Degree Days (GDD) approach for cotton, based on the following formula reported by McMaster and Wilhelm [35]:
G D D = T m a x T m i n 2 T b a s e
where T m a x is the daily maximum air temperature, T m i n is the daily minimum air temperature, and T b a s e is the temperature below which the process of interest does not progress. The T b a s e for cotton is 15.6 °C according to Mauget et al. [36]. The average number of heat units (°C) required for various growth stages of cotton are given below [37]:
  • Emergence: 13 °C;
  • First square: 260 °C;
  • First flower: 454 °C;
  • First open boll: 927 °C;
  • Maturation: 1218 °C.
For each year and subregion, average climatic data corresponding to the cotton’s growth stages were recorded for subsequent analysis. The growth stage estimation results based on this calculation and model were observed and confirmed through field visits in all three regions.

2.3. Data Analysis

All data analyses were conducted using R software version 4.2.3 [38]. A simple linear model (model-1) was employed by using the lm function to investigate the relationship between the dependent variables (quality traits) and two independent variables: subregion and year. The model can be expressed as follows:
Y = β 0 + β 1 · REGION + β 2 · YEAR + ϵ
where Y is the dependent variable of interest, R E G I O N is the independent variable representing different subregions, Y E A R is another numerical or categorical independent variable representing the year of observation, β 0 is the intercept term, β 1 and β 2 are the coefficients (slopes) for the independent variables, and ϵ is the error term capturing the variability not explained by the model. Then, the anova function was used to check the statistical significance of each effect.
Pearson correlation coefficients were calculated with the cor function to evaluate the magnitude of the relationships between quality traits and the meteorological factors for each growth stage.
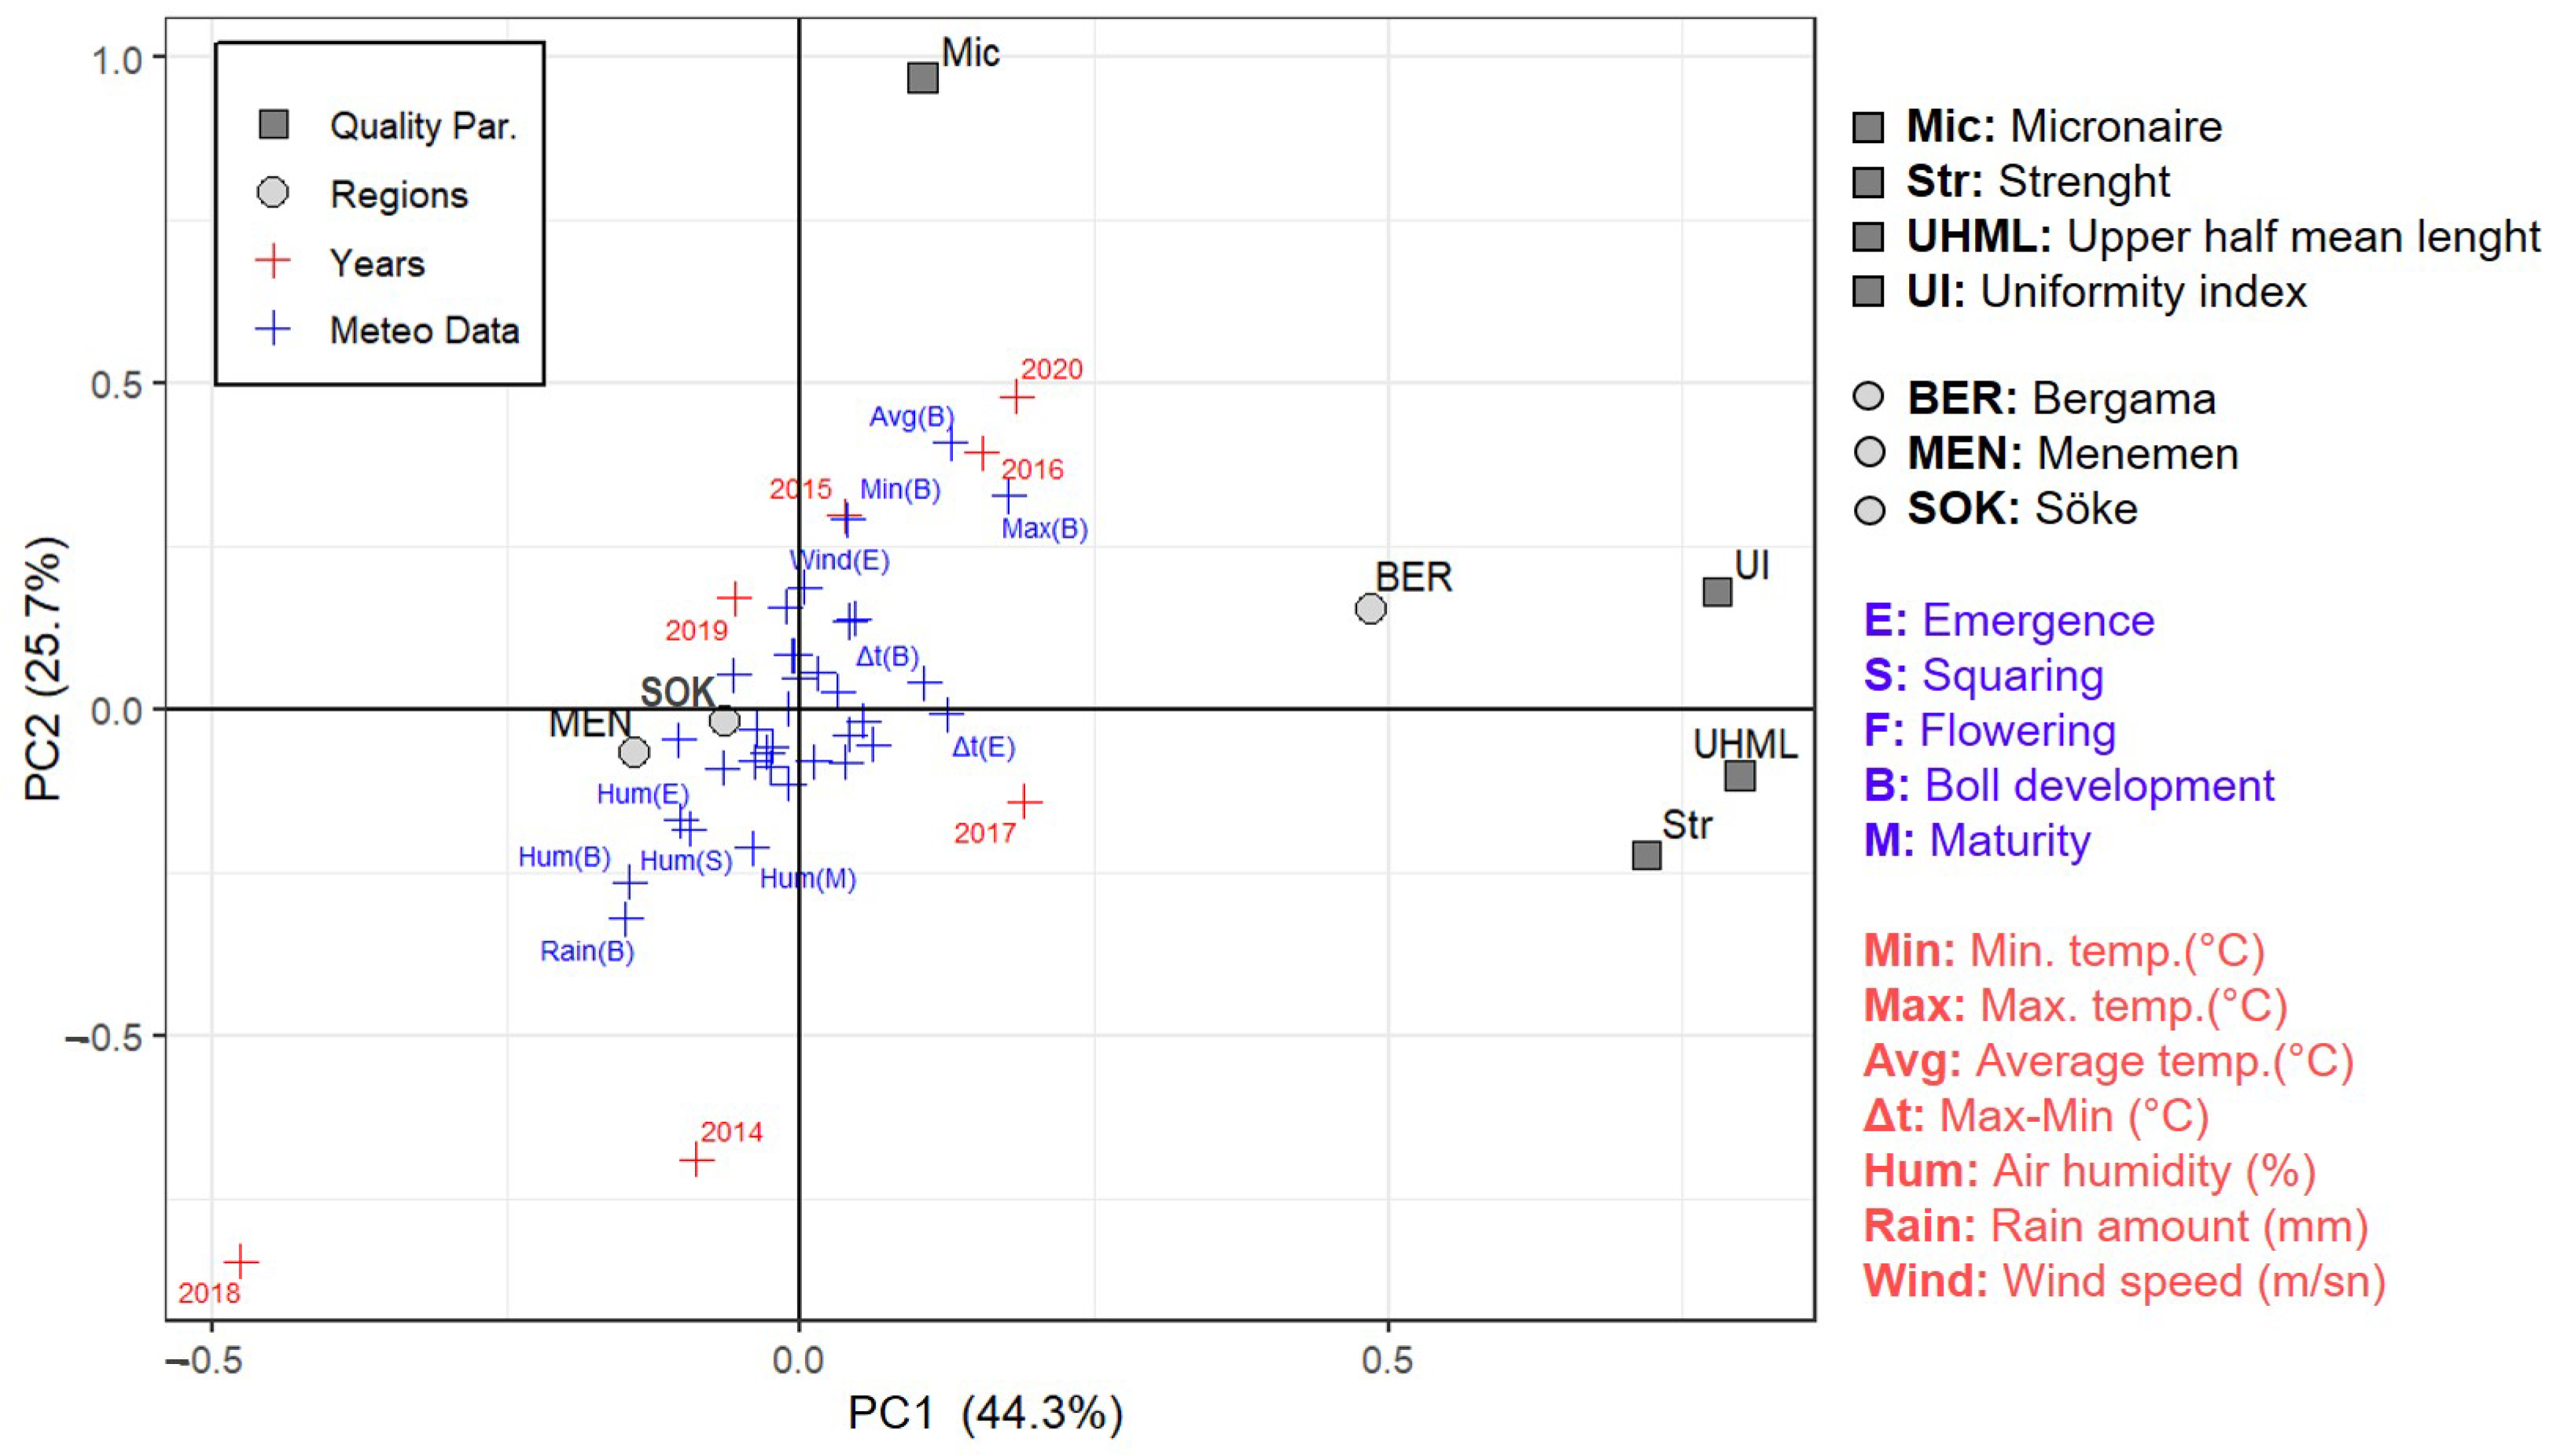
The quality traits and meteorological data were merged into one data frame, and another simple linear model (model-2) including all 35 meteorological measurements (e.g., seven meteorological indices from five growth stages) as fixed effects was used to evaluate the effects of each meteorological factor on the quality traits as well as to evaluate overall model performance. Principal component analysis (PCA) was conducted to visualize the factors affecting the quality traits in three subregions across seven years. The res.pca function was used from the F a c t o M i n e R package [39] in R. The factors of year and subregion were used as qualitative supplementary effects, while the meteorological data averages for each growth stage were used as quantitative supplementary effects in the function. Coordinates of the first two principal components (PCs) for each factor (traits, years, locations, and growth stages) were extracted and plotted by using the g g p l o t 2 [40] package in R.

3. Results

Among the regions examined, Menemen is situated approximately 60 km south of Bergama, with Söke located a further 100 km south of Menemen. While each location experienced similar daily average temperatures ranging between 22.4 °C and 22.9 °C, there were notable differences between the maximum and minimum temperatures ( Δ M a x M i n ) (Figure 1). Specifically, the average Δ M a x M i n in Söke (10.7 °C) was significantly lower than in Bergama (13.2 °C) and Menemen (12.7 °C). Additionally, Bergama had a slightly higher maximum temperature (30.0 °C) than Menemen (28.9 °C) and Söke (28.0 °C). Relative air humidity did not show significant differences among the three cotton-growing subregions examined. However, the average air humidity in 2014 (61.5%) stood out as notably higher compared to the other years (55.4%) (Figure 1). Similarly, the total precipitation amount received during the cotton-growing season in 2014 differed significantly, being 62.9% higher (averaging 180.5 mm) compared to the average of the other years. Notably, in Söke, the wind speed was determined to be significantly higher than in the other two regions (Figure 2), with an average of 3.2 m/s compared to 2.5 m/s in both Menemen and Bergama.
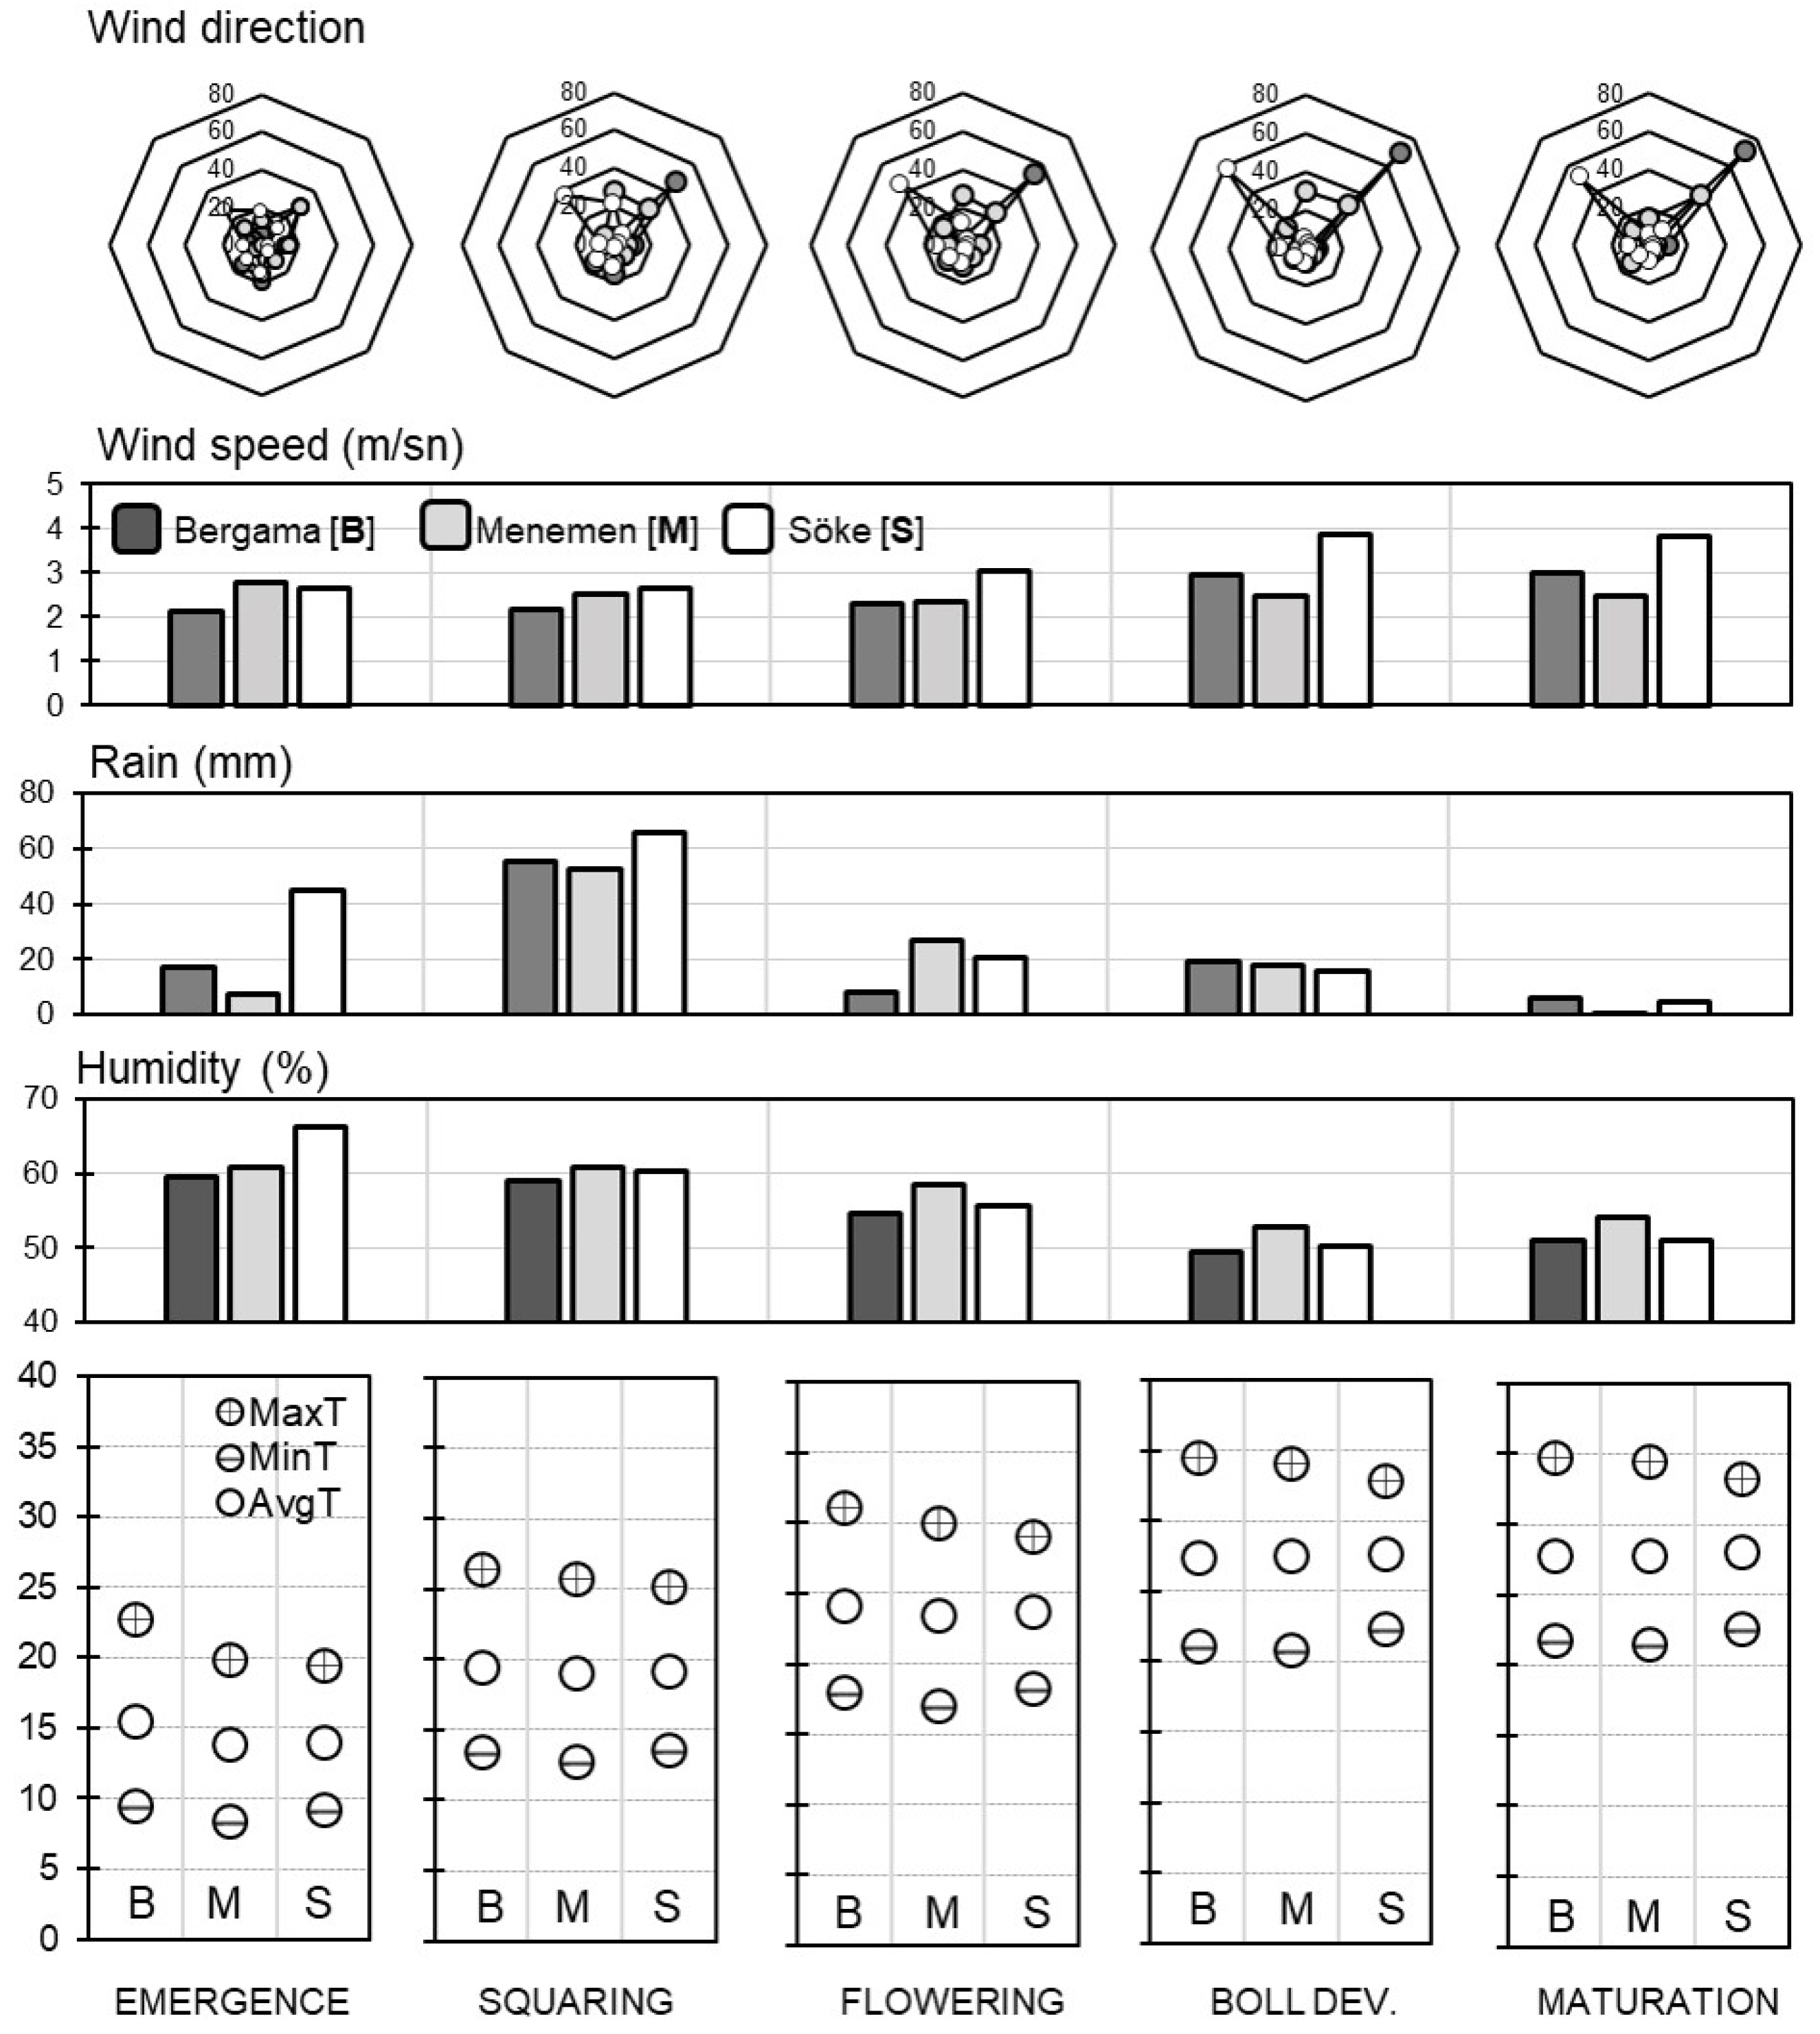
Figure 2 illustrates the main meteorological parameters categorized according to the cotton phenological stages in the examined regions. The data revealed distinct wind patterns, with northeast winds prevailing in Bergama and northwest winds in Söke, particularly during the flowering, boll development, and maturation periods. Furthermore, the late spring rainfall in Söke (total 111 mm), coinciding with the vegetative period of cotton, exceeded that in Bergama (total 73 mm) and Menemen (total 60 mm). The slightly lower atmospheric relative humidity in Bergama (51.7%) and Söke (52.3%) than Menemen (55.2%) during the generative stages of cotton was noticeable (Figure 2).
While daily average temperatures remained relatively stable, notable differences were observed in the maximum and minimum temperatures in Söke during the boll development and maturation periods following the flowering stage. Specifically, Söke experienced significantly higher minimum temperatures (difference of 1.1 °C) and lower maximum temperatures (difference of 2.7 °C). Conversely, Bergama exhibited slightly higher maximum temperatures (difference of 1.9 °C) and daily average temperatures (difference 0.9 °C) during the vegetative and early generative growth stages, including emergence, squaring, and flowering.
The analysis of variance (ANOVA) of model-1, which included the years and subregions as two main effects, showed that the effects of region and year were statistically significant for all investigated traits for all investigated quality traits (Tables S1–S4). The quality data fit a linear model in which all the meteorological measurements from each growth stage were used as factor variables (model-2). The ANOVA results showed that most of the meteorological factors in the linear model had significant effects on the evaluated quality traits (Tables S5–S8). The significant overall model p-values showed that all four models were useful in explaining the quality traits (Table 1). However, when the explanatory powers (adjusted R 2 ) of the models were taken into consideration, the meteorological data in the five different growth stages were able to explain the variability in Mic ( R 2 = 0.274) better than the other three quality traits. The adjusted R 2 values were 0.055, 0.055, and 0.051 for S t r , U I , and U H M L , respectively (Table 1). The residual standard errors (RSEs) also showed that there were smaller differences between the values predicted by the model and the actual values for M i c .
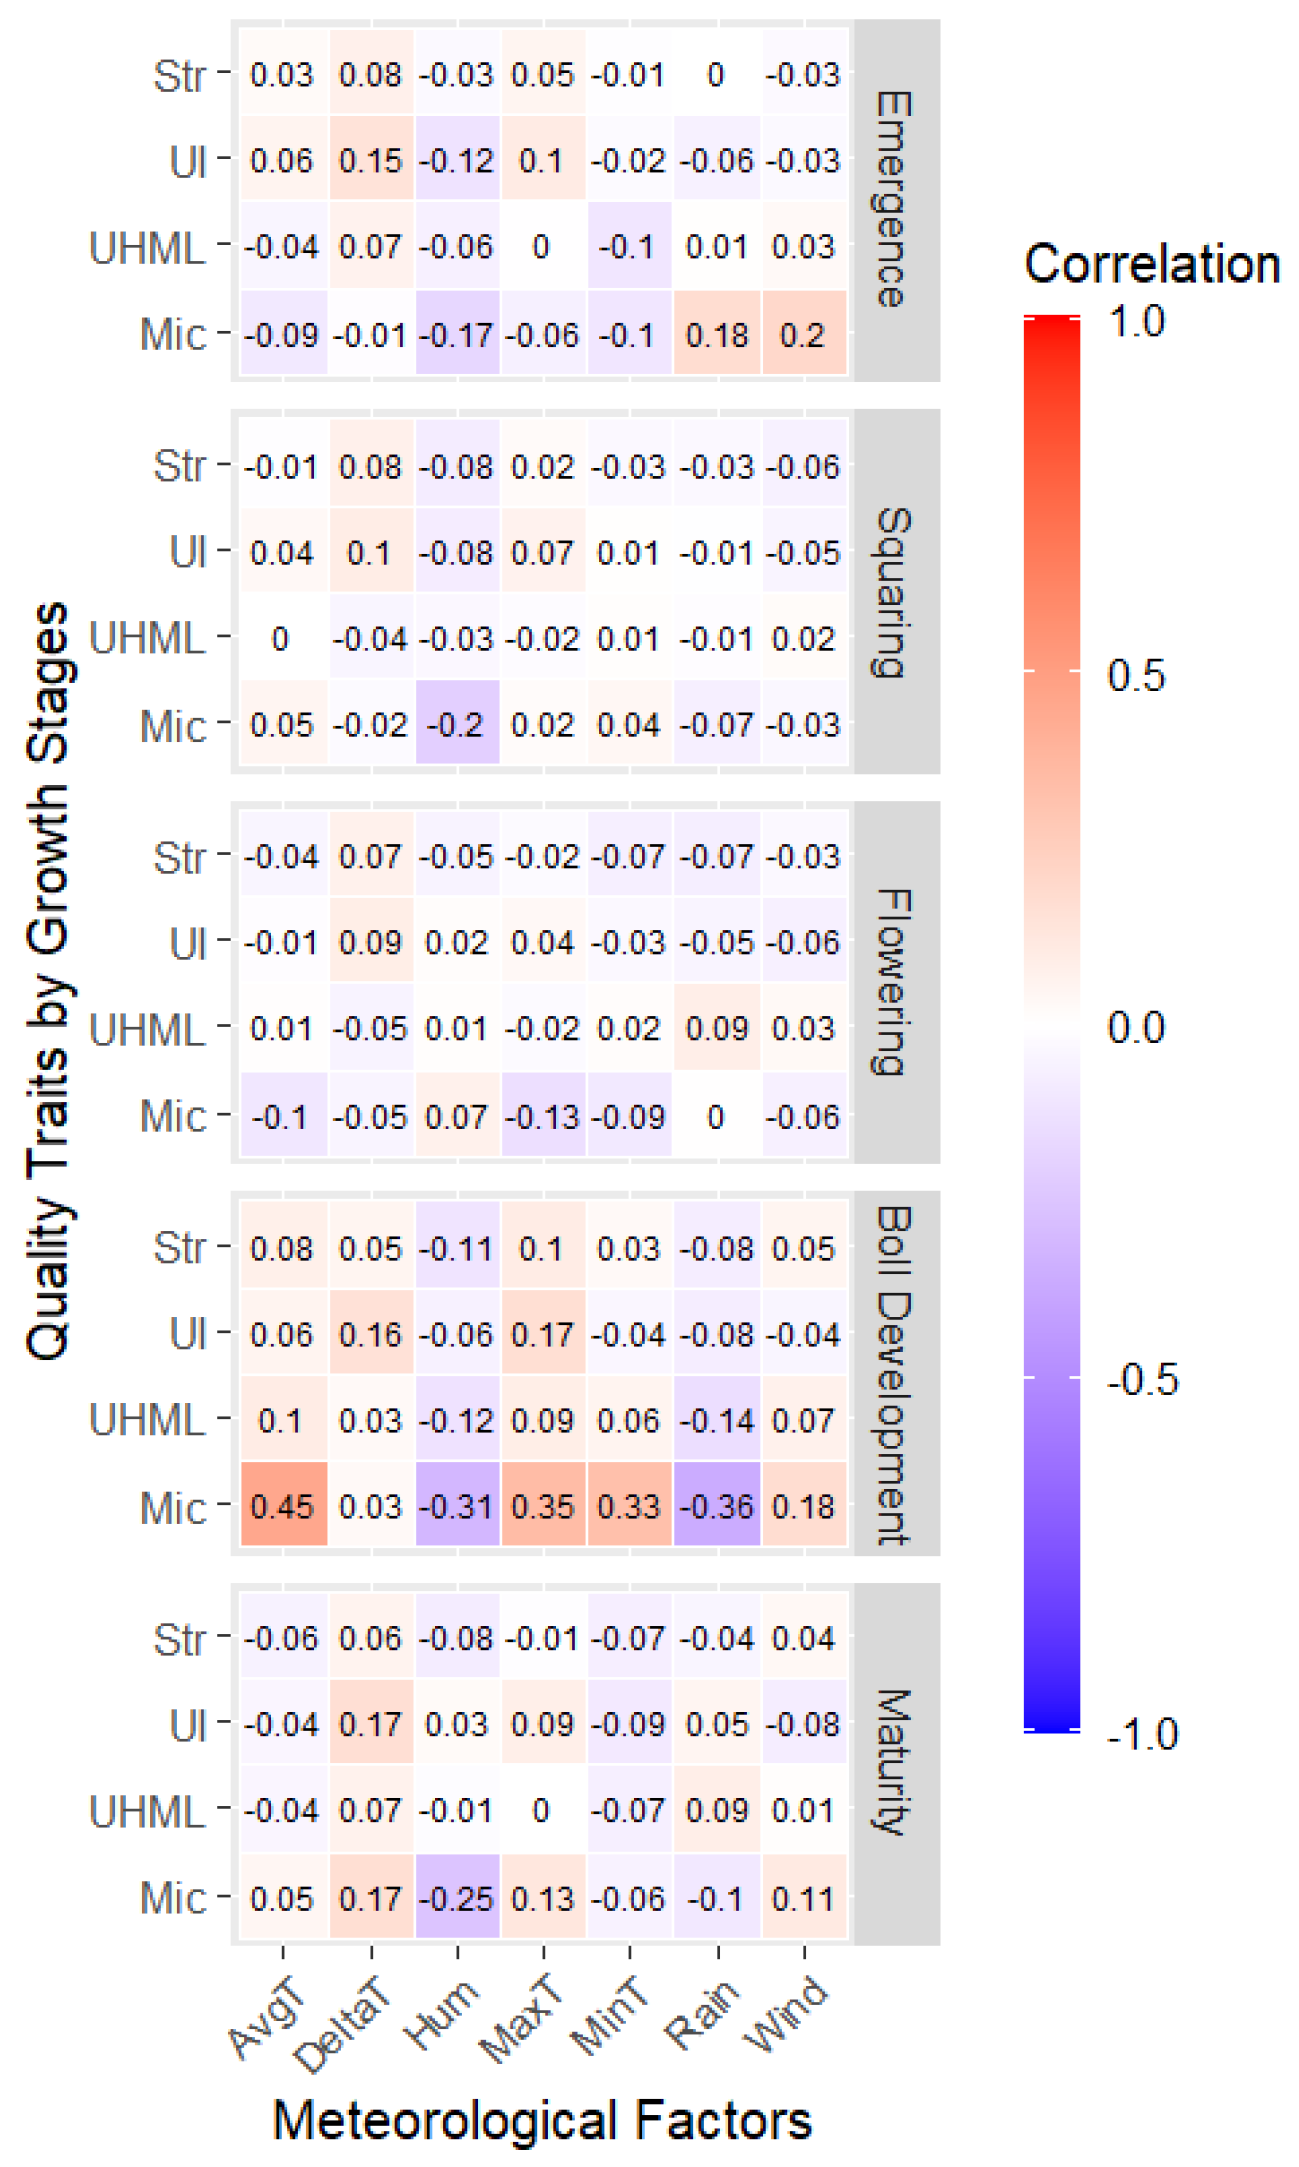
The Pearson correlation coefficients between each quality trait and the meteorological variables by growth stage showed that average temperature in the boll development stage was highly correlated with M i c ( r = 0.45 ); also, minimum ( r = 0.33 ) and maximum ( r = 0.35 ) daily temperatures were found to be correlated with M i c in the same growing period (Figure 3). On the other hand, rainfall in the boll development stage ( r = 0.36 ) and humidity in both the boll development ( r = 0.31 ) and maturity ( r = 0.25 ) stages were found to be negatively correlated with M i c values. Wind also had coefficients of 0.20 and 0.18 for M i c in the emergence and boll development stages. Notably, the correlation coefficients of Δ t were greater than 0.1 in all growth stages for U I . No obvious pattern or high correlation was detected for S t r or U H M L in terms of pairwise correlation coefficients. In general, the correlation coefficients were higher in the boll development stage than in the other stages, indicating that the meteorological factors in this stage played a crucial role in forming four of quality traits investigated. Especially M i c in this stage yielded the highest correlation coefficients (Figure 3).
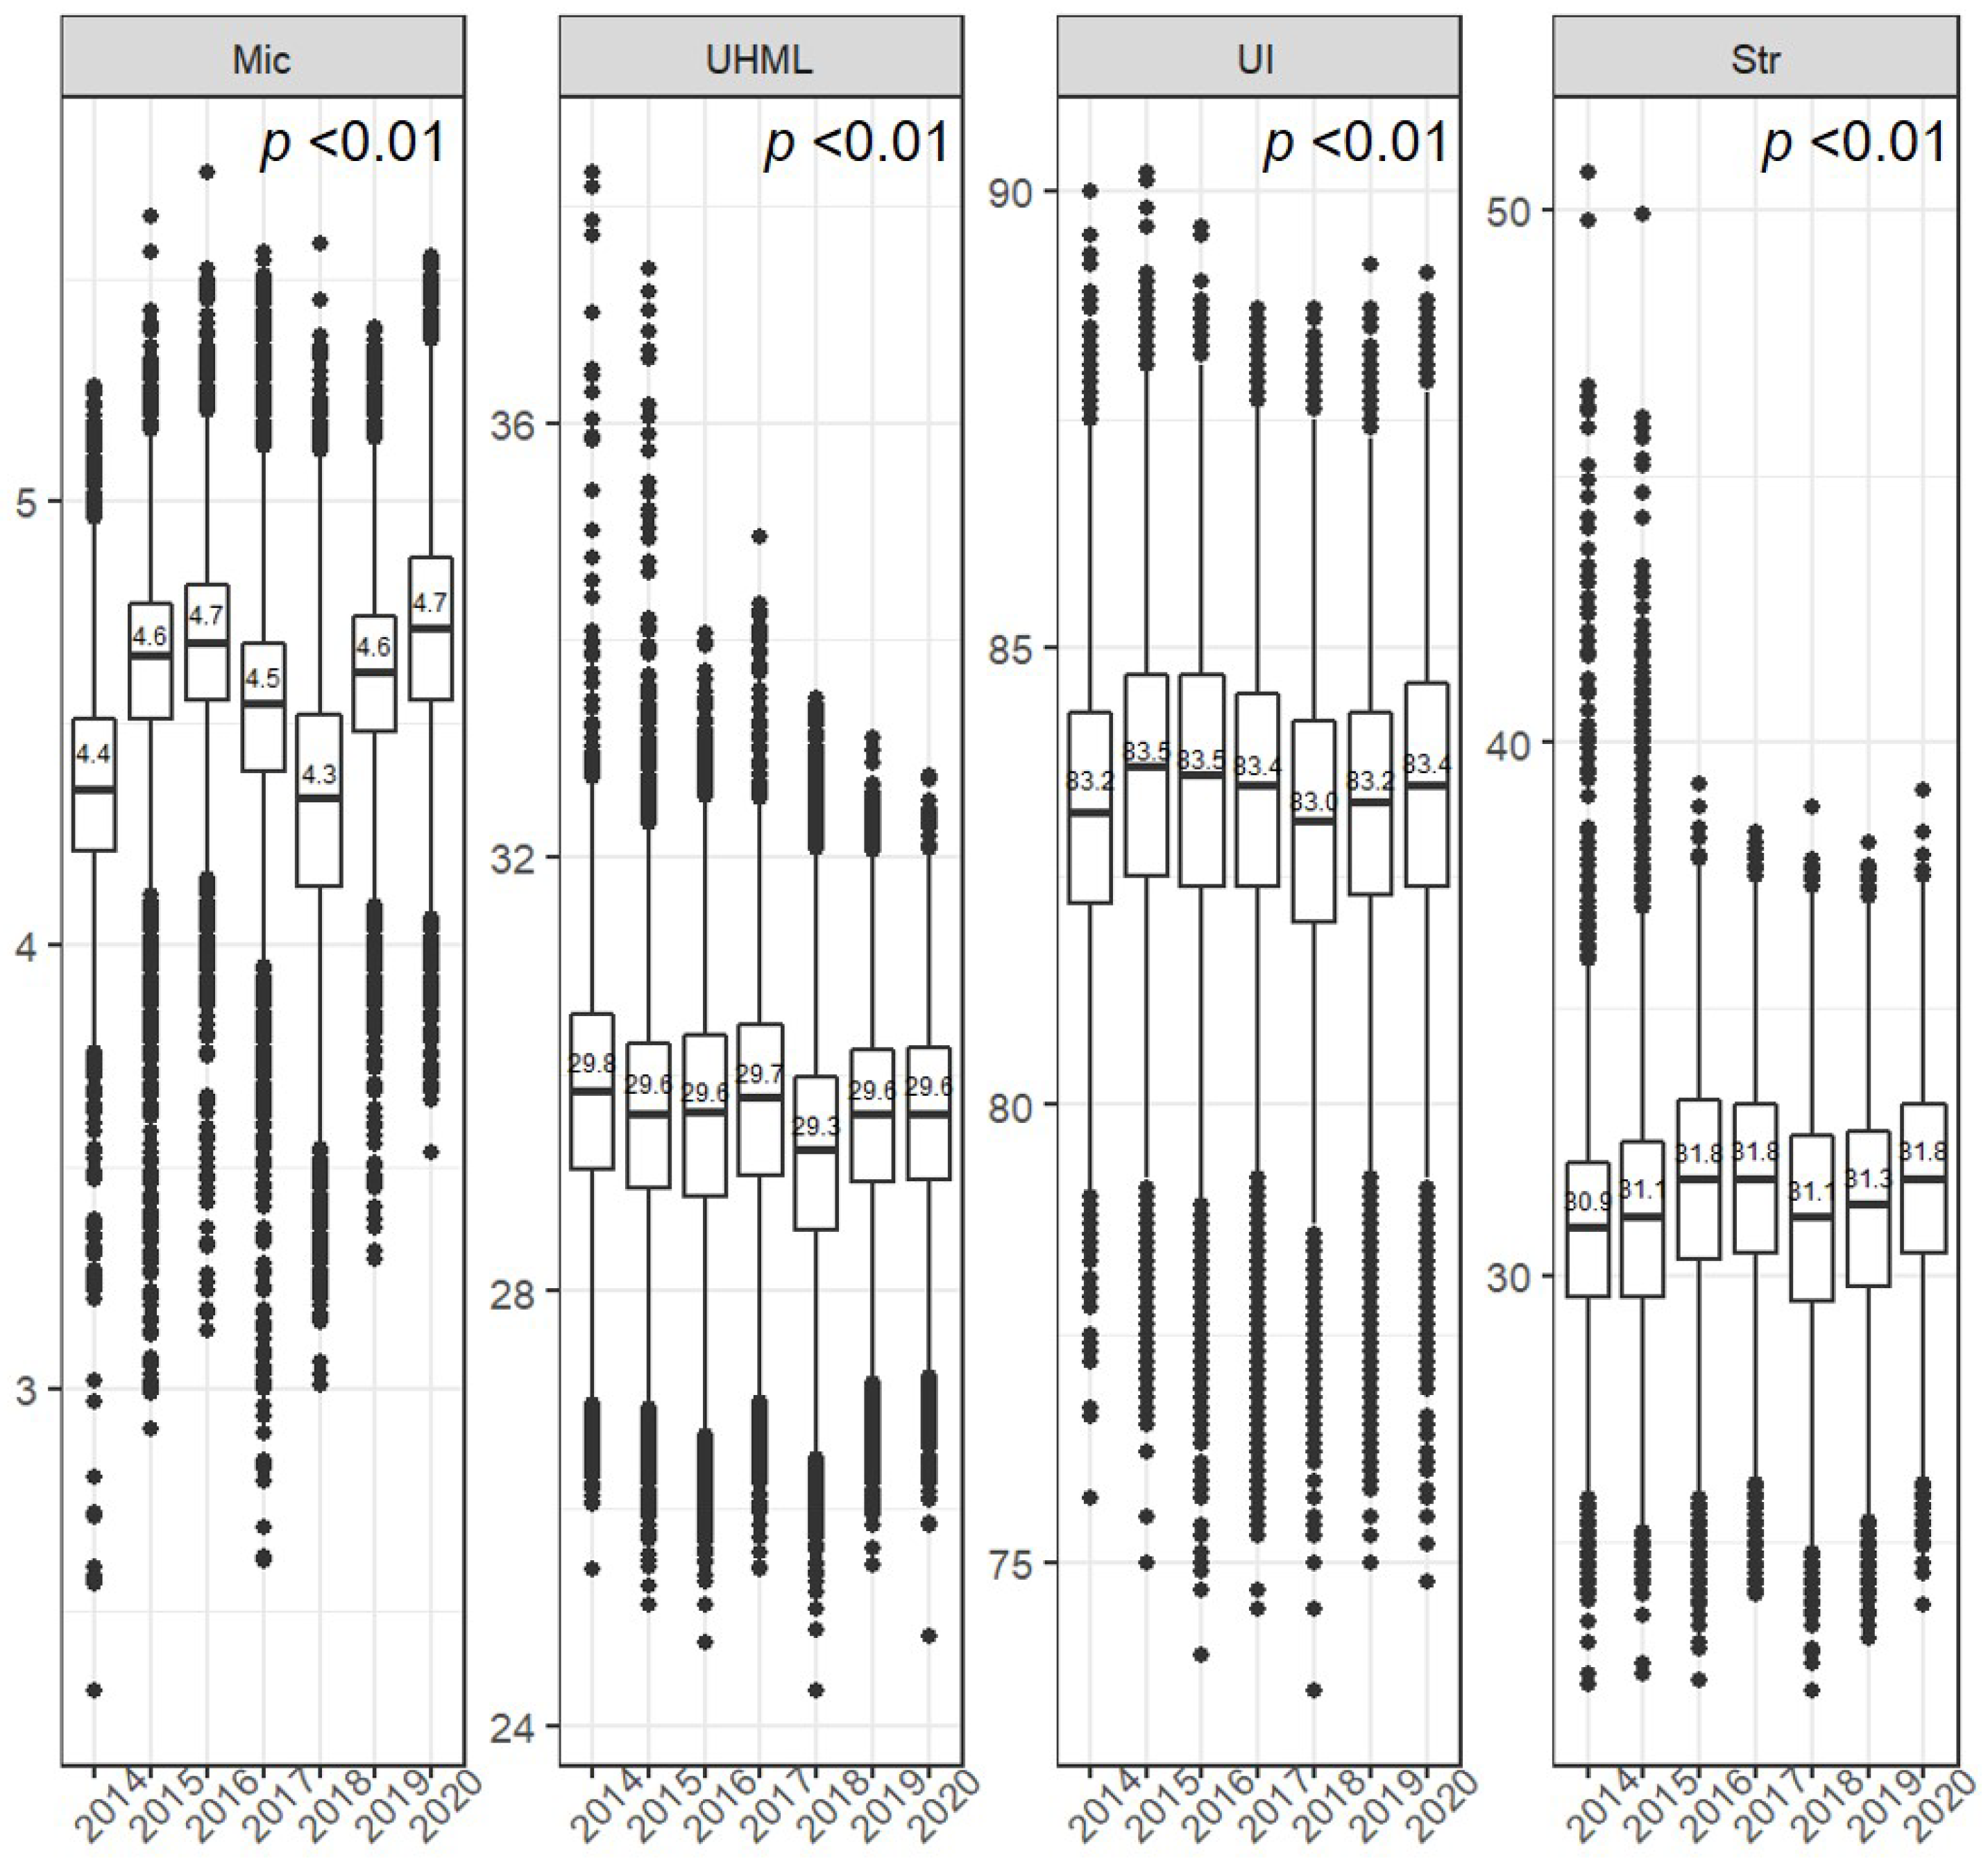
Our findings revealed notable variations in the ( M i c ) values of the cotton fiber samples collected from the Aegean in Türkiye, with significantly lower averages (avg. 4.3) observed in 2014 and 2018, and the highest M i c values (avg. 4.7) were recorded in 2020 and 2016 (Figure 4). Conversely, the upper half mean length ( U H M L ) values of the samples exhibited minimal fluctuations across the years, ranging between 29.3 and 29.8 (Figure 4).
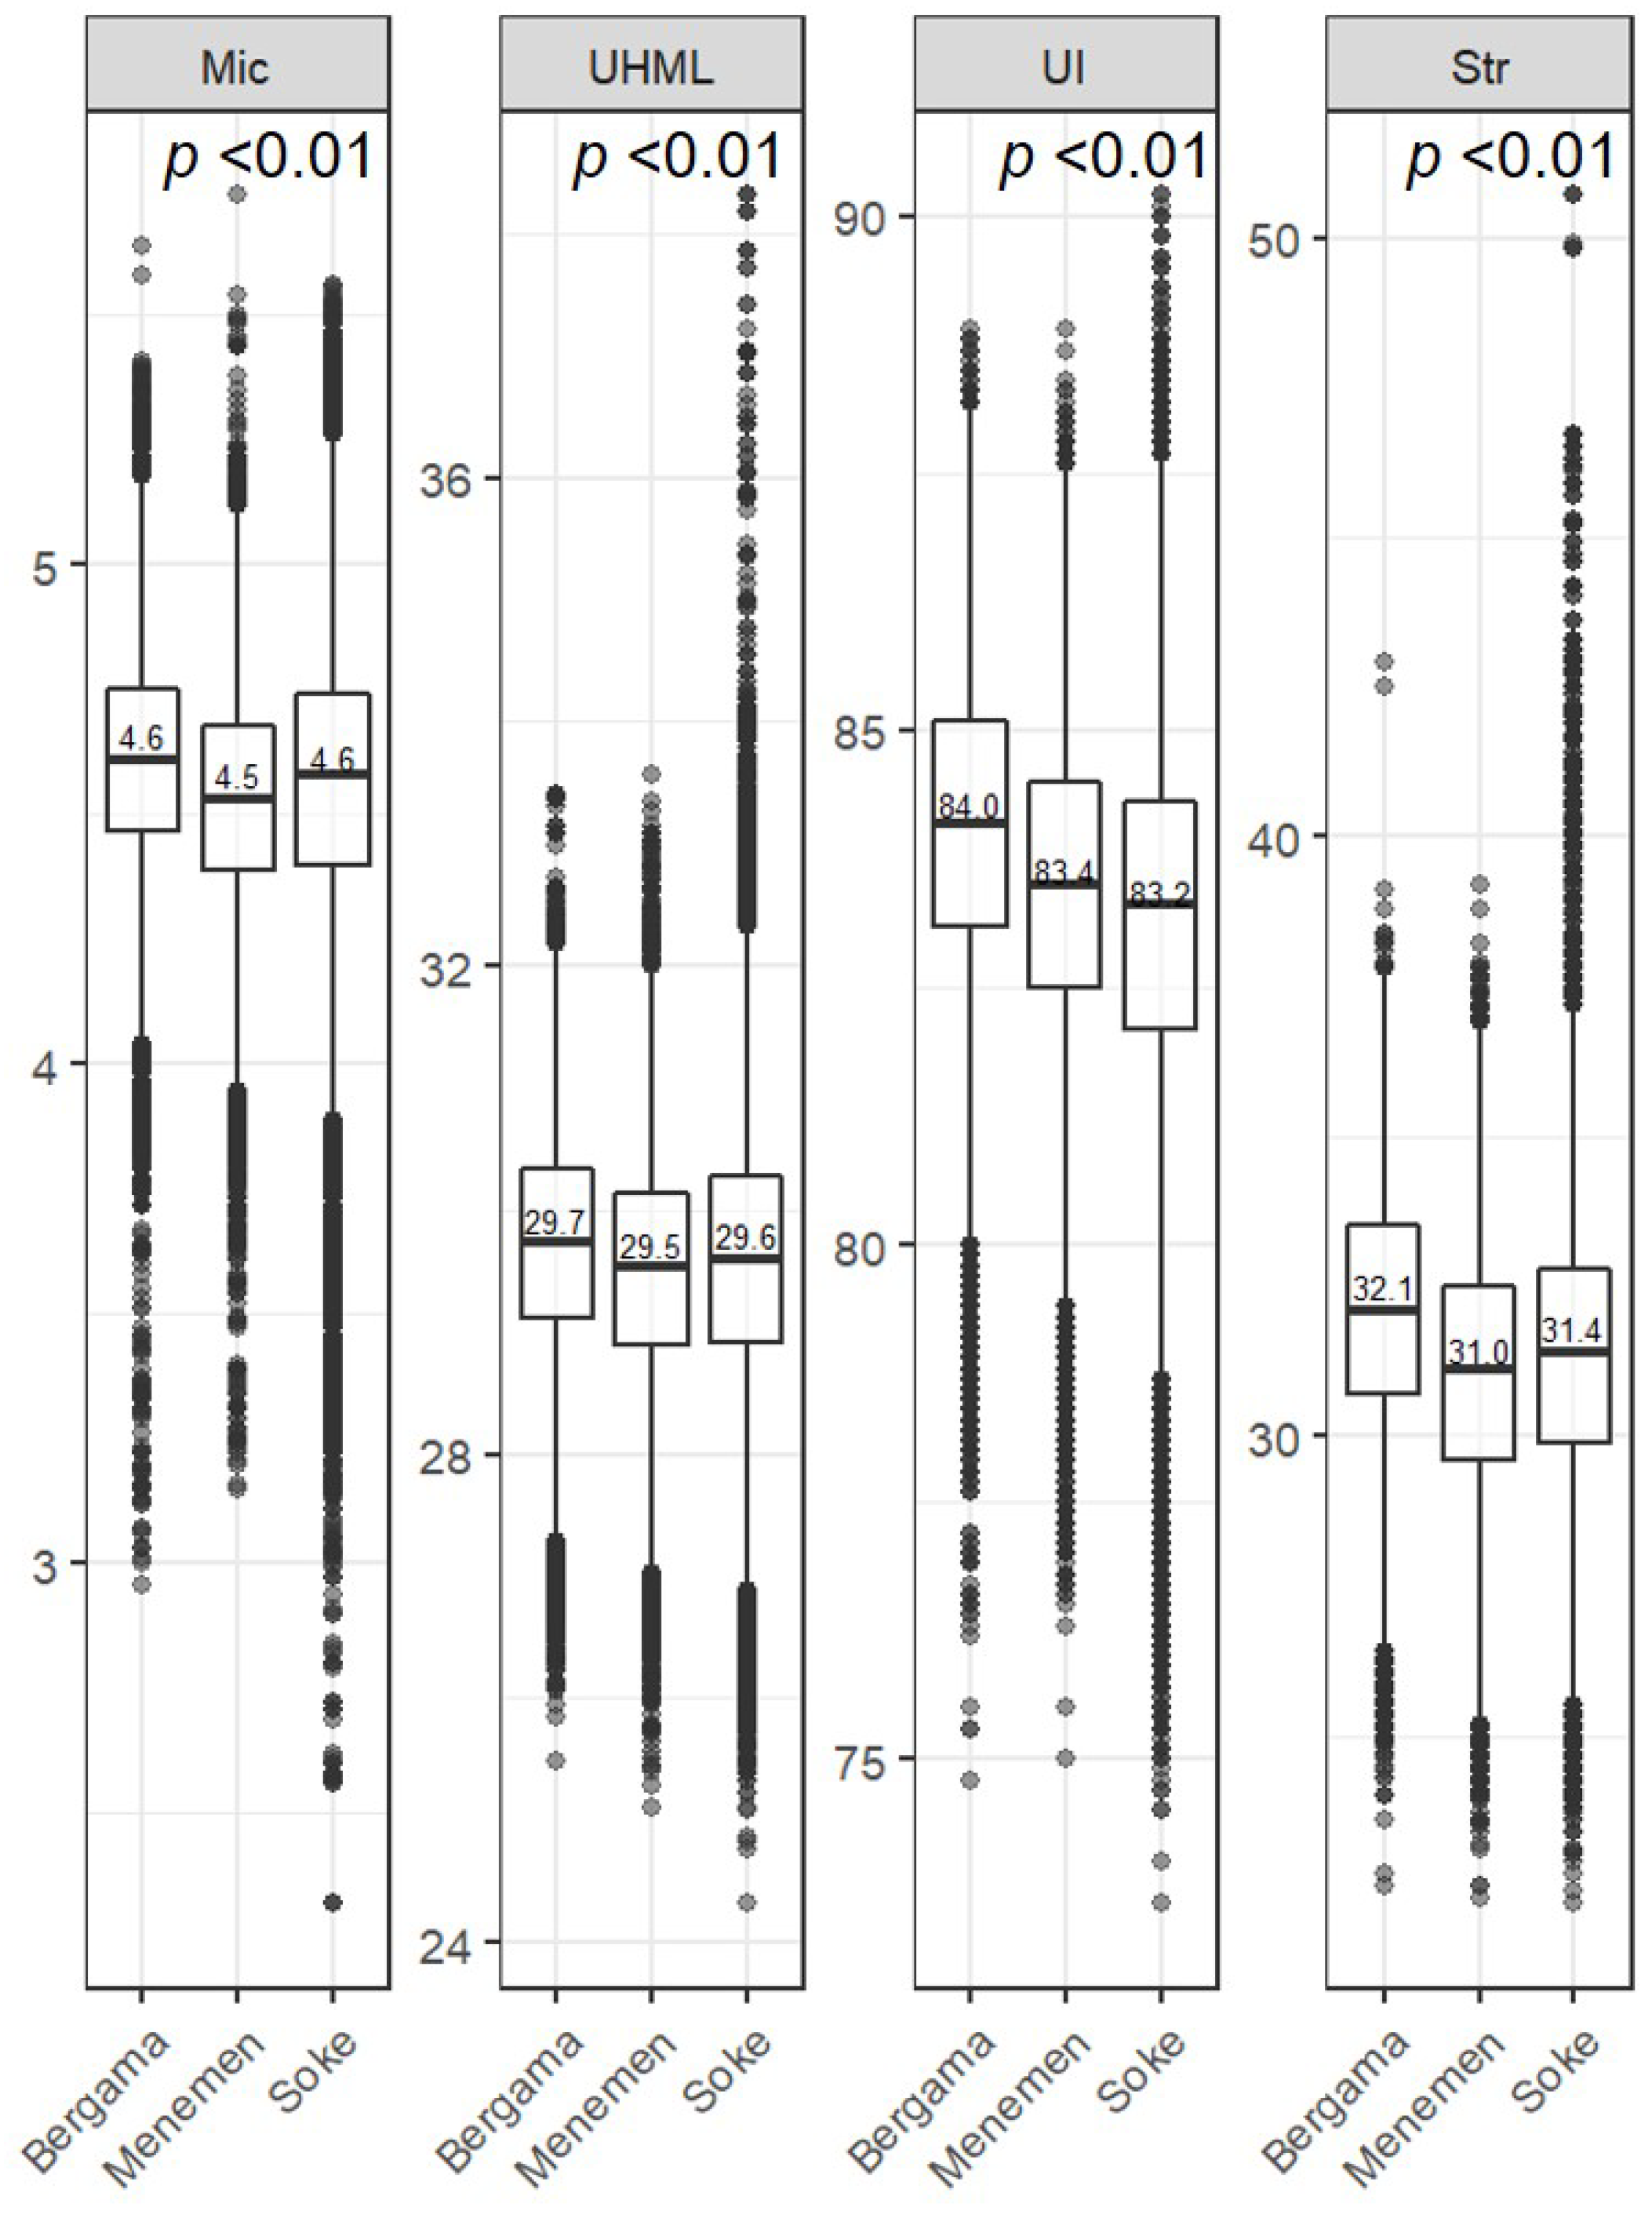
Furthermore, a significant proportion of the fiber samples displayed uniformity index ( U I ) values below 80 and above 87, although the mean values across sampling seasons remained relatively consistent. The average U I values ranged between 83.0 and 83.6 during the period from 2014 to 2020. Additionally, wider variations in strength ( S t r ) were observed in 2014 and 2015, similar to U H M L , with S t r values ranging between 30.9 and 31.8 (Figure 4). The M i c values of the fibers sampled from Bergama, Menemen, and Söke exhibited minimal variation, ranging between 4.5 μg/inch and 4.6 μg/inch (Figure 5). Similarly, the average U H M L ranged from 29.5 mm to 29.7 mm across the examined regions. However, both Bergama and Söke exhibited higher values for both quality parameters compared to Menemen. In terms of U I values, Bergama yielded a higher average of 84.0%, compared to 83.2% in Söke and 83.4% in Menemen. This trend was also reflected in the average S t r values (Figure 5), with Bergama recording a higher value of 32.1 g/tex, compared to 31.0 g/tex in Menemen and 31.4 g/tex in Söke.

4. Discussion

Despite cotton’s inherent plasticity in its growth response to environmental conditions [41], primarily due to its indeterminate growth habit, its ability to grow and produce bolls is constrained by specific temperature ranges [42]. Saini et al. [18] reported that while cotton is well adapted to semiarid regions, it remains vulnerable to high temperatures, particularly during the critical stages of flowering and boll development. Cotton achieves greater fiber length during boll development at 22 °C, with a decline observed at both lower and higher temperatures [42], while fiber strength is enhanced when temperatures exceed 25 °C during this stage [43,44]. In the examined subregions, the high average daily temperatures ranging from 25 °C to 27 °C during the period spanning from flowering to boll formation was identified as the factor contributing to the attainment of very high S t r values (>31.0). The relatively higher S t r values and stronger fibers in Bergama could be attributed to higher maximum temperatures, despite similar daily average temperatures across all locations (ranging between 25.5 °C and 25.8 °C). Additionally, as suggested by Gipson and Joham [25], the stronger fibers obtained in Söke than in Menemen could be attributed to higher minimum temperatures at night. While high night-time temperatures generally lead to increased respiration rates and subsequent reductions in leaf ATP levels and carbohydrate contents, ultimately resulting in yield reduction [45], Wu et al. [44] observed a correlation between elevated night-time temperatures and enhanced fiber bundle strength. This association may be attributed to alterations in the rate of cellulose deposition from anthesis to the onset of rapid cellulose deposition. The high average daily temperatures prevalent in the region, typically conducive to high S t r values, may serve as a limiting factor for fiber length. Lokhande and Reddy [42] noted a linear increase in U H M L between 18 and 22 °C, followed by a decline at temperatures exceeding this range. The observation that U H M L approached the limit of the long class (>30 mm) in all examined regions could be attributed to the exposure to temperatures surpassing this threshold following the flowering period. Additionally, the ideal M i c value for high-quality cotton fiber falls within the range of 3.8 to 4.5 [46], with the possibility of an increase in M i c due to a decrease in boll number in cotton plants grown under high temperatures [23]. Numerous studies have demonstrated the indirect relationship between high temperatures and M i c value increases [13,17,47]. In the present study, the slightly higher M i c observed in Bergama and Söke compared to Menemen could be attributed to the higher daytime maximum temperature and night-time minimum temperature in these two regions, respectively. A study by Zhang et al. [48] indicated that cotton fiber quality, including U H M L , S t r , and M i c , is primarily influenced by climatic conditions, with U I having no significant impact. However, despite environmental conditions in the studied subregions and the fiber obtained from cultivated cotton plants exhibiting a U I value (>80%) surpassing established standards, the disparity between the regions is notable. Our findings suggest a direct relationship between U I and fiber bundle strength, aligning with the observations of Bargeron [49], who noted that mature, strong cotton maintains its original length distributions better than immature, weak cotton. Numerous studies have examined the effects of air humidity on fiber quality during postharvesting processes [50,51,52]. However, limited reports have been published on the effect of air humidity on the quality of cotton fiber during boll development. Most studies addressing boll development and climate conditions have primarily focused on temperature variations [24,53,54]. Nevertheless, primary plant metabolism, such as photosynthetic activity, can vary depending on relative air humidity within a given temperature range [27,28]. The relatively higher humidity during the boll development stage in Menemen than in other regions may explain its slightly lower levels for all fiber quality characteristics. Notably, higher overall M i c values were observed in 2014 and 2018, coinciding with higher average air humidity records, than in other growing seasons. In addition to the metabolic impact of air humidity, the hygroscopic property of cotton fiber, which allows for high vapor absorption from a moist atmosphere [51], could significantly influence fiber properties during fiber formation. Plants grown in higher relative humidity conditions are expected to exhibit higher stomatal conductance, photosynthetic rates, and greater carbohydrate accumulation [55], potentially advantageous for earlier growth stages to achieve higher yields. However, humid conditions, especially during boll development stages, may negatively impact S t r and M i c due to increased microbial activity, structural changes in cellulose molecules, and removal of noncellulosic molecules from the fiber immediately after boll opening [56]. Therefore, we suggest that higher relative air humidity during boll development in Menemen and in the growing seasons of 2014 and 2018 were associated with relatively lower M i c and Stre values. The relatively higher wind speeds during boll development in Söke (from NW) and Bergama (from NE) than in Menemen may have generally contributed to lower air humidity levels. While strong winds during the flowering and initial boll development stages can reduce cotton yield due to shedding [57], vigorous northern winds typically occur just after this critical period in both locations. However, despite the typical effects of wind on relative air humidity, the higher rainfall in 2014 and 2018 appeared to be the primary determinant of humid seasons. In addition to these indirect meteorological parameters, it can be inferred that relative air humidity, especially during boll development, plays a key role alongside temperature in determining cotton fiber quality. Principal component analysis (PCA) further demonstrated that air humidity and rainfall, particularly during boll development, were negatively correlated with each quality trait, especially Mic. In contrast, temperature (average, maximum, and minimum) during boll development showed a positive correlation with these quality traits (Figure 6). Furthermore, a strong negative correlation was observed between the Mic values and the growing seasons of 2014 and 2018. According to the PCA results, fiber samples collected from Bergama exhibited slightly positive correlations with quality parameters, although all regions generally met higher standards.

5. Conclusions

Overall, our findings highlight several key conclusions: (1) High-quality fiber, meeting established standards, has been consistently obtained from the Bergama, Söke, and Menemen regions, where cotton cultivation is intensive. However, our results indicate that environmental factors have contributed to variations in fiber quality among these regions. The relatively higher S t r values and stronger fibers observed in Bergama are likely attributable to higher maximum temperatures, despite similar daily average temperatures across all locations. Conversely, the stronger fibers obtained in Söke than in Menemen may be attributed to higher night-time minimum temperatures. (2) The prevalent high average daily temperature in the region, while conducive to obtaining high S t r values, may have imposed limitations on UHML. The UHML approaching the lower limit of the long class across all examined regions may have resulted from exposure to temperatures surpassing this threshold following the flowering period. (3) The slightly higher M i c values observed in Bergama and Söke than in Menemen may have been linked to higher daytime maximum temperatures and night-time minimum temperatures, as well as lower air humidity during boll development, attributed to the strong northern winds in these two regions, respectively. (4) Our results underscore the importance of considering not only daily average temperature but also maximum and minimum temperature, alongside air humidity and its indirect factors, in understanding the impact of climate factors on cotton fiber quality. Furthermore, further analysis of the cotton plant’s phenology in relation to specific climate conditions is warranted to comprehensively understand the effects of environmental conditions on fiber quality, both indirectly from the boll development stage and directly during the boll development and fiber formation stages.
Derived from the above-mentioned approaches, we found that data analysis combined with artificial intelligence tools has the potential to enable early market analysis in regions with substantial cotton production. Furthermore, it could facilitate the anticipation of potential future cotton production subregions based on climate change scenarios.

Supplementary Materials

The following supporting information can be downloaded at: https://www.mdpi.com/article/10.3390/agronomy14061276/s1. Table S1. ANOVA of model-1 for Mic. Table S2. ANOVA of model-1 for Str. Table S3. ANOVA of model-1 for UI. Table S4. ANOVA of model-1 for UHML. Table S5. ANOVA of model-2 for Mic. Table S6. ANOVA of model-2 for Str. Table S7. ANOVA of model-2 for UI. Table S8. ANOVA of model-2 for UHML.

Author Contributions

Conceptualization, Ö.T. and D.I.; methodology, Ö.T. and U.Ç.; investigation, M.E.; resources, M.E.; data curation, U.Ç.; writing—original draft preparation, Ö.T. and D.I.; writing—review and editing, Ö.T. and D.I.; visualization, D.I. All authors have read and agreed to the published version of the manuscript.

Funding

This research received no external funding.

Data Availability Statement

Data are available upon request from the corresponding author.

Conflicts of Interest

Author Müge Ekizoglu was employed by Izmir Commodity Exchange Laboratory, R&D and Consultancy Services Inc. The remaining authors declare that this research was conducted in the absence of any commercial or financial relationships that could be construed as a potential conflict of interest.

References

  1. Liu, S.; Gordon, S.; Stiller, W. Are yarn quality prediction tools useful in the breeding of high yielding and better fibre quality cotton (Gossypium hirsutum L.)? J. Cotton Res. 2023, 6, 18. [Google Scholar] [CrossRef]
  2. Bradow, J.M.; Davidonis, G.H. Quantitation of fiber quality and the cotton production-processing interface: A physiologist’s perspective. J. Cotton Sci. 2000, 4, 34–64. [Google Scholar]
  3. Van Der Sluijs, M.H. Effect of nitrogen application level on cotton fibre quality. J. Cotton Res. 2022, 5, 9. [Google Scholar] [CrossRef]
  4. Hussain, A.; Sajid, M.; Iqbal, D.; Sarwar, M.I.; Farooq, A.; Siddique, A.; Khan, M.Q.; Kim, I.S. Impact of novel varietal and regional differences on cotton fiber quality characteristics. Materials 2022, 15, 3242. [Google Scholar] [CrossRef]
  5. Food and Agriculture Organization of the United Nations. FAOSTAT Statistical Database; FAO: Rome, Italy, 2024; Available online: https://fao.org/faostat/en/data/QCL (accessed on 1 April 2024).
  6. Balci, S.; Cinar, V.M.; Unay, A. Fiber Quality Characteristics of Cotton (Gossypium hirsutum L.) in Main Production Areas of Aegean Region. Curr. J. Appl. Sci. Technol. 2022, 41, 36. [Google Scholar] [CrossRef]
  7. United States Department of Agriculture, Foreign Agricultural Service. Cotton and Products Annual Report; Report Number: TU2021-0016; USDA: Washington, DC, USA, 2021.
  8. Karapinar, B.O.; Erdem, N. Comparison of quality characteristics of yarns spun from Aegean cotton fibres and their mixtures with South-east Anatolian cotton fibres. Fibres Text. East. Eur. 2003, 11, 26–29. [Google Scholar]
  9. Çopul, S.; Gençsoylu, İ. Aydın ili ikinci ürün pamukta (Gossypium hirsutum L.) farklı azot dozlarının verim, verim komponentleri ve lif kalite özellikleri üzerine etkisi. Adnan Menderes Üniv. Ziraat Fakültesi Dergisi 2020, 17, 271–279. [Google Scholar] [CrossRef]
  10. Paterson, A.; Saranga, Y.; Menz, M.; Jiang, C.X.; Wright, R. QTL analysis of genotype× environment interactions affecting cotton fiber quality. Theor. Appl. Genet. 2003, 106, 384–396. [Google Scholar] [CrossRef]
  11. Ulloa, M.; De Santiago, L.M.; Hulse-Kemp, A.M.; Stelly, D.M.; Burke, J.J. Enhancing Upland cotton for drought resilience, productivity, and fiber quality: Comparative evaluation and genetic dissection. Mol. Genet. Genom. 2020, 295, 155–176. [Google Scholar] [CrossRef] [PubMed]
  12. Manan, A.; Zafar, M.M.; Ren, M.; Khurshid, M.; Sahar, A.; Rehman, A.; Firdous, H.; Youlu, Y.; Razzaq, A.; Shakeel, A. Genetic analysis of biochemical, fiber yield and quality traits of upland cotton under high-temperature. Plant Prod. Sci. 2022, 25, 105–119. [Google Scholar] [CrossRef]
  13. Darawsheh, M.K.; Beslemes, D.; Kouneli, V.; Tigka, E.; Bilalis, D.; Roussis, I.; Karydogianni, S.; Mavroeidis, A.; Triantafyllidis, V.; Kosma, C.; et al. Environmental and regional effects on fiber quality of cotton cultivated in Greece. Agronomy 2022, 12, 943. [Google Scholar] [CrossRef]
  14. Beegum, S.; Reddy, V.; Reddy, K.R. Development of a cotton fiber quality simulation module and its incorporation into cotton crop growth and development model: GOSSYM. Comput. Electron. Agric. 2023, 212, 108080. [Google Scholar] [CrossRef]
  15. Campbell, B.; Jones, M. Assessment of genotype× environment interactions for yield and fiber quality in cotton performance trials. Euphytica 2005, 144, 69–78. [Google Scholar] [CrossRef]
  16. Abd El Samad, H.; El Hosary, A.; Shokr, E.S.; El-Badawy, M.; Eissa, A.; El Hosary, A. Selecting high yield and quality cotton genotypes using phenotypic and genotypic stability statistics. Egypt. J. Plant Breed. 2017, 21, 642–653. [Google Scholar]
  17. Pettigrew, W. The effect of higher temperatures on cotton lint yield production and fiber quality. Crop Sci. 2008, 48, 278–285. [Google Scholar] [CrossRef]
  18. Saini, D.K.; Impa, S.; McCallister, D.; Patil, G.B.; Abidi, N.; Ritchie, G.; Jaconis, S.; Jagadish, K.S. High day and night temperatures impact on cotton yield and quality—Current status and future research direction. J. Cotton Res. 2023, 6, 16. [Google Scholar] [CrossRef]
  19. Ul-Allah, S.; Rehman, A.; Hussain, M.; Farooq, M. Fiber yield and quality in cotton under drought: Effects and management. Agric. Water Manag. 2021, 255, 106994. [Google Scholar] [CrossRef]
  20. Yagmur, B.; Gurel, A.; Oren, Y.; Izcl, B.; Edreva, A.; Hakerlerler, H.; Hayta, S.; Akdemir, H.; Yilaiz-Aktas, L. Effects of different drought applications and potassium doses on cotton yield and fiber quality. Res. J. Agric. Environ. Manag. 2014, 3, 60–67. [Google Scholar]
  21. Basal, H.; Dagdelen, N.; Unay, A.; Yilmaz, E. Effects of deficit drip irrigation ratios on cotton (Gossypium hirsutum L.) yield and fibre quality. J. Agron. Crop Sci. 2009, 195, 19–29. [Google Scholar] [CrossRef]
  22. Bange, M.P.; Constable, G.A.; Johnston, D.B.; Kelly, D. A method to estimate the effects of temperature on cotton micronaire. J. Cotton Sci. 2010, 14, 164–172. [Google Scholar]
  23. Luo, Q.; Bange, M.; Johnston, D. Environment and cotton fibre quality. Clim. Change 2016, 138, 207–221. [Google Scholar] [CrossRef]
  24. Lokhande, S.; Reddy, K.R. Quantifying temperature effects on cotton reproductive efficiency and fiber quality. Agron. J. 2014, 106, 1275–1282. [Google Scholar] [CrossRef]
  25. Gipson, J.; Joham, H. Influence of night temperature on growth and development of cotton (Gossypium hirsutum L.). I. Fruiting and Boll Development. Agron. J. 1968, 60, 292–295. [Google Scholar] [CrossRef]
  26. Hejnák, V.; Tatar, Ö.; Atasoy, G.; Martinková, J.; Çelen, A.; Hnilička, F.; Skalickỳ, M. Growth and photosynthesis of Upland and Pima cotton: Response to drought and heat stress. Plant Soil Environ. 2015, 61, 507–514. [Google Scholar] [CrossRef]
  27. Lysenko, E.A.; Kozuleva, M.A.; Klaus, A.A.; Pshybytko, N.L.; Kusnetsov, V.V. Lower air humidity reduced both the plant growth and activities of photosystems I and II under prolonged heat stress. Plant Physiol. Biochem. 2023, 194, 246–262. [Google Scholar] [CrossRef]
  28. Tatar, Ö.; Brück, H.; Asch, F. Atmospheric and soil water deficit induced changes in chemical and hydraulic signals in wheat (Triticum aestivum L.). J. Agron. Crop Sci. 2023, 209, 242–250. [Google Scholar] [CrossRef]
  29. Guo, D.; Olesen, J.E.; Manevski, K.; Pullens, J.W.; Li, A.; Liu, E. Change Trend and Attribution Analysis of Reference Evapotranspiration under Climate Change in the Northern China. Agronomy 2023, 13, 3036. [Google Scholar] [CrossRef]
  30. Zhang, H.; Zhao, T.; Ji, R.; Chang, S.; Gao, Q.; Zhang, G. The Decreased Availability of Soil Moisture and Canopy Conductance Dominate Evapotranspiration in a Rain-Fed Maize Ecosystem in Northeastern China. Agronomy 2023, 13, 2941. [Google Scholar] [CrossRef]
  31. Zhang, S.; Liu, G.; Cui, Q.; Huang, Z.; Ye, X.; Cornelissen, J.H. New field wind manipulation methodology reveals adaptive responses of steppe plants to increased and reduced wind speed. Plant Methods 2021, 17, 5. [Google Scholar] [CrossRef]
  32. Oosterhuis, D.M. Growth and development of a cotton plant. In Nitrogen Nutrition of Cotton: Practical Issues; Miley, W.N., Oosterhuis, D.M., Eds.; Wiley Online Library: Madison, WI, USA, 1990; pp. 1–24. [Google Scholar] [CrossRef]
  33. Zheng, D.; Hunt, E.R., Jr.; Running, S.W. A daily soil temperature model based on air temperature and precipitation for continental applications. Clim. Res. 1993, 2, 183–191. [Google Scholar] [CrossRef]
  34. Boman, R.; Lemon, R. Soil temperatures for Cotton Planting. Texas Cooperative Extension. Technical report, SCS-2005-17. Agri Life Extension Tex A&M System. 2005. Available online: http://cotton.tamu.edu/General%20Production/scs-2005-17%20Soil%20Temp.pdf (accessed on 1 April 2024).
  35. McMaster, G.S.; Wilhelm, W. Growing degree-days: One equation, two interpretations. Agric. For. Meteorol. 1997, 87, 291–300. [Google Scholar] [CrossRef]
  36. Mauget, S.; Ulloa, M.; Dever, J. Planting date effects on cotton lint yield and fiber quality in the US Southern High Plains. Agriculture 2019, 9, 82. [Google Scholar] [CrossRef]
  37. Albers, D.W. Cotton Plant Development and Plant Mapping; University of Missouri Extension: Columbia, MO, USA, 1993. [Google Scholar]
  38. R Core Team. R: A Language and Environment for Statistical Computing; R Foundation for Statistical Computing: Vienna, Austria, 2021. [Google Scholar]
  39. Lê, S.; Josse, J.; Husson, F. FactoMineR: An R package for multivariate analysis. J. Stat. Softw. 2008, 25, 1–18. [Google Scholar] [CrossRef]
  40. Wickham, H. ggplot2: Elegant Graphics for Data Analysis; Springer: New York, NY, USA, 2016. [Google Scholar]
  41. Niles, G.A.; Feaster, C.V. Breeding. In Cotton; Kohel, J., Lewis, C.F., Eds.; Wiley Online Library: Madison, WI, USA, 1984; pp. 201–231. [Google Scholar]
  42. Lokhande, S.; Reddy, K.R. Reproductive and fiber quality responses of upland cotton to moisture deficiency. Agron. J. 2014, 106, 1060–1069. [Google Scholar] [CrossRef]
  43. Zhang, L.J.; Xiong, Z.W.; Chen, B.L.; Xue, X.P.; Zhou, Z.G. Sensitivity analysis of cotton fiber quality to climate condition. Ziran Zaihai Xuebao/J. Nat. Disasters 2006, 15, 79–84. [Google Scholar]
  44. Wu, Y.; Tian, J.; Zhang, X.; Hu, X.; Wang, W.; Gou, L.; Zhang, Y.; Zhang, W. Elevated nighttime temperature affects fiber bundle strength via altering cellulose deposition rate during early fiber development. Ind. Crops Prod. 2022, 176, 114393. [Google Scholar] [CrossRef]
  45. Loka, D.; Oosterhuis, D. Effect of high night temperatures on cotton respiration, ATP levels and carbohydrate content. Environ. Exp. Bot. 2010, 68, 258–263. [Google Scholar] [CrossRef]
  46. Bange, M.; Constable, G.; Gordon, S.; Naylor, G.; Van der Sluijs, M. Importance of fibre quality. In FIBREpak a Guide to Improving Australian Cotton Fiber Quality. CSIRO and the Cotton Catchment Communities Coop; Research Centre: Narrabri, NSW, Australia, 2009; pp. 30–42. [Google Scholar]
  47. Krieg, D.; McRae, J.; Richter, D. Cotton yield and quality, genetic vs. environmental affectors. In Proceedings of the 2002 Beltwide Cotton Conferences, Atlanta, GA, USA, 8–12 January 2002; pp. 8–12. [Google Scholar]
  48. Zhang, S.; Han, Y.; Wang, G.; Feng, L.; Lei, Y.; Wang, Z.; Xiong, S.; Yang, B.; Du, W.; Zhi, X.; et al. Long-term assessments of cotton fiber quality in response to plant population density: Reconciling fiber quality and its temporal stability. Ind. Crops Prod. 2023, 198, 116741. [Google Scholar] [CrossRef]
  49. Bargeron, J.D. Cotton length uniformity and yarn strength. In Proceedings of the Beltwide Cotton Conference, Atlanta, GA, USA, 8–12 January 2002. [Google Scholar]
  50. Knowlton, J.L. Effect of moisture on cotton fiber strength. In Proceedings of the Beltwide Cotton Conference, National Cotton Council, Memphis, TN, USA, 9–12 January 1996; Volume 2, pp. 1300–1305. [Google Scholar]
  51. Iqbal, M.; Sohail, M.; Ahmed, A.; Ahmed, K.; Moiz, A.; Ahmed, K. Textile environmental conditioning: Effect of relative humidity variation on the tensile properties of different fabrics. J. Anal. Sci. Methods Instrum. 2012, 2, 92. [Google Scholar] [CrossRef]
  52. Gulyaev, R.A.; Mardonov, B.M.; Lugachev, A. Cotton fibre humidification at cotton ginneries. Indian J. Fibre Text. Res. 2019, 44, 244–247. [Google Scholar]
  53. Dai, Y.; Yang, J.; Hu, W.; Zahoor, R.; Chen, B.; Zhao, W.; Meng, Y.; Zhou, Z. Simulative global warming negatively affects cotton fiber length through shortening fiber rapid elongation duration. Sci. Rep. 2017, 7, 9264. [Google Scholar] [CrossRef] [PubMed]
  54. Gipson, J.; Ray, L. Fiber elongation rates in five varieties of cotton (Gossypium hirsutum L.) as influenced by night temperature 1. Crop Sci. 1969, 9, 339–341. [Google Scholar] [CrossRef]
  55. Sawan, Z.M. Cotton production and climatic factors: Studying the nature of its relationship by different statistical methods. Cogent Biol. 2017, 3, 1292882. [Google Scholar] [CrossRef]
  56. Hake, K.; Banks, J.; Bourland, F.; Sasser, P.; Tugwell, P.; Williford, R. Boll Weathering. Cotton Physiology Today. Natl. Cotton Counc. 1992, 3, 10. [Google Scholar]
  57. Cetin, O.; Basbag, S. Effects of climatic factors on cotton production in semi-arid regions—A review. Res. Crop. 2010, 11, 785–791. [Google Scholar]
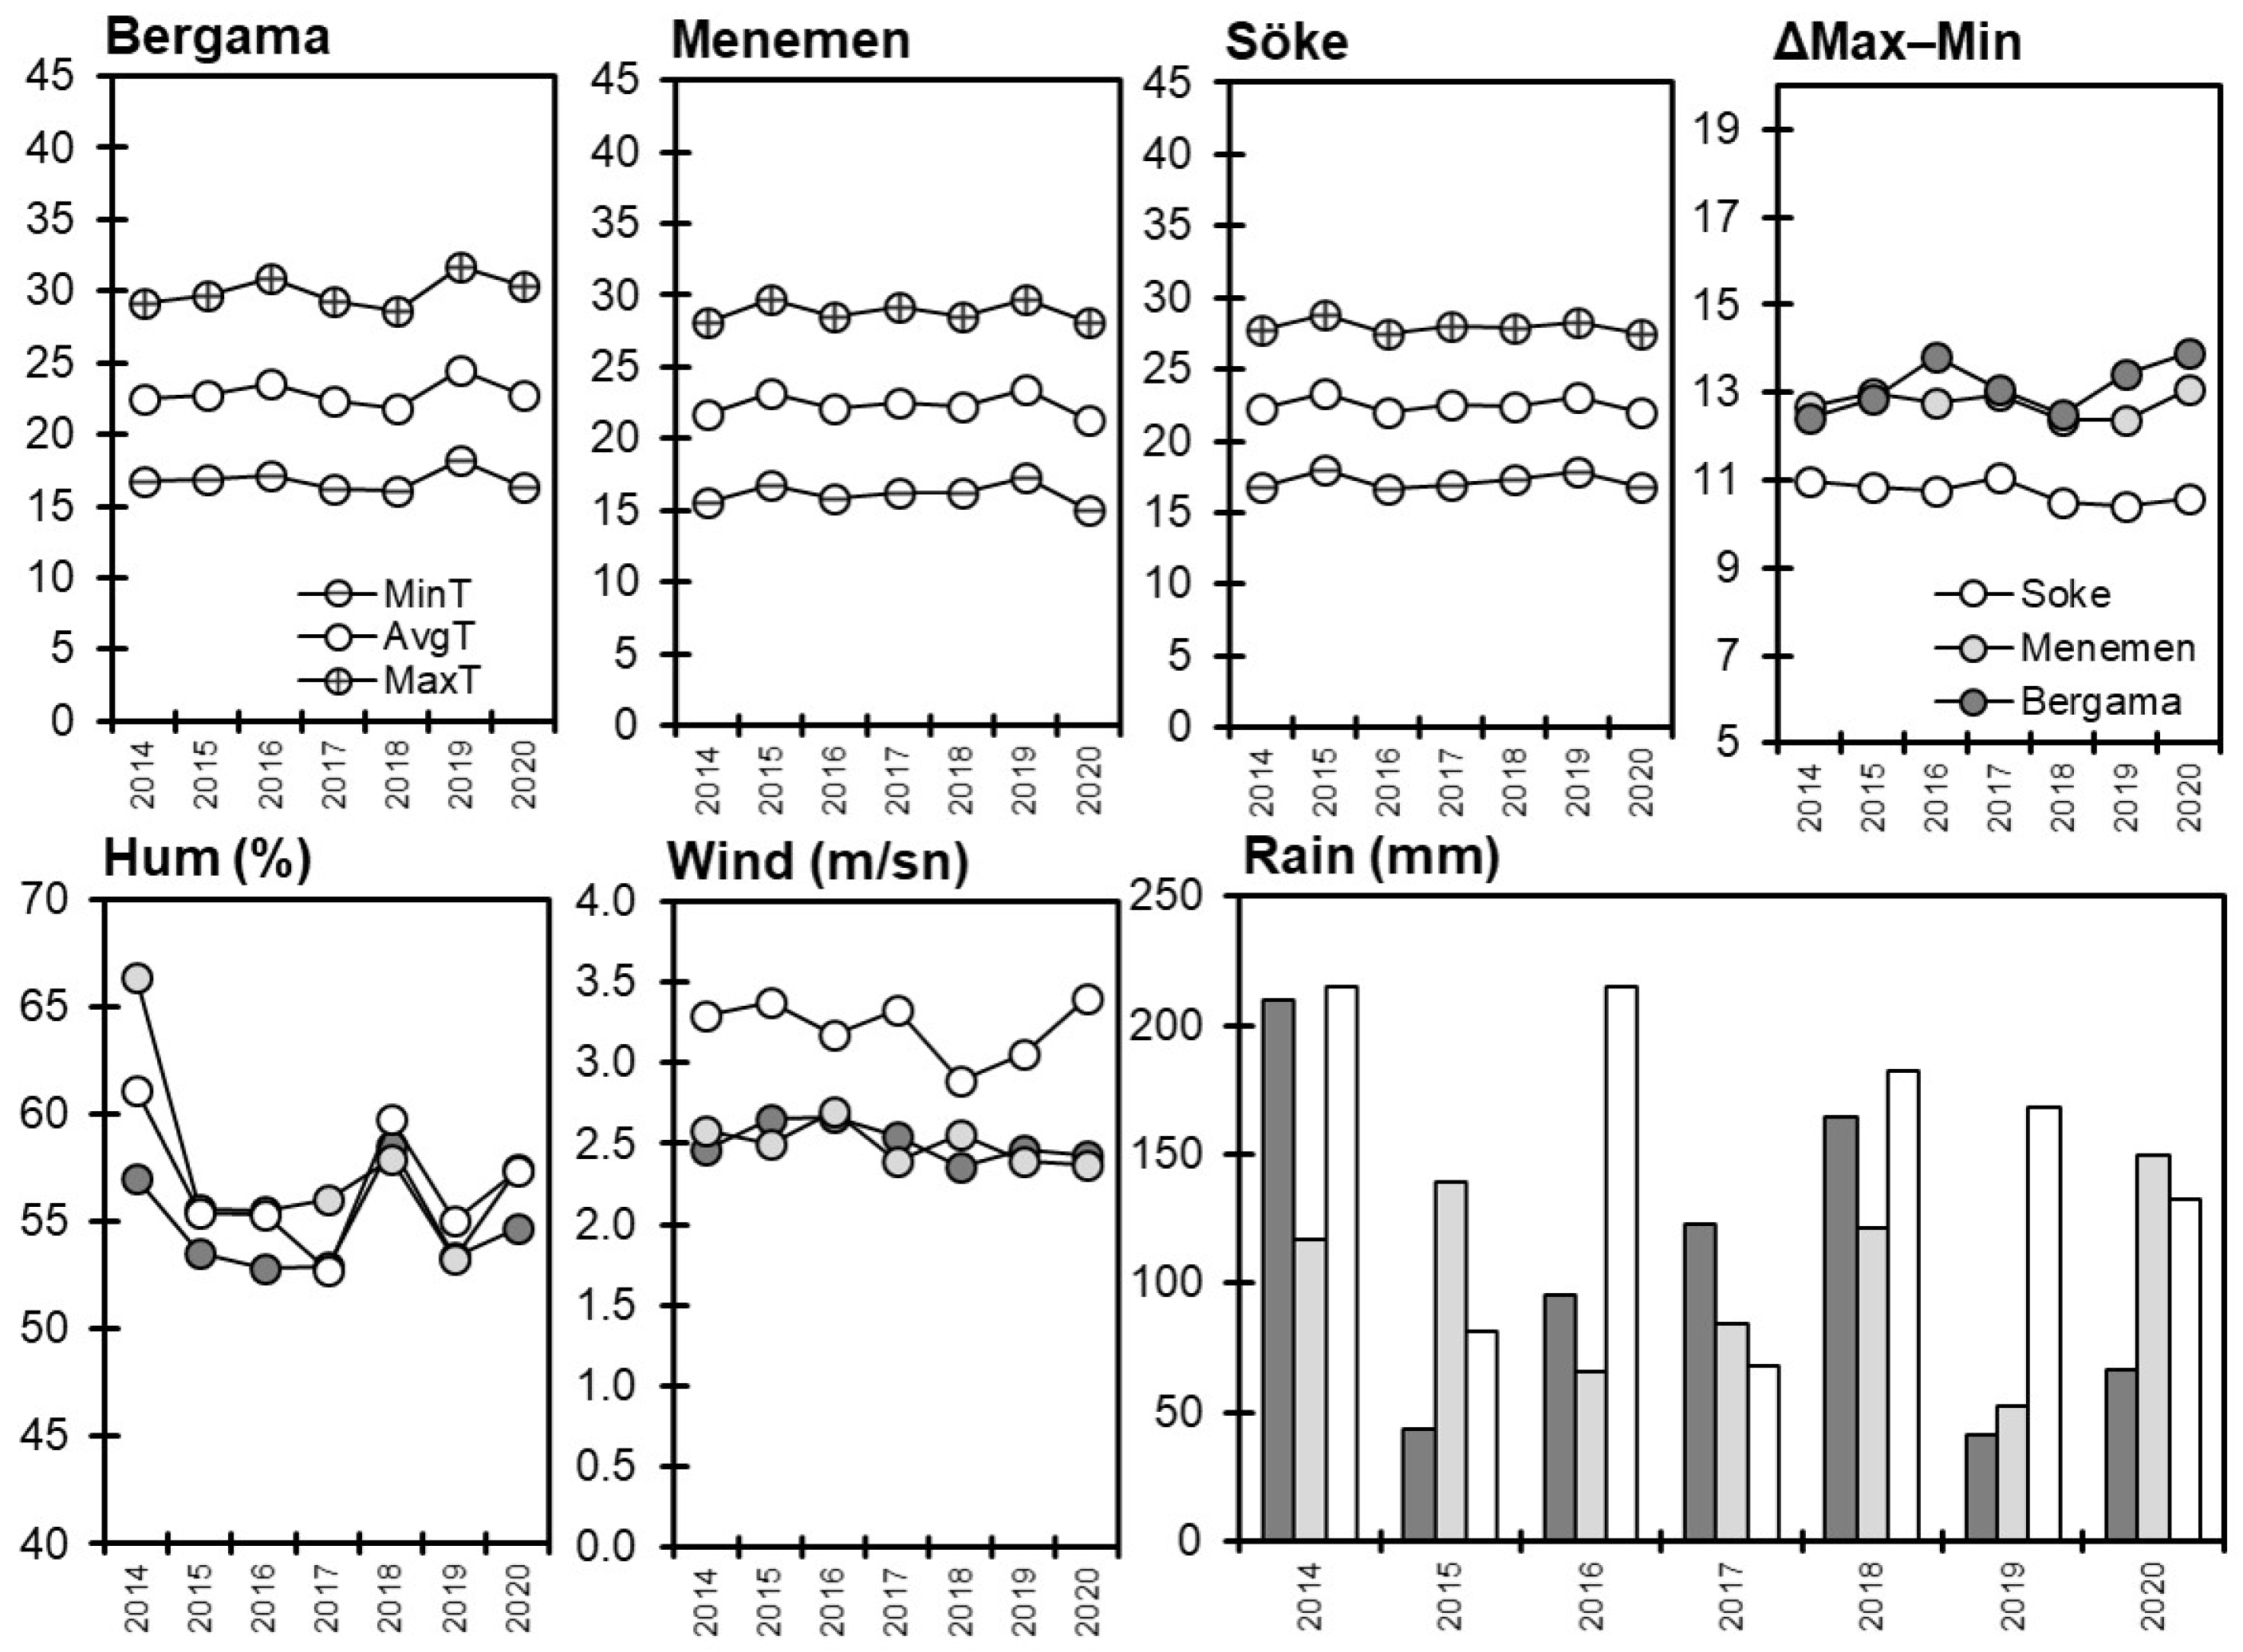
Figure 1. Variations in meteorological parameters [average temperature (AvgT), maximum temperature (MaxT), minimum temperature (MinT), differences between MaxT and MinT ( Δ M a x M i n ), humidity (Hum), wind speed (Wind), and total rain amount (Rain)] from 2014 to 2020 in the Aegean region in Türkiye. Mean values across the three subregions (Bergama, Menemen, and Söke) are separately indicated in the figure for Δ M a x M i n , humidity, wind, and rain, illustrating changes over time.
Agronomy 14 01276 g001
Figure 2. Variations in meteorological parameters [average temperature (AvgT), maximum temperature (MaxT), minimum temperature (MinT), humidity, wind direction frequency (Wind), and total rain amount (Rain)] during phenological stages (emergence, squaring, flowering, boll development, and maturation) of cotton in three subregions (Bergama, Menemen, and Söke) of the Aegean region in Türkiye.
Agronomy 14 01276 g002
Figure 3. Pairwise correlation coefficients between quality traits [micronaire ( M i c ), upper half mean length ( U H M L ), uniformity index ( U I ), and strength ( S t r )] and meteorological data (AvgT: the mean of daily average temperature (°C), MinT: mean of daily minimum temperature (°C), DeltaT: daily MaxT − MinT average (°C), Hum: average of daily relative humidity (%), and Wind: daily wind speed average (m/sn) across five growth stages).
Agronomy 14 01276 g003
Figure 4. Variations in cotton fiber quality parameters [micronaire ( M i c ), upper half mean length ( U H M L ), uniformity index ( U I ), and strength ( S t r )] from 2014 to 2020 in the Aegean region in Türkiye. Box plots refer to the mean values of three subregions (Bergama, Menemen, and Söke) that are depicted for each year, illustrating changes in fiber quality over time.
Agronomy 14 01276 g004
Figure 5. Variations in cotton fiber quality parameters [micronaire ( M i c ), upper half mean length ( U H M L ), uniformity index ( U I ), and strength ( S t r )] from 2014 to 2020 in the Aegean region in Türkiye. Mean values across three subregions (Bergama, Menemen, and Söke) are depicted for each year, illustrating changes in fiber quality over time.
Agronomy 14 01276 g005
Figure 6. Principal component analysis (PCA) demonstrating relationship between location (BER, MEN, and SOK), year (between 2014 and 2020), phenological stage (E, S, F, B, and M), and meteorological parameters (Min, Max, Avg, Δ t , Hum, Rain, and Wind).
Agronomy 14 01276 g006
Table 1. The evaluation parameters of statistical model-2 consisting of meteorological factors as fixed effects.
Model
Parameter
MicStrUIUHML
Model p-value<2.2 × 10⁻¹⁶<2.2 × 10⁻¹⁶<2.2 × 10⁻¹⁶<2.2 × 10⁻¹⁶
Adjusted R20.2740.0550.0550.051
RSE0.2252.0981.6020.985
Disclaimer/Publisher’s Note: The statements, opinions and data contained in all publications are solely those of the individual author(s) and contributor(s) and not of MDPI and/or the editor(s). MDPI and/or the editor(s) disclaim responsibility for any injury to people or property resulting from any ideas, methods, instructions or products referred to in the content.