Article

Influence of Long-Term Mulched Drip Irrigation on Upward Capillary Water Movement Characteristics in the Saline–Sodic Region of Northwest China

1
College of Water Conservancy & Architectural Engineering, Shihezi University, Shihezi 832000, China
2
Key Laboratory of Modern Water-Saving Irrigation of Xinjiang Production Construction Group, Shihezi University, Shihezi 832000, China
3
Key Laboratory of Northwest Oasis Water-Saving Agriculture, Ministry of Agriculture and Rural Affairs, Shihezi 832000, China
4
Technology Innovation Center for Agricultural Water and Fertilizer Efficiency Equipment of Xinjiang Production & Construction Corps, Shihezi 832000, China
*
Author to whom correspondence should be addressed.
Agronomy 2024, 14(6), 1300; https://doi.org/10.3390/agronomy14061300
Submission received: 24 May 2024 / Revised: 12 June 2024 / Accepted: 13 June 2024 / Published: 15 June 2024

Abstract

:
Capillary water, serving as a crucial intermediary between groundwater and crop root layer moisture, is important for both soil retention and crop utilization. To investigate the effect of mulched drip irrigation (MDI) on upward capillary water in cotton fields with different application years (0, 10, 14, 18, 20, and 24 years) in the saline–sodic region of Northwest China, an indoor soil column test (one-dimensional capillary water rise experiment) was conducted. The results showed that the wetting front transport law, capillary water recharge, and wetting front transport rate over time exhibited an increasing trend in the early stages of MDI application (10 and 14 years), peaking at 18 years of application, followed by a decreasing trend. The relationship between the capillary water recharge and rising height was fitted based on the Green–Ampt model, and their slopes reveal that 14 and 18 years of MDI application required the largest amount of water per unit distance, indicating an excellent water-holding capacity beneficial for plant growth. Conversely, 0 years required the smallest amount of water per unit distance. Based on the movement characteristics of upper capillary water, we confirmed that the MDI application years (0–18 years) improves soil infiltration capacity, while the long-term application years (18–24 years) reduces groundwater replenishment to the soil. Furthermore, the HYDRUS-1D model was employed to simulate the capillary water rise process and soil moisture distribution under different MDl application years. The results showed an excellent consistency with the soil column experiments, confirming the accuracy of HYDRUS-1D in simulating the capillary water dynamics in saline–sodic areas. The results would provide suggestions to achieve the sustainable development of long-term drip-irrigated cotton fields.

1. Introduction

Soil salinization, which limits plant growth, has become a key factor affecting global land use efficiency. The total area of saline–sodic land in China is 99.13 million square hectares, accounting for about 10% of the total land area [1]. Due to the sparse rainfall and high evaporation, Xinjiang has formed a typical inland saline area. Mulched drip irrigation (MDI) combines the water-saving benefits of drip irrigation with the insulating and moisturizing effects of plastic film. This method can prevent deep leakage, reduce soil evaporation, and save water and fertilizer [2]. Therefore, MDI technology has been widely adopted in cotton production in Xinjiang, making it the largest high-quality cotton production base in China.
Rising soil water flow, serving as an important water source for crops [3], is an essential factor to consider in sustainable land management in arid and semi-arid regions [4]. The capillary rise of shallow groundwater serves as a vital resource, supplying the necessary water for crop growth and reducing the demand for irrigation water [5]. Capillary water can dissolve various nutrients, which can be transported to the rhizosphere of crops for their growth and absorption [6]. Wu et al. [7] found that capillary water rise is a major water source for crops throughout the planting season, with crops heavily relying on groundwater. In each growing season of soybeans, the groundwater level contributes 12% to 30% of the total water consumption of crops, and a groundwater level of about 1.5 to 2 m can stabilize the interannual variation of grain yield. Soppe and Ayars [8] found that groundwater accounted for 40% of the daily water consumption of safflower, with 25% of total seasonal water consumption originating from groundwater at a depth of 1.5 m. Crops with a groundwater supply need 46% less irrigation water compared to those without a groundwater supply. Han et al. [9] studied the effect of groundwater on cotton growth using a numerical model combining the Hydrus-1D and SWAT simplified crop growth models. When the average depth of the groundwater is 1.84 m, the contribution of capillary water rise to crop transpiration is close to 23%, resulting in a 20% increase in cotton yield. Similarly, when the groundwater level has a positive impact on cotton growth, cotton growth increased the capillary water supply of groundwater through an increased leaf area index and potential transpiration. Hence, capillary rise from shallow groundwater is essential for both crop growth and water transport dynamics.
Capillary water can be classified into upward capillary water and hanging capillary water. Hanging capillary water refers to the water maintained near the ground surface due to capillary action, while upward capillary water refers to groundwater that rises into the soil pores through capillary action. Research on capillary water movement has mainly focused on the amount of the upward capillary water recharge [10,11,12], rising height [13,14,15], and rising rate [16,17] in homogeneous soil. It has been found that the amount of upward capillary water recharge and rising height in homogeneous soil all follow power-law relationships with time, and there is a clear linear relationship between capillary water rising height and recharge. Soil particle size plays a crucial role in determining the rising height of capillary water. Zhang et al. [18] studied the influence of particle size distribution on the capillary water rising height, and found that the relative rising rate of capillary water increased with the increase in fine particle content in the same type of soil. Additionally, the speed and height of the capillary water rise were directly proportional to the coarse particle content in the soil. Lv and Yang [19] conducted indoor capillary water tests to analyze the pore structure characteristics of three typical soils and observed the variation in capillary water height over time. Their findings underscored the significant influence of the pore structure and particle size distribution on capillary water rise dynamics. Wang et al. [20] explored the rise in capillary water under different densities and salinities in sandy loam soil, finding that sand layers had a significant inhibitory effect on soil moisture movement, and had a significant impact on the height, rate, and groundwater recharge of capillary water rise [21]. Li et al. [20] studied the effect of mineralization on the height of the capillary water rise, discovering that higher mineralization reduces the height of the capillary water rise. Xin et al. [22] demonstrated that the total dissolved solids (TDS) of KCl or NaCl dissolved in groundwater had a greater impact on the specific gravity of capillary water than on the soil pore structure. However, the movement characteristic of capillary water in soil with different application years were not well-investigated, which would be very important for understanding the mechanism of MDI application changed with the soil moisture migration capacity.
Moreover, the characteristics of capillary water movement in soil are influenced by factors [23] such as the soil bulk density, clay content, initial moisture content, groundwater depth, and solute concentration of aqueous solutions in soil. Numerical simulations offer a powerful tool to study and understand the complexities of capillary water rise. The HYDRUS-1D model, as a classic soil–water dynamics model, provides the possibility to simulate the process of groundwater rising along capillaries. Zhong et al. [24] applied HYDRUS to establish empirical models for the relationship between the capillary water supply and capillary water rise height, which can be used to screen the significant effects of various influencing factors based on numerical experimental results. Chen et al. [25] also used HYDRUS to establish models for the relationship between groundwater recharge and soil temperature and bulk density, as well as models for the relationship between capillary water rise height and soil temperature and bulk density. While extensive research exists on infiltration, studies on soil capillary rise based on numerical results are relatively scarce [26].
The movement of capillary water in the soil is an important hydrological process in arid and semi-arid regions [5]. In areas with a high salt content in the groundwater table, during the process of groundwater rise, capillary water can also drive the leached salt from deep soil to the soil surface through capillary action, affecting the degree of soil salinization [27]. However, the impact of long-term MDI application on capillary water movement characteristics has received little attention, which is a crucial factor in maintaining the water balance and affecting the salinization degree. In this context, we attempt to clarify the following: (1) investigating the capillary water rising height, velocity, capillary water recharge, and soil profile moisture distribution through soil column experiments with soil collected from cotton fields with different MDI application years; and (2) evaluating the applicability of the HYDRUS-1D software (version 4) for simulating capillary water in saline–sodic areas and simulating the upward capillary water movement characteristics under shallow groundwater conditions. The results can provide date support for the sustainable development of long-term MDI fields in arid regions.

2. Materials and Methods

2.1. Site Description and Soil Sample

The soil used for the column experiment was taken from the 121st Regiment (85°32′47″–85°34′15″ E, 44°45′85″–44°48′48″ N), near the city of Shihezi, Xinjiang, China. This region has a typically arid continental climate, with an annual sunshine duration of 2865 h, an average annual precipitation of 160 mm, and an annual evaporation of 1660 mm. This area of China is significantly impacted by water shortages and soil salinization, affecting over one-third of the irrigation area. Since the application of MDI in China, it has promoted the transformation of wasteland into farmland in saline–sodic areas, and this research area is the earliest area to apply MDI in China. This study adopted the method of “space for time substitution” [28] and selected 5 plots to represent different stages of typical soil succession process (cotton fields that have been using subsurface drip irrigation technology since 1998, 2002, 2004, 2006, 2008, and 2012). Meanwhile, a natural wasteland, never practicing MDI, was used to represent the initial state of the soil as a reference for land use in each cotton field. The corresponding years of continuous subsurface drip irrigation application are 24 a, 20 a, 18 a, 14 a, 10 a, and 0 a, respectively. Previous studies have provided a more detailed description of this site [29,30,31].
On 4 April (2023), soil samples were collected from cotton fields with different MDI application years. We set up sampling points using the five-spot-sampling method in fields with different MDI application years in the research area, with a sampling area of 5 m × 5 m. Randomly select four small squares of 50 cm × 50 cm from each sampling area, and collect 0–60 cm of soil. After removing the impurities, the soil samples were naturally dried in the air, and then sieved through a 2 mm mesh. A Malvern laser particle size analyzer (Eye Tech, Renkum, The Netherlands) was used to analyze the particle size composition of the soil samples. The initial physicochemical properties of the soil samples are shown in Table 1.

2.2. Experimental Design

The experiment was conducted in July 2023 at the Key Laboratory of Modern Water-saving Irrigation of the Water Conservancy and Civil Engineering College at Shihezi University, Xinjiang (86°03′43″ E, 44°18′52″ N) The experimental setup consisted of two parts: soil columns and the groundwater supply system. The soil columns were transparent organic glass cylinders with an inner diameter of 20 cm and a height of 170 cm to simulate the unsaturated soil layer with a groundwater depth of 150 cm. The bottom of the soil column consisted of a saturated water-bearing layer composed of gravel with particle size ranging from 3.0 to 7.0 mm, with a depth of 15.0 cm. The top of the column had a 5 cm air gap above the soil surface. Filter papers were placed at the soil–sand interface to prevent soil leakage and ensure uniform infiltration of water into the soil. A scale ruler was installed along the side of the soil column, and two rows of sampling holes were vertically arranged along the column, with a hole diameter of 4.0 cm (round hole with a wooden plug). The center-to-center distance between the holes was 10.0 cm, and the two rows of sampling holes were arranged in a cross pattern with a vertical spacing of 5.0 cm. The soil chamber was filled with the soil samples in layers, with each layer being 5 cm thick; based on the actual bulk density of the soil at different MDI application years, the layers were properly rubbed-down to avoid breaking, ensuring that the soil within the same soil column could be regarded as homogeneous.
In this simulation experiment, the capillary water rising test (in this study, capillary water specifically refers to upward capillary water) was conducted at a groundwater depth of 150 cm for the different MDI application years. To simulate the groundwater in the experimental area, we used slightly saline water with a conductivity of 3.61 mS/cm and a salinity of 2.2 g/L in the capillary rise experiment. We used a Mariotte bottle for automatic water supply to simulate the continuous water supply of groundwater to the soil. The height of the bottom of the glass tube of the bottle was adjusted to be same level as the soil–sand interface, ensuring that the air pressure at the water–sand interface is invariable and that the groundwater level was constant during the experiment (Figure 1). We set up water supply until the underground aquifer was saturated, and then we started timing. According to the principle of sparse first and then dense, we recorded the height of the upward capillary water wetting front and the descending height of the water level in the Mariotte bottom. When the wetting front of a soil column reached the soil surface, all groundwater supply was stopped, and the experiment was finished. Soil samples were collected at every 5 cm from top to bottom and dried to determine the gravimetric soil moisture content at different depths using an oven-drying method (105 °C). Then, the volumetric moisture content of soil was obtained by multiplying the soil bulk density by gravimetric soil moisture content. Further, the cumulative infiltration volume obtained from the Mariotte bottle readings was divided by the base area of the soil column to calculate the unit area capillary rise water recharge (all references to capillary water recharge in the text refer to the unit area capillary rise water recharge). Each treatment was repeated three times with three soil columns; therefore, there were eighteen soil columns in total.

2.3. HYDRUS-1D Model

2.3.1. The Basic Equations of Water Motion, the Initial Conditions, and the Boundary Conditions

We employed the HYDRUS-1D software (version 4) [32] for simulating the process of capillary water. Based on the experimental work, a numerical model was established using the Richards’s equation. The upper boundary was set as an evaporative boundary condition representing the atmosphere, while the lower boundary was set as a constant saturation condition. The entire finite element grid was uniformly discretized, except for refining the grid near the soil–water interface.
The governing equation for the rise in capillary water in the soil, along with the initial and boundary conditions, can be described by the following model, where z ( θ , t ) represents the unknown function for soil moisture movement in the unsaturated zone:
Governing equation:
z θ , t t = z D θ z θ , t θ K θ θ
Initial condition:
θ = θ i           t = 0           L > Z 0
Surface boundary conditions:
θ = θ i           t > 0           Z = L
Bottom boundary condition:
θ = θ s           t > 0           Z = 0
where Z is the vertical co-ordinate (cm), positive upward; θ is the volumetric water content (cm3/cm3); K is the unsaturated hydraulic conductivity (cm/min); D is the unsaturated soil water diffusivity (cm2/min); t is the time (min); θ i   is the initial water content (cm3/cm3); θ s is the saturated water content (cm3/cm3); and L is the height of soil column (cm).
The soil hydraulic function is expressed in the form of the van Genuchten–Mualem (VGM) formula [33]:
K s = K s θ e l 1 1 θ e 1 m m 2
θ e = θ h θ r θ s θ r = 1 + a h n m
m = 1 1 n , n > 1
where θ r is the residual soil moisture content (cm3/cm3); K s is the saturated hydraulic conductivity of the soil (cm/min); θ e is the effective water content (saturation) (cm3/cm3); n and a are empirical parameters that determine the characteristic curve of soil moisture; and l is a porosity correlation parameter, generally taken as 0.5.

2.3.2. Soil Hydraulic Characteristics Determination

The soil water characteristic curve (SMCC) is a curve which describes the relationship between soil water suction and soil water content [34], and it is widely used to analyze the water-holding capacity and availability of soil water in different texture and to discuss the mechanism and status of water movement.
According to the bulk density of different MDI application years, soils of different application years were placed into the cutting ring, and we soaked the cutting ring until saturated condition. SEC pressure membrane apparatus (1500F2, California, USA) was used to quantitatively analyze the soil moisture loss curve of the soil core, with pressures set at 1.0, 3.0, 5.0, 7.0, 9.0, and 15.0 bar. The van Genuchten (VG) model (Equation (6)) was used to describe the soil water characteristic curve (SWCC), and RETC6.02 software was used to fit the soil hydraulic parameters n , a , and K s in the VG equation. In this study, the initial prediction values of RETC were set based on the estimated values of soil particle size using the Rosetta module. The saturated moisture content θ s (cm3/cm3) was inverted by the product of the saturated soil weight moisture content (g/g) and bulk density when the undisturbed soil core was saturated for 24 h. The residual moisture content was replaced by the air-dried moisture content, as the two parameters were approximately equal.

2.4. Data Analysis

To evaluate the discrepancy and performance of the simulated values compared to the measured values, the determination coefficient ( R 2 ), root mean square error (RMSE), mean absolute error (MAE) [35], and percent bias (PBIAS) [36] were used. R 2 represents the degree of fit of the model, with values closer to 1 indicating a better match between the simulated and actual values. RMSE reflects the average absolute error between the simulated and measured values, with a smaller value indicating a closer match to the real conditions. A smaller MAE indicates a smaller difference between the simulated and measured data. A negative PBIAS indicates that the simulated data, on average, exceed the observed data, while positive PBIAS is the opposite—it indicates a good agreement between the simulated and measured values.
The calculation formulae are as follows:
R 2 = 1 i = 1 n Q i S i 2 i = 1 n Q i Q ¯ 2  
R M S E = i = 1 n Q i S i 2 n  
M A E = i = 1 n Q i S i n  
The PBIAS can be calculated as the deviation between the measured flow and the standard or expected flow through the cross-section:
P B I A S = i = 1 n ( Q i S i ) i = 1 n Q i × 100 %  
where n is the number of samples, Q i is the actual value, Q ¯ is the measured average value, and S i is the simulation value.

3. Results and Discussion

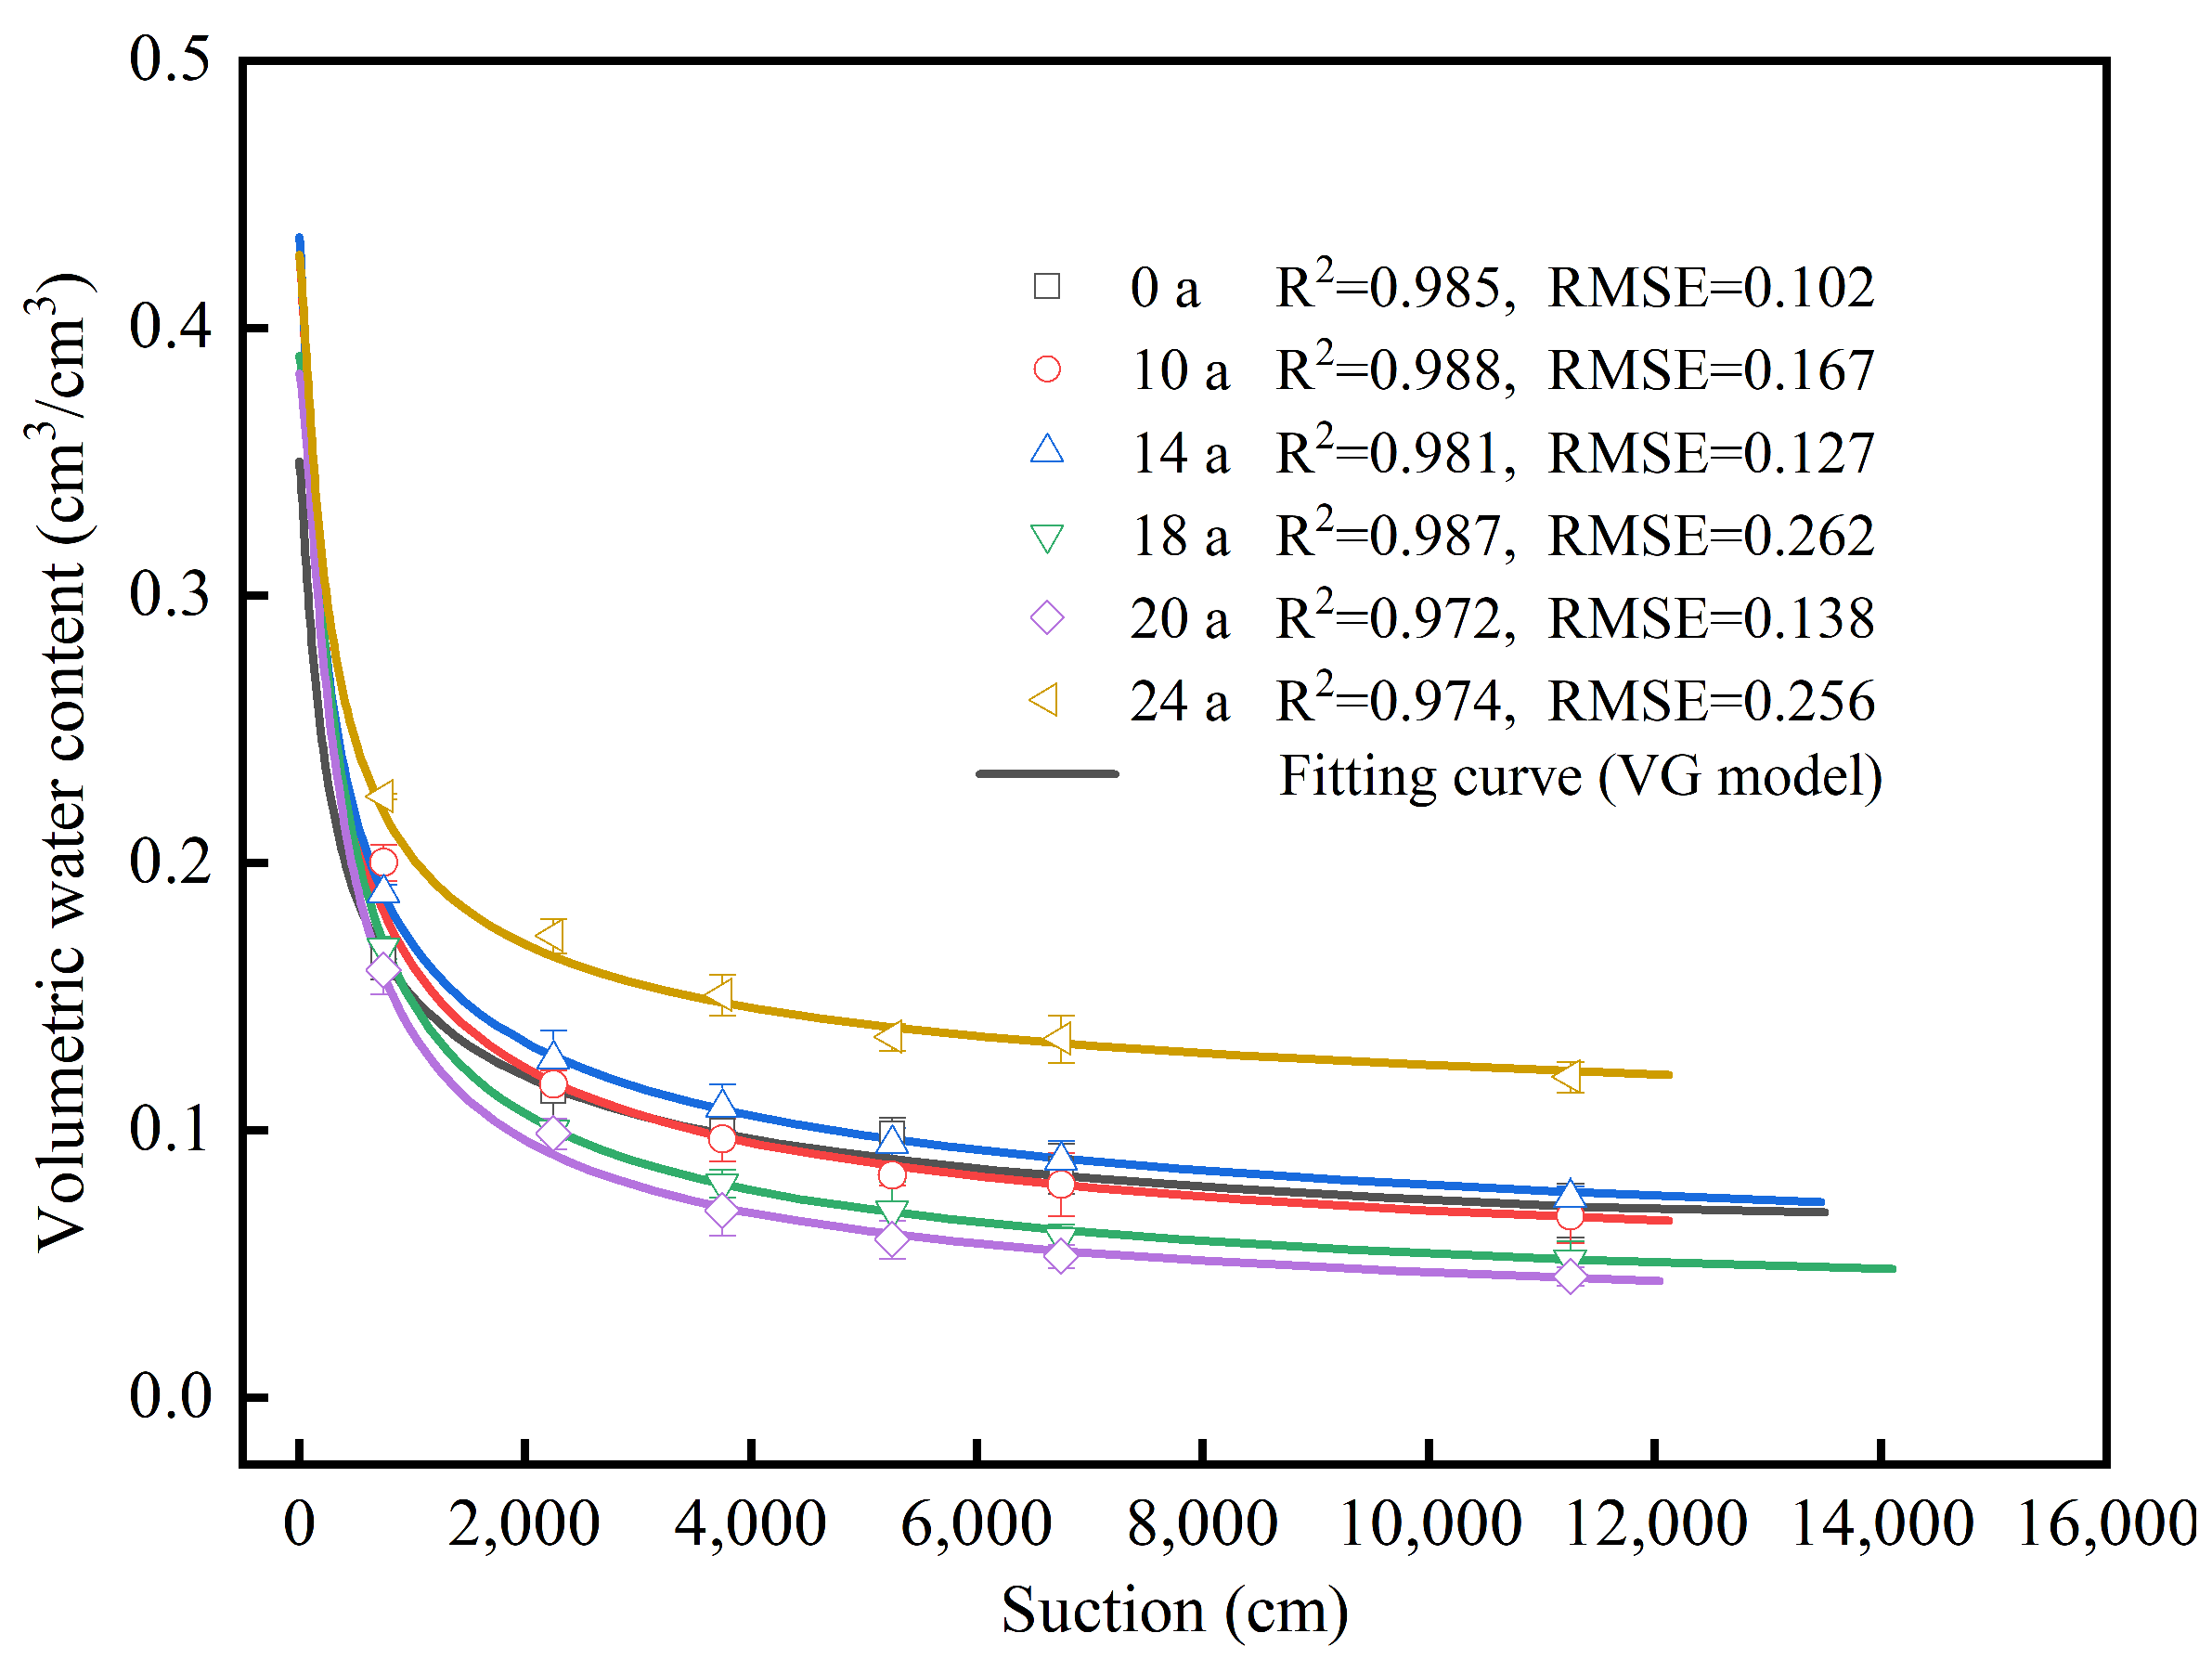
3.1. Soil Hydraulic Characteristic Parameters

The fitting result of the SMCCs are shown in Figure 2, with a high fitting accuracy (R2 > 0.970). The RMSE values for all treatments ranged from 0.102 to 0.362, indicating that all parameters can be used to simulate soil water movement. The soil hydraulic parameters are shown in Table 2. The soil moisture content varied at different suction stages with different MDI application years. In the low suction section (0–750 cm), the curves were steep, indicating a sharp decrease in soil water content with increasing suction. Soil drainage mainly occurs in large pores, and soil water release is easy [37,38]. In the middle to high suction range (750–14,000 cm), the curve changes smoothly, and the soil water content slowly decreases and tends to stabilize with the increase in suction. The differences in the six curves indicated that the soil moisture conductivity and water holding capacity varied with different years of application.
The soil hydraulic parameters are presented in Table 2. A higher saturated water content ( θ s ) and a lower residual water content ( θ r ) usually indicate a stronger soil moisture retention capacity. During the MDI application years of 10 to 24 years, θ r remained relatively stable and did not change significantly, but the difference between the saturated water content and residual water content increased by 0.0366 to 0.0775, indicating that the application of MDI has improved the soil’s water retention capacity. The suction parameter (α) was used to describe the ability of soil moisture to be adsorbed by solid phases. Compared with 0 a, the α of MDI application years decreased by 46.22% and 44.33% for 18 and 20 a, and increased by 6.60% for 24 a. A smaller α indicates that the soil has a strong attraction to water, and the conduction speed of water in the soil was relatively fast. The pore size distribution parameter (n) describes the shape and size of the soil pore distribution. A larger n indicates the presence of numerous small pores in the soil that help retain moisture and increase the slope of the soil moisture curve. After 18 and 20 a of MDI application, n slightly increased but decreased slightly after 24 years of application. This implies that, when the MDI application is 18 a, the soil has a good water-holding capacity and permeability, indicating that the soil has a good pore structure. Large pores promote rapid water infiltration, enhancing permeability, while small pores retain water, boosting the water-holding capacity. The soil saturated hydraulic conductivity ( K s ) is mainly affected by the soil porosity, soil structure, organic matter content, and so on. A higher K s value indicates a higher soil water flow rate under saturation, which shows that the soil water migration ability is stronger, which can effectively reduce the surface runoff and increase the infiltration capacity of the soil; the rising rate of capillary water also increases. The high Ks at 18 and 20 a indicates an increase in the water flow rate and strong soil water migration ability, which can effectively reduce the surface runoff, increase the soil infiltration capacity, and increase the rate of capillary water rise. This also means that the soil has a better drainage capacity and can quickly eliminate excess moisture, which can effectively reduce the surface runoff, increase the infiltration capacity, and enhance the capillary water rise.
Therefore, combined with the soil hydraulic parameters and SWCC curve, MDI application can improve the water holding capacity. When the MDI application years is 18 years, the infiltration capacity and water holding capacity of the soil are strong.

3.2. The Influence of MDI Application Years on the Movement Characteristics of Capillary Water

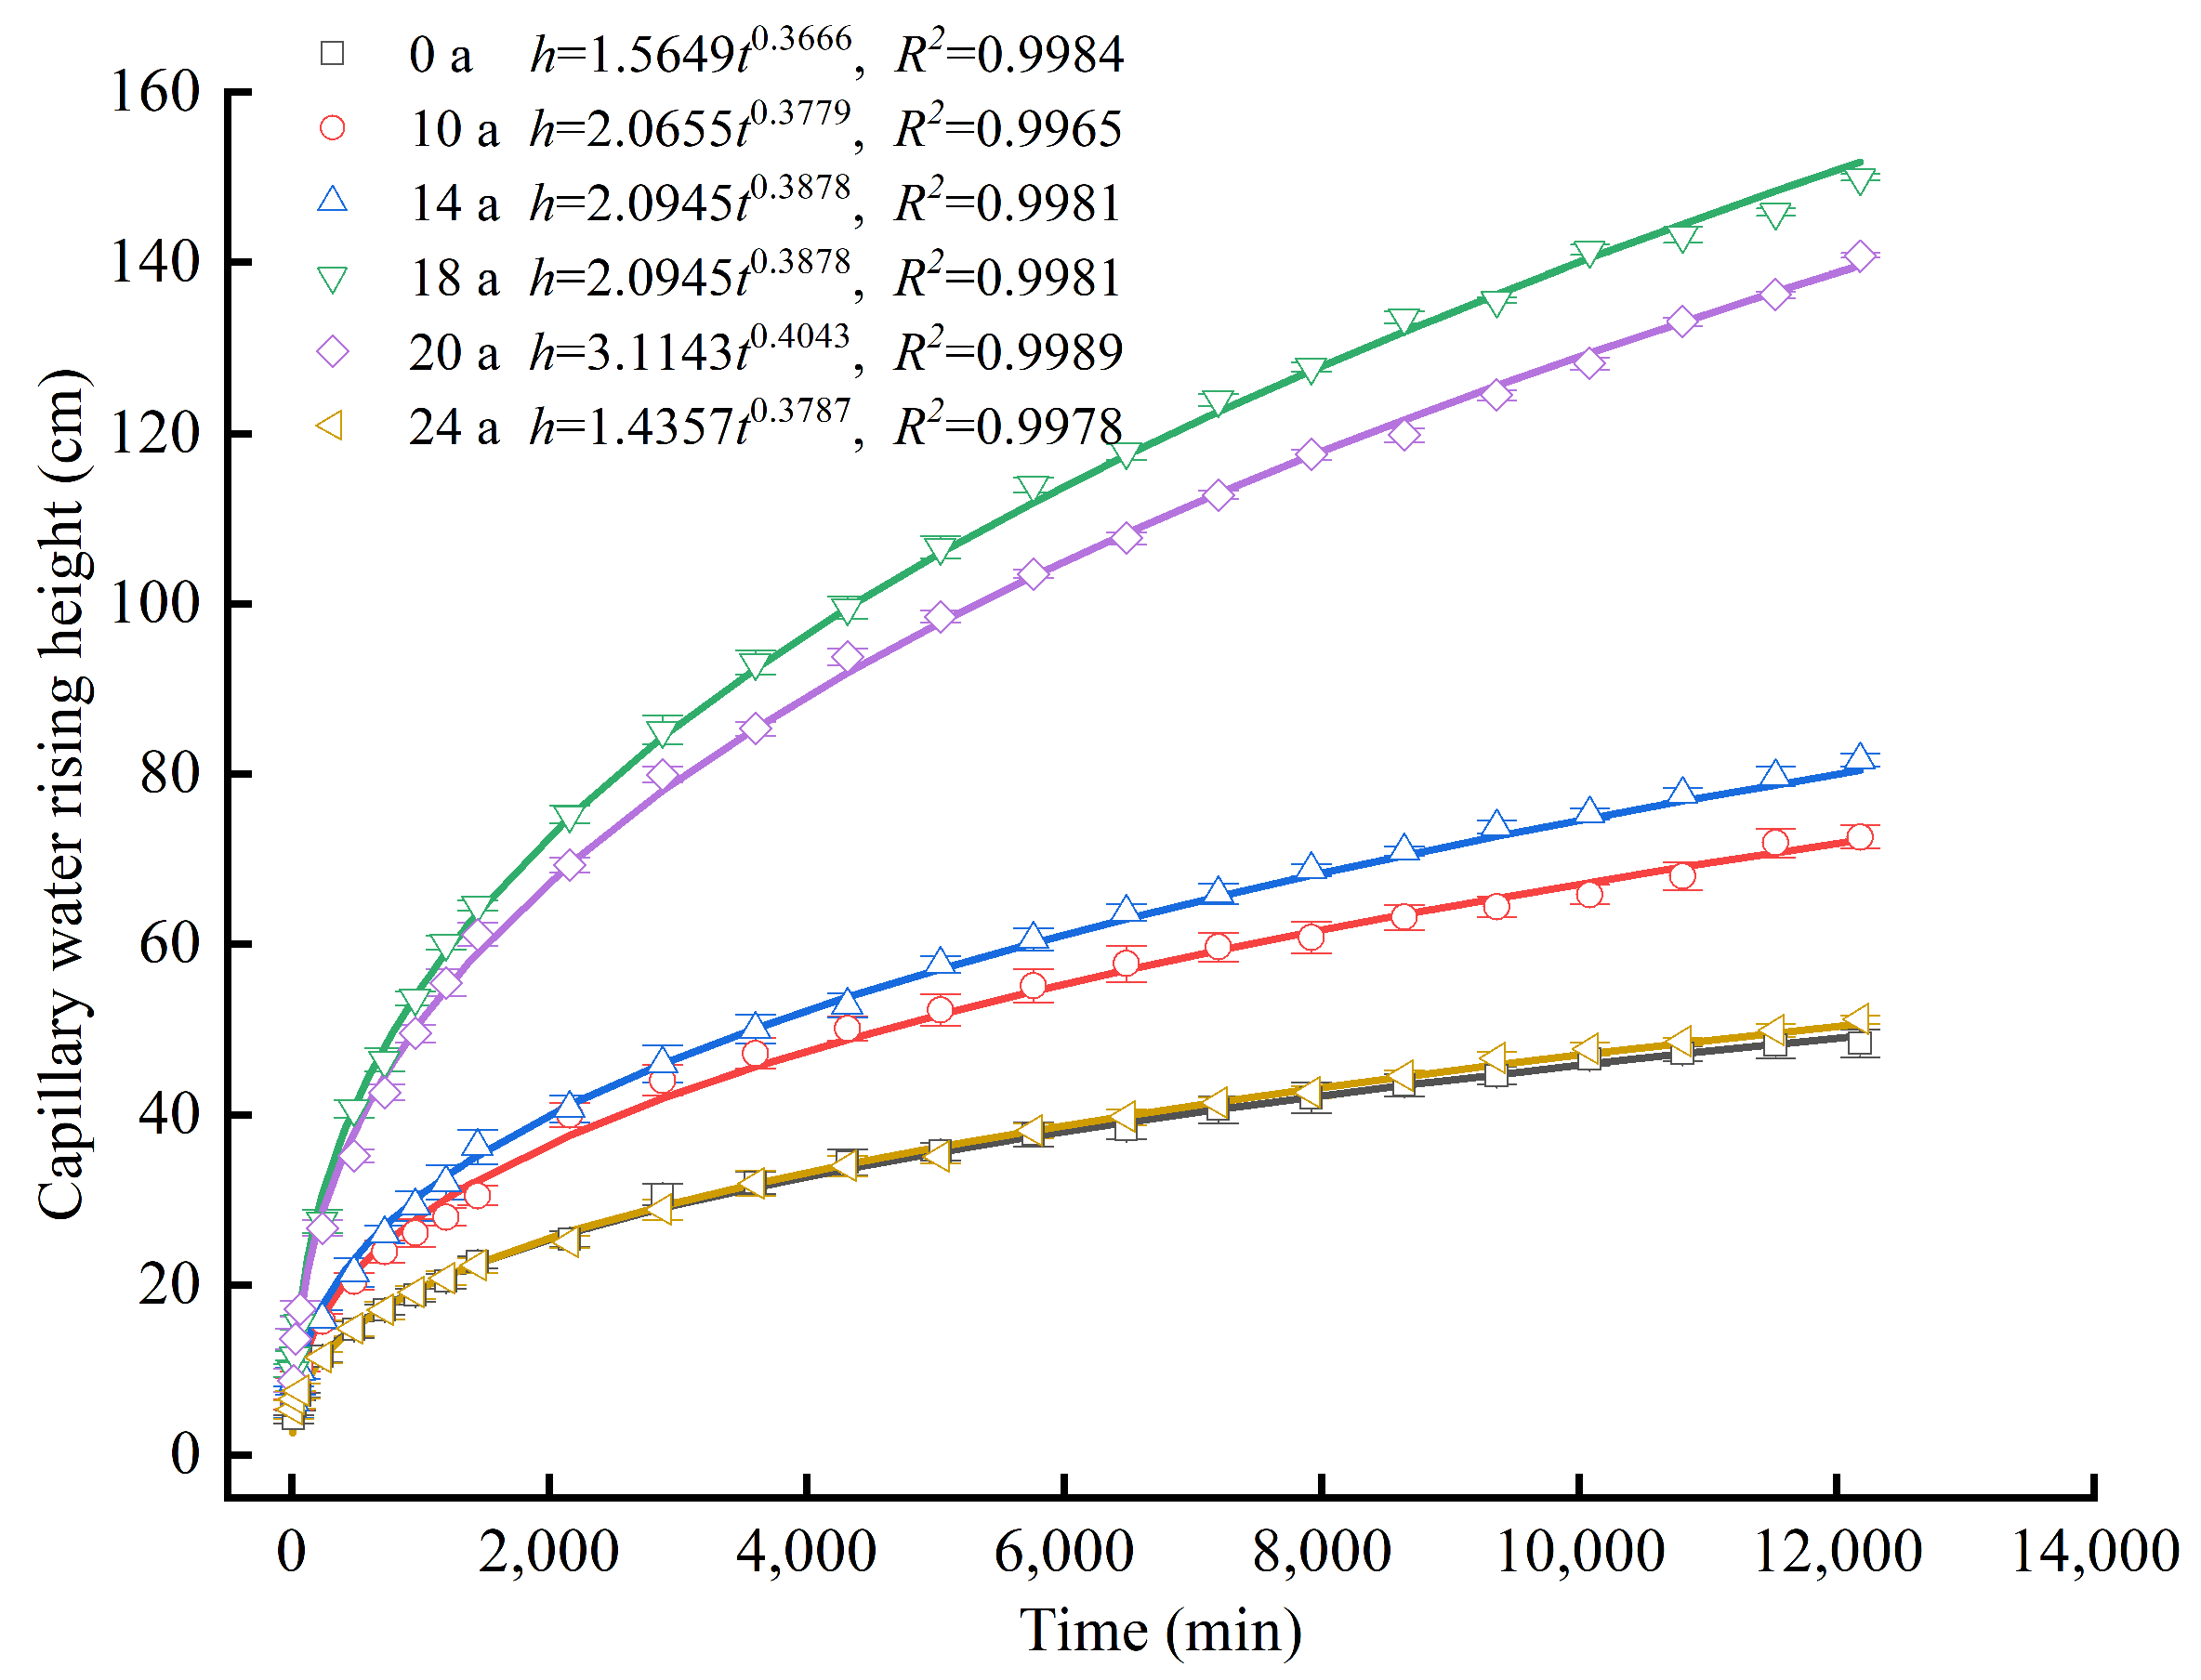
3.2.1. Wetting Front

The variation process of the measured wetting front values in drip-irrigated cotton fields with different application years with time variation is shown in Figure 3. The wetting front of the soil column test in six plots gradually increased over time, but the rising height varied at the same time. After 1440 min of capillary water rise, there was a significant difference in the height of the wetting front between different treatments. The height of the wetting front initially showed an increasing trend with the application years, with the minimum at 0 a and the maximum at 18 a of MDI application years. With the further extension of MDI application years, the wetting front movement distance decreased, but the height of the wetting front at 24 a was still higher than 0 a. As the application years increased, the capillary water rising height increased initially, and then decreased. At the end of the soil column experiment, the wetting front at 10, 14, 18, 20, and 24 a moved 1.50, 1.67, 3.10, 2.91, and 1.06 times higher than at 0 a, respectively. We further analyzed the wetting front migration in drip-irrigated cotton fields with different application years (Figure 3). A fitting analysis was performed on the wetting front height (h) and the infiltration time (t). Therefore, the capillary rise process should follow a nonlinear function relationship. By analyzing the experimental data, a power function was used to fit the relationship between the capillary rising height and time for different MDI application years (Figure 3).
The capillary rise height and time exhibited a power function relationship with R² greater than 0.99, indicating that the power function can accurately fit the soil moisture front transport patterns for different planting years. During the moist front change process over time, both coefficient a and index b first increased, and then decreased with planting years. The water movement in drip-irrigated cotton fields changed significantly compared to natural wasteland.
The capillary water rising height and time exhibited a power function relationship with R2 greater than 0.99, indicating that the power function can accurately fit the soil wetting front transport patterns for different application years. During the wetting front change process over time, both coefficient a and index b first increased, and then decreased with the increase in application years. The water movement in drip-irrigated cotton fields changed significantly compared to natural wasteland.
The reason may be that MDI has changed the bulk density [39] and particle composition [40] of soil in Xinjiang. The capillary water rising height is positively correlated with time and negatively correlated with soil bulk density and clay content [24]. In this study, the soil bulk density and clay content were low at 18 a, resulting in the maximum capillary water rising height. For 0 a and 24 a, the rate and height of the capillary water rise showed similarities. Compared to 0 a, the soil at 24 a had a lower bulk density and higher clay content. The clay content was similar at 14 a and 24 a, but the bulk density at 14 a (1.45 g/cm3) was lower than that at 24 a (1.6 g/cm3), resulting in a capillary water rising height at 14 a of approximately 1.56 times that at 24 a. The capillary water rising height reached a maximum at 18 and 20 a of MDI application, indicating a high soil water transport efficiency, which promotes crop growth and development. At 0 and 24 a, the water distribution was not uniform and the water use efficiency was low.

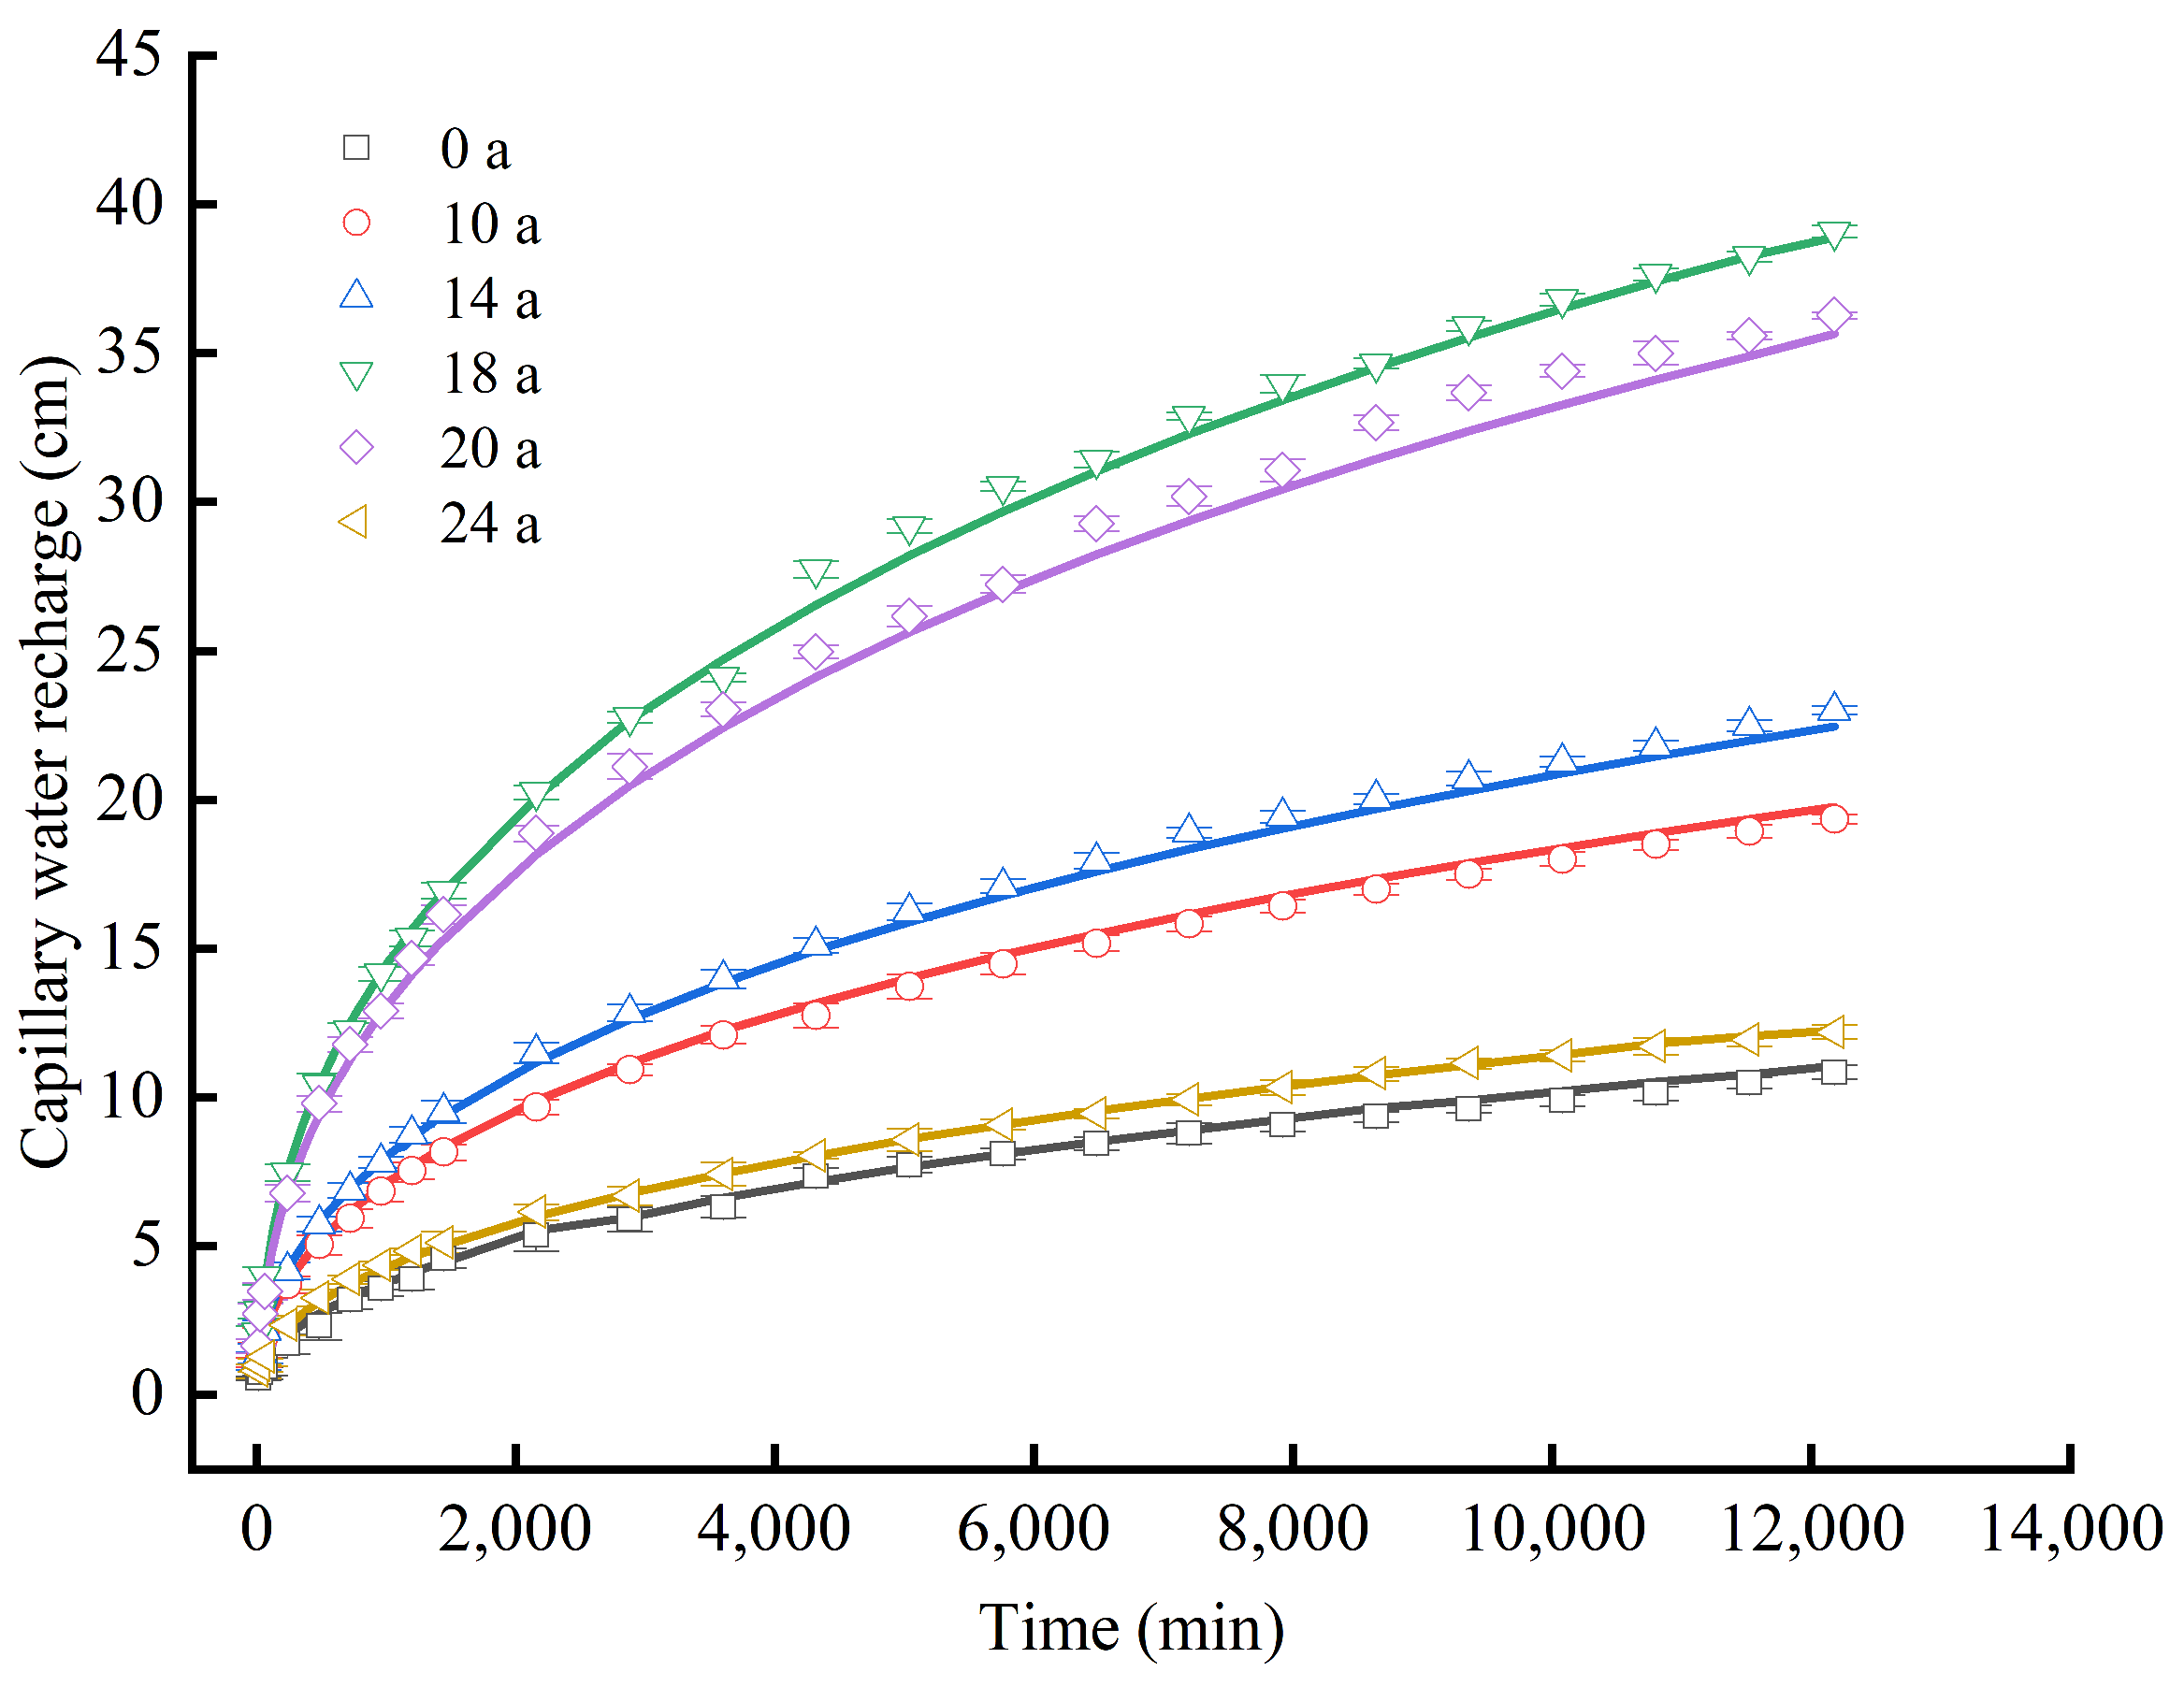
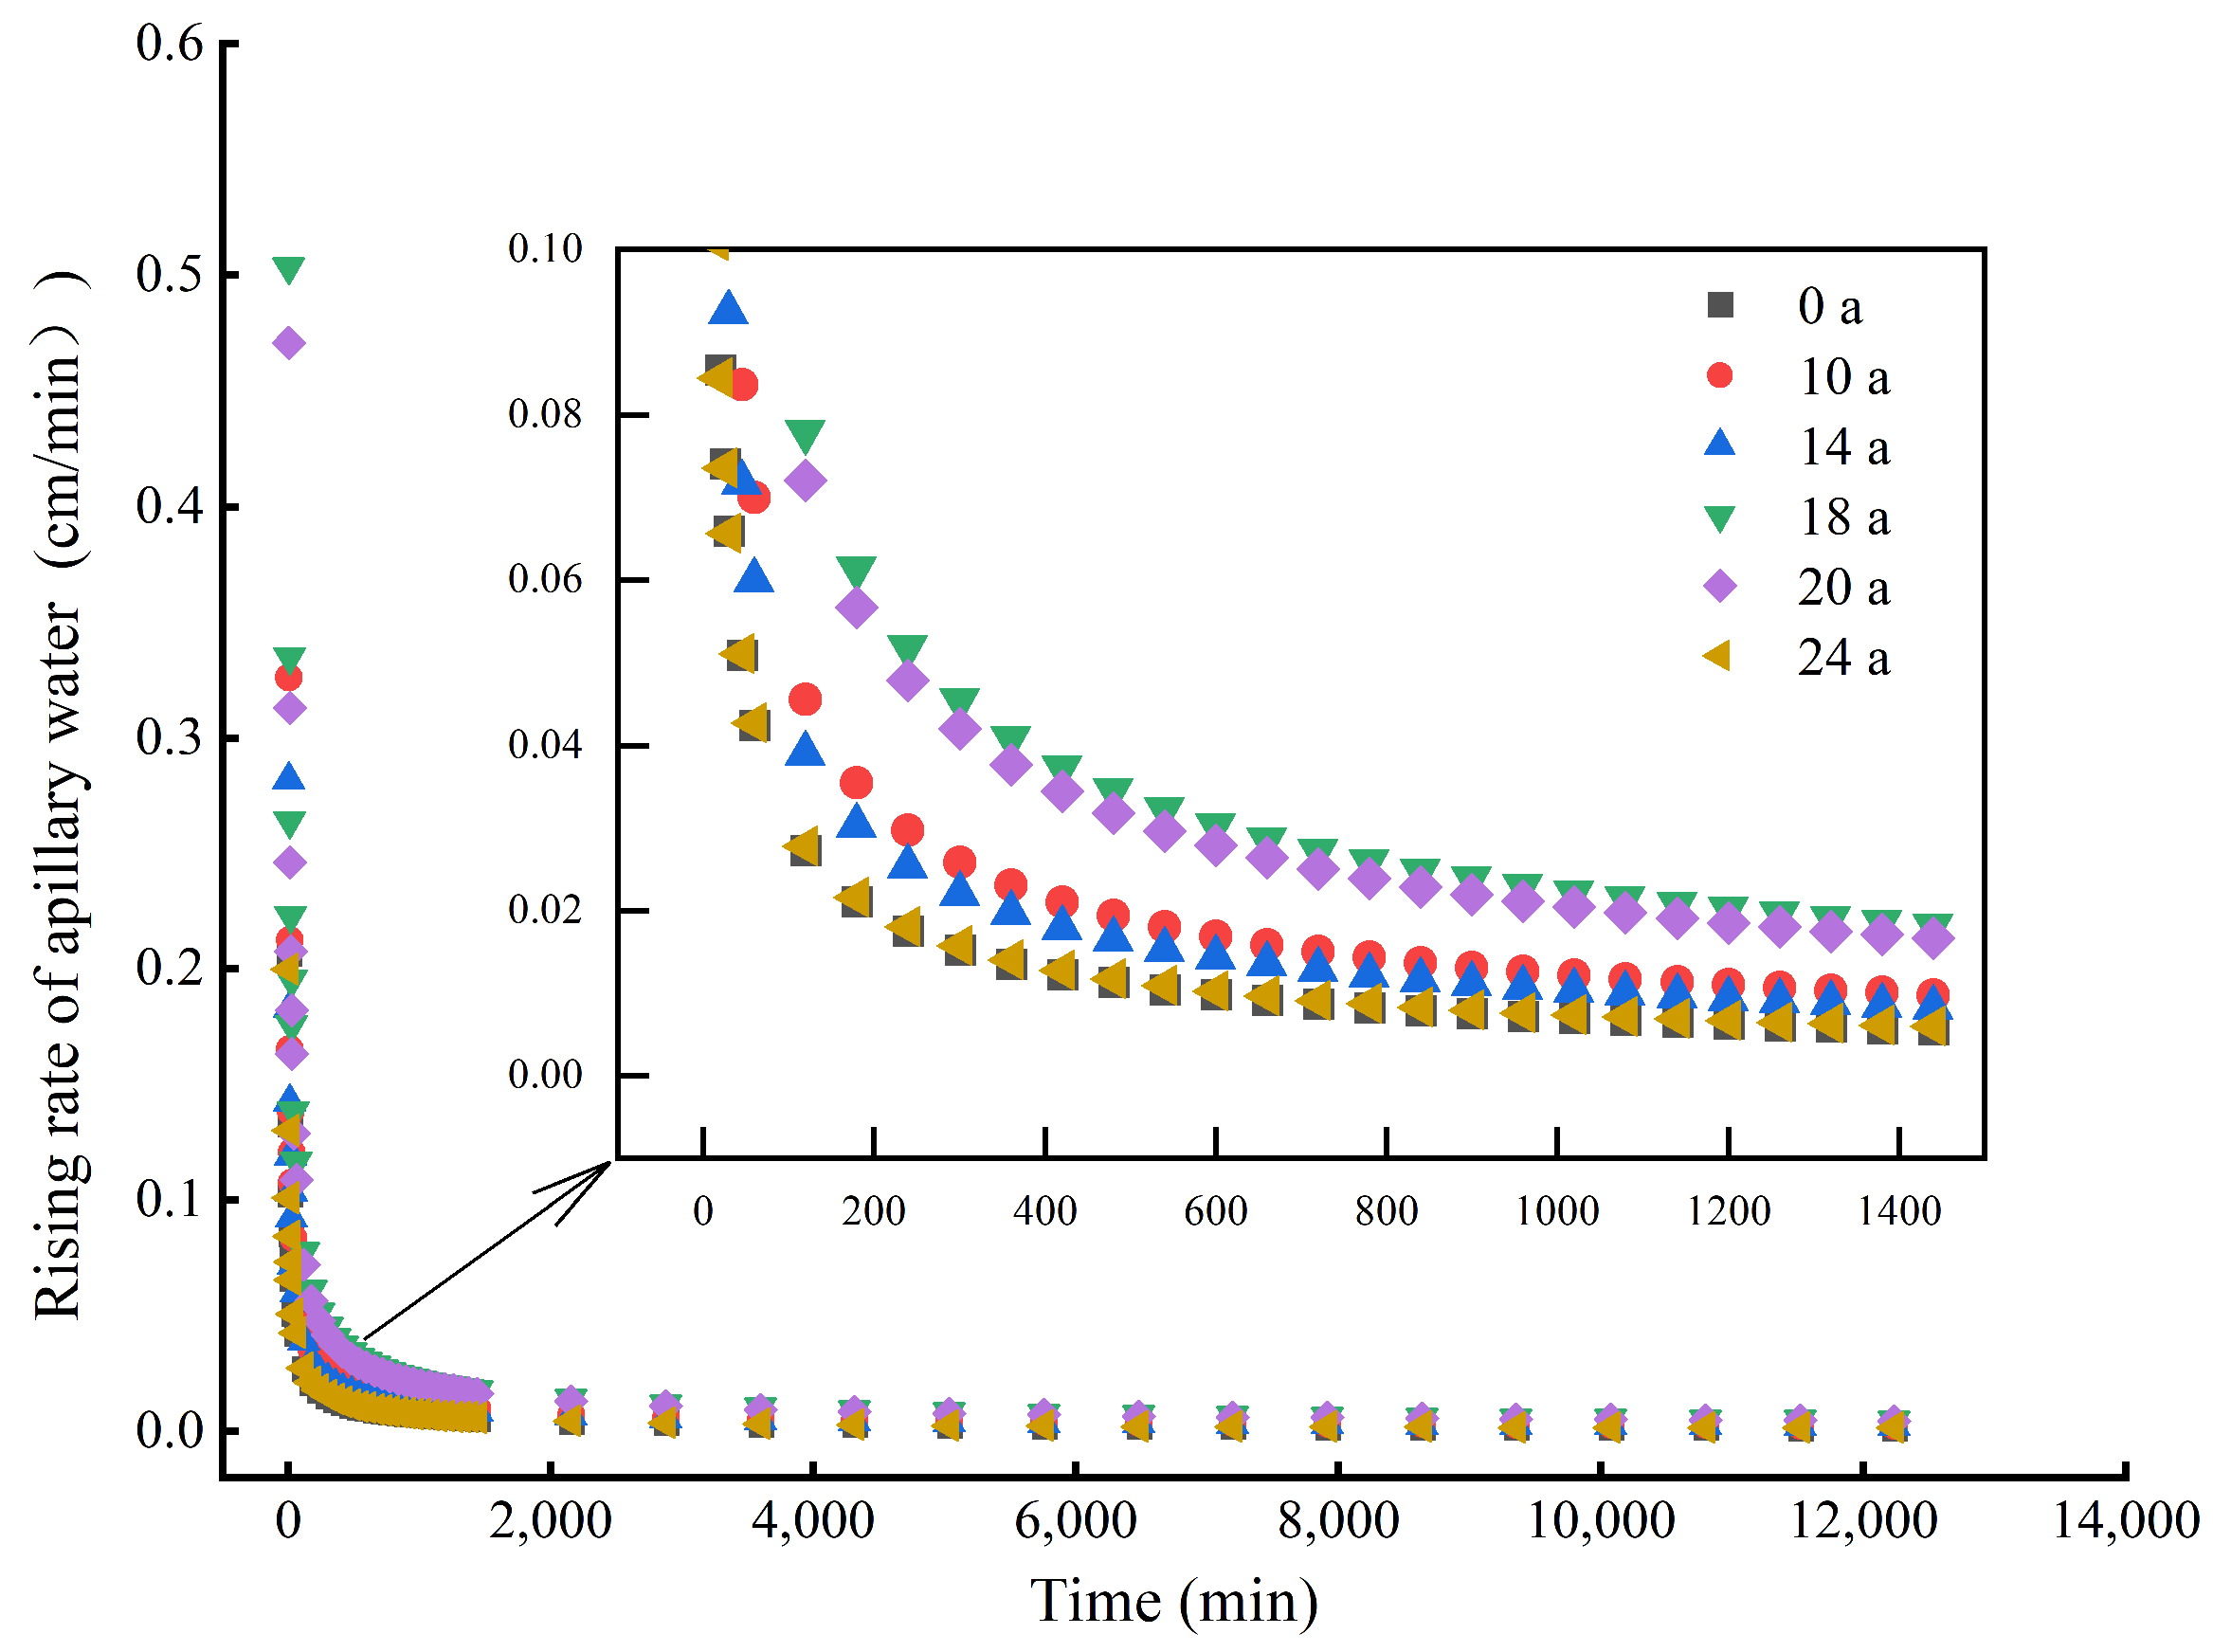
3.2.2. Capillary Water Recharge and Rising Rate

The capillary water recharge and rising rate showed similar trends across different MDI planting years, with the capillary water recharge increasing and the rising rate decreasing over capillary water rise time. Figure 3 and Figure 4 illustrated that the variation in capillary water recharge over time is basically consistent with the movement of the wetting front. At 1440 min into the experiment, the capillary recharge values for 0, 10, 14, 18, 20, and 24 a decreased by 73.99%, 51.86%, 43.11%, 4.62%, and 69.03%, respectively, compared to 18 a. By the end of the experiment, the measured capillary recharge values were 10.86, 19.38, 23.25, 39.11, 36.29, and 12.30 cm for each planting year, respectively. The capillary water recharge initially increased, and then decreased as the application years increased, indicating that the migration rate of water in the soil varied with MDI application years.
Figure 5 shows that the rising rate of capillary water for all planting years decreases with time, indicating a negative correlation between the infiltration rate and time. Table 3 presents the changes in the rising rate of capillary water under different application years, with i ¯ representing the average rate of increase. During the initial rising stage, the rising rate of capillary water in soil with different application years decreases rapidly. As the application years increase, the initial rising rate of capillary water first increases, and then decreases, with the minimum observed at 0 a. Compared to 0 a, the initial rising rate of capillary water at 10, 14, 18, 20, and 24 years increased by 86.42%, 91.77%, 218.11%, 96.71%, and 27.98%, respectively. There is a statistically significant difference in the initial rising rate between 0 a and 18, 20 a (p < 0.05). As the capillary rise progresses, the rising rate gradually decreases, transitioning to a stable stage. The differences in the stable infiltration rate i c among different application years are statistically significant (p < 0.05). After converting wasteland into drip-irrigated cotton fields, the stable rising rate increased by 6.26% to 287.51%, indicating the effect of different MDI application years on the stable rise stage of capillary water. With increasing planting years, the average rising rate and the stable rising rate initially increase, and then decrease.
The water conductivity of wasteland soil is weak, as indicated by the SWCC curve and hydraulic parameters. Additionally, the coefficient a and n reached their maximum at 18 a, indicating a high soil water holding capacity which prolongs the retention time of capillary water in the soil, stabilizing soil water for plants and regulating the recharge capacity of groundwater. Additionally, the capillary water rising height reaches their maximum at 18 a of MDI application indicating that, when the groundwater level is the same, crops are more likely to absorb and utilize groundwater, promoting crop growth. Furthermore, the initial and stable rates of capillary water movement from the lower to the upper layers are relatively high, facilitating faster water from the deeper soil layer to the surface layer, thereby promoting the rise of capillary water. Consequently, the infiltration and holding capacity of soil can affect the movement of capillary water, which, in turn, influences the distribution and utilization of soil water. This interaction is important for understanding soil water movement and crop water use.

3.3. The Process of Capillary Water Rise Simulated by HYDRUS-1D

Statistical comparisons were made between the HYDRUS simulation results and the experimental data on the capillary water rising height and recharge in soils with different MDI application years. The results are presented in Table 4. For both the capillary water rising height and the capillary water recharge, the R2 values exceeded 0.96, and the absolute PBIAS values were below 10% in all cases, indicating that the established HYDRUS model has a high degree of accuracy in simulating the process of capillary water rise in soils of cotton fields with different MDI application years. In sum, the HYDRUS software (vision 4) can be used to simulate the capillary rise process in the saline–sodic region of Northwest China.
However, in the initial stage of the capillary rise experiment, the observed capillary rising height during the initial 360 min of the capillary rise experiment was consistently lower than the HYDRUS simulation results; during the initial 360 min of the capillary rise experiment, the observed rising heights were consistently lower than the HYDRUS simulations, while the capillary water supply was higher than the simulation. This was due to the extended duration of the experiment, which resulted in an increased gravitational pressure and higher soil bulk density at the bottom. Therefore, the rate of capillary rise slowed down, and more water was required to raise the water level by a unit height compared to the simulated values. At the same time, the soil moisture characteristic curve did not consider the hysteresis effect, and the conversion relationship between the soil matrix potential and moisture content was only obtained through the empirical van Genuchten model. These factors introduced were errors in the conversion process between the simulated and measured values, but the simulation results remained within an acceptable range.

3.4. The Relationship between Capillary Water Recharge and Wetting front Migration

The relationship between the capillary rising height and capillary water recharge reflects the contribution of groundwater during the capillary rise process. The capillary rising height increases with the capillary water recharge, demonstrating a positive correlation. According to the Green–Ampt model assumption [41], the relationship between the capillary water recharge and capillary rising height (wetting front advance distance) can be described as follows:
Q = H K = ( θ s θ i ) H
where Q is the capillary water recharge (cm); H is the capillary water rising height (cm); θ i is the effective water content (saturation) (cm3/cm3); θ s is the effective water content (saturation) (cm3/cm3); and K is the constant.
Due to the fixed constants of the soil saturation moisture content and initial moisture content, there exists a linear relationship between the capillary water recharge and capillary water rise height. As shown in Table 5, the relationship for different application years is expressed well by using a linear function with an intercept of 0, with an R 2 above 0.96. The parameter K is the slope of a straight line, indicating the amount of water required per unit distance to advance the wetting front and reflecting the water permeability of soil profiles. K1 is the slope of the measured result, and K2 is the slope of the HYDRUS-fitted result. From Table 6, it can be observed that the planting years significantly impact the soil infiltration capacity. Specifically, the K1 values for planting years ranging from 10 to 24 a were all less than 0 a, indicating that the soil in 0 a required the smallest amount of water per unit distance to advance, and has poor water permeability. K1 shows a trend of first decreasing, and then increasing with the increase in planting years, and reaches its minimum value at 14 and 18 a, indicating that these years require the largest amount of water per unit distance and have a good water-holding capacity [42] which is beneficial for plant growth. As time goes on, the water holding capacity of soil may be suppressed.
In addition, based on the measured values (K1) of the capillary water rising height, capillary water recharge, and the fitting values by HYDRUS, the fitted values (K2) have a high degree of agreement, with a relative error of less than 10%. This indicates HYDRUS has a high accuracy in fitting the capillary water rise process.

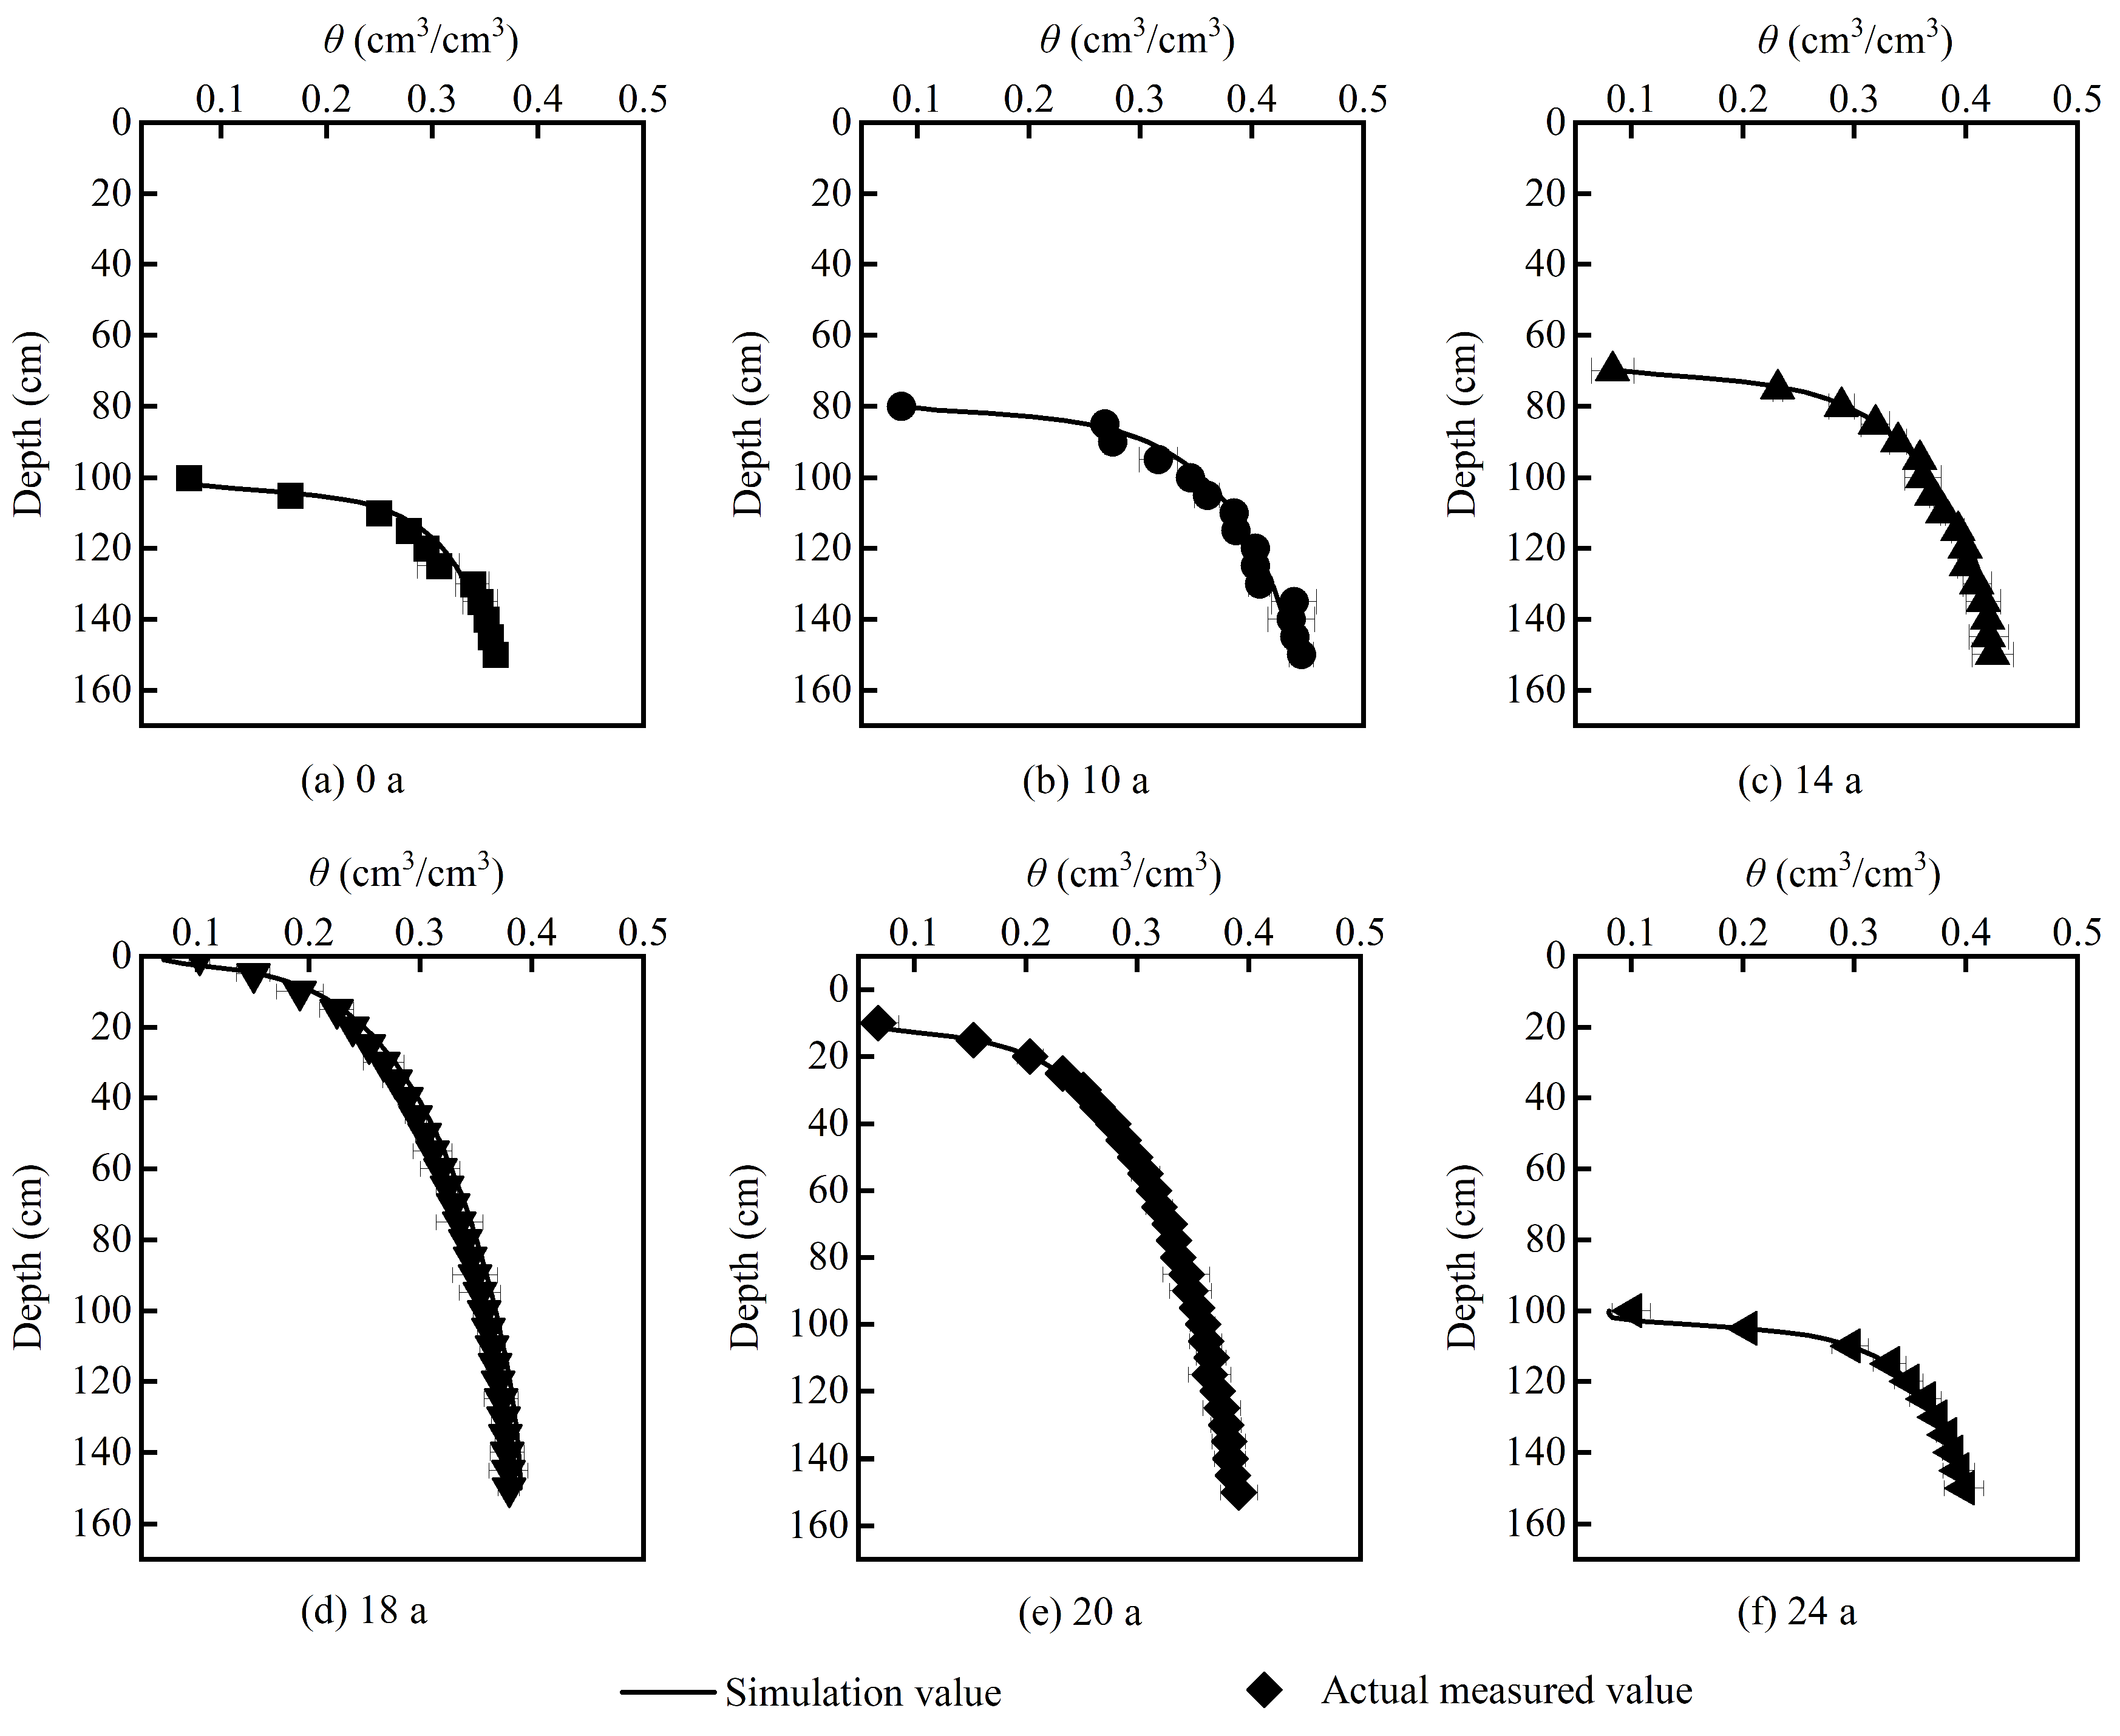
3.5. Soil Profile Moisture Content Distribution

Accurately predicting the distribution of soil water content profiles is of great significance for improving water resource utilization in arid and semi-arid regions of Northwest China. After completing the vertical one-dimensional soil column capillary rise experiment, soil samples were taken in layers of 5 cm from bottom to top to determine the volumetric soil water content, thereby obtaining the distribution of the soil water content at different depths. The HYDRUS-1D model was used to analyze the fitted soil water content profiles for MDI application years. From Figure 6, it can be observed that the volumetric soil water content decreases with decreasing depth for soils with different application years.
After obtaining the fitted results, the fitting degree of the simulated values to the measured values was evaluated using RMSE and MAE. For the measured and simulated soil water content values in cotton fields with different MDI application years, the MAE ranged from 0.0016 to 0.0109, and RMSE ranged from 0.0211 to 0.0125. Independent-sample t-tests were conducted between the measured and simulated values of soil water content, and it was found that all p values were greater than 0.05, indicating that the differences between the measured and simulated values were not statistically significant. Therefore, based on comprehensive evaluation indicators and the fitted curve, HYDRUS can effectively simulate the variations in soil water content profiles at different depths in soils with different application years.

4. Conclusions

In this study, we investigated the impact of long-term mulched drip irrigation (MDI) on upward capillary water movement characteristics through the one-dimensional vertical soil columns test. HYDRUS-1D software (version 4) was applied to simulate the upward capillary water movement of soil under different application years. The results show a significant trend in changes to the soil infiltration capacity and water holding capacity with the extended MDI application years. The soil hydraulic parameters of soil show that the application of MDI in cotton fields can improve the soil water retention and permeability compared to wasteland, thereby creating favorable conditions for cotton growth in saline–sodic soils. The rising height of the wetting front and capillary water recharge, and the rising rate of capillary water show a trend of first increasing, and then decreasing with the application years, reaching the maximum in 18 a. Linear relationships between the capillary water rising height and capillary water recharge were fitted based on the Green–Ampt model. The fitting values indicate that 0 a requires the least water per unit distance, while 14 and 18 a require the largest, indicating a higher water-holding capacity of soil, beneficial for crop growth. Overall, the movement characteristics of capillary water indicate that 0–18 a of MDI application improve the soil water infiltration capacity, while long-term application years (18–24 a) will reduce groundwater replenishment to the soil. Additionally, the HYDRUS-1D model can effectively simulate the process of the capillary water rise and the distribution of the soil moisture content with different application years.
This study shows that the infiltration capacity and water holding capacity of soil change with MDI application years, along with the characteristics of the capillary water rising movement. Therefore, different irrigation schedules should be implemented for soils with different MDI application years, or farmland fallow should be carried out based on the transport capacity of capillary water, in order to optimize water-using efficiency and achieve sustainable development.

Author Contributions

Conceptualization, J.Z. and Z.W.; methodology, Y.C. and P.L; software, Y.C.; validation, P.L. and Y.Z.; formal analysis, Y.C. and Y.Z.; investigation, P.L.; data curation, J.Z.; writing—original draft preparation, Y.C; writing—review and editing, J.Z., R.C., T.H., and H.L.; visualization, J.Z.; supervision, J.Z.; project administration, Z.W.; funding acquisition, J.Z. All authors have read and agreed to the published version of the manuscript.

Funding

This research was supported by the National Natural Science Foundation of China (52279040, 52369011, 42267041).

Data Availability Statement

The data presented in this study are available upon request from the corresponding authors.

Conflicts of Interest

The authors declare no conflicts of interest.

References

  1. Rao, Y.; Peng, T.; Xue, S. Mechanisms of plant saline-alkaline tolerance. J. Plant Physiol. 2023, 281, 153916. [Google Scholar] [CrossRef] [PubMed]
  2. Wang, J.; Du, G.; Tian, J.; Jiang, C.; Zhang, Y.; Zhang, W. Mulched drip irrigation increases cotton yield and water use efficiency via improving fine root plasticity. Agric. Water Manag. 2021, 255, 106992. [Google Scholar] [CrossRef]
  3. Kroes, J.; Supit, I.; van Dam, J.; van Walsum, P.; Mulder, M. Impact of capillary rise and recirculation on simulated crop yields. Hydrol. Earth Syst. Sci. 2018, 22, 2937–2952. [Google Scholar] [CrossRef]
  4. Yang, T.; Ala, M.; Guan, D.; Wang, A. The Effects of Groundwater Depth on the Soil Evaporation in Horqin Sandy Land, China. Chin. Geogr. Sci. 2021, 31, 727–734. [Google Scholar] [CrossRef]
  5. Chen, S.; Mao, X.; Shang, S. Response and contribution of shallow groundwater to soil water/salt budget and crop growth in layered soils. Agric. Water Manag. 2022, 266, 107574. [Google Scholar] [CrossRef]
  6. Liu, W.J.; Wu, J.H.; Pei, Q.B.; Zhang, T. Experimental Research on Capillary Water Upward Movement in Homogeneous Soil Under Different Ground Water Tables. J. Water Resour. Water Eng. 2010, 21, 67–69. [Google Scholar]
  7. Wu, Y.; Liu, T.; Paredes, P.; Duan, L.; Pereira, L.S. Water use by a groundwater dependent maize in a semi-arid region of Inner Mongolia: Evapotranspiration partitioning and capillary rise. Agric. Water Manag. 2015, 152, 222–232. [Google Scholar] [CrossRef]
  8. Soppe, R.W.O.; Ayars, J.E. Characterizing ground water use by safflower using weighing lysimeters. Agric. Water Manag. 2003, 60, 59–71. [Google Scholar] [CrossRef]
  9. Han, M.; Zhao, C.; Šimůnek, J.; Feng, G. Evaluating the impact of groundwater on cotton growth and root zone water balance using Hydrus-1D coupled with a crop growth model. Agric. Water Manag. 2015, 160, 64–75. [Google Scholar] [CrossRef]
  10. Yin, J.; Fei, L.; Cheng, D. Laboratory experiment on characteristics of capillary water upward movement from homogeneous soil. Trans. Chin. Soc. Agric. Eng. 2007, 23, 91–94. [Google Scholar]
  11. He, K.; Fei, L.; Yin, J. Rising Capillary Water Transport Characteristics of Homogeneous Soil. J. Shenyang Agric. Univ. 2007, 38, 581. [Google Scholar]
  12. Yuan, Y.Q.; Zhao, L.M.; Li, W.; Cao, R.C. Research on Silty Soil Capillary Water Rising in Yellow River Flooded Area of Eastern Henan. J. Highw. Transp. Res. Dev. 2016, 10, 40–46. [Google Scholar] [CrossRef]
  13. Guo, Q.; Li, X.; Li, M. Comprehensive tests on rising height of capillary water for coarse grained soil. Glob. Geol. 2013, 16, 54–58. [Google Scholar]
  14. Yang, H.Z.; Kan, C.Q.; Mao, X.H. Affection of Capillary Water Rising Height Which Made by the Layer Aquasorb Dosage. Water Sci. Eng. Technol. 2013, 05, 68–71. [Google Scholar]
  15. Pan, W.S.; Lu, Y.D.; Guo, J.Y. The Characters of the Capillary Water Rise and its Ecological Significance in Desert Lake-Basin Region, Northwest China. Adv. Mater. Res. 2014, 955–959, 3671–3677. [Google Scholar] [CrossRef]
  16. Stenitzer, E.; Diestel, H.; Zenker, T.; Schwartengraeber, R. Assessment of Capillary Rise from Shallow Groundwater by the Simulation Model SIMWASER Using Either Estimated Pedotransfer Functions or Measured Hydraulic Parameters. Water Resour. Manag. 2007, 21, 1567–1584. [Google Scholar] [CrossRef]
  17. Li, P.; Pan, Y.-h.; He, F.-h.; Tian, L.-l.; Ji, S.-x. Research on Capillary Water Absorption Characteristics of Yellow River Delta Wetland Soil. Chin. J. Agrometeorol. 2017, 38, 378–387. [Google Scholar]
  18. Zhang, P.; Wu, H.; Yin, H.J. Effect of particle size distribution on capillary water upward movement. Water Sav. Irrig. 2010, 7, 24–26. [Google Scholar]
  19. Lv, Q.L.; Yang, H.H. Pore structure characteristics of different soils and analysis of capillary water rising law. China Energy Environ. Prot. 2019, 41, 102–106. [Google Scholar]
  20. Li, X.; Zhou, J.; Zhao, Y.; Liu, Y. Effects of high-TDS on capillary rise of phreatic water in sand soil. Nongye Gongcheng Xuebao/Trans. Chin. Soc. Agric. Eng. 2011, 27, 84–89. [Google Scholar]
  21. Wang, D.; Fei, L. Rising Capillary Water Transported Characteristics of Layered Soil. Ground Water 2009, 31, 35–37. [Google Scholar]
  22. Xing, X.; Li, X.; Ma, X. Capillary rise and saliferous groundwater evaporation: Effects of various solutes and concentrations. Hydrol. Res. 2019, 50, 517–525. [Google Scholar] [CrossRef]
  23. Khorshidi, M.; Lu, N.; Akin Idil, D.; Likos William, J. Intrinsic Relationship between Specific Surface Area and Soil Water Retention. J. Geotech. Geoenviron. Eng. 2017, 143, 04016078. [Google Scholar] [CrossRef]
  24. Zhong, Y.; Fei, L.; Fu, Y.; Chen, L.; Liu, L. HYDRUS simulation and verification of movement characteristics of upward capillary water flow in soil as affected by multi-factor. Trans. Chin. Soc. Agric. Eng. 2018, 34, 83–89. [Google Scholar] [CrossRef]
  25. Chen, L.; Fei, L.; Fu, Y.; Wang, Z.; Zhong, Y. Simulation and Verification of Movement Characteristics of Upward Capillary Water Flow of Saline Water in Soils with Different Soil Temperatures and Bulk Densities Using HRDRUS. J. Soil Water Conserv. 2018, 32, 87–96. [Google Scholar]
  26. Zhang, Q.; Chen, W.; Wu, G.; Wang, W.; Du, Y.; Bi, J. Effect of PVA-treated soil on water-salt capillary rise in loess soil: Soil column experiment. J. Hydrol. 2022, 610, 127806. [Google Scholar] [CrossRef]
  27. Shokri-Kuehni, S.M.S.; Raaijmakers, B.; Kurz, T.; Or, D.; Helmig, R.; Shokri, N. Water Table Depth and Soil Salinization: From Pore-Scale Processes to Field-Scale Responses. Water Resour. Res. 2020, 56, e2019WR026707. [Google Scholar] [CrossRef]
  28. Pickett, S.T.A. Space-for-Time Substitution as an Alternative to Long-Term Studies. In Long-Term Studies in Ecology: Approaches and Alternatives; Likens, G.E., Ed.; Springer: New York, NY, USA, 1989; pp. 110–135. [Google Scholar]
  29. Wang, Z.; Fan, B.; Guo, L. Soil salinization after long-term mulched drip irrigation poses a potential risk to agricultural sustainability: Soil salinization under mulched drip irrigation. Eur. J. Soil Sci. 2019, 70, 20–24. [Google Scholar] [CrossRef]
  30. Tan, M.; Li, W.; Zong, R.; Li, X.; Han, Y.; Luo, P.; Dhital, Y.P.; Lin, H.; Li, H.; Wang, Z. Long-term mulched drip irrigation enhances the stability of soil aggregates by increasing organic carbon stock and reducing salinity. Soil Tillage Res. 2024, 240, 106069. [Google Scholar] [CrossRef]
  31. Zhang, A.; Wang, Z.H.; Wang, J.L.; Li, W.H. Influence of ground water on soil water and salinity distribution under the condition of evaporation. Agric. Res. Arid. Areas 2015, 33, 229–233. [Google Scholar]
  32. Šimůnek, J.; Šejna, M.; Saito, H.; Sakai, M.; Genuchten, M.T.V. The HYDRUS-1D Software Package for Simulating the One-Dimensional Movement of Water, Heat, and Multiple Solutes in Variably-Saturated Media; University of California-Riverside Research Reports; United States Salinity Laboratory, Agricultural Research Service, U.S. Department of Agriculture: Riverside, CA, USA, 2008. [Google Scholar]
  33. Tan, X.; Shao, D.; Liu, H.; Yang, F.; Xiao, C.; Yang, H. Effects of alternate wetting and drying irrigation on percolation and nitrogen leaching in paddy fields. Paddy Water Environ. 2013, 11, 381–395. [Google Scholar] [CrossRef]
  34. Yang, C.; Wu, J.; Li, P.; Wang, Y.; Yang, N. Evaluation of Soil-Water Characteristic Curves for Different Textural Soils Using Fractal Analysis. Water 2023, 15, 772. [Google Scholar] [CrossRef]
  35. Dou, X.; Shi, H.; Li, R.; Miao, Q.; Yan, J.; Tian, F.; Wang, B. Simulation and evaluation of soil water and salt transport under controlled subsurface drainage using HYDRUS-2D model. Agric. Water Manag. 2022, 273, 107899. [Google Scholar] [CrossRef]
  36. Jiang, L.; Wu, H.; Alfieri, L.; Li, X.; Kimball, J.S.; Chen, X. Review of Regionalization and Remote Sensing Based Method for Hydrological Model Parameters Calibration in Ungauged Basins. Acta Sci. Nat. Univ. Pekin. 2020, 56, 1152–1164. [Google Scholar] [CrossRef]
  37. Eyo, E.U.; Ng’ambi, S.; Abbey, S.J. An overview of soil–water characteristic curves of stabilised soils and their influential factors. J. King Saud Univ.-Eng. Sci. 2022, 34, 31–45. [Google Scholar] [CrossRef]
  38. Ju, X.; Gao, L.; She, D.; Jia, Y.; Pang, Z.; Wang, Y. Impacts of the soil pore structure on infiltration characteristics at the profile scale in the red soil region. Soil Tillage Res. 2024, 236, 105922. [Google Scholar] [CrossRef]
  39. Zong, R.; Wang, Z.; Li, W.; Li, H.; Ayantobo, O.O. Effects of practicing long-term mulched drip irrigation on soil quality in Northwest China. Sci. Total Environ. 2023, 878, 163247. [Google Scholar] [CrossRef] [PubMed]
  40. Huang, T.; Wang, Z.; Guo, L.; Li, H.; Tan, M.; Zou, J.; Zong, R.; Dhital, Y.P. The Impact of Long-Term Mulched Drip Irrigation on Soil Particle Composition and Salinity in Arid Northwest China. Agronomy 2024, 14, 599. [Google Scholar] [CrossRef]
  41. Dai, J.; Dong, H. Intensive cotton farming technologies in China: Achievements, challenges and countermeasures. Field Crops Res. 2014, 155, 99–110. [Google Scholar] [CrossRef]
  42. Bao, W.; Bai, Y.; Zhao, Y.; Zhang, X.; Wang, Y.; Zhong, Y. Effect of Biochar on Soil Water Infiltration and Water Holding Capacity in the Arid Regions of Middle Ningxia. Chin. J. Soil Sci. 2018, 49, 1326–1332. [Google Scholar]
Figure 1. Schematic diagram of capillary water rising soil column test. The thickness of soil layer is 15 cm, the thickness of filter layer is 15 cm, and the height of the soil column is 170 cm. The depth of groundwater is the distance from the water table to the surface of the soil, with a height of 150 cm.
Agronomy 14 01300 g001
Figure 2. Soil water characteristic curve of soils with different MDI application years (0 a–24 a). Different symbols represent the volumetric water content at a specific pressure obtained using the pressure film instrument. Color lines represent the simulated value of the SWCC curve obtained using RETC6.02 software. The error bars represent the standard deviation (n = 3).
Agronomy 14 01300 g002
Figure 3. Capillary water rising height with time variation in different MDI application years (0 a–24 a). Color lines represent the change in capillary water rising height over time fitted with an exponential function. The error bars represent the standard deviation (n = 3).
Agronomy 14 01300 g003
Figure 4. Capillary water recharge with time variation in different MDI application years (0 a–24 a). Color lines represent the change of capillary water recharge over time fitted with an exponential function. The error bars represent the standard deviation (n = 3).
Agronomy 14 01300 g004
Figure 5. Rising rate of capillary water with time variation in different MDI application years (0 a–24 a). Different symbols represent the average rate of wetting front migration over time.
Agronomy 14 01300 g005
Figure 6. Fitting results of soil profile moisture content distribution. The different symbols represent the average actual moisture content of the soil, and the lines represent the simulation results of Hydrus. The error bars represent the standard deviation (n = 3).
Agronomy 14 01300 g006
Table 1. Physicochemical properties of soil at different MDI application year.
Application
Years
Soil Bulk DensitypHOrganic MatterTotal CarbonSoil Salt ContentSoil Fraction/%
a(g cm³) (g kg−1)(g kg−1)(g kg−1)SandSiltClay
0.02–2 mm0.002–0.02 mm<0.002 mm
01.70 ± 0.088.90 ± 0.0110.21 ± 2.015.22 ± 0.687.72 ± 0.1025.75 ± 2.9647.80 ± 3.6326.50 ± 1.33
101.46 ± 0.048.70 ± 0.0911.25 ± 1.038.51 ± 0.617.89 ± 0.7419.25 ± 2.8548.36 ± 3.9932.39 ± 1.21
141.45 ± 0.038.61 ± 0.0513.82 ± 1.2410.32 ± 0.606.83 ± 1.0622.23 ± 2.9842.36 ± 4.2335.41 ± 1.46
181.48 ± 0.058.54 ± 0.0814.56 ± 1.2512.85 ± 1.296.60 ± 0.4822.37 ± 3.1056.37 ± 4.1021.26 ± 0.99
201.51 ± 0.038.36 ± 0.0915.41 ± 2.5911.16 ± 1.311.53 ± 1.1320.47 ± 3.4361.24 ± 4.9818.19 ± 1.04
241.60 ± 0.078.33 ± 0.0514.41 ± 2.5913.11 ± 2.172.72 ± 1.1921.26 ± 3.5042.97 ± 4.3535.87 ± 1.18
Note: Error bars are standard errors of means (n = 3).
Table 2. Soil hydraulic parameters of soils with different MDI application years.
Application Years
(a)
θr
(cm3 cm−3)
θs
(cm3 cm−3)
α
n
KS
(cm min−1)
00.0214 ± 0.012 ab0.350 ± 0.019 a0.0106 ± 0.001 b1.392 ± 0.002 c0.00176 ± 0.001 a
100.0251 ± 0.008 ab0.428 ± 0.008 b0.0089 ± 0.002 a1.488 ± 0.004 b0.00475 ± 0.000 b
140.0278 ± 0.010 a0.434 ± 0.013 b0.0106 ± 0.005 b1.441 ± 0.002 bc0.00490 ± 0.003 b
180.0219 ± 0.007 ab0.390 ± 0.008 ab 0.0057 ± 0.002 c1.602 ± 0.005 a0.00870 ± 0.006 c
200.0177 ± 0.002 b0.383 ± 0.015 ab0.0059 ± 0.001 c1.619 ± 0.003 a0.00755 ± 0.002 c
240.0237 ± 0.007 a0.395 ± 0.007 ab0.0113 ± 0.001 ab1.382 ± 0.001 c0.00219 ± 0.004 a
Note: Different letters with a column represent statistically significant differences between different MDI application years (p 0.05). The error bars represent the standard deviation (n = 3).
Table 3. Rising rate of capillary water for different stages and different MDI application years.
Application Years
a
i 1
(cm min−1)
i c
(cm min−1)
i ¯
(cm min−1)
00.0243 ± 0.0408 b0.0016 ± 0.0001 a0.0224 ± 0.0395 b
100.0453 ± 0.0678 ab0.0029 ± 0.0007 b0.0333 ± 0.0604 ab
140.0466 ± 0.0699 ab0.0032 ± 0.0006 c0.0362 ± 0.0636 ab
180.0773 ± 0.1117 a0.0062 ± 0.0009 d0.0618 ± 0.1029 a
200.0721 ± 0.1054 a0.0056 ± 0.0009 e0.0576 ± 0.0970 a
240.0311 ± 0.0507 b0.0017 ± 0.0003 a0.0247 ± 0.0464 b
Note: i 1 represents the initial rising velocity of capillary water, i c represents the stable rising rate of capillary water, and i ¯ represents the average rising rate of capillary water. Different lowercase letters in the same column indicate that there is a statistically significant difference (p < 0.05) in the field of drip-irrigated cotton with different MDI application years (n = 3).
Table 4. The fitting effect between the measured value of capillary water and the HYDRUS simulation value.
MDI Application YearsRising HeightRecharge
R2RMSEMAER2RMSEMAEPBIAS
0 a0.991 ± 0.0191.206 ± 0.2971.016 ± 0.26750.998 ± 0.0140.345 ± 0.1550.172 ± 0.145−2.680 ± 0.465
10 a0.999 ± 0.0091.884 ± 0.2911.578 ± 0.2440.991 ± 0.0110.355 ± 0.1640.371 ± 0.178−2.173 ± 0.104
14 a0.996 ± 0.0121.584 ± 0.2351.331 ± 0.1660.994 ± 0.010.396 ± 0.1060.352 ± 0.0911.512 ± 0.115
18 a0.995 ± 0.0081.650 ± 0.1991.369 ± 0.1460.996 ± 0.0020.502 ± 0.0990.409 ± 0.0790.912 ± 0.065
20 a0.998 ± 0.0131.541 ± 0.1581.223 ± 0.1330.995 ± 0.0030.746 ± 0.1840.659 ± 0.1802.737 ± 0.150
24 a0.995 ± 0.0181.046 ± 0.3050.895 ± 0.2990.993 ± 0.0120.258 ± 0.0890.231 ± 0.0850.236 ± 0.082
Note: Analysis of the fitting effect between the three measured data and the simulated data of HYDRUS software (version 4) about capillary water rising height and recharge. The error bars represent the standard deviation (n = 3).
Table 5. Comparison of fitting constants and HYDRUS fitting between capillary water recharge and recharge and capillary water height.
MDI Application YearsLiner FittingHYDRUS FittingRelative Error
a K 1 R 2 K 2 R 2 %
04.5971 ± 0.00170.96614.67940.9957−1.7694 ± 0.0679
104.1533 ± 0.00240.98824.24120.998−2.0875 ± 0.0675
143.2310 ± 0.00120.97343.18360.9971.4899 ± 0.0437
183.8151 ± 0.00160.9973.77460.9961.0686 ± 0.0465
203.8871 ± 0.00100.9963.85650.9940.7922 ± 0.0449
244.1431 ± 0.00140.9474.16610.997−0.5531 ± 0.0304
K1: calculation of three repeated results based on soil column experiments; and K2: calculation based on Hydrus software (version 4) simulation results.
Table 6. Evaluation of the fitting effect of soil moisture content.
ParameterApplication Years/(a)
01014182024
MAE0.01090.01060.00390.00730.00160.0071
RMSE0.01250.01310.06110.00950.00240.0211
t-test (p value)0.7810.8560.9800.8600.9900.764
Disclaimer/Publisher’s Note: The statements, opinions and data contained in all publications are solely those of the individual author(s) and contributor(s) and not of MDPI and/or the editor(s). MDPI and/or the editor(s) disclaim responsibility for any injury to people or property resulting from any ideas, methods, instructions or products referred to in the content.

