Article

The Spatial Coupling Mechanism of Soil Moisture and Salinity after the Erosive Rainfall in the Loess Hilly Region

1
College of Geology and Environment, Xi’an University of Science and Technology, Xi’an 710054, China
2
Institute of Water Saving Agriculture in Arid Areas of China, Northwest A&F University, Yangling 712100, China
3
State Key Laboratory of Soil Erosion and Dryland Farming on the Loess Plateau, College of Soil and Water Conservation Science and Engineering (Institute of Soil and Water Conservation), Northwest A&F University, Yangling 712100, China
4
State Key Laboratory of Soil Erosion and Dryland Farming on the Loess Plateau, Institute of Soil and Water Conservation, Chinese Academy of Sciences and Ministry of Water Resources, Xianyang 712100, China
*
Author to whom correspondence should be addressed.
Agronomy 2024, 14(6), 1138; https://doi.org/10.3390/agronomy14061138
Submission received: 2 April 2024 / Revised: 9 May 2024 / Accepted: 17 May 2024 / Published: 27 May 2024

Abstract

:
Investigating the spatial distribution characteristics of the interaction between soil salinity and moisture is crucial in revealing moisture–salinity interaction in semi-arid farmland. The sampling of soil was performed on the second (S1), fifth (S2), eighth (S3), eleventh (S4), and fourteenth (S5) days after the erosive rainfall. The multifractal method was used to analyze spatial distribution parameters of soil moisture and salinity under the different stages. The findings showed that the soil moisture content decreased from 22.44% to 12.73%, while the salinity increased from 0.71 to 1.18 g kg–1 after the rainfall. As the amount of moisture in the soil decreased, the variability in the distribution of moisture initially increased from S1 to S3 and then decreased, while the salinity content also decreased. The spatial distribution of soil moisture and salinity content showed a strong correlation at S3 to S4 (with the relative water content of soil ranging from 0.52 to 0.75), indicating a significant coupling effect in these stages. However, the distribution of soil salinity was not uniform under high moisture content conditions (S1 to S2), as it was leached unevenly by rainfall, and under low moisture content conditions (S5), it precipitated, resulting in a low correlation between the spatial distribution of soil moisture and salinity content. This research has provided insight into the coupling dynamics of soil moisture and salinity content, revealing the mechanisms governing their spatial distribution in dryland agricultural regions.

1. Introduction

Soil salinization is a significant factor contributing to land desertification and degradation on a global scale [1]. This issue not only leads to the depletion of resources and substantial losses in agricultural output but also presents a threat to ecological systems [2]. The impact of soil salinization extends to human survival, social stability, agricultural productivity, natural resources, and the pursuit of environmentally sustainable development [3,4,5]. The total area of saline–alkali land worldwide is approximately 9.3 × 10⁸ ha, and the area of secondary soil salinization in arid and semi-arid areas is approximately 8 × 10⁷ ha [6,7]. Soil salinization results from the movement of soil moisture and salinity. Over time, soil moisture and salinity show varying spatial distribution patterns [8]. Understanding the spatial distribution between soil moisture and salinity is crucial for revealing moisture–salinity interactions in the saline–alkali farmland [9].
Soil moisture plays a crucial role in the transport of salinity, as the leaching and accumulation of soil salinity depend on the presence of moisture [10,11]. In arid and saline–alkali environments, the intense evaporation process can cause salinity to precipitate out of the soil, ultimately clogging the soil pores and significantly impeding the movement of moisture within the soil [12]. Walter et al. [13] showed that a close correlation is observed between soil moisture and salinity. The soil salinity distribution between the top and subsoil reflected the leaching of dissolved salinity by soil moisture and the capillary rise of dissolved soil salinity by increasing evaporation. Cao et al. [14] reported that soil moisture and salinity both revealed “island” distribution, and they presented a strong or moderate spatial dependency in a semi-arid saline environment. These results indicated that spatial distributions of soil moisture and salinity may be affected by their coupling. Therefore, we assumed that the spatial variability between soil moisture and salinity was correlative. In addition, Yuan et al. [15] and Dong et al. [16] also showed that soil salinity accumulation exhibited differences in soil layers under varying irrigation amounts. Ren et al. [8] reported that soil salinity distribution was dominated by quantities and the uniformity of field irrigation at the field scale. These results implied that the spatial distribution of soil salinity may be affected by different soil moisture content levels. Therefore, it is necessary to obtain the spatial distribution of moisture and salinity at the different moisture content levels.
The spatial variability in variables has always been a primary focus for scholars, and the topic can be explained by various methods [17,18,19]. Teng et al. [20] and Wang et al. [21] showed that the spatial distribution characteristics of soil organic carbon were described thoroughly by the semi-variance function and Kriging method. Vidana Gamage et al. [22] also achieved useful results in their study of spatial variation in variables using geostatistics. These methods showed good results in spatial variability analysis. The multifractal method is a powerful method used to characterize variability across scales and is widely used in determining spatial patterns and variability in soil properties [19,23]. Qi et al. [24] used the multifractal method to study soil particle size distribution and showed that the differences between different vegetation types were quantitatively characterized by multifractal parameters. Jing et al. [25] also used the multifractal method to multidimensionally characterize the spatial variability in soil physical properties under different treatments. The multifractal parameters can quantify the spatial variability in the variables [26]. In addition, the joint multifractal method has been applied in previous studies to explore the correlations among several paired soil properties at different scales [18]. Bertol et al. [26] reported a joint multifractal analysis that showed that the relationships between soil and moisture losses were scale-dependent across the studied temporal domain and that their respective scaling indices had various degrees of association under different tillage treatments. Therefore, we suggest that the multifractal and joint multifractal method characterizes the spatial variability in soil moisture and salinity and their correlations in different soil layers.
Currently, there is a lack of research focusing on the spatial variability correlations between soil moisture and salinity. Furthermore, the use of multifractal and joint multifractal methods in studying the spatial variability in soil moisture and salinity is limited. Therefore, our experiment aims to (1) analyze the spatial distributions of soil moisture and salinity at various moisture content levels and (2) assess the spatial variability correlation between soil moisture and salinity at different moisture content levels.

2. Materials and Methods

2.1. Information of Study Area

The experimental site is located in the typical loess hilly region of China (40°14′11″ N–42°27′42″ N, 75°33′16″ E–80°59′7″ E), which has a semi-arid continental monsoon climate [17,27]. Some climate information is shown in Table 1. The experimental plot was planted with alfalfa (Medicago sativa Linn), and the soil’s physical properties are summarized in Table 2. The soils at the experimental site were suffering from slight salinization [28].

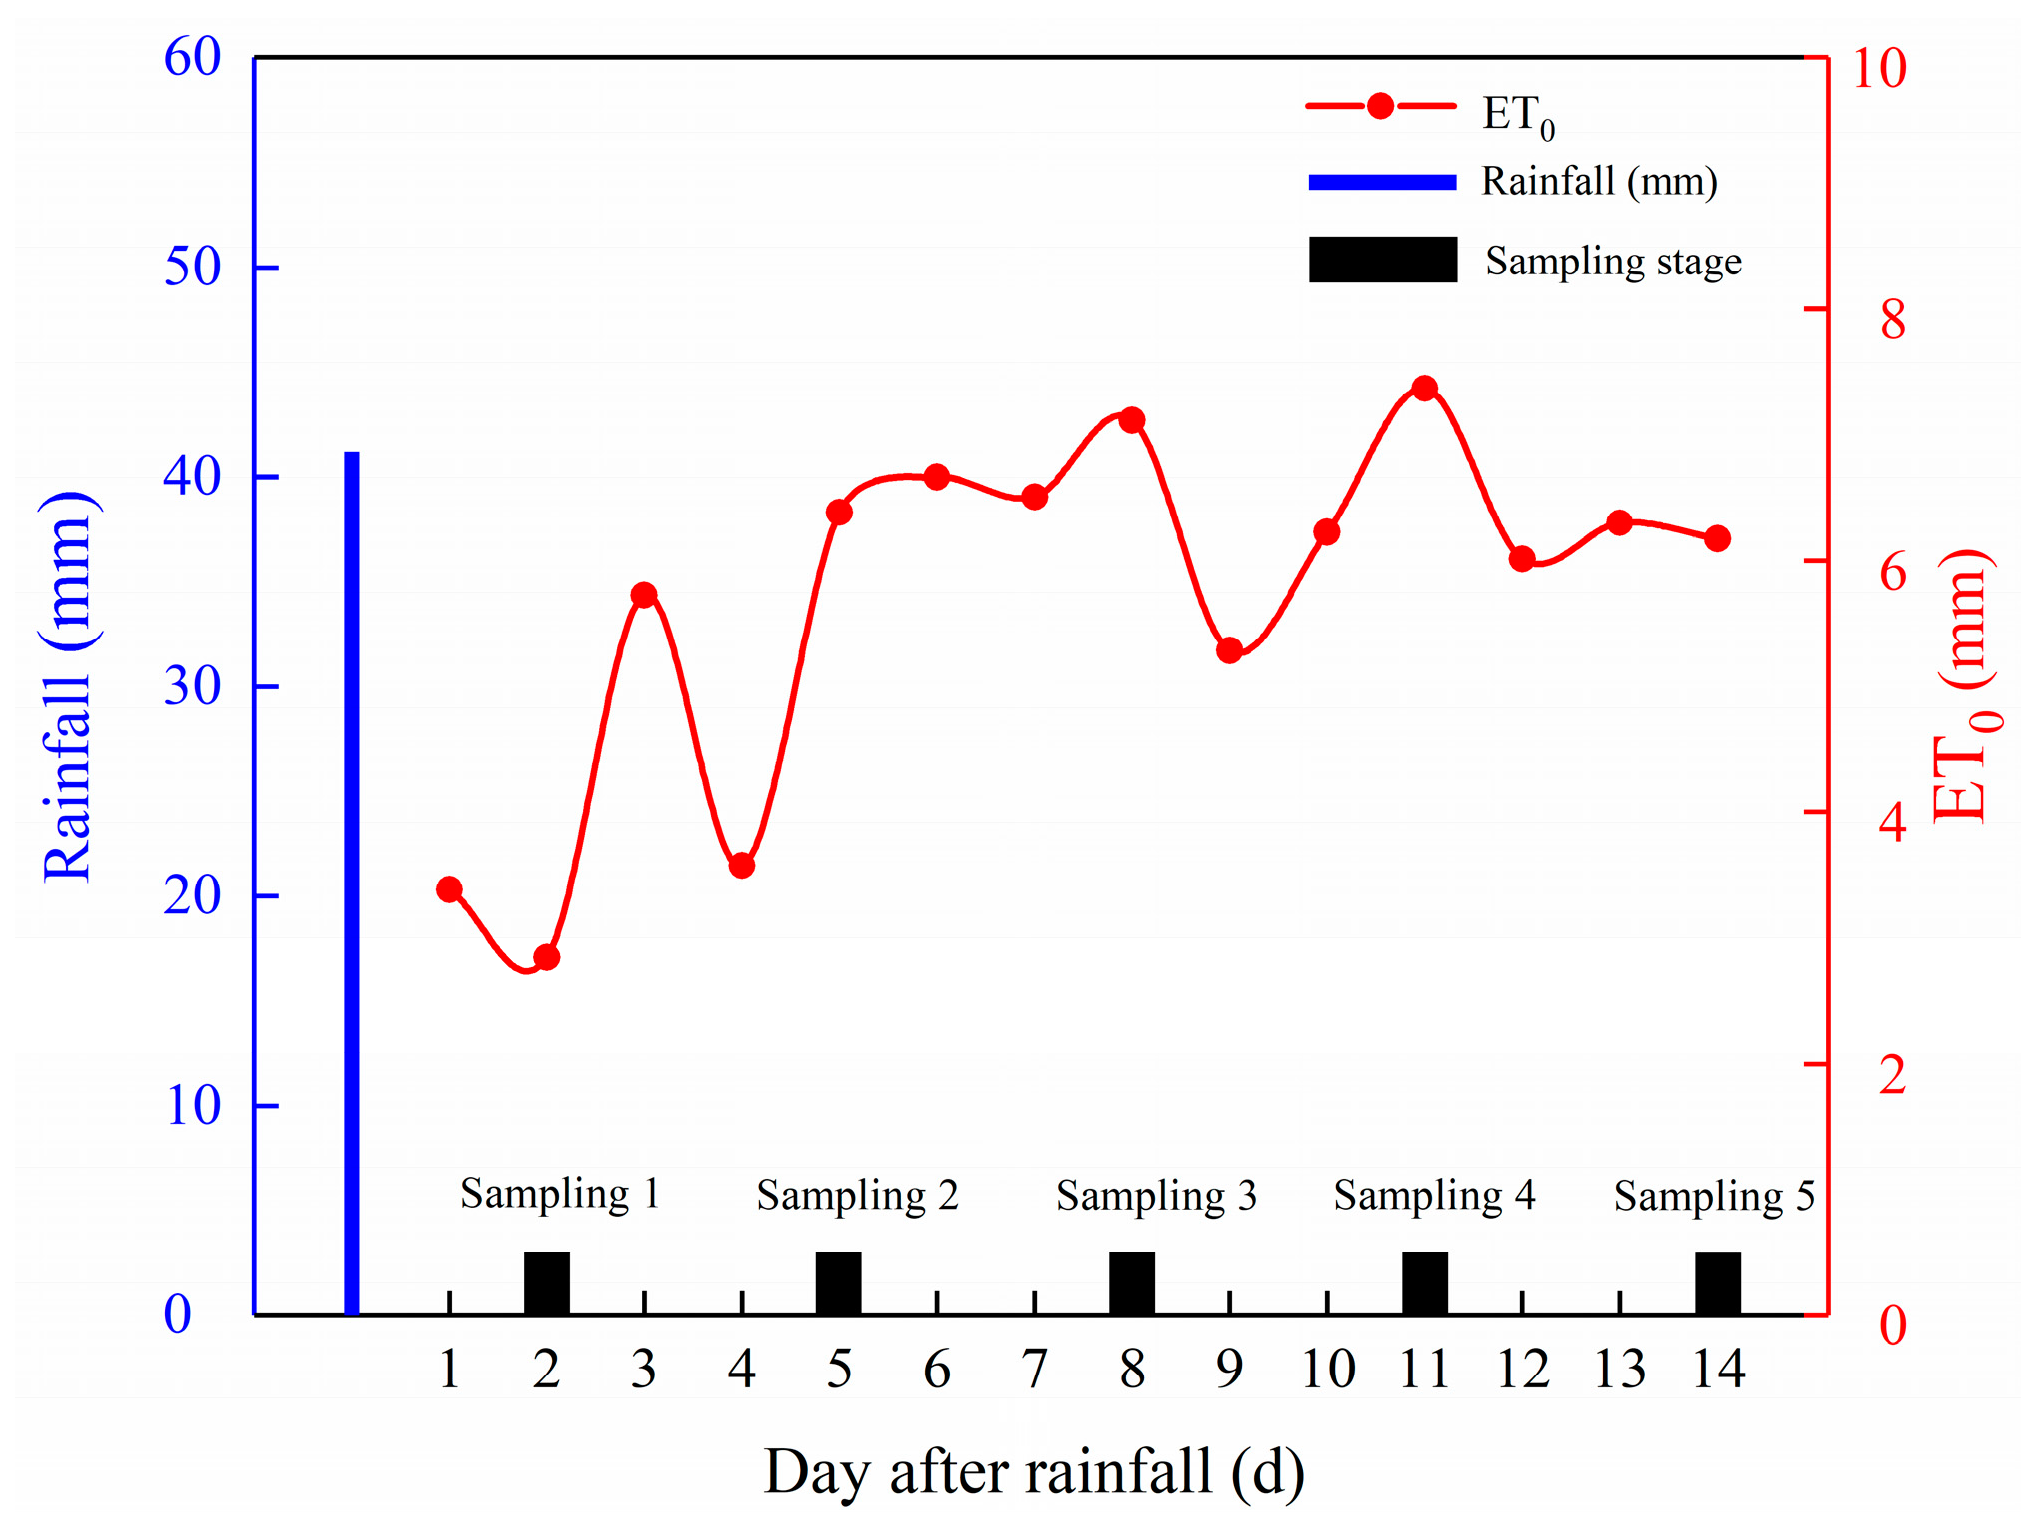
2.2. Design of Experiment and Samples Collection

The spatial distributions of moisture and salinity in soil were determined at different moisture content levels under the natural soil conditions. The wide range of soil moisture content facilitates the analysis of spatial distribution characteristics of soil moisture and salinity under different moisture conditions. In addition, experimental sampling periods should be kept as short as possible to mitigate the impact of factors such as rainfall during the sampling process. For this purpose, we designed soil samples collected at different stages after a heavy rainfall event during high evaporation periods. Therefore, a rainfall event with a total precipitation of 41.2 mm on 5 June 2019 was selected by an automatic meteorological station (Figure 1). The entire sampling period had high evaporation and without precipitation. Reference crop evapotranspiration (ET0) was calculated using the Penma–Monteith method (FAO-56) [29].
A square plot (3, 600 m2) was evenly divided into 16 grids (grid size, 15 m × 15 m) (Figure 2) in this study. For each grid, 6 samples were randomly obtained for replication. Soil samples were collected using an auger at depths of 0–20 and 20–40 cm. Soil samples were collected on the second, fifth, eighth, eleventh, and fourteenth day after the rainfall event; they were defined as sampling 1 (S1), sampling 2 (S2), sampling 3 (S3), sampling 4 (S4), and sampling 5 (S5) stages, respectively. The distribution range of the relative moisture content of soil at different sampling stages is shown in Figure 3.

2.3. Sample Measurement

Soil moisture content was determined using the drying method [30]. Soil soluble salinity content was measured by the weight-based method [31]. The steps are as follows: (1) Soil samples were air-dried and ground through a 2 mm sieve. (2) A certain amount of soil sample (M1) was taken and dissolved thoroughly with a soil-to-moisture ratio of 1:5. An amount of 20–50 mL of soil leaching solution was sucked out and placed in a 100 mL known drying mass ceramic evaporating dish. It was then steamed dry in a moisture bath. (3) A dropper was used to add 150 g L–1 H2O2 around the dish to moisten the residue; it was then left to steam dry and treated with H2O2 multiple times until the organic matter was completely oxidized. (4) At this time, all the dry residue was white. It was dried in a 105–110 °C oven until it reached a constant weight. Then, it was taken out and cooled, and the mass (M2) was recorded. (5) Soil soluble salinity content (g kg−1) = M1/M2 ∗ 1000.
The soil electric conductivity (EC) was determined using an EC meter (TP320, Beijing Shidai Xinwei Measurement and Control Equipment Co., Ltd., Beijing, China). The steps are as follows, as introduced in Bao. [31]. The relationship between the soil soluble salinity and EC was shown in Ke et al. [10], and the fitted equation between the soil soluble salinity (g kg–1) and EC (μs m–1) is as follows: soil salinity content = 0.0042 ∗ EC − 0.1032 (n = 40, p < 0.01).
Soil particle size was employed for laser diffraction analysis (Mastersizer 3000, Malvern Company, Malvern, UK). BD was sampled by ring knife and determined by oven-drying cores at 105–110 °C. Ks was measured using the constant hydraulic head method. These methods are referred to by Li and Shao [30].

2.4. The Fractal Methods

2.4.1. The Multifractal Methods

Spatial distribution characteristics of moisture and salinity in soil are characterized by multifractal methods. To compute the generalized dimension Dq, a section of the space with soil moisture and salinity was covered by a square grid of size ε. The study considered four grid sizes (15, 20, 30, and 60 m) due to the scale of sampled plots being 60 m × 60 m and each sampling point being 15 m × 15 m. The total number of grids (N (ε)) in the plot varied, with values of 16, 9, 4, and 1 for grid sizes of 15, 20, 30, and 60 m, respectively (Figure 2) [25]. The values of soil moisture and salinity in each grid were the mean values of all sampling points.
The following steps were defined to conduct the multifractal analysis. First, the probability mass function was calculated as follows:
p i   ε = Z i i = 1 N ( ε ) Z i
where Z i is the value of a given size ε and N (ε) is the number of grids.
Second, the Dq (generalized fractal dimension) is defined as follows:
D q = l i m ε 0 1 q 1 × lg ( i = 1 N ( ε ) p i ( ε ) q ) lg ε         q 1 ,         a n d
D 1 = l i m ε 0   ×   i = 1 N ( ε ) p i ε lg p i ε lg ε         q = 1 ,
where q represents integers in [−10, 10]. D q was determined by the least square method at different grid sizes. D1 is the information dimension [25,32]. ΔD = D−10 − D10, which indicates the degree of spatial variability in local distribution, and the lower the ΔD, the lower the variability [33].

2.4.2. Joint Multifractal Method

The joint multifractal method is used to analyze spatial distribution correlations between soil moisture and salinity in different sampling stages. The calculation steps are as follows.
First, the normalized joint partition function, μ i = (q1, q2, ε) [23],
μ i = ( q 1 , q 2 , ε ) = p i 1 ( ε ) q 1 p i 2 ( ε ) q 2 i = 1 N ( ε ) p i 1 ( ε ) q 1 p i 2 ( ε ) q 2 ,
where q1 and q2 represent the moment orders of soil moisture and salinity, respectively. p i 1 ( ε ) and p i 2 ( ε ) represent the normalized probability mass function of moisture and salinity in the soil, respectively [18].
Second, the Hólder exponents are calculated,
α 1 q 1 ,   q 2 = - i = 1 N ( ε ) [ μ i q 1 ,   q 2 ,   ε   lg p i 1 ( ε ) ] lg   N ( ε ) ,   a n d
α 2 q 1 ,   q 2 = - i = 1 N ( ε ) [ μ i q 1 ,   q 2 ,   ε   lg p i 1 ( ε ) ] lg   N ( ε ) ,   a n d
where α 1 q 1 ,   q 2 and α 2 q 1 ,   q 2 are the Hólder exponents of moisture and salinity, respectively, and
f α 1 , α 2 = i = 1 N ( ε ) [ μ i q 1 ,   q 2 ,   ε   lg μ i q 1 ,   q 2 ,   ε ] lg   N ( ε ) ,
where dimension f1, α2) indicates a set in which α 1 q 1 ,   q 2 and α 2 q 1 ,   q 2 represent the mean local exponents of moisture and salinity, respectively. The image is composed of α 1 q 1 ,   q 2 , α 2 q 1 ,   q 2 , and f α 1 , α 2 , which is the joint multifractal spectrum [34,35].

2.5. Statistical Analysis

The mean values and standard deviation were calculated using Microsoft Excel. Analysis of variance was conducted on soil moisture and salinity levels at different sampling stages and soil layers using least significant difference tests at p < 0.05 (SPSS 23.0, Chicago, IL, USA). Graphs were generated using Origin Pro 9.0 (Electronic Arts Inc., Redwood, CA, USA).

3. Results

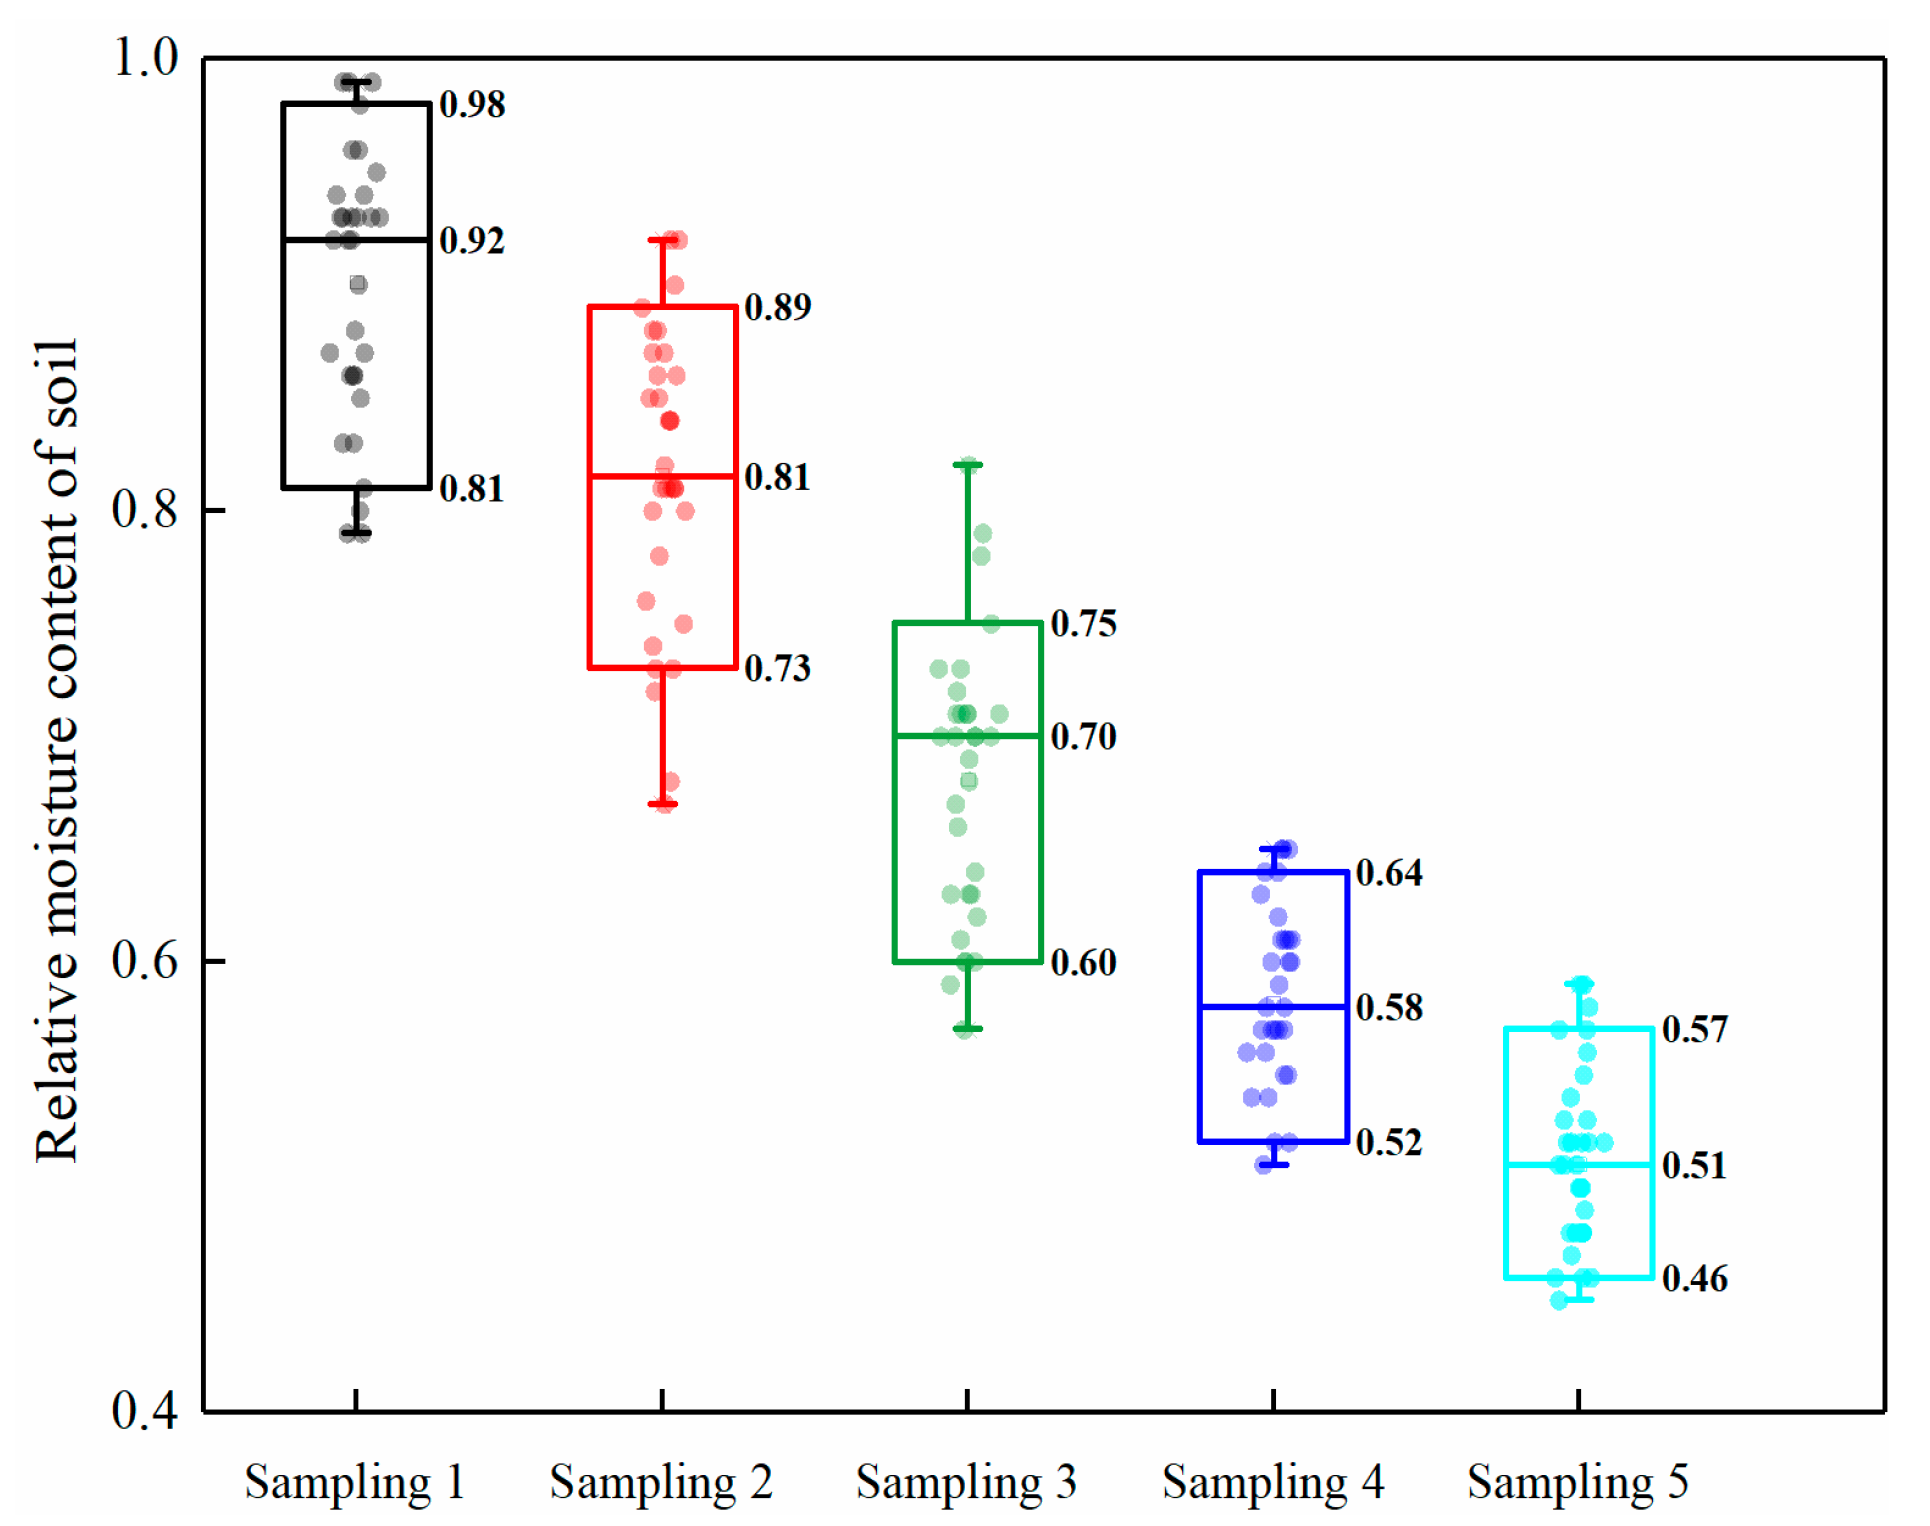
3.1. Soil Moisture and Salinity Conditions after the Rainstorm

The relative moisture content of the soil in S1, S2, S3, S4, and S5 ranged from 0.81 to 0.98, 0.73 to 0.89, 0.60 to 0.75, 0.52 to 0.64, and 0.46 to 0.57, respectively (Figure 2). Table 3 shows the mean values and significant differences in soil moisture and salinity at the different sampling stages after the rainfall. Over time, average soil moisture content decreased significantly due to high ET0 (Figure 1) in the following order: S1 (22.44%) > S2 (20.31%) > S3 (16.97%) > S4 (14.5%) > S5 (12.73%) in the entire layer (p < 0.05). In contrast, average soil salinity content increased significantly in the following order: S1 (0.71 g kg−1) < S2 (0.84 g kg−1) < S3 (0.96 g kg−1) < S4 (1.11 g kg−1) < S5 (1.18 g kg−1) in the entire layer (p < 0.05). Soil moisture in the 0–20 cm layer showed significant differences with respect to the 20–40 cm layer (p < 0.05), except for the S3. Soil salinity content in the 0–20 cm layer demonstrated significant differences with respect to the 20–40 cm layer under S2–S5 (p < 0.05).

3.2. Spatial Variability in the Soil Moisture and Salinity

Dq values decreased with increasing q values, which indicated the variables with multifractal characteristics [36]. Generalized dimension spectra of soil moisture and salinity at different sampling stages are shown in Figure 4 and Figure 5. We found that soil moisture and salinity had multifractal characteristics at different sampling stages in the entire layer.
Table 4 shows the multifractal parameters of moisture and salinity at the different stages after the rainfall event. The mean D1 values of soil moisture in the entire layer were S1 (1.9982), S2 (1.9964), S3 (1.9963), S4 (1.9975), and S5 (1.9978), respectively, which indicated that spatial variability in soil moisture over a relatively large domain showed an increasing trend under S1–S3 and then a decreasing trend under S3–S5 with moisture content declines. The mean ΔD values of soil moisture in the entire layer were S1 (0.0360), S2 (0.0750), S3 (0.0720), S4 (0.0549), and S5 (0.0528), respectively, which indicated that spatial variability in soil moisture showed an increasing trend under S1–S2 and then a decreasing trend under S2–S5 with moisture content declines. The spatial variability in soil moisture over a relatively large domain and in a local distribution was lower in 0–20 cm than the 20–40 cm layer under S1–S2 and high under S3–S5.
The mean D1 values of soil salinity showed S1 (1.9885), S2 (1.9897), S3 (1.9918), S4 (1.9964) and S5 (1.9997), and mean ΔD values showed S1 (0.2202), S2 (0.1825), S3 (0.1493), S4 (0.0691) and S5 (0.0066) in the entire layer, which indicated that spatial variability in soil salinity over a relatively large domain and in a local distribution showed a decreasing trend with moisture content declines. Spatial variability in soil salinity over a relatively large domain and in a local distribution was lower in 0–20 cm than in the 20–40 cm layer in all sampling stages.

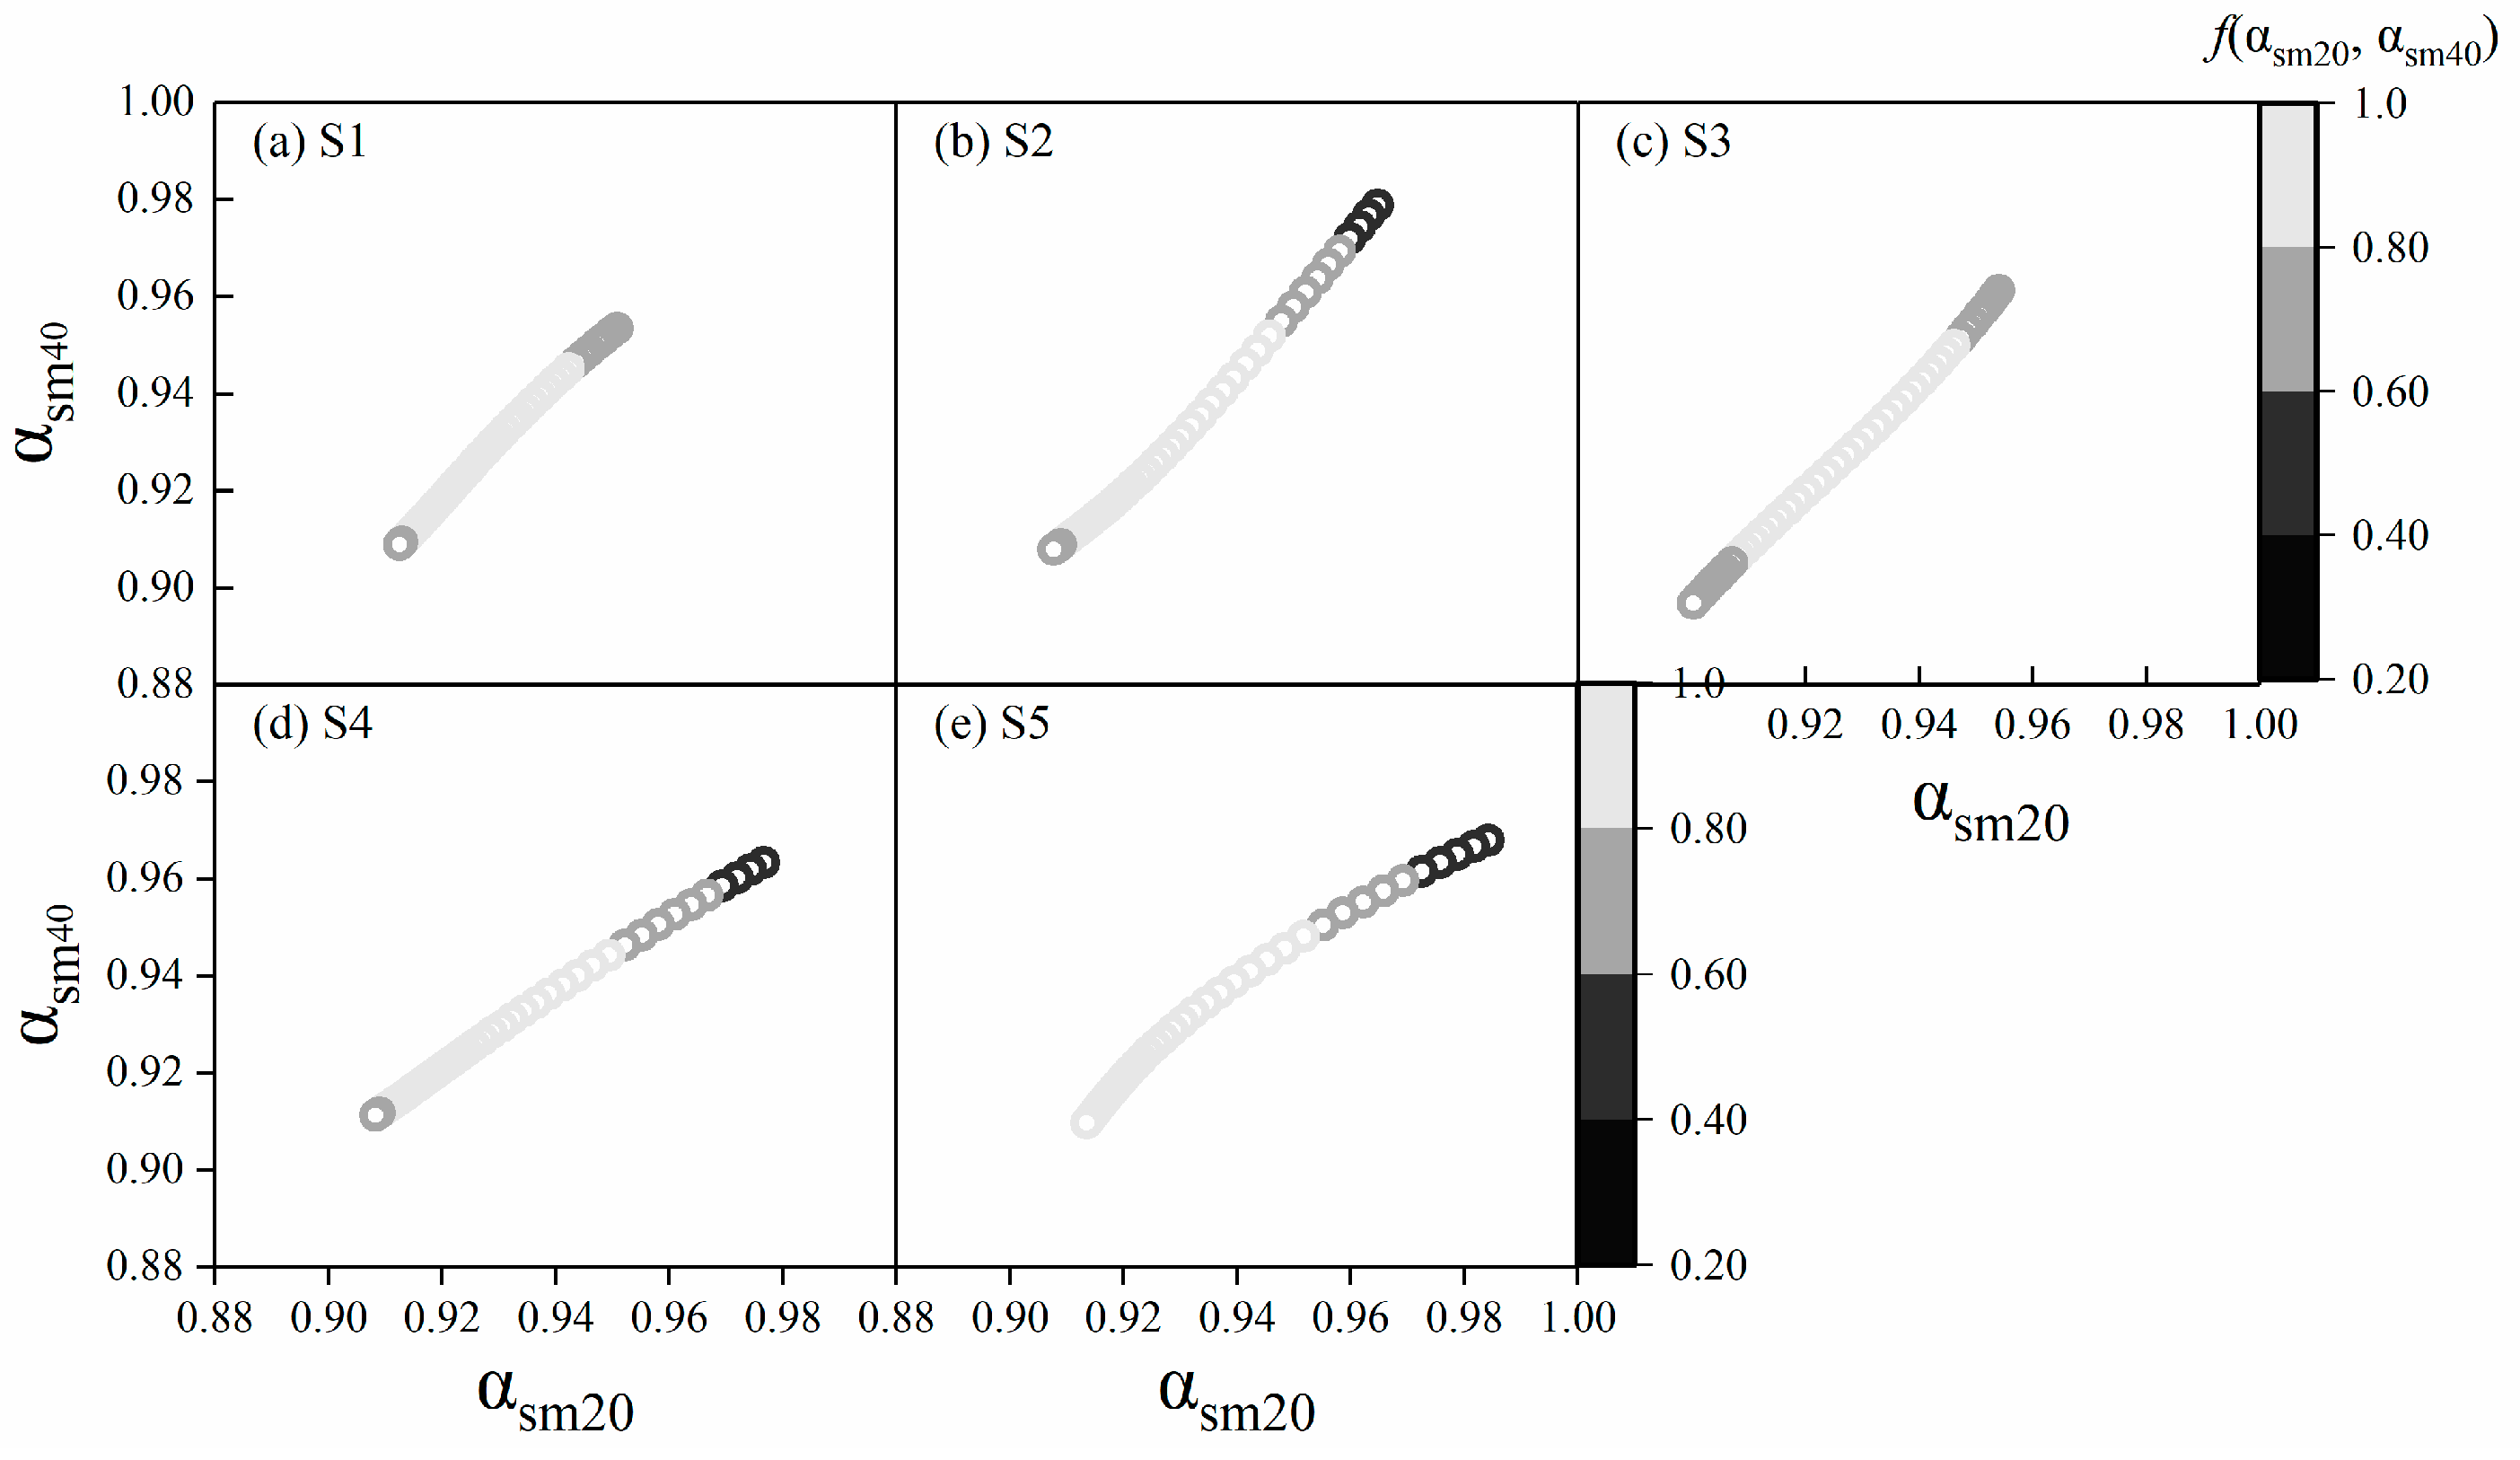
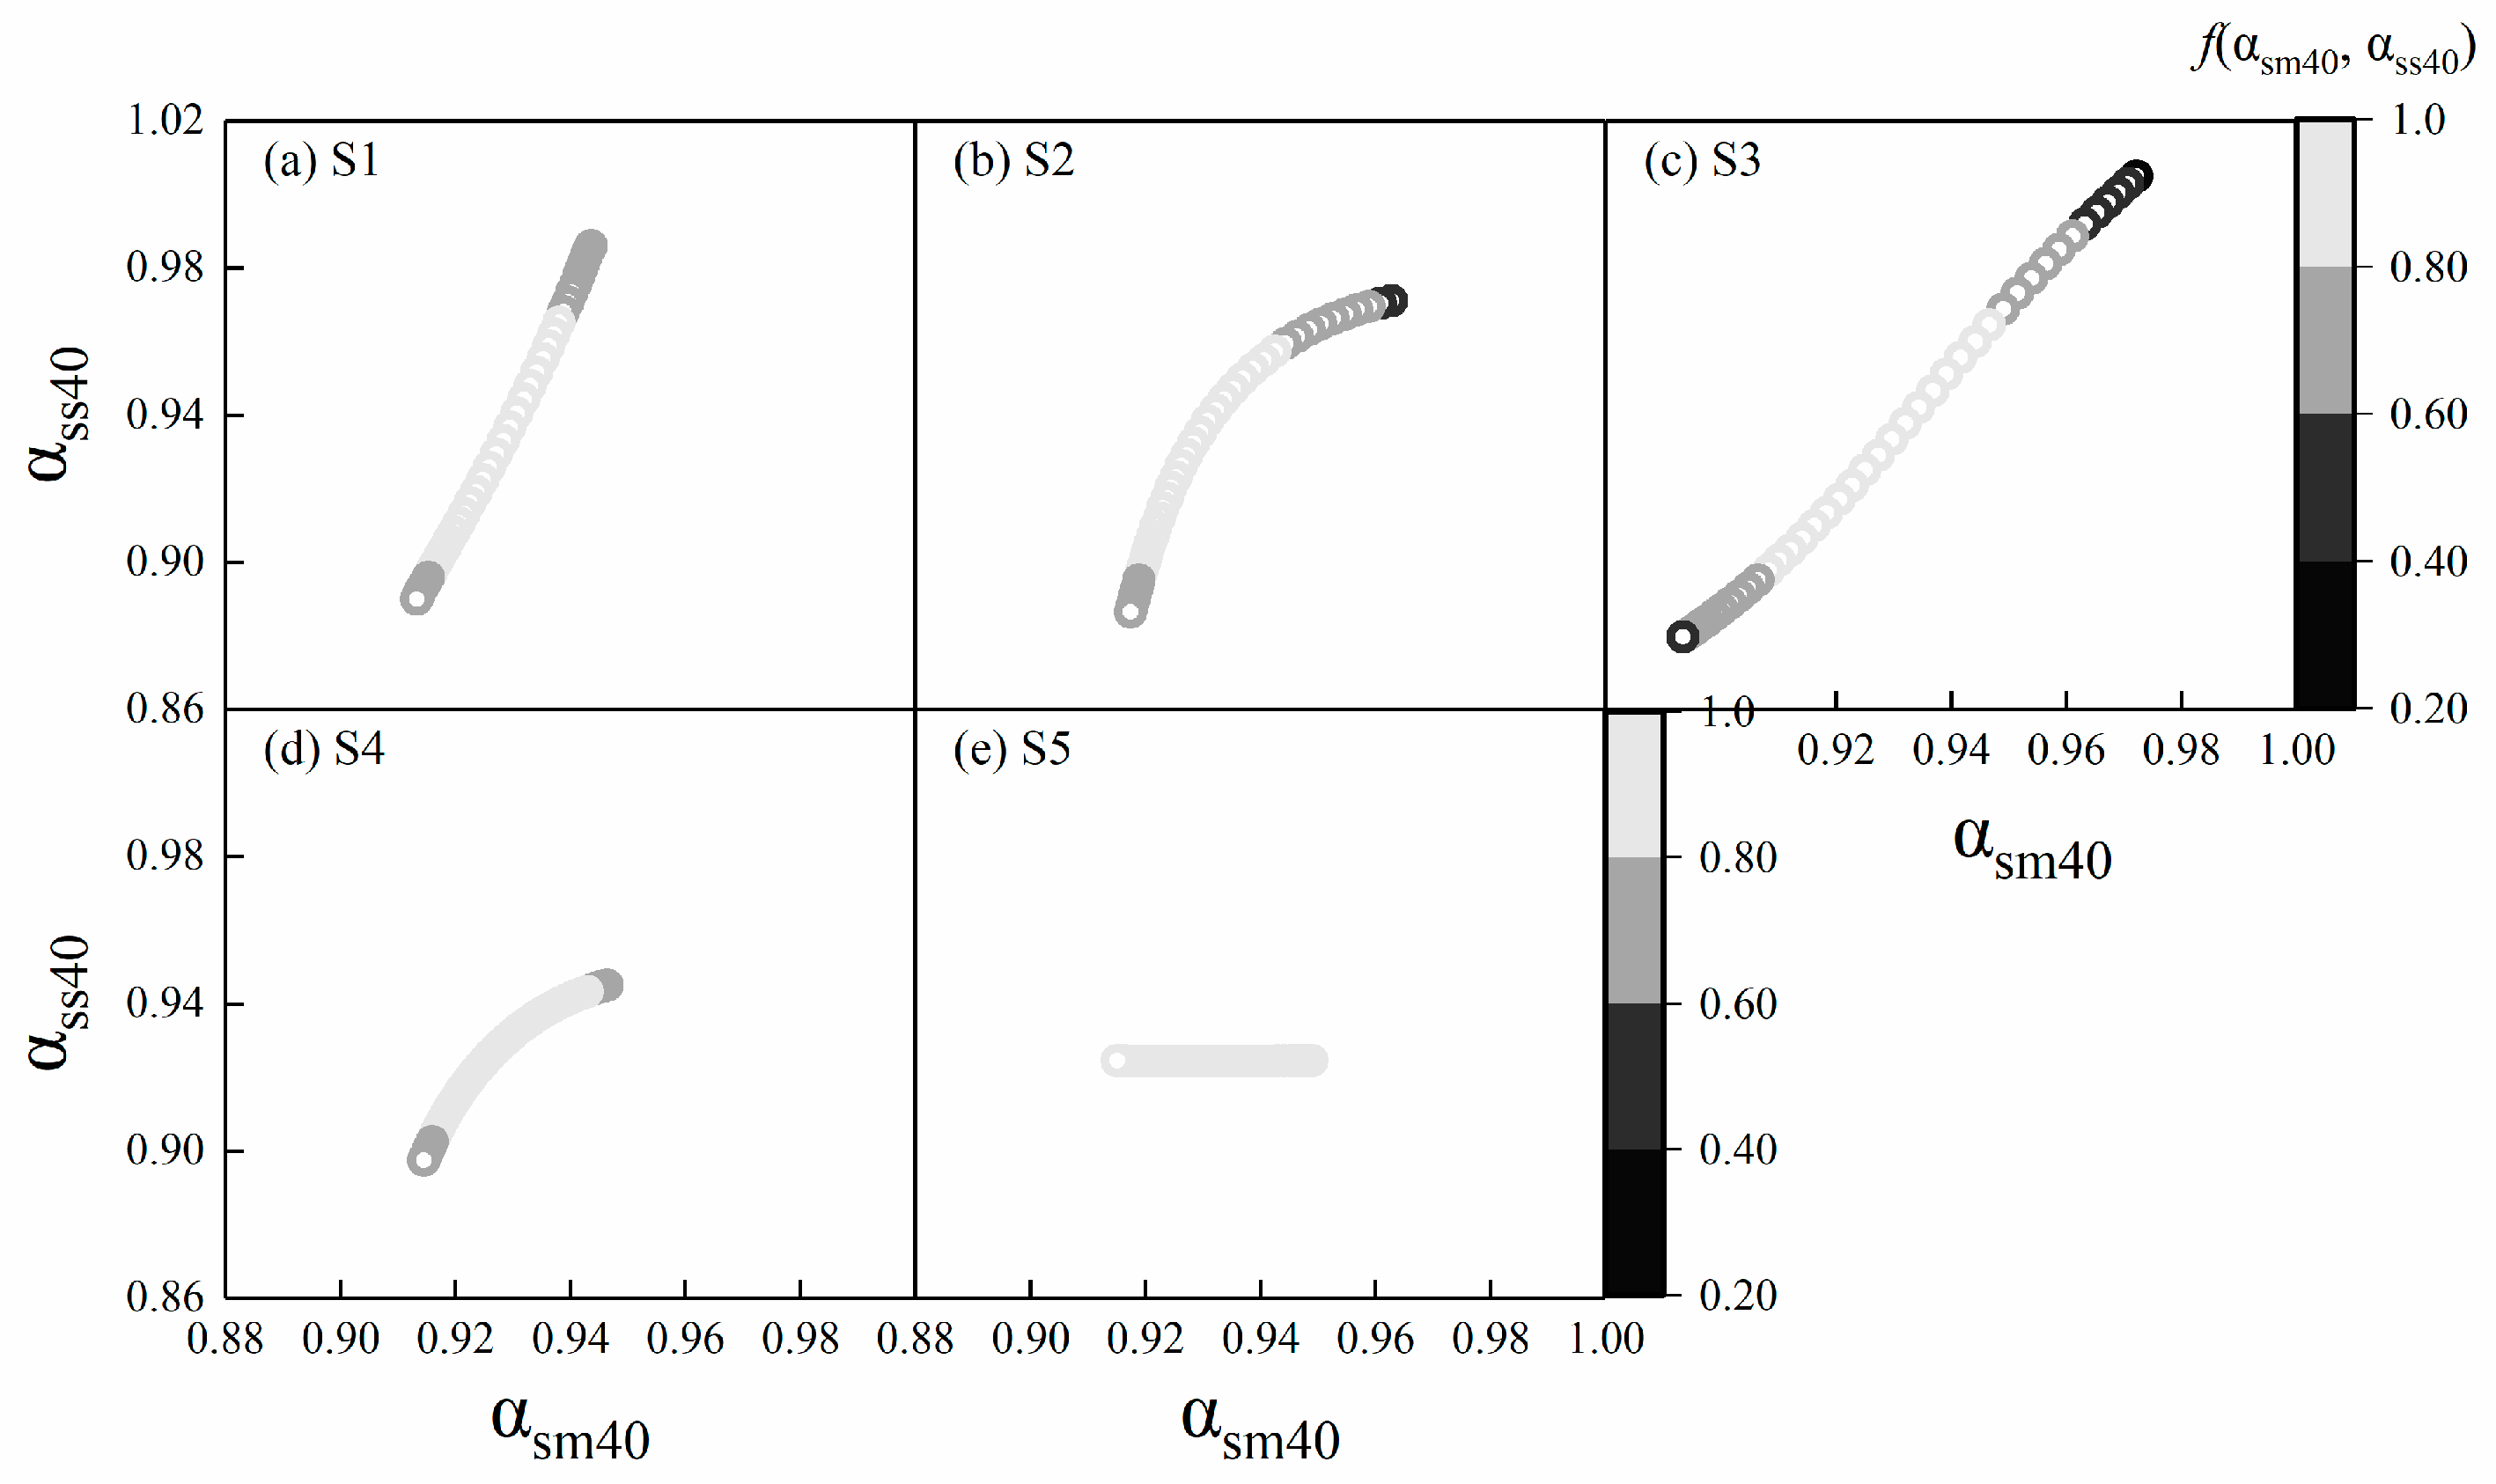
3.3. Spatial Distribution Correlations between Soil Moisture and Salinity

Gray-scale images of the joint multifractal spectrum between moisture and salinity at a depth of 0–20 cm are shown in Figure 6a–e. The αsm20 and αss20 values represent the singularity index of moisture and salinity at the depth of 0–20 cm, respectively. The fsm20, αss20) values represent a joint dimension distribution function of soil moisture and salinity at a depth of 0–20 cm. The gray-scale image was diagonal and concentrated in Figure 6c,d, which indicated that the spatial distribution of moisture and salinity had a relatively high correlation under S3–S4. However, the gray-scale image outlines in Figure 6a,b,e were not diagonal and tended to be scattered, which indicated that the spatial distribution correlation of soil moisture and salinity in the 0–20 cm layer was low under S1–S2 and S5.
Gray-scale images between moisture and salinity at the depth of 20–40 cm are shown in Figure 7a–e. The αsm40 and αss40 values represent the singularity index of moisture and salinity at the depth of 20–40 cm, respectively. The fsm40, αss40) values represent a joint dimension distribution function of moisture and salinity at a depth of 20–40 cm. The gray-scale images were diagonal and concentrated in Figure 7a–d, which indicated that the spatial distribution of moisture and salinity had a relatively high correlation under the S1–S4. However, the gray-scale image outlines in Figure 7e were not diagonal and tended to be scattered, which indicated that the spatial distribution correlation of moisture and salinity in the 20–40 cm layer was low under S5.

4. Discussion

The soil moisture and salinity contents fluctuate over time [37]. In this experiment, following a rainfall event, the average soil moisture content exhibited a significant decreasing trend over time (Table 3). Initially, the moisture content was highest at S1, as this soil layer received a substantial amount of rainfall but subsequently decreased due to high ET0 levels (Figure 1). Furthermore, the average soil salinity content showed a significant increase over time following the rainfall event (Table 3). Ke et al. [10] noted that soil salinity is initially leached after rainfall and then accumulates with continuous evapotranspiration. In our study, soil salinity leached before S1 and accumulated consistently from S1 to S5 throughout the entire layer (Table 3).
The spatial distribution of moisture and salinity in soil also varies with time [38,39]. Our findings indicate that as moisture content decreases, the variability in soil moisture distribution initially increases under S1–S3 and then decreases under S3–S5 throughout the layer (Table 4 and Figure 4). Following rainfall, capillary pores were saturated with moisture, resulting in high moisture content throughout the layer and low spatial variability under S1. Zhu and Lin [40] also showed that high soil moisture content resulted in low spatial variability. Soil moisture was consumed in large quantities during the strong evapotranspiration, and soil moisture demonstrated high spatial variability under S3 because of the variable moisture-holding capacity at different points. Along with further evapotranspiration, soil moisture remained at a low level, and soil moisture conservation at different points decreased gradually; thus, low spatial variability was shown under S5. Previous studies correlate with our results, whereby soil texture, capillary pores, organic matter, and aggregates affected soil moisture content and distribution, and their effects were relatively decreased as soil moisture was at a low level [41,42,43]. Thus, the low moisture content level also led to its low spatial variability. In addition, with moisture content declines, spatial variability in soil salinity showed a decreasing trend in the entire layer (Table 4 and Figure 5). The spatial variability in salinity was high under S1 due to uneven leaching caused by rainfall. Zhang et al. [44] demonstrated that differences in soil wetting front under irrigation conditions supported this finding. Salinity in soil continuously migrated to the surface through capillary pores under S1–S5 (Table 3), leading to uneven accumulation of salinity at the surface. As moisture content decreased throughout the layer, the spatial variability in soil salinity gradually decreased.
Spatial patterns of moisture and salinity distribution throughout the entire soil layer exhibited a higher correlation only in the S3–S4 (Figure 6 and Figure 7). This result is due to the interconnectedness between soil moisture and salinity. According to research by Wen et al. [12], moisture plays a crucial role in transporting salinity within the soil. Additionally, the presence of dissolved or precipitated salts can affect moisture migration. For instance, the relative humidity of pores decreases as salinity dissolves in liquid moisture, while the volume of pores diminishes as salinity precipitates from liquid moisture. These interactions ultimately alter the physical and mechanical properties of the soil. Therefore, the spatial distribution between soil moisture and salinity was correlative. In addition, the moisture content level in soil was the main factor affecting the spatial distribution correlation of moisture and salinity. At S1–S2, the range of relative moisture content of the soil was 0.73–0.98 (Figure 2), and soil soluble salinity could be fully dissolved by moisture. The spatial distribution of soil moisture and salinity were low and high, respectively, due to the uneven leaching of salinity by rainfall (Table 4, Figure 4 and Figure 5). Thus, the lower correlation in spatial distribution between moisture and salinity occurred in this stage. As the moisture content decreased further (S3–S4), soil moisture migration mainly occurred in the capillary pores, thereby determining the dynamic distribution of salinity [8,37]. Spatial variability in soil moisture and salinity decreased gradually, leading to a high correlation during this stage (Figure 6 and Figure 7). At S5, the average relative moisture content of the soil was 0.51% (Figure 2). The precipitation of soil salinity may occur due to low moisture content, leading to solid crystallization that blocks capillary pores in the soil. The observation indicates a weak relationship between the spatial patterns of moisture and salinity across the complete layer at this time (Figure 6 and Figure 7). Our findings provide valuable insights into the spatial distribution characteristics of moisture and salinity in soil, as well as their correlations.

5. Conclusions

This research investigated the characteristics of spatial distributions in soil moisture and salinity, along with their correlations, employing multifractal and joint multifractal methods across different soil layers and moisture content levels. The findings revealed that with a decrease in moisture content, the spatial variability in moisture increased within layers S1–S3 and subsequently decreased under S3–S5, while the spatial variability in soil salinity diminished. The main factor influencing the spatial distribution correlation of soil moisture and salinity was the moisture content level in the soil. The correlation between soil moisture and salinity was high, with a relative moisture content range of 0.52–0.75 (S3–S4) in the entire layer due to their coupling effect. These results contribute to a better understanding of the spatial coupling effect of soil moisture and salinity. In the future, it is necessary to establish additional sampling intervals to accurately measure the relative moisture content ranges in the spatially coupled distribution between soil moisture and salinity.

Author Contributions

Conceptualization, N.S.; methodology, Z.K. and L.M.; Writing—original draft, Z.K.; writing—review and editing, N.S. and Z.K.; visualization, L.M.; supervision, N.S.; Investigation, Z.K. and L.M. All authors have read and agreed to the published version of the manuscript.

Funding

Financial support for this research was provided by the China Postdoctoral Science Foundation (2021M702681), the Natural Science Basic Research Program of Shaanxi (2024JC-YBQN-0588), the National Key Research and Development Program of China (2017YFD0800502), Shaanxi Foreign Economic and Trade Group Qingjian Ten Thousand Black Cattle (He Niu) Smart Ranch Technology Research and Development Plan (SYYF2024-01), and Science and Technology Research and Development Project in Xiji County, Guyuan City (GYYF2023-01).

Institutional Review Board Statement

Not applicable.

Data Availability Statement

Data are contained within the article.

Conflicts of Interest

The authors declare no conflicts of interest.

References

  1. Wang, Q.; Jin, H.; Yuan, Z.; Yang, C. Synergetic variations of active layer soil moisture and salinity in a permafrost-affected meadow in the headmoisture area of the Yellow River, northeastern Qinghai–Tibet plateau. Int. Soil Moisture Conserv. 2021, 10, 284–292. [Google Scholar]
  2. Theve, M. Development of soil halinity classes for Connecticut tidal marshes. Estuar. Coast. Shelf Sci. 2014, 149, 313–319. [Google Scholar] [CrossRef]
  3. Qiu, Y.; Wang, Y.; Fan, Y.; Hao, X.; Li, S.; Kang, S. Root, Yield, and Quality of Alfalfa Affected by Soil salinity in Northwest China. Agriculture 2023, 13, 750. [Google Scholar] [CrossRef]
  4. Heng, T.; Ma, Y.; Ai, P.; Liu, Z.; Wu, M.; Liu, C. The Effects of Soil salinity Stress on the Nitrogen Uptake, Yield Response and Nitrogen Use Efficiency of Cotton in Arid Areas. Agronomy 2024, 14, 229. [Google Scholar] [CrossRef]
  5. Yu, C.; Shi, H.; Miao, Q.; Gonçalves, J.M.; Yan, Y.; Hu, Z.; Hou, C.; Zhao, Y. moisture–salinity Migration Patterns among Cropland–Wasteland–Fishponds in the River-Loop Irrigation Area. Agronomy 2024, 14, 107. [Google Scholar] [CrossRef]
  6. Ghassemi, F.; Close, A.; Kellett, J.R. Numerical models for the management of land and moisture resources salinisation. Math. Comput. Simul. 1997, 43, 323–329. [Google Scholar] [CrossRef]
  7. Rengasamy, P. World salinization with emphasis on Australia. J. Exp. Bot. 2006, 57, 1017–1023. [Google Scholar] [CrossRef]
  8. Ren, D.; Wei, B.; Xu, X.; Engel, B.; Li, G.; Huang, Q.; Xiong, Y.; Huang, G. Analyzing spatiotemporal characteristics of soil salinity in arid irrigated agro-ecosystems using integrated approaches. Geoderma 2019, 356, 113935. [Google Scholar] [CrossRef]
  9. Gorji, T.; Yildirim, A.; Hamzehpour, N.; Tanik, A.; Sertel, E. Soil salinity analysis of Urmia Lake Basin using Landsat-8 OLI and Sentinel-2A based spectral indices and electrical conductivity measurements. Ecol. Indic. 2020, 112, 106173. [Google Scholar] [CrossRef]
  10. Ke, Z.; Liu, X.; Ma, L.; Feng, Z.; Tu, W.; Dong, Q.g.; Jiao, F.; Wang, Z. Rainstorm events increase risk of soil salinization in a loess hilly region of China. Agric. Moisture Manag. 2021, 256, 107081. [Google Scholar] [CrossRef]
  11. Mastrocicco, M.; Colombani, N.; Soana, E.; Vincenzi, F.; Castaldelli, G. Intense rainfalls trigger nitrite leaching in agricultural soils depleted in organic matter. Sci. Total Environ. 2019, 665, 80–90. [Google Scholar] [CrossRef] [PubMed]
  12. Wen, W.; Lai, Y.; You, Z. Numerical modeling of moisture–heat–vapor–salinity transport in unsaturated soil under evaporation. Int. J. Heat Mass Transf. 2020, 159, 120114. [Google Scholar] [CrossRef]
  13. Walter, J.; Lück, E.; Bauriegel, A.; Facklam, M.; Zeitz, J. Seasonal dynamics of soil salinity in peatlands: A geophysical approach. Geoderma 2018, 310, 1–11. [Google Scholar] [CrossRef]
  14. Cao, Q.; Yang, B.; Li, J.; Wang, R.; Liu, T.; Xiao, H. Characteristics of soil moisture and salinity associated with Tamarix ramosissima communities during normal and dry periods in a semi-arid saline environment. Catena 2020, 193, 104661. [Google Scholar] [CrossRef]
  15. Yuan, C.; Feng, S.; Huo, Z.; Ji, Q. Effects of deficit irrigation with saline moisture on soil moisture-salinity distribution and moisture use efficiency of maize for seed production in arid Northwest China. Agric. Moisture Manag. 2019, 212, 424–432. [Google Scholar]
  16. Dong, Q.; Yang, Y.; Zhang, T.; Zhou, L.; He, J.; Chau, H.W.; Zou, Y.; Feng, H. Impacts of ridge with plastic mulch-furrow irrigation on soil salinity, spring maize yield and moisture use efficiency in an arid saline area. Agric. Moisture Manag. 2018, 201, 268–277. [Google Scholar]
  17. Ke, Z.; Ma, L.; Jiao, F.; Liu, X.; Liu, Z.; Wang, Z. Multifractal parameters of soil particle size as key indicators of the soil moisture distribution. J. Hydrol. 2021, 595, 125988. [Google Scholar] [CrossRef]
  18. Wang, F.; Wang, J.; Wang, Y. Using multi-fractal and joint multi-fractal methods to characterize spatial variability of reconstructed soil properties in an opencast coal-mine dump in the Loess area of China. Catena 2019, 182, 104111. [Google Scholar] [CrossRef]
  19. Wang, J.; Zhang, C.; Wu, Z.; Wharton, J.; Ren, L. Numerical study on reduction of aerodynamic noise around an airfoil with biomimetic structures. J. Sound Vib. 2017, 394, 46–58. [Google Scholar] [CrossRef]
  20. Teng, M.; Zeng, L.; Xiao, W.; Huang, Z.; Zhou, Z.; Yan, Z.; Wang, P. Spatial variability of soil organic carbon in Three Gorges Reservoir area, China. Sci. Total Environ. 2017, 599–600, 1308–1316. [Google Scholar] [CrossRef]
  21. Wang, T.; Kang, F.; Cheng, X.; Han, H.; Bai, Y.; Ma, J. Spatial variability of organic carbon and total nitrogen in the soils of a subalpine forested catchment at Mt. Taiyue, China. Catena 2017, 155, 41–52. [Google Scholar] [CrossRef]
  22. Vidana Gamage, D.N.; Biswas, A.; Strachan, I.B. Spatial variability of soil thermal properties and their relationships with physical properties at field scale. Soil Tillage Res. 2019, 193, 50–58. [Google Scholar] [CrossRef]
  23. Zeleke, T.B.; Si, B.C. Characterizing scale-dependent spatial relationships between soil properties using multifractal techniques. Geoderma 2006, 134, 440–452. [Google Scholar] [CrossRef]
  24. Qi, F.; Zhang, R.; Liu, X.; Niu, Y.; Zhang, H.; Li, H.; Li, J.; Wang, B.; Zhang, G. Soil particle size distribution characteristics of different land-use types in the Funiu mountainous region. Soil Tillage Res. 2018, 184, 45–51. [Google Scholar] [CrossRef]
  25. Jing, Z.; Wang, J.; Wang, R.; Wang, P. Using multi-fractal analysis to characterize the variability of soil physical properties in subsided land in coal-mined area. Geoderma 2020, 361, 114054. [Google Scholar] [CrossRef]
  26. Bertol, I.; Schick, J.; Bandeira, D.H.; Paz-Ferreiro, J.; Vázquez, E.V. Multifractal and joint multifractal analysis of moisture and soil losses from erosion plots: A case study under subtropical conditions in Santa Catarina highlands, Brazil. Geoderma 2017, 287, 116–125. [Google Scholar] [CrossRef]
  27. Jin, Z.; Guo, L.; Wang, Y.; Yu, Y.; Lin, H.; Chen, Y.; Chu, G.; Zhang, J.; Zhang, N. Valley reshaping and damming induce moisture table rise and soil salinization on the Chinese Loess Plateau. Geoderma 2019, 339, 115–125. [Google Scholar] [CrossRef]
  28. Yu, Y.; Lin, H.; Zhao, J.; Guangchen, C.; Jin, Z. Ammonia dynamics in reservoirs in response to rainfall events in a gully-filled loess catchment in Yan’an City, Shaanxi Province. Quatern. Sci. 2017, 37, 1204–1218. [Google Scholar]
  29. Allen, R.G.; Pereira, L.S.; Raes, D.; Smith, M. Crop evapotranspiration—Guidelines for computing crop moisture requirements—FAO Irrigation and drainage paper 56. FAO Rome 1998, 300, D05109. [Google Scholar]
  30. Li, Y.Y.; Shao, M.A. Change of soil physical properties under long-term natural vegetation restoration in the Loess Plateau of China. J. Arid Environ. 2006, 64, 77–96. [Google Scholar] [CrossRef]
  31. Bao, S.D. Soil Analysis in Agricultural Chemistry (In Chinese); China Agricultural Press: Beijing, China, 2005. [Google Scholar]
  32. Evertsz, C.J.G.; Mandelbrot, B.B. Multifractal measures. In Chaos & Fractals New Frontiers of Science; Springer: Berlin/Heidelberg, Germany, 1992; p. 984. [Google Scholar]
  33. Zhou, H.; Li, B.; Lv, Y.; Liu, W. Multifractal characteristics of soil porestructure under different tillage systems. Acta Pedol. Sin. 2010, 47, 1094–1100. [Google Scholar] [CrossRef]
  34. Jiménez-Hornero, F.J.; Gutiérrez de Ravé, E.; Ariza-Villarverde, A.B.; Giráldez, J.V. Description of the seasonal pattern in ozone concentration time series by using the strange attractor multifractal formalism. Environ. Monit. Assess. 2010, 160, 229–236. [Google Scholar] [CrossRef] [PubMed]
  35. Si, B.C.; Kachanoski, R.G. Estimating Soil Hydraulic Properties During Constant Flux Infiltration: Inverse Procedures. Soil Sci. Soc. Am. J. 2000, 64, 439–449. [Google Scholar] [CrossRef]
  36. Vázquez, E.V.; Miranda, J.G.V.; Paz-Ferreiro, J. A multifractal approach to characterize cumulative rainfall and tillage effects on soil surface micro-topography and to predict depression storage. Biogeosciences 2010, 7, 2989–3004. [Google Scholar] [CrossRef]
  37. Akça, E.; Aydin, M.; Kapur, S.; Kume, T.; Nagano, T.; Watanabe, T.; Çilek, A.; Zorlu, K. Long-term monitoring of soil salinity in a semi-arid environment of Turkey. Catena 2020, 193, 104614. [Google Scholar] [CrossRef]
  38. Benslama, A.; Khanchoul, K.; Benbrahim, F.; Boubehziz, S.; Chikhi, F.; Navarro-Pedreno, J. Monitoring the Variations of Soil salinity in a Palm Grove in Southern Algeria. Sustainability 2020, 12, 6117. [Google Scholar] [CrossRef]
  39. Han, J.; Mammadov, Z.; Kim, M.; Mammadov, E.; Lee, S.; Park, J.; Mammadov, G.; Elovsat, G.; Ro, H.M. Spatial distribution of salinity and heavy metals in surface soils on the Mugan Plain, the Republic of Azerbaijan. Environ. Monit. Assess. 2021, 193, 20. [Google Scholar] [CrossRef] [PubMed]
  40. Zhu, Q.; Lin, H. Influences of soil, terrain, and crop growth on soil moisture variation from transect to farm scales. Geoderma 2011, 163, 45–54. [Google Scholar] [CrossRef]
  41. Pollacco, J.A.P.; Fernández-Gálvez, J.; Carrick, S. Improved prediction of moisture retention curves for fine texture soils using an intergranular mixing particle size distribution model. J. Hydrol. 2020, 584, 124597. [Google Scholar] [CrossRef]
  42. Suh, H.S.; Kang, D.H.; Jang, J.; Kim, K.Y.; Yun, T.S. Capillary pressure at irregularly shaped pore throats: Implications for moisture retention characteristics. Adv. Moisture Resour. 2017, 110, 51–58. [Google Scholar] [CrossRef]
  43. Zhang, C.; Wang, H. A brief review of advances in soil moisture research. Agricul. Res. Arid Areas 2003, 8, 13–18. [Google Scholar]
  44. Zhang, T.; Dong, Q.G.; Zhan, X.; He, J.; Feng, H. Moving salinitys in an impermeable saline-sodic soil with drip irrigation to permit wolfberry production. Agric. Moisture Manag. 2019, 213, 636–645. [Google Scholar]
Figure 1. Rainfall, sampling stages, and ET0 after the rainfall event.
Agronomy 14 01138 g001
Figure 2. Experimental plot and squared grid layout used to conduct multifractal analysis at different sizes ε (i.e., 15 m, 20 m, 30 m, and 60 m).
Agronomy 14 01138 g002
Figure 3. The distribution range of relative moisture content of soil at different sampling stages after the rainfall.
Agronomy 14 01138 g003
Figure 4. Spectra of generalized dimensions for the q moment range [−10, 10] of soil moisture at the depths of 0–20 and 20–40 cm at different stages after the rainfall event. S1, S2, S3, S4, and S5 indicate sampling 1, 2, 3, 4, and 5 stages, respectively. (a,b) indicate 0–20 and 20–40 cm soil layer, respectively.
Agronomy 14 01138 g004
Figure 5. Spectra of generalized dimensions for the q moment range [−10, 10] of soil salinity at the depths of 0–20 and 20–40 cm at different stages after the rainfall event. S1, S2, S3, S4, and S5 indicate sampling 1, 2, 3, 4, and 5 stages, respectively. (a,b) indicate 0–20 and 20–40 cm soil layer, respectively.
Agronomy 14 01138 g005
Figure 6. Joint multifractal spectra gray-scale images between moisture and salinity at a depth of 0–20 cm at different stages after the rainfall event. (a) S1, (b) S2, (c) S3, (d) S4, and (e) S5 indicate sampling 1, 2, 3, 4, and 5 stages, respectively.
Agronomy 14 01138 g006
Figure 7. Joint multifractal spectra gray-scale images between moisture and salinity at a depth of 20–40 cm at different stages after the rainfall event. (a) S1, (b) S2, (c) S3, (d) S4, and (e) S5 indicate sampling 1, 2, 3, 4, and 5 stages, respectively.
Agronomy 14 01138 g007
Table 1. Climatic information of the study area.
Mean Annual Rainfall
(mm)
Average Altitude
(m)
Mean Annual Potential Evaporation (°C)Mean Annual Temperature
(°C)
Mean Annual Sunshine Duration (h) Mean Annual Total Radiation
(kJ cm−2)
505.31371.914638.62395.6493
Table 2. Soil physical properties.
Soil Depths
(cm)
BD
(g cm−3)
FC
(%)
Ks
(cm min−1)
Clay
(%)
Silt
(%)
Sand
(%)
Soil Texture
Classification
0–201.1724.800.579.8539.2050.96Loam
20–401.2625.000.369.9940.0449.97Loam
Note: BD, FC, and Ks indicate bulk density, field capacity, and saturated hydraulic conductivity, respectively. The soil texture was classified by the international standard for soil texture classification.
Table 3. Soil moisture and salinity content at different stages after the rainfall event.
Soil PropertiesSoil Layer
(cm)
S1 (Mean ± SD)S2
(Mean ± SD)
S3
(Mean ± SD)
S4
(Mean ± SD)
S5
(Mean ± SD)
Soil moisture
content (%)
0–2022.56 ± 1.37 Aa19.57 ± 1.36 Bb16.23 ± 1.26 Bc13.92 ± 1.07 Bd12.02 ± 0.85 Be
20–4022.31 ± 1.64 Aa21.05 ± 1.66 Ab17.70 ± 1.49 Ac15.08 ± 1.01 Ad13.43 ± 1.03 Ae
Mean22.44 ± 1.4920.31 ± 1.6716.97 ± 1.5514.50 ± 1.1812.73 ± 1.17
Soil salinity
content (g kg−1)
0–200.64 ± 0.09 Be0.79 ± 0.10 Bd0.98 ± 0.10 Ac1.25 ± 0.08 Ab1.38 ± 0.03 Aa
20–400.79 ± 0.11 Ac0.89 ± 0.12 Ab0.94 ± 0.13 Aab0.97 ± 0.09 Ba0.97 ± 0.03 Ba
Mean0.71 ± 0.120.84 ± 0.120.96 ± 0.121.11 ± 0.161.18 ± 0.21
Notes: S1, S2, S3, S4, and S5 indicate sampling 1, 2, 3, 4, and 5 stages, respectively. SD indicates standard deviation. The capital letters indicate significant differences between 0–20 and 20–40 cm layers in the same stage (p < 0.05). Different lower-case letters represent the significant differences between sampling stages in the same soil layer (p < 0.05).
Table 4. Multifractal parameters for soil moisture and salinity at different stages after the rainfall event.
Soil PropertiesSoil Layers (cm)S1 S2 S3 S4 S5
D1∆DD1∆DD1∆DD1∆DD1∆D
Soil moisture0–201.99900.02111.99670.06511.99600.07481.99710.06491.99740.0665
20–401.99730.05091.99610.08481.99650.06921.99780.04481.99810.0391
Mean1.99820.03601.99640.07501.99630.07201.99750.05491.99780.0528
Soil salinity0–201.98960.21391.99020.18261.99270.13311.99760.04821.99980.0046
20–401.98740.22641.98920.18241.99080.16541.99510.09001.99960.0085
Mean1.98850.22021.98970.18251.99180.14931.99640.06911.99970.0066
Notes: S1, S2, S3, S4, and S5 indicate sampling 1, 2, 3, 4, and sampling 5 stages, respectively.
Disclaimer/Publisher’s Note: The statements, opinions and data contained in all publications are solely those of the individual author(s) and contributor(s) and not of MDPI and/or the editor(s). MDPI and/or the editor(s) disclaim responsibility for any injury to people or property resulting from any ideas, methods, instructions or products referred to in the content.

