Abstract
Soil texture affects rice nutrient uptake and yield formation by influencing soil structure, microbial activity, and soil nutrient supply capacity. Analyzing the relationship between soil texture, nutrient content, and rice agronomic traits is of great significance for precise and efficient fertilizer application. The tillage layer (0–20 cm) of 31 paddy fields in China’s main rice-producing areas was collected to perform rice pot experiments, and soil texture characteristics, physicochemical properties, microbial-related indicators, and rice agronomic traits were measured and analyzed. The results showed that these soils could be classified into four types of soil texture: loamy sandy soil, sandy loam soil, silty loam soil, and silty soil. Analysis of variance showed that the available nitrogen (AN), available potassium (AK), and available phosphorus (AP) contents were the highest in silty loam, silty, and sandy loam soils, respectively, and silt loamy soil had the highest CEC. Principal component analysis (PCA) also showed that soil physicochemical properties can be distinguished to a certain extent according to soil texture types. For the relationship of soil texture parameters and soil physicochemical properties, soil organic matter (OM), total nitrogen (TN), AN, ammonium nitrogen (NH4+-N), and microbial carbon (MBC) contents were positively correlated with soil clay content, AK was positively correlated with silt content, and soil phosphorus status was significantly related to pH. Mantel’s test revealed significant correlations between rice N, P, and K nutrient status, dry matter accumulation, and yield, and soil available nutrient content, MBC, pH, and soil texture parameters. Structural equation modeling (SEM) indicated that sand affected soil available nutrients by regulating pH, while clay can positively influence soil available nutrients by affecting soil organic matter mineralization and microbial activity, thus influencing nutrient absorption and yield formation in rice. Overall, in rice production, the silty and silty loam paddy soil with fine texture and higher clay content facilitates the mineralization of soil organic matter and the activity of soil microbes, resulting in more available soil nutrients, which benefits the rice absorption and accumulation of nutrients. Furthermore, a higher content of clay also promotes the distribution of dry matter to the panicle, thereby promoting rice yield formation.
1. Introduction
Soil particles are the fundamental components of soil minerals and can be categorized into sand, silt, and clay, based on their particle size. The distribution of soil particles in each size category is indicative of the soil’s mechanical composition, forming the foundation for soil classification [1]. Soil texture is one of the main criteria for soil classification, both nationally and internationally [2]. There are various soil texture classification systems among different countries and associations, which have different criteria for classifying soil particle size and texture. Currently, the widely used soil texture classification standards mainly include the International Society of Soil Science system (ISSS system) [3], the United States Department of Agriculture system (USDA system), the Kachinsky system, and the Chinese system. The USDA system is the most widely used in relevant research nationally and internationally. It is currently used as a standard for dividing land tenure systems in more than 80 countries and regions. Among the published research on soil texture in China, the utilization rate of the USDA system accounts for 62.86% [4]. The USDA system uses 2 µm, 50 µm, and 2000 µm as the size boundaries for soil clay, silt, and sand and subdivides the sand into five categories: very fine, fine, medium, coarse, and very coarse. In terms of the classification of soil texture, the USDA system uses a triangular coordinate map of soil texture classification based on the characteristics of soil aeration, soil water, and fertilizer-holding capacity, which divides soil texture into four groups: sand, loam, clay loam, and clay. Furthermore, according to the differences in the mineral properties and physicochemical properties of soil particles of different particle sizes, the soil texture is divided into 12 grades [3,4].
Soil texture affects soil physical properties such as water-holding capacity, permeability, and specific surface area, which alter the microenvironment of soil microbial activity, leading to differences in soil nutrient cycling and distribution [5,6]. In relevant research, several attempts have been made to correlate the soil organic matter, total nitrogen content, and clay and silt contents [7,8,9]. Six et al. [10] proposed that soil clay has a large specific surface area and colloidal properties that can closely adsorb soil organic matter. Gentile et al. [11] reported that soil clay is the main controlling factor to maintain the stability of soil organic matter. Rakhsh et al. [12] reported that with increasing clay content, soil mineral nitrogen, microbial nitrogen content, and cation exchange capacity are significantly increased. In addition, some studies have shown that there is a certain relationship between soil texture and other soil nutrient indicators. Wang et al. [13] explored the determinants of soil nutrient distribution in small-scale river basins, and the results showed that soil silt and sand content were the main factors influencing soil organic matter and total nitrogen content, and silt and sand content were the key factors influencing soil total phosphorus content. However, some studies have also concluded that the correlation between soil organic matter and soil texture is weak or does not exist [14,15,16]. Franzluebbers et al. [17] proposed that soil clay adsorb organic molecules and maintain their stability but also hinder the activation of organic matter to a certain extent, which leads to no clear correlation between soil available nutrient content and soil texture.
Rice (Oryza sativa L.) is an important food crop in China. The perennial planting area is maintained at 30 million hectares, accounting for approximately 25% of the total grain planting area in China. The annual output is approximately 206 million tons, which supplies more than half of the national rations in China [18,19,20]. Nutrient supply in paddy field soil is an important factor influencing rice yield formation. Compared with other land use patterns, due to long-term high-intensity periodic human disturbances such as tillage, planting, irrigation, drainage, and fertilization, the macroaggregate structure of paddy soil was destroyed and transformed into smaller soil particles, and the nutrient distribution and nutrient cycling status of paddy soil are significantly different from those of other types of soil [21,22]. It is well known that soil nutrient content is an important indicator of paddy soil fertility, and a significant portion of nutrients absorbed by rice plants comes from the soil [23,24,25]. Previous researchers have carried out many studies on the nutrient status of different types of paddy fields, but the soil classification methods adopted are mostly based on the diagnostic layer or soil parent material [26,27,28] or the local customary name [29,30], which is difficult to summarize as a quantitative factor for analysis. Soil texture not only distinguishes soil categories based on soil physicochemical properties but also quantitatively describes soil texture parameters (soil clay, silt, and sand content). In order to systematically characterize soil nutrients in paddy fields of different textures, in this study, we collected various types of paddy soil in the main rice-producing areas of China as materials, analyzed the composition of soil particles, and analyzed the relationship between soil texture parameters and soil physicochemical properties, and rice nutrient uptake, based on soil texture classification. The results of this study can help to elucidate the mechanisms of nutrient differences and fertilizer utilization differences in paddy fields with different soil textures and provide a basis for the establishment of an efficient nutrient management system in paddy fields.
2. Materials and Methods
2.1. Soil Sample Collection
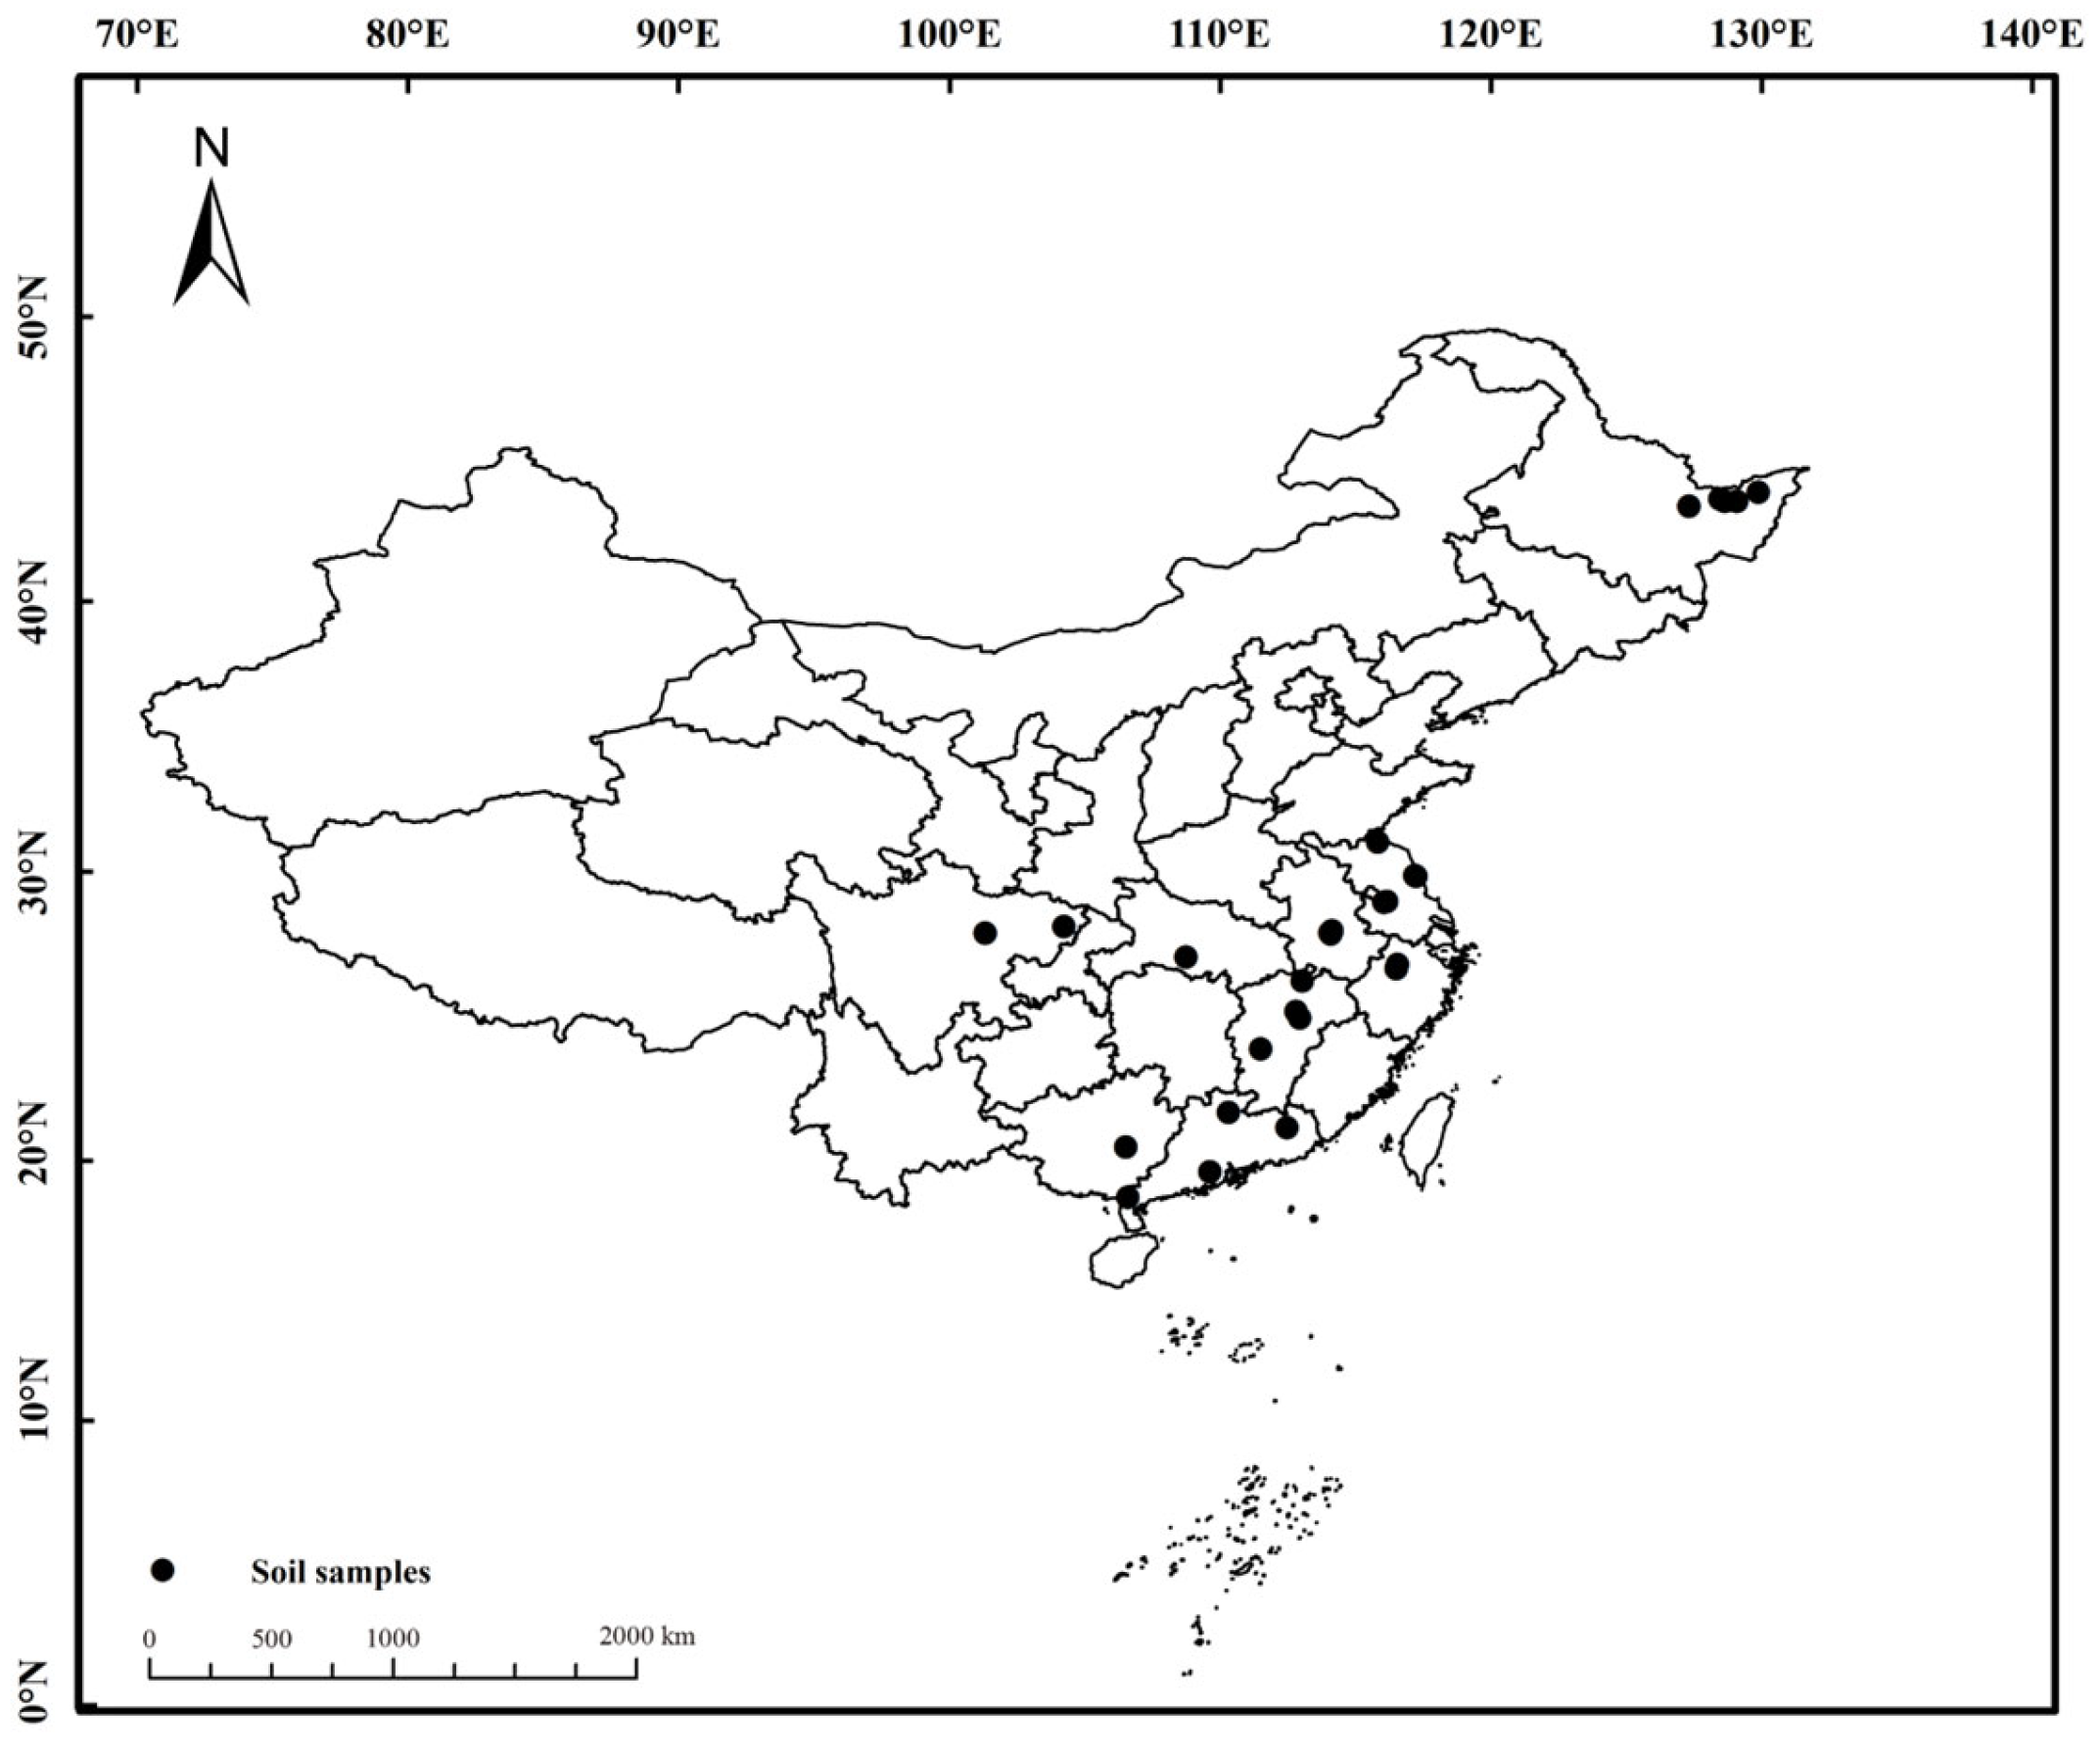
A total of 31 paddy soil samples (depth 0–20 cm) were collected in year 2020 from representative paddy fields in major rice-producing areas in China, including Heilongjiang Province, Sichuan Province, Hubei Province, Anhui Province, Zhejiang Province, Jiangsu Province, Jiangxi Province, Guangxi Province, and Guangdong Province. The geographical location distribution of sampling points is shown in Figure 1 and Table S1. After identifying the major soil types in each of the main rice producing areas, 100 kg of tillage soil (depth 0–20 cm) was taken using a five-point sampling method at each sampling point. After natural air drying, soil samples were finely ground and sieved through a 5 mm sieve for further use.

Figure 1.
Geographical distribution of sampling sites in different sampling paddy fields.
2.2. Rice Planting Experiment
Potted experiments were conducted in 2021 at the China National Rice Research Institute (CNRRI) (120.20° E, 30.30° N; 11 m above sea level), Zhejiang province, China. A total of 10 kg of sieved soil sample was weighed and placed in black plastic buckets, with 6 pots per soil sample. The soil was flooded with water to a depth of 1–4 cm, then stirred and allowed to settle for one week before further use. Using conventional rice Yangdao 6 as the variety, 3 hills of rice were planted in each pot, with two plants per hill. Rice was sown on 25 May and transplanted on 17 June. After rice transplanting, a 1–4 cm layer of flooding water was maintained at all times, except for drainage at the end of the tillering stage to reduce unproductive tillers. In the experiments, in order to test the actual nutrient supply capacity of the soil, no mineral fertilizers were applied, and pests and diseases were intensively controlled with chemicals to avoid biomass and yield losses.
2.3. Sampling and Analysis
At rice maturity, 9 hills of representative rice plants with similar growth conditions were taken from each soil sample and divided into 3 replications. All sampled plants were divided into the straw and panicle. The dry weight of each part was determined after oven drying at 105 °C for 30 min, then 85 °C for 48 h to achieve a constant weight. The plant dry weight at maturity was the sum of the straw and panicle weights. The nitrogen (N), phosphorus (P), and potassium (K) content of the straw and panicle were analyzed separately. The N and P content were determined by the Kjeldahl method and the full-automatic batch chemical analyzer Smartchem 450 (AMS Alliance, Rome, Italy). The K content was determined by the flame photometer method. The remaining rice plants were harvested, and the rice yield of each soil sample was calculated at the standard moisture content of 13.5%. We calculated the amount of nutrient accumulation in rice plants and the harvest index as follows:
Straw/panicle nutrient accumulation (g plant−1) = Straw/panicle dry matter
(g plant−1) × Straw/panicle nutrient content (%)/100
(g plant−1) × Straw/panicle nutrient content (%)/100
Total nutrient accumulation (g plant−1) = Straw nutrient accumulation
(g plant−1) + panicle nutrient accumulation (g plant−1)
(g plant−1) + panicle nutrient accumulation (g plant−1)
Harvest index = Dry weight of panicles (g plant−1)/Total plant dry weight
(g plant−1)
(g plant−1)
After rice harvest, using the ring knife method to measure soil bulk density (BD), we collected the soil samples. A portion of the soil samples were sieved through a 10-mesh sieve after removing impurities, and soil ammonium nitrogen (NH4+-N), nitrate nitrogen (NO3−-N), dissolved organic nitrogen (DON), microbial biomass carbon (MBC), and microbial biomass nitrogen (MBN) were analyzed. The remaining soil samples were naturally dried, ground finely, and sieved through 18-mesh and 100-mesh sieves for the determination of soil nutrient content. A total of 10 g of fresh soil sample was weighed and placed it into a centrifuge tube, adding 50 mL of 2 M KCl solution for extraction, and shaken at 180 rpm on a shaker for 30 min; it was filtered with quantitative filter paper, and the filtrate was analyzed using the Smartchem 450 (AMS Alliance, Rome, Italy) to determine the content of NH4+-N and NO3−-N. Soil MBC and MBN were determined by fumigation-extraction methods and analyzed by the Shimadzu TOC-VCPH (SHIMADZU Corporation, Tokyo, Japan), and on the basis of the difference between C and N, extracted with 0.5 M K2SO4 through chloroform-fumigation and remained as unfumigated soil samples, using KEC (0.38) and KEN (0.54) factors, respectively [31]. The determination of soil DON content involves extracting soil samples (10 g each) with 0.5 M K2SO4, filtering, and using Shimadzu TOC-VCPH (SHIMADZU Corporation, Tokyo, Japan) and Smartchem 450 (AMS Alliance, Rome, Italy) to measure total N and inorganic N content in the filtrate. DON was determined by subtracting inorganic N from total N.
For the methods for determining soil-related physicochemical properties, refer to LU 2020 [31]. The soil total nitrogen (TN) content was determined by the Kjeldahl method; total phosphorus (TP) content and total potassium (TK) content were determined by the sodium hydroxide melting method; and the available nitrogen (AN), available phosphorus (AP), and available potassium (AK) contents were determined by the alkaline hydrolysis-diffusion method, sodium bicarbonate extraction–molybdenum antimony anti-colorimetric method, and ammonium acetate extraction–flame photometer method, respectively. Soil pH and organic matter (OM) content were determined by the potentiometric method at a 2.5:1 (v/w) water-to-soil ratio and potassium dichromate oxidation-volume method, respectively. Soil cation exchange capacity (CEC) was determined by the ammonium acetate exchange method. Soil particle size distribution and mean volume diameter (MV) were measured by a Microtrac S3500 (Microtrac, Largo, FL, USA) micron laser particle size analyzer.
2.4. Statistical Analysis
ANOVA and Duncan’s new multiple-range test were used to assess the differences in soil nutrient indexes and rice agronomic traits among soil samples and soil types (p < 0.05). Statistical analyses were implemented in SAS 9.2 (SAS Institute, Cary, NC, USA). Principal Component Analysis (PCA) and cluster heatmap analysis were carried out by Origin 2021 (OriginLab Corporation, Northampton, MA, USA) to determine the relationship between soil texture and soil physicochemical properties in 31 soil samples. Mantel’s test and the structural equation model (SEM) were implemented using the R 4.3.2 software (R Core Team, Vienna, Austria) analysis package (linkET, tidyverse, ggplot2, corrplot, lavaan, semPlot) to determine the relationship between soil physicochemical properties and rice agronomic traits. Figures were plotted using Origin 2021 and R software.
3. Results
3.1. Soil Particle Size Analysis and Soil Texture Classification
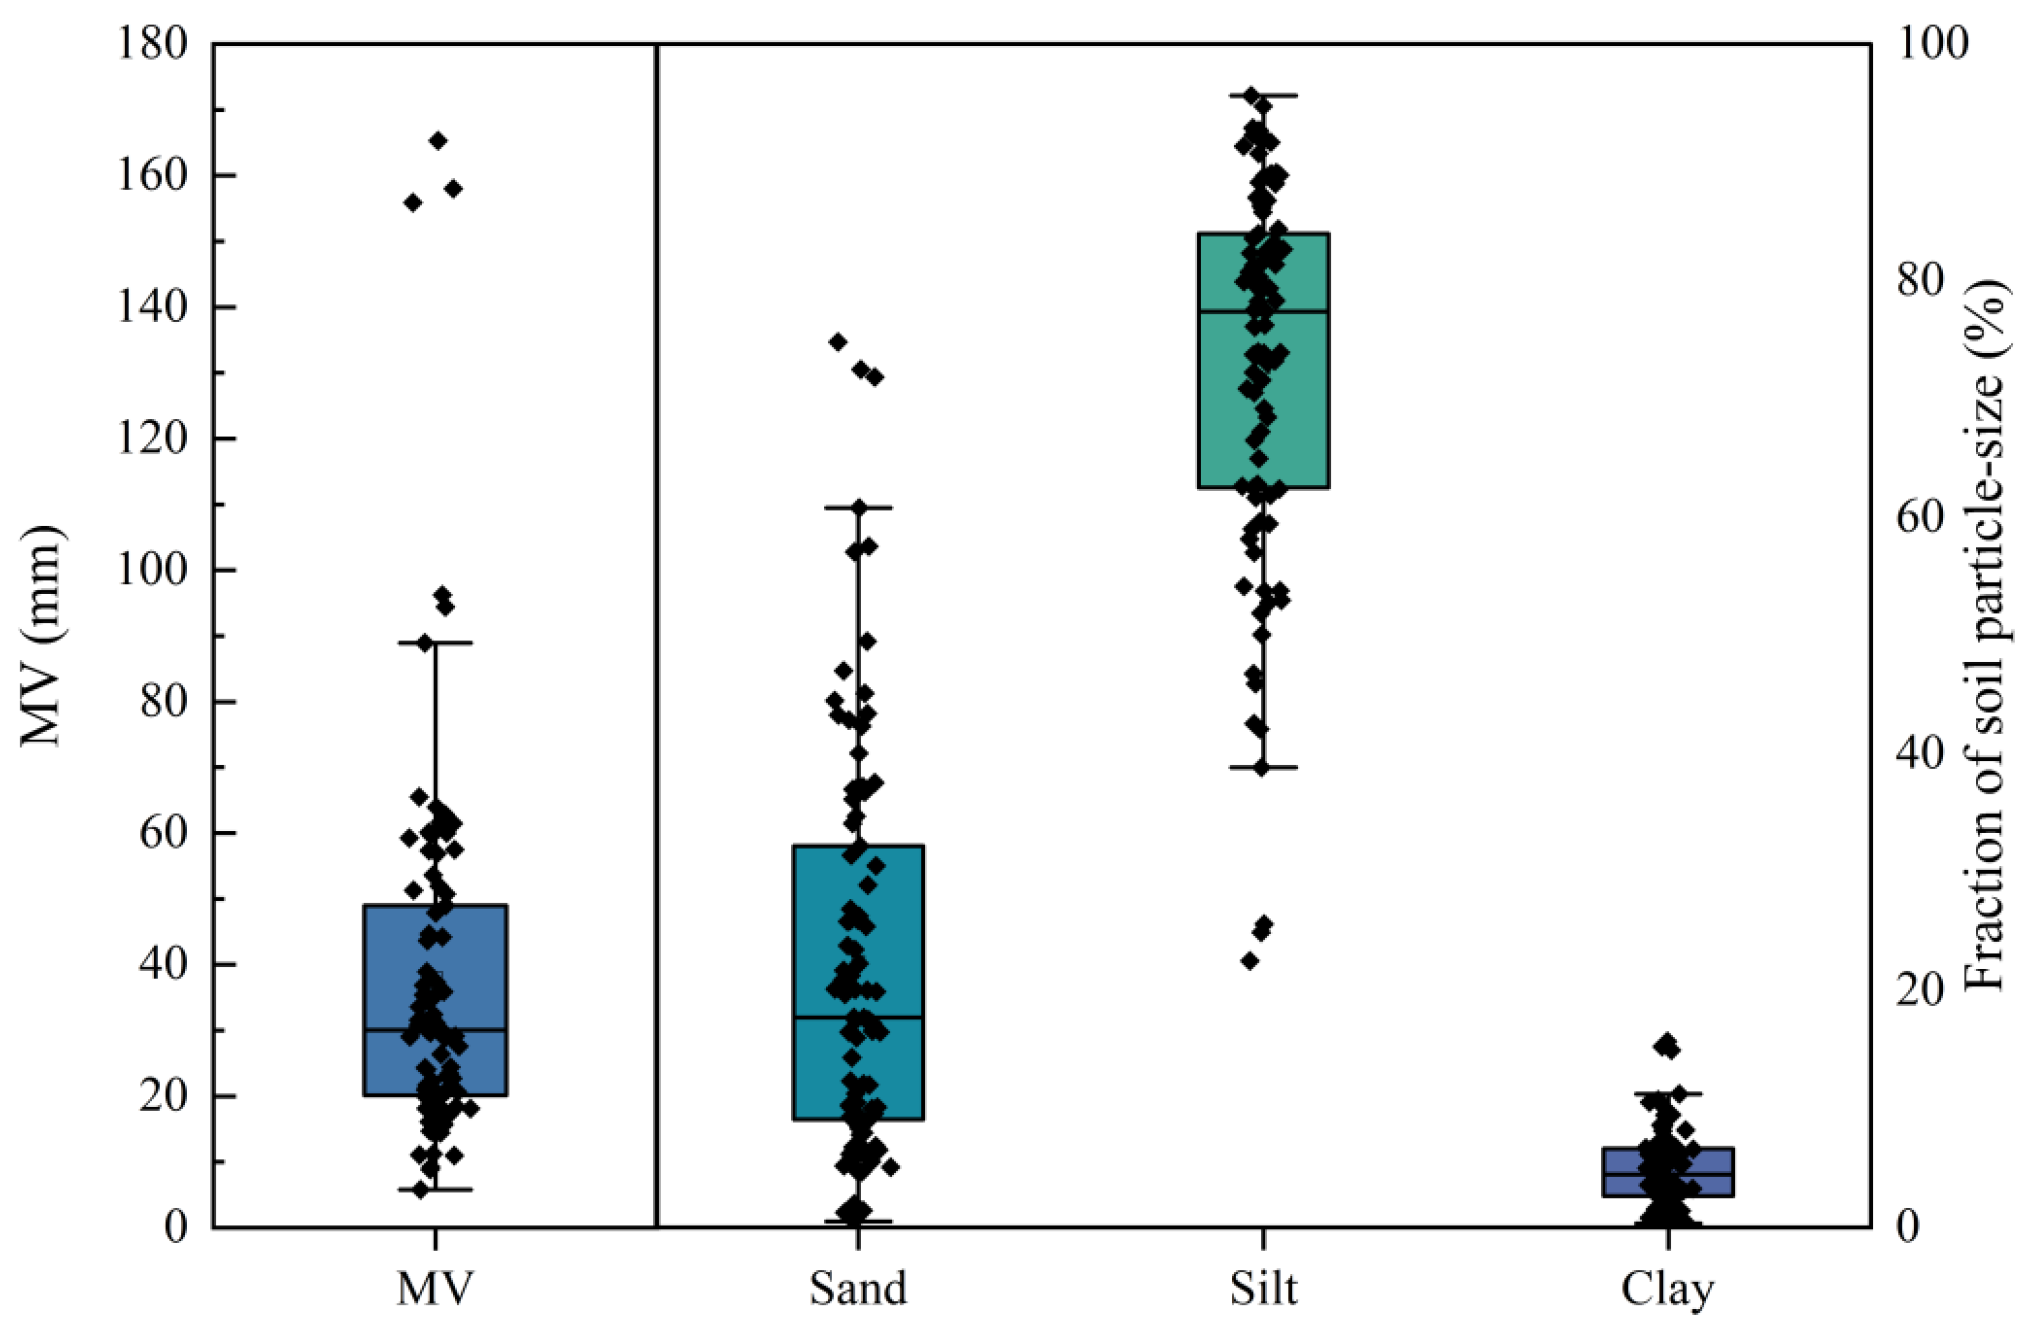
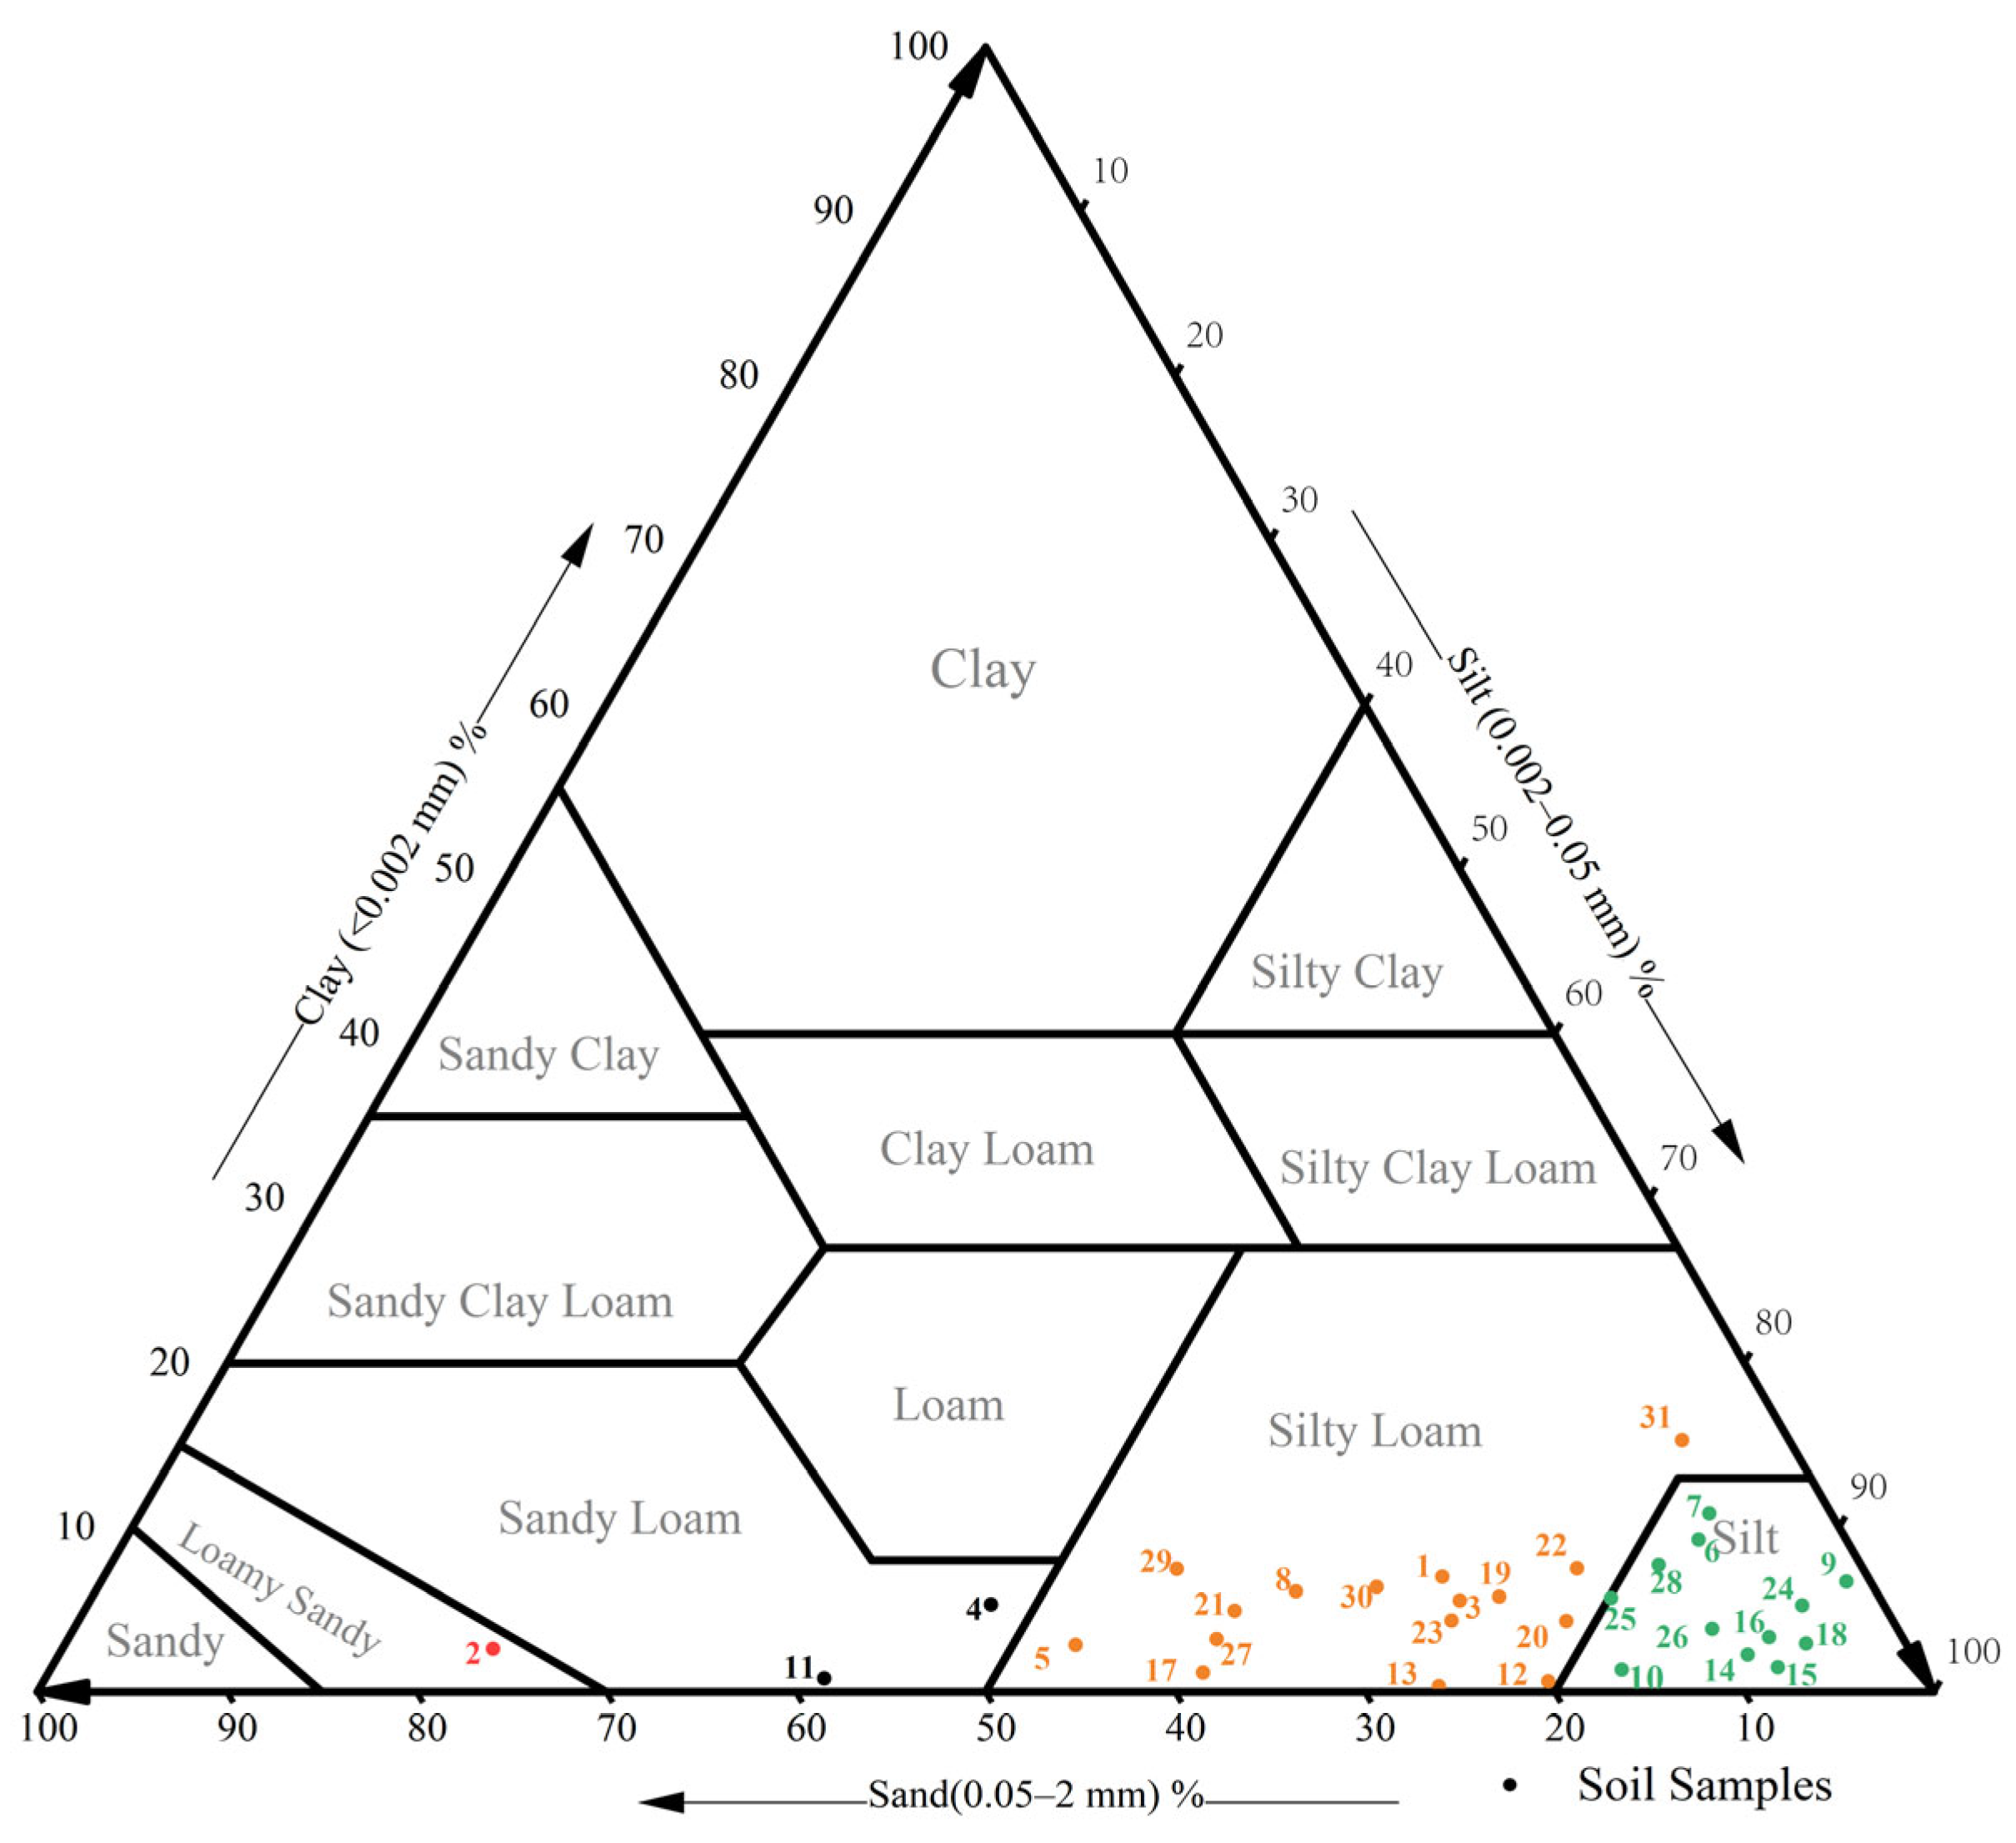
The MV and soil particle size distribution of 31 paddy soils are shown in Figure 2. The soil MV ranged from 5.80 mm to 165.30 mm, with mean and median values of 38.08 mm and 30.06 mm, respectively; the mean particle size of soil sample 2 (S2) deviated from the overall distribution due to the high sand content, reaching 73.06%. The mineral composition of paddy soil was dominated by silt, which accounted for 22.51–92.90% of the soil particles, with mean and median values of 72.43% and 77.4%, respectively, and S2 having the lowest average silt content of 24.35%. Soil clay content ranged from 0.33% to 15.73%, with mean and median values of 4.91% and 4.83%, respectively, and S32 having the highest mean clay content of 15.32%. Of the 31 soil samples, soil sand content ranged from 1.26 to 74.82%, with mean and median values of 22.60% and 17.73%, respectively. S2 had the highest average sand content of 73.06%. According to the USDA soil texture classification triangle (Figure 3), 31 soil samples could be categorized into four groups, including 1 loamy sand, 2 sandy loam, 16 silt loam, and 12 silt soils.
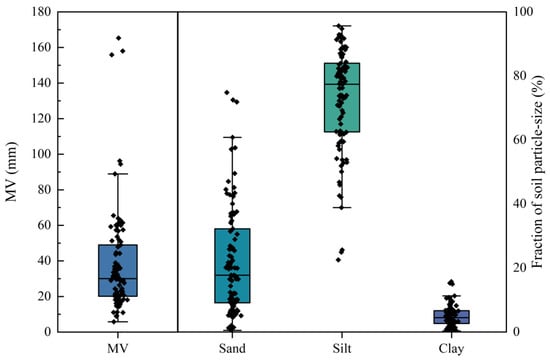
Figure 2.
Soil mean volume diameter (MV) and particle size distribution of tillage layer in different types of paddy fields.
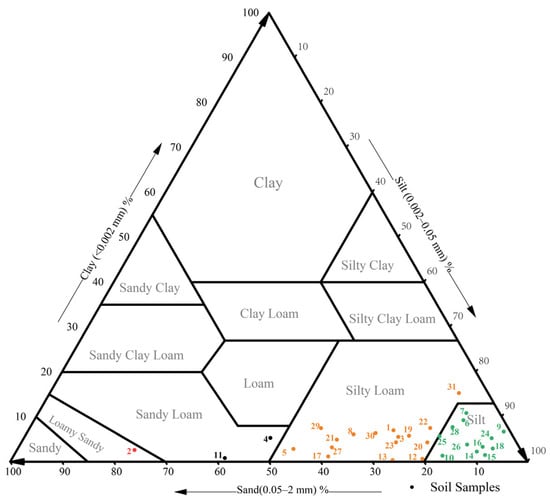
Figure 3.
Classification of soil texture types in 31 paddy tillage layer soils using the USDA system.
3.2. Nutrient Content of Paddy Soils
The main soil physicochemical properties (OM, TN, TK, TP, AN, AK, AP, pH, CEC) of the 31 paddy soils are shown in Table 1. The OM content of the 31 soil samples ranged from 1.31 to 5.45%, with a mean value of 2.67%, of which the lowest and highest values were observed in S18 and S23, respectively. The TN, TK, and TP content ranges were 0.07–0.33%, 0.93–2.65%, and 0.04–0.23%, respectively, and the average contents of TN, TK, and TP were 0.16%, 1.51%, and 0.08%, respectively. The AN, AK, and AP ranges were 29.30–193.79 mg·kg−1, 16.50–413.70 mg·kg−1, and 6.30- 104.04 mg·kg−1, with a mean value of 95.18 mg·kg−1, 131.26 mg·kg−1, and 31.50 mg·kg−1, respectively. Soil pH ranged from 4.79 to 8.15, and soil CEC was between 6.90 and 37.34 cmol·kg−1, with a mean value of 17.84 cmol·kg−1.

Table 1.
The main soil physicochemical properties of different soils.
Among the different texture types of soils, the average OM content of silty loam was significantly higher than that of the other types of soils, while there was no significant difference among the other types of soils. The average TN and TK contents were in the order of silt loam > silt > loamy sand > sandy loam soil, and the average TP content was in the order of sandy loam > silt loam, silt > loamy sand soil. In terms of soil available nutrient content, the mean AN content was in the order silty loam > silty > sandy loam > loamy sand. The mean AK content was highest in silt, followed by silt loam and sandy loam, and was lowest in loamy sand. The mean AP content was in the order sandy loam > silt loam > silt > loamy sand. As for pH, the pH values of loamy sand, silt, silt loam, and sandy loam were 6.60, 6.58, 6.43, and 6.00, respectively. The mean value of CEC was in the order of silt loam > silt > sandy loam > loamy sand.
3.3. Nutrient Accumulation of Rice Grown in Soils of Different Textures
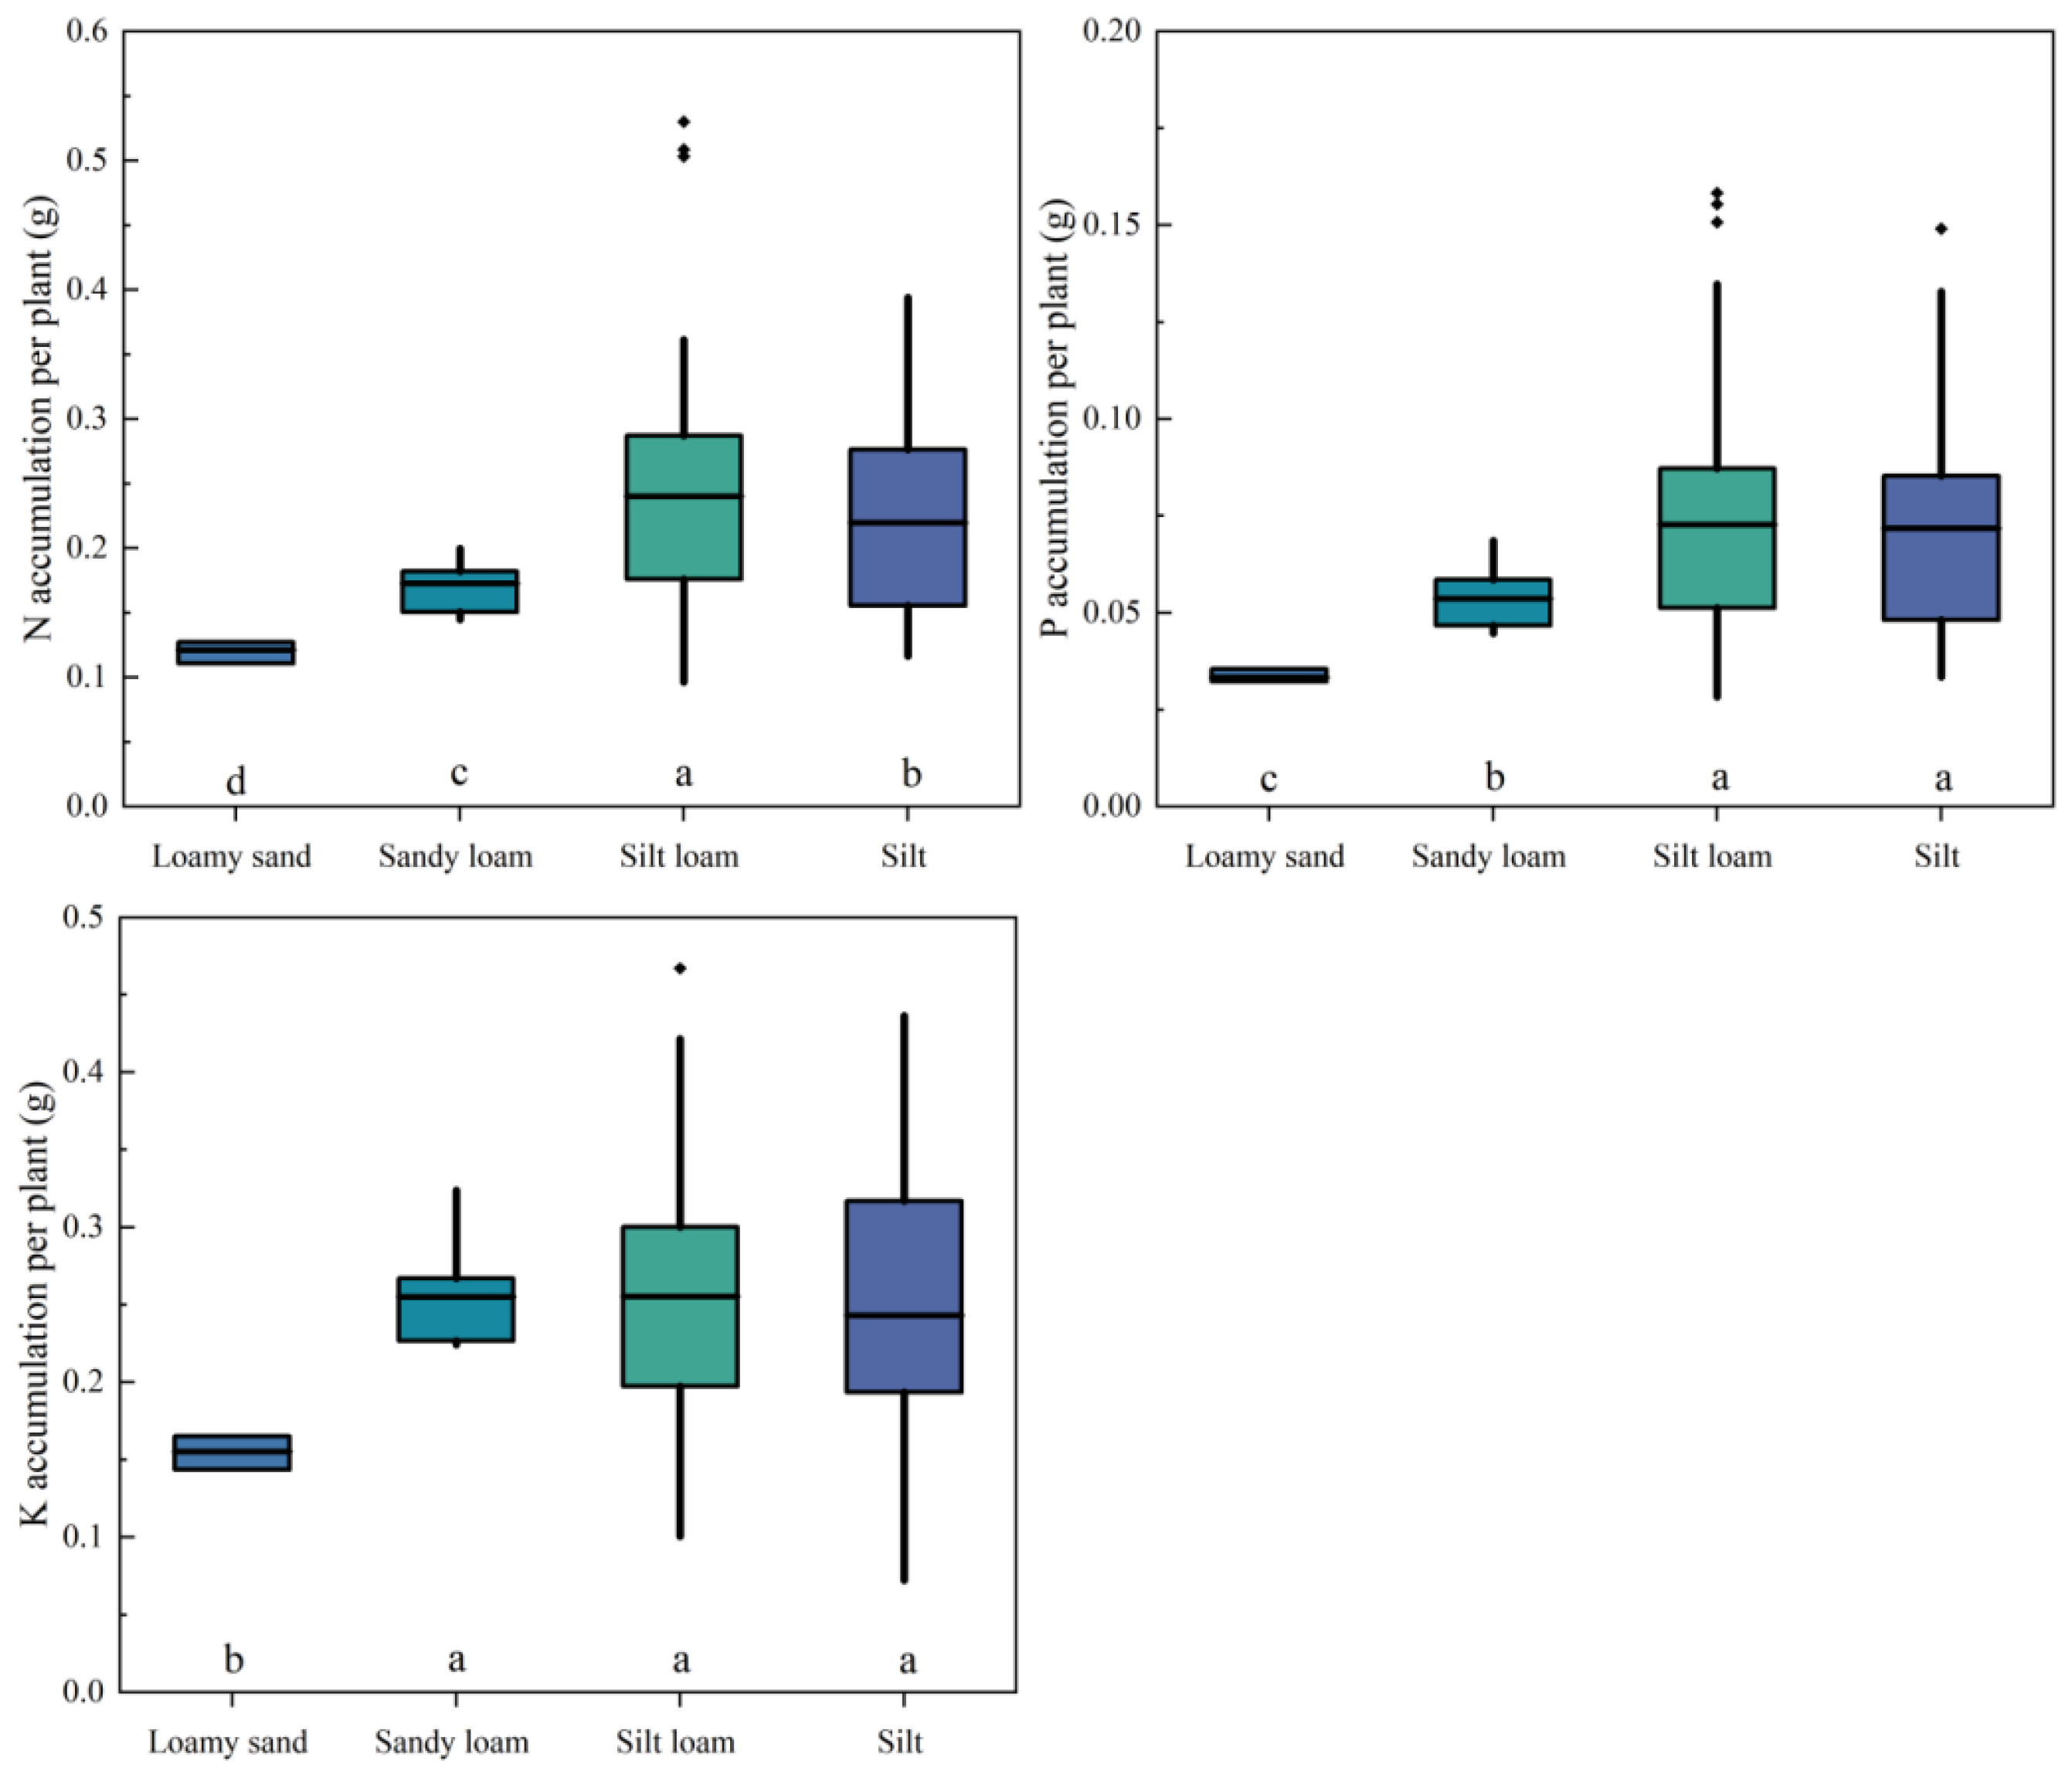
The uptake and accumulation of N, P, and K nutrients play a crucial role in the growth and development of rice, and there were significant differences in the nutrient accumulation of rice grown in paddy fields with different soil textures. The plant N, P, and K accumulations of different texture paddy soils are shown in Figure 4. The plant N accumulation was decreased in the order of silt loam, silt, sandy loam, and loamy sand, with mean values of 0.24 g, 0.22 g, 0.17 g, and 0.13 g per plant, respectively, with significant differences between soil types. As for plant P accumulation, silt loam and silt had mean values of 0.073 g and 0.071 g per plant, respectively, which was significantly higher than that of sandy loam (0.053 g per plant); the lowest value of 0.033 g was observed in loamy sand. Plant K accumulation was lowest in loamy sand, and there were no significant differences among the other three soil textures.

Figure 4.
Rice accumulation of N, P, and K in paddy soils of different textures. Different lowercase letters in the figure indicate that the data of different soil types have significant differences at p < 0.05.
3.4. Grain Yield and Dry Matter Accumulation of Rice Grown in Soils of Different Textures
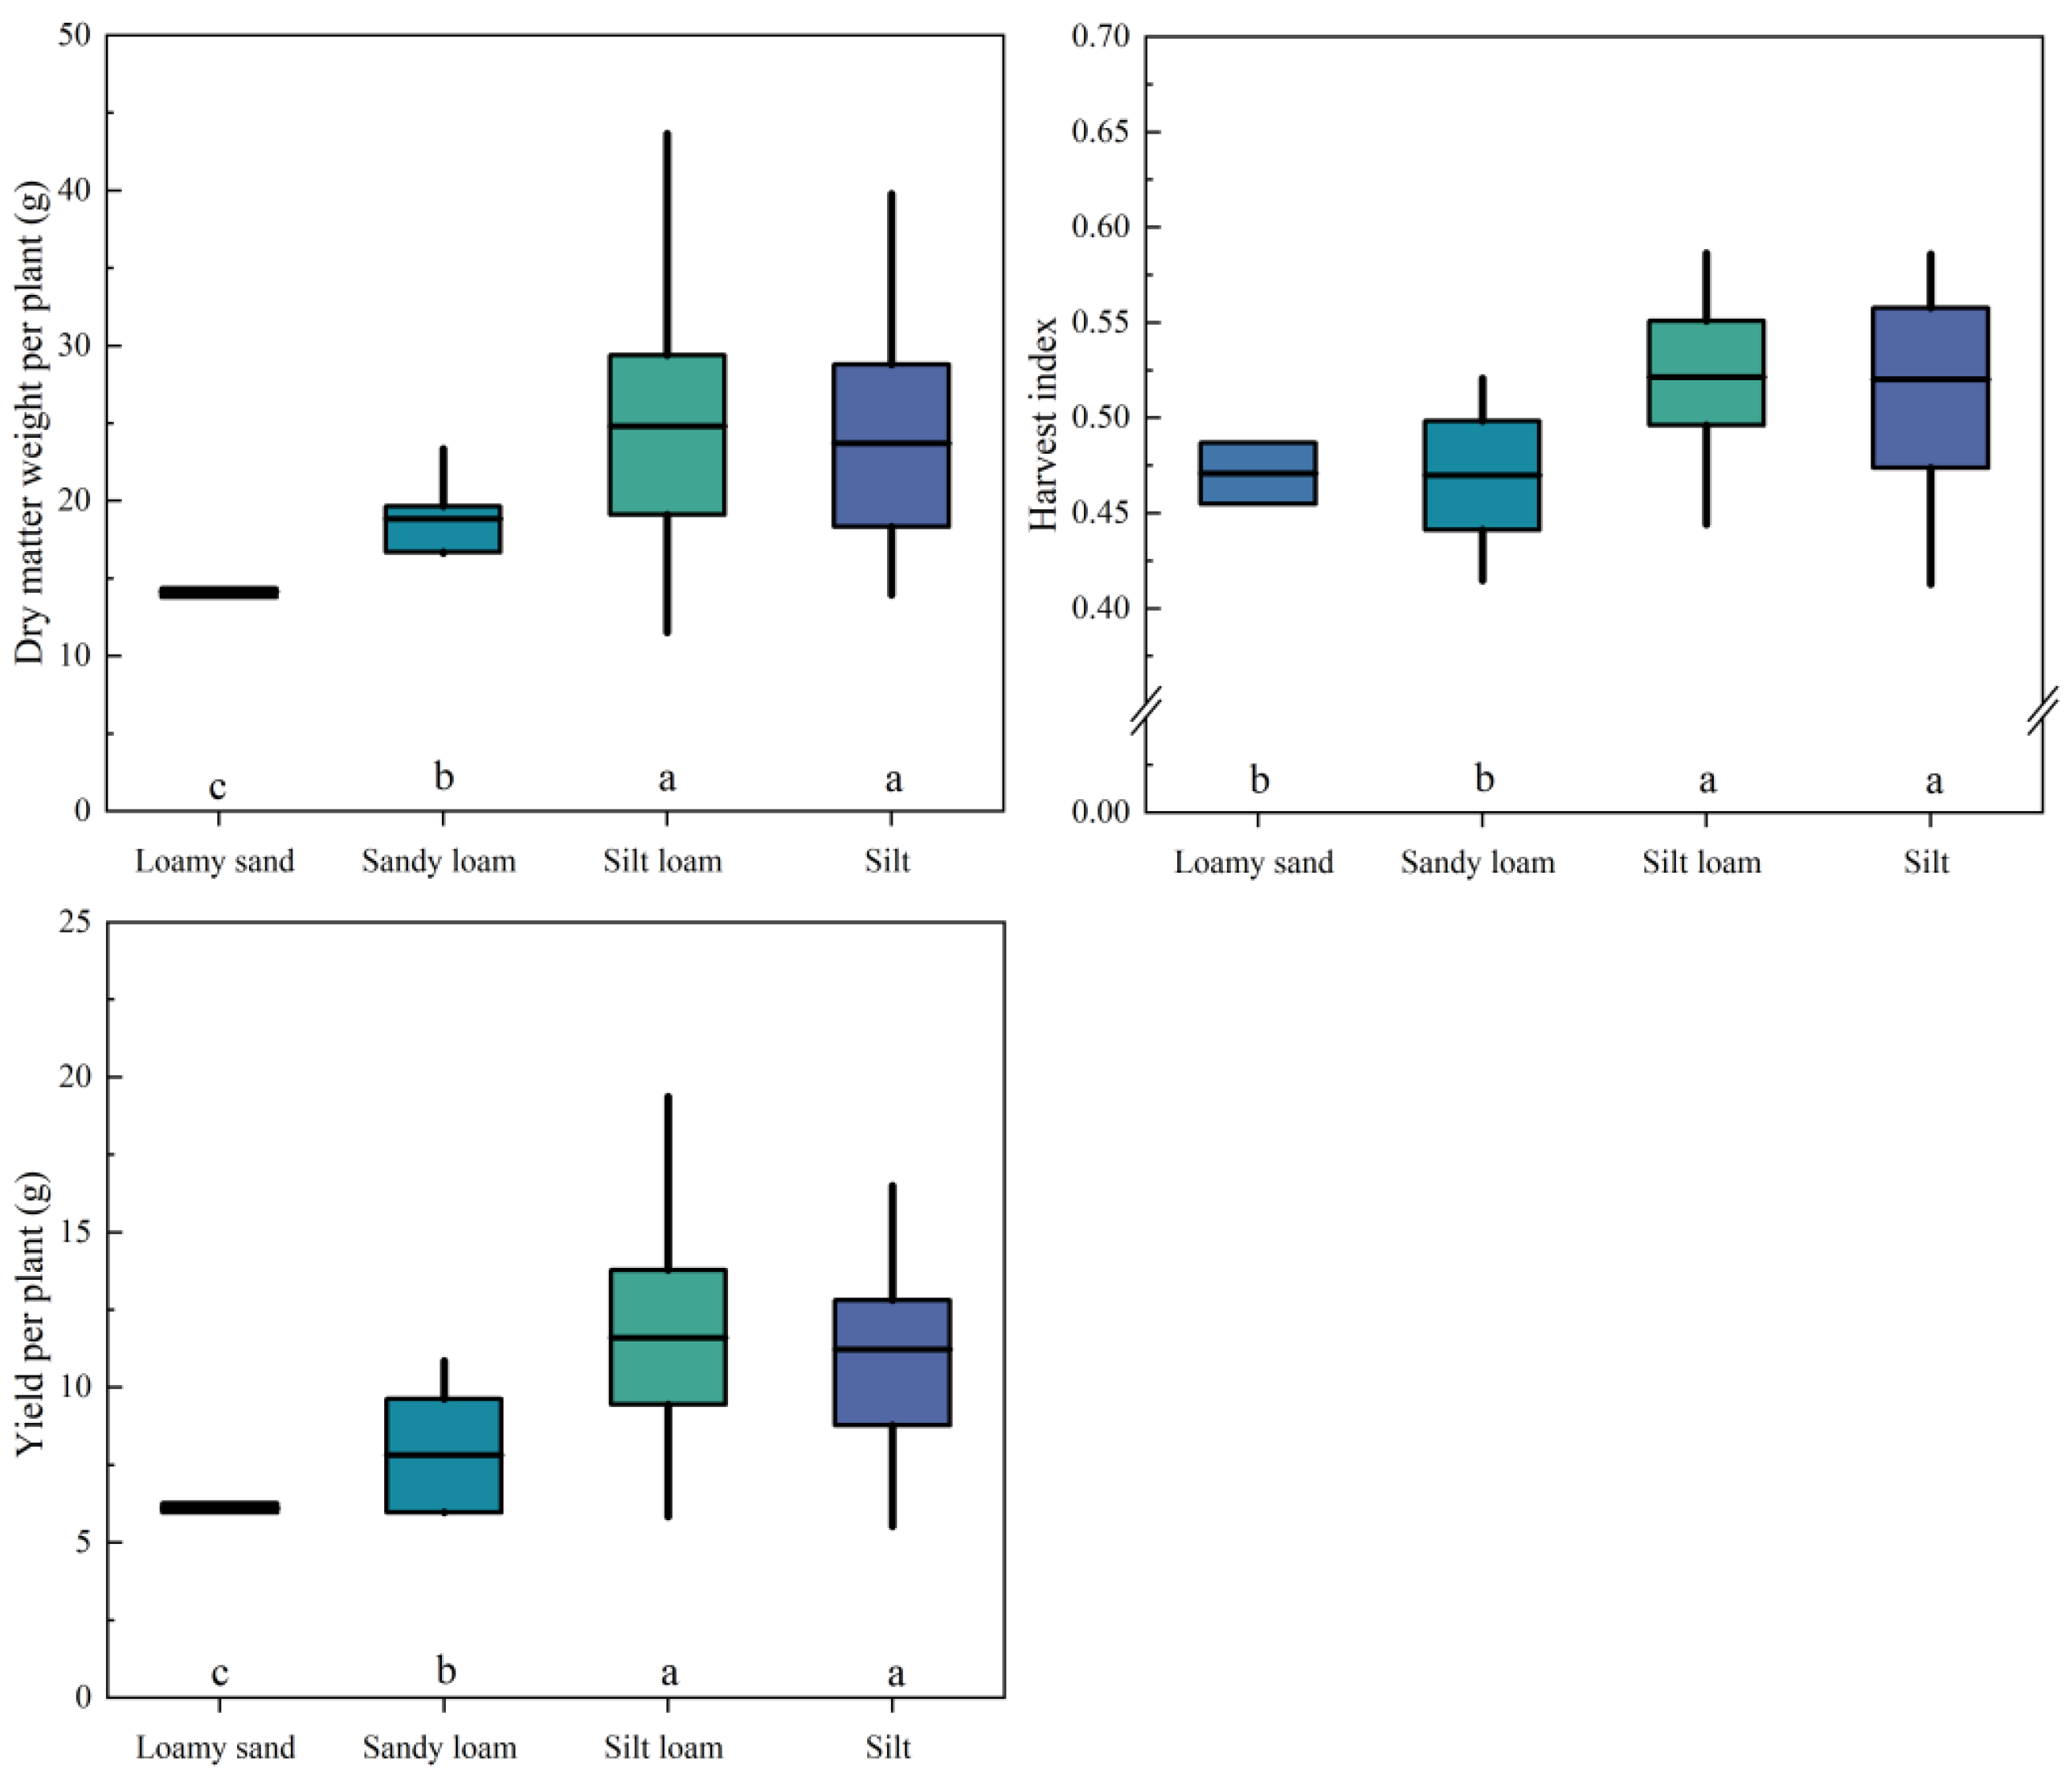
Dry matter not only is a reflection of excellent rice plant morphology but is closely related to high rice yield. The greatest plant dry matter accumulation was observed in silt loam, followed by silt soil, with no significant difference between the two textures of soils; both were significantly higher than that of the sandy loam and loamy sand, and the loamy sand had the lowest value, only 14.17 g per plant (Figure 5). Soil texture type also affected the distribution of dry matter accumulation in rice organs. In paddy soils of different textures, the HI in silt loam and silt soils was higher, indicating a greater allocation of dry matter by rice plants towards panicle development and the formation of rice grains. Rice yield was high in both silt loam and silt, with average yields of 11.60 g and 11.24 g per plant, respectively, followed by silt, with 7.8 g per plant, while loamy sand had the lowest yield of 6.10 g per plant, which was significantly lower than the other soils.
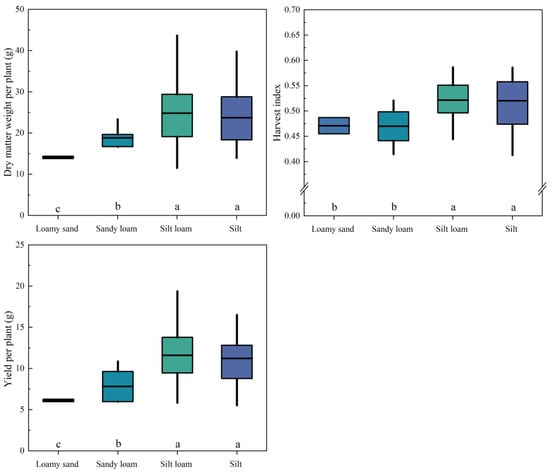
Figure 5.
Rice dry matter accumulation, harvest index, and yield in paddy soils of different textures. Different lowercase letters in the figure indicate that the data of different soil types have significant differences at p < 0.05.
3.5. Correlation Analysis of Soil Texture, Soil Physicochemical Properties, and Plant Nutrient Absorption
3.5.1. Relationship between Soil Texture and Soil Nutrient Content
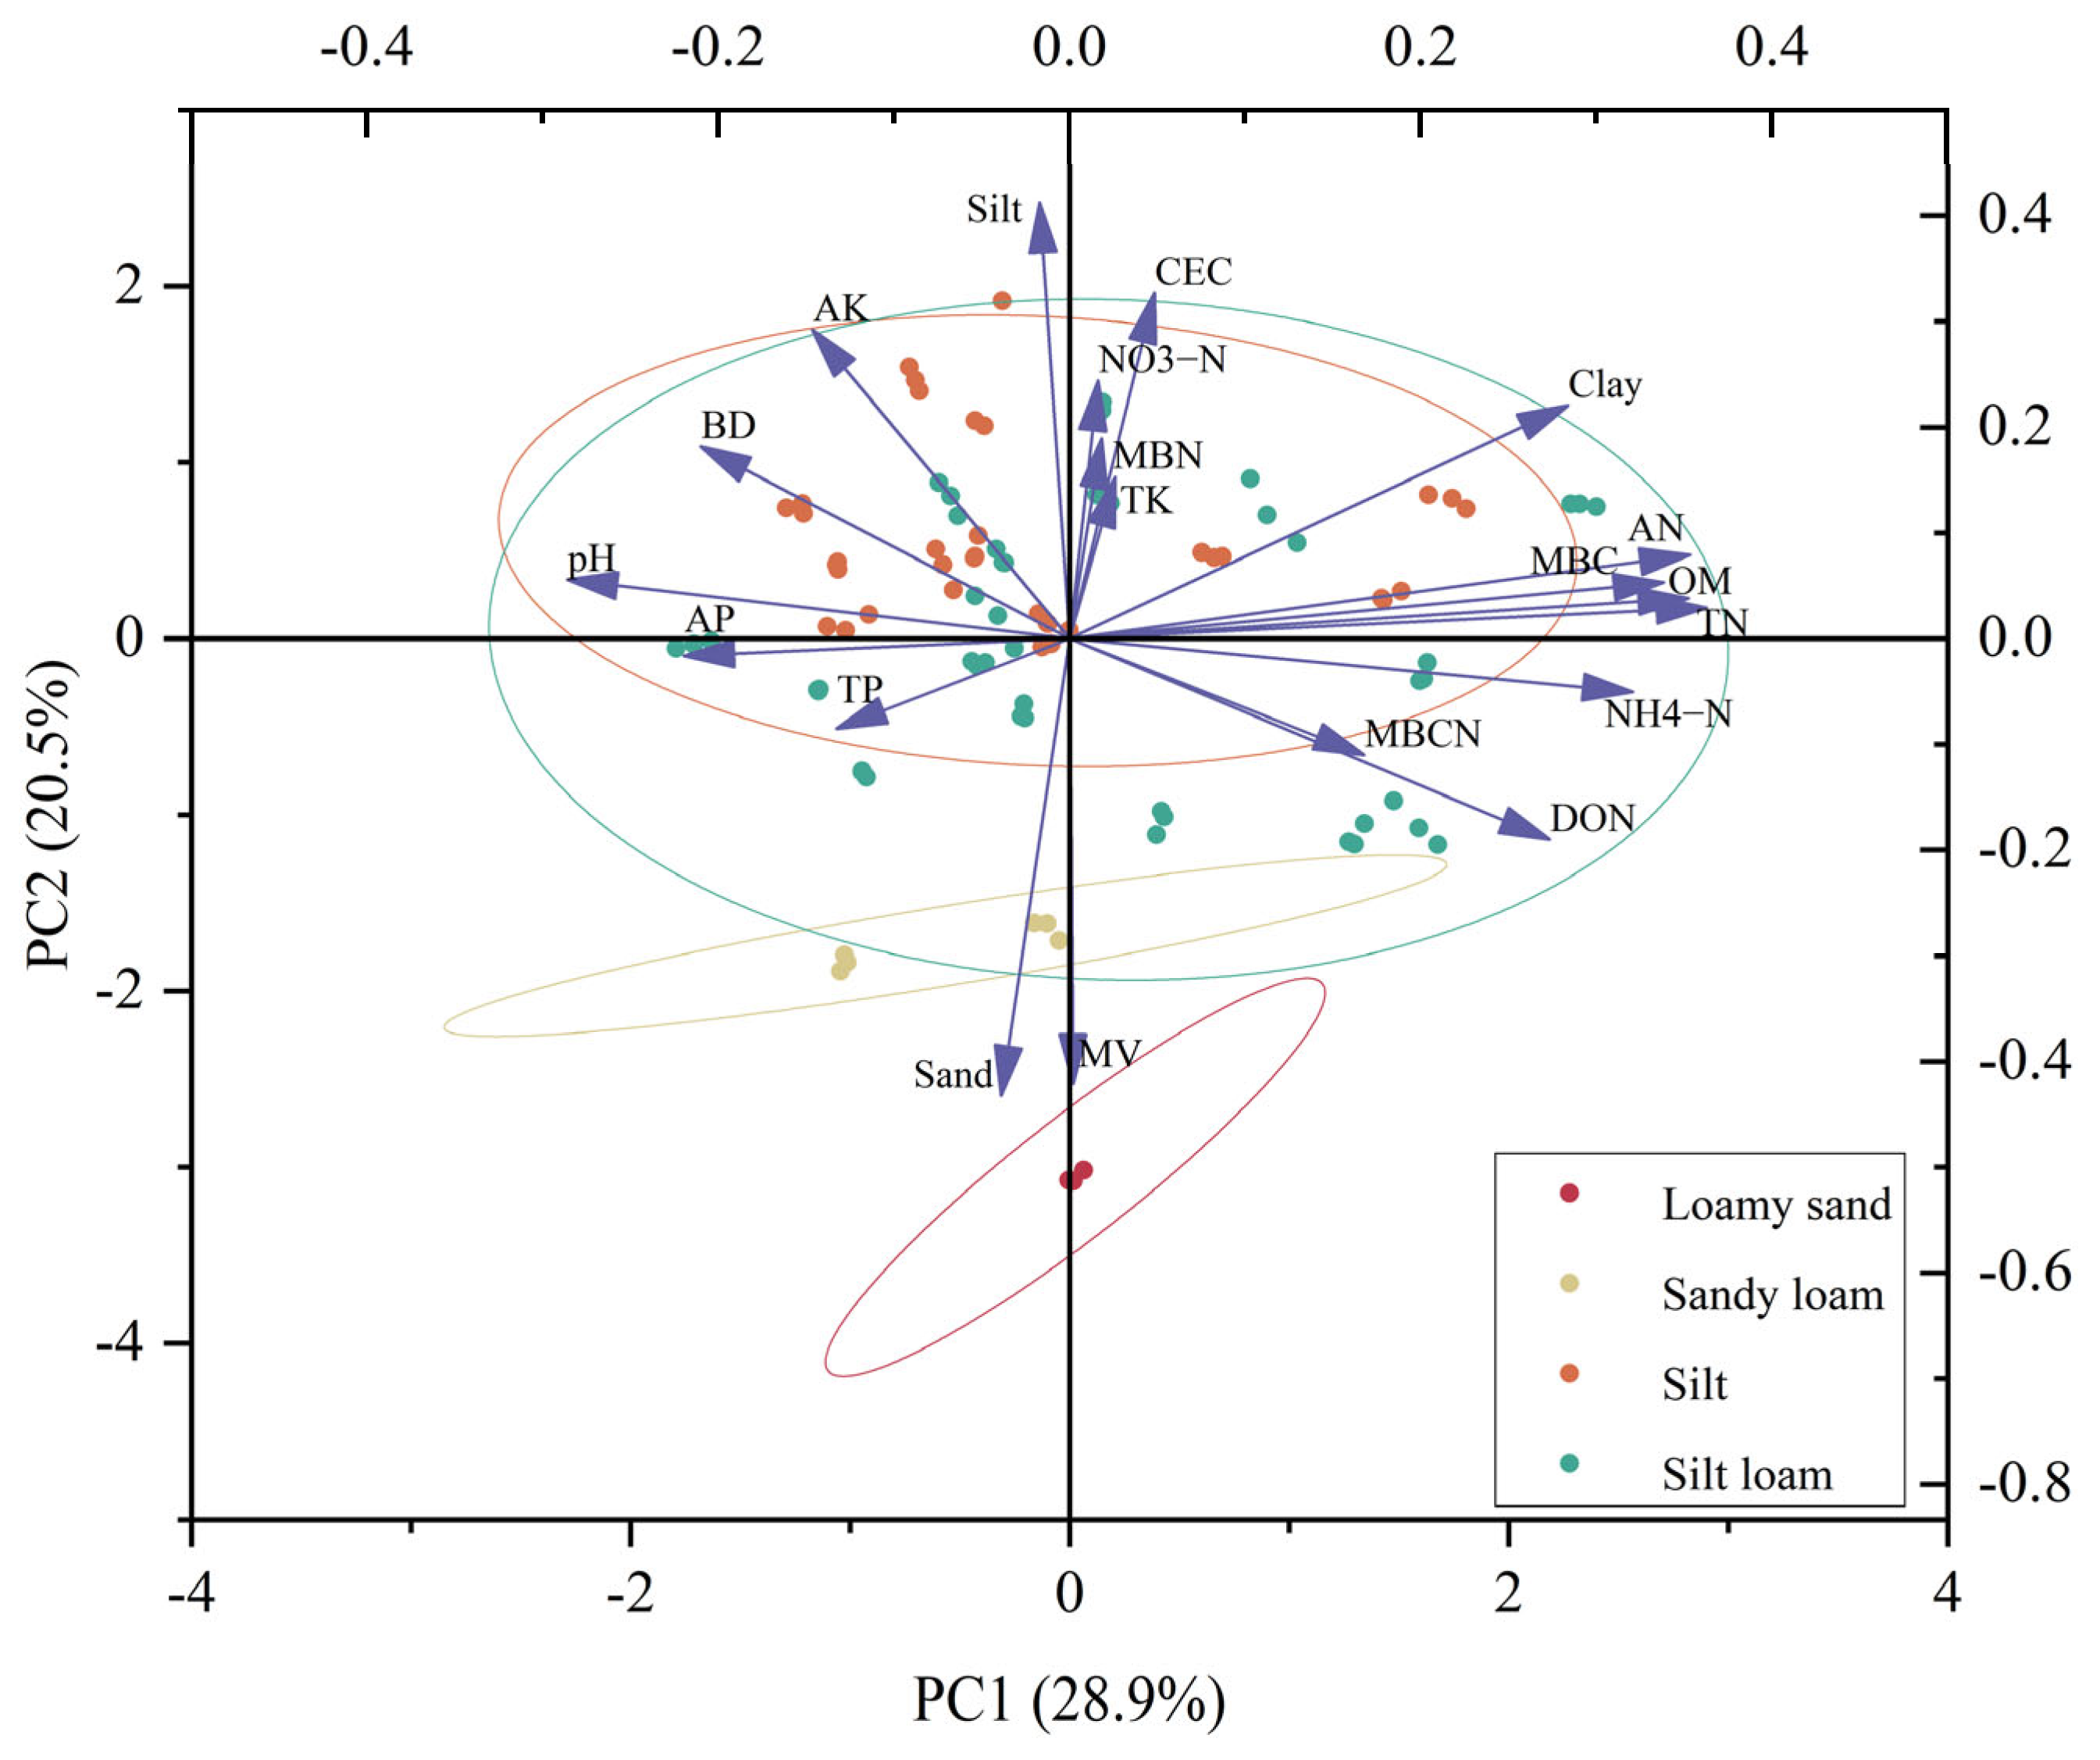
In order to further analyze the differences in physicochemical properties of soils with different textures and clarify the relationship between soil texture parameters and physicochemical properties, PCA was performed using the soil physicochemical properties (the above soil nutrient indicators, BD, pH, NH4+-N, NO3−-N, and DON in Table S2), microbial-related index (MBC, MBN, and MBC: N in Table S2), texture parameters (MV, sand content, silt content, and clay content), and physicochemical properties (BD and CEC) (Figure 6). The results showed that the principal component 1 (PC1), which mainly represented soil clay content, C and N mineralization and immobilization capacity (OM, TN, AN, DON, and NH4+-N content), as well as soil P content (TP and AP) and pH, accounted for 28.9% of the variation between soil samples. PC2, which mainly represented AK content and soil physical structure (MV, silt, and sand), accounted for 20.5% of the variation between samples. Soils of different texture types showed different clustering states in the PCA plot. There were correlations between soil texture parameters and physicochemical properties. OM, TN, AN, NH4+-N, and MBC exhibited significant aggregation, indicating that soil microbes play a vital role in the mineralization of C and N nutrients, and all of them were aggregated with clay, which suggests that among the different textured soils, clay was the most relevant to soil C and N nutrient status. In addition, soil P content significantly clustered with pH and showed a significant opposite trend to soil C and N nutrient status. The clustering of silt and AK suggested silt may have some influence on soil K content.
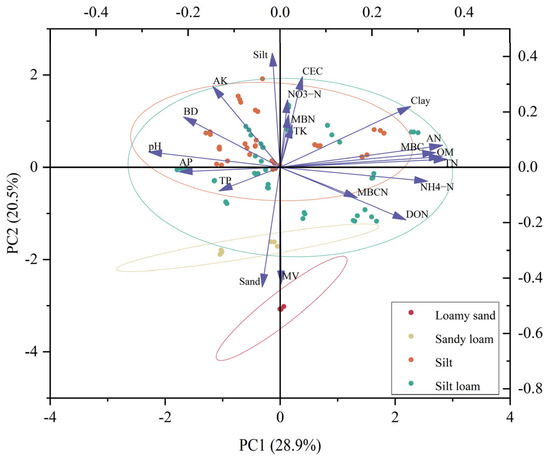
Figure 6.
Principal component analysis (PCA) of soil physicochemical properties, soil microbial status, and soil texture parameters of different texture paddy soils.
3.5.2. Relationships between Soil Physicochemical Properties and Rice Nutrient Absorption
Mantle’s test was used to analyze the correlation between soil physicochemical properties (including soil nutrient content, soil microbial status, and soil physical structure properties) and rice yield, dry matter, and nutrient accumulation (Figure 7). According to the correlation heatmap, there were relationships between soil clay content and soil physicochemical properties. Soil clay content exhibited a highly significant and positive correlation with soil C and N nutrient contents (OM, TN, AN, DON, NH4+-N, and NO3−-N), while it was highly significantly and negatively correlated with TP, AP, and pH. In addition, clay content substantially influenced the adhesion and exchange capacity of soil (positively correlated with CEC), as well as impacting the activity of soil microorganisms (positively correlated with MBC and MNC: N).
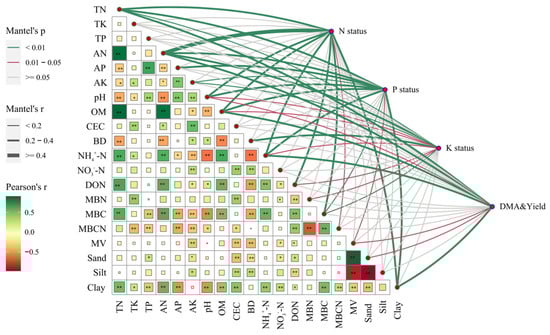
Figure 7.
Correlation analysis between soil physicochemical properties, soil microbial status, rice yield, and plant nutrient status. Mantel’s test examined the relationship between soil microorganisms, physicochemical properties, and rice agronomic traits. Among them, N, P, and K status served as indicators for the absorption and accumulation status of N, P, and K nutrients, including the N, P, and K contents of the rice straw and panicle, as well as the accumulation of N, P, and K per plant; DMA&Yield includes the accumulation of dry matter and yield per rice plant. In the correlation heatmap, pairwise comparisons were performed for influencing factors, with a color gradient denoting Pearson’s correlation coefficient. Correlation coefficients marked with “**” and “*” are significant at p < 0.01 and p < 0.05, respectively. Line width and the color correspond to the Mantel’s r and p statistic.
According to Mantel’s p and r statistics, plant N, P, and K status was significantly affected by soil OM, TN, pH, AN, and NH4+-N contents, and plant P and K status were affected by soil AP and AK content, respectively. The result indicated that the content of the soil available nutrients was the basis of rice nutrient status. In terms of soil microorganisms and soil texture, MBC was significantly correlated with plant N, P, and K status. Clay content exhibited significant correlations with plant N and P status but not with K status. Additionally, plant N status was regulated by MBC: N, and plant P status exhibited significant correlations with MV. Rice yield and dry matter accumulation also exhibited significant correlations with OM, TN, AN, NH4+-N, and clay, and they also were significantly correlated with MV and sand. Overall, soil nutrient status was influenced jointly by the soil structure and soil microorganisms, and rice grain yield and nutrient uptake were related to not only soil nutrient content but also soil texture.
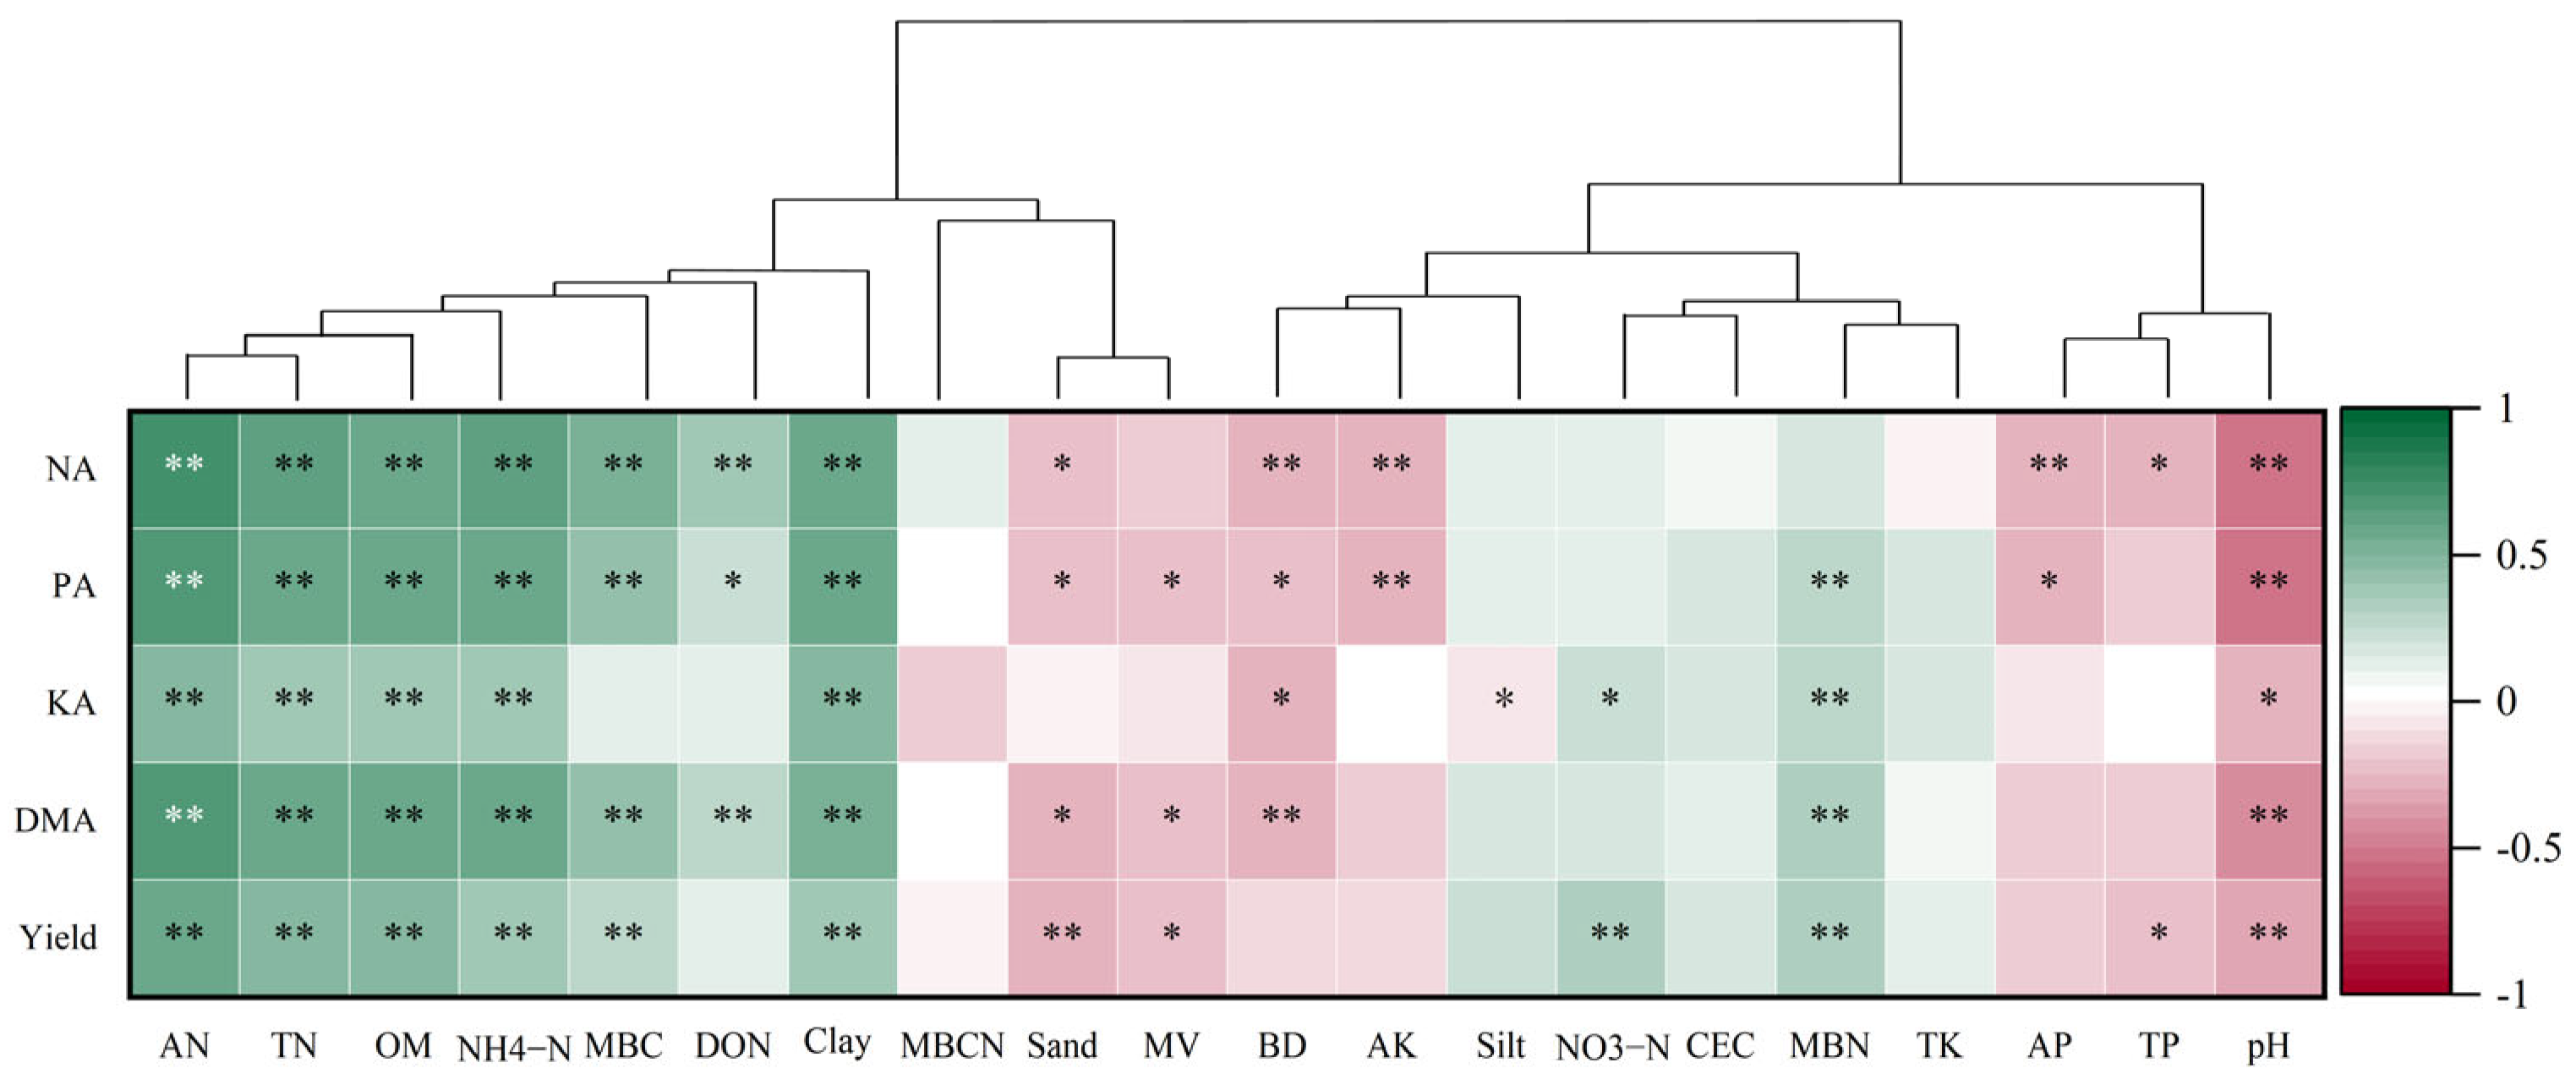
3.6. Key Factors Regulating Rice Yield and Nutrient Accumulation
Rice grain yield, dry matter, and nutrient accumulation were the most intuitive and practical indicators of the nutrient supply capacity of paddy soil. Cluster analysis of soil physicochemical properties was based on the correlation between these properties and rice yield, dry matter, and nutrient accumulation; the result showed that soil physicochemical properties could be divided into four clusters (Figure 8). The first cluster included traits such as OM, TN, AN, NH4+-N, MBC, DON, and clay, which characterized the status of soil C and N nutrients and showed a highly significant correlation with rice agronomic traits; sand, MV, and MBC: N could be categorized into another cluster; soil AP, TP, and pH could be classified into one cluster, where pH showed significant negative correlation with rice agronomic traits; other soil physicochemical properties could be grouped into one cluster.
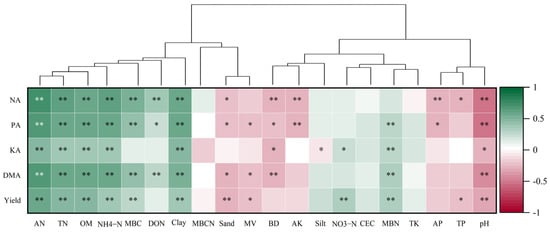
Figure 8.
Cluster analysis of soil microorganisms and physicochemical properties based on correlation with rice agronomic traits. Among them, NA, PA, and KA represent the accumulation of N, P, and K, respectively; DMA represents the dry matter accumulation. The color gradient of the squares denotes Pearson’s correlation coefficient. Correlation coefficients marked with “**” and “*” are significant at p < 0.01 and p < 0.05, respectively.
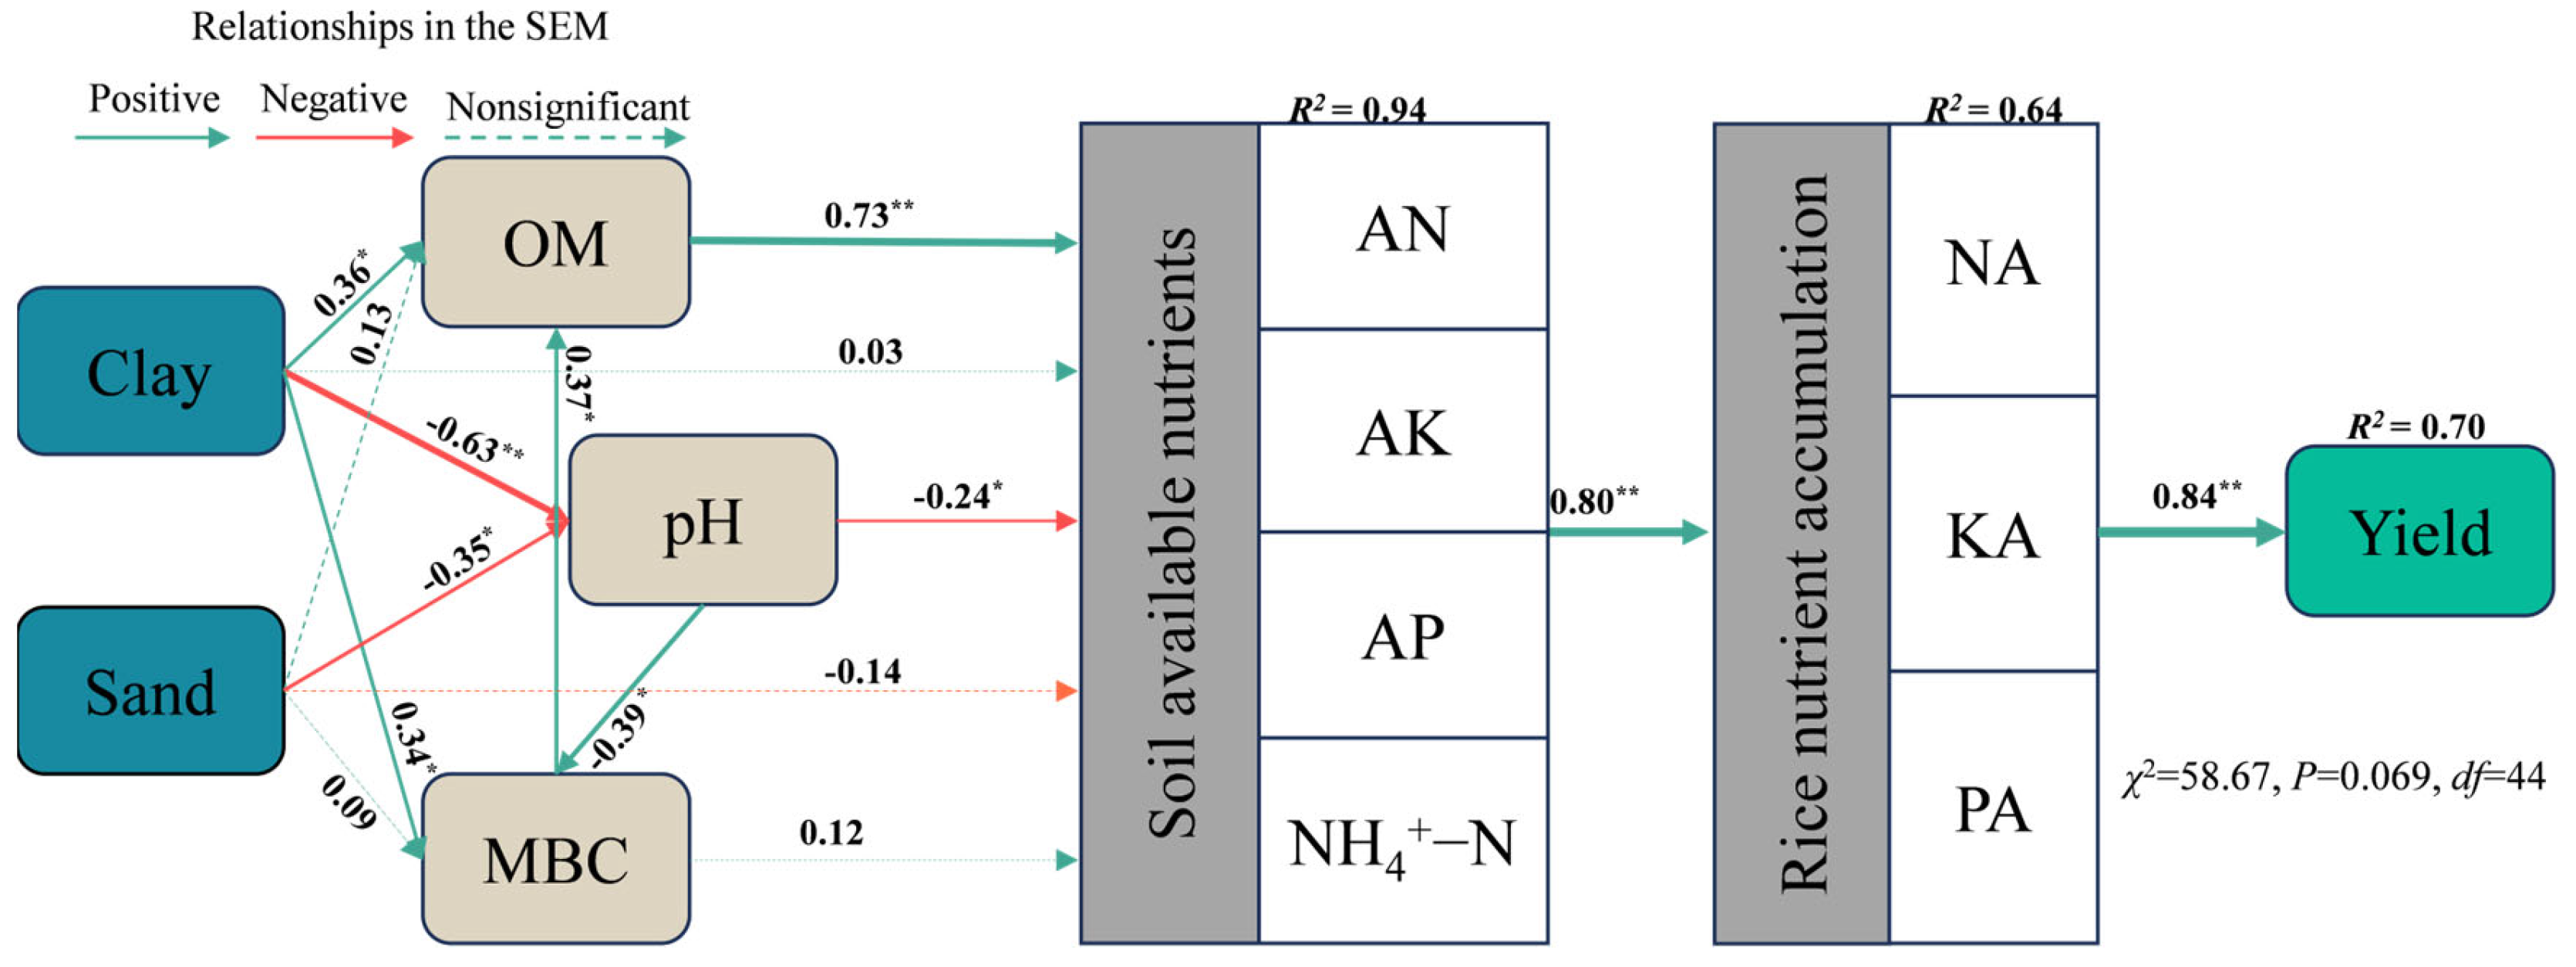
The structural equation model (SEM) was constructed to explore the direct and indirect effects of the above highly correlated soil environmental factors on rice yield and nutrient accumulation (Figure 9). SEM explained 64% of the variance in rice nutrient accumulation and 70% of the variance in yield through the transformation status of soil available nutrients, while 94% of the variation in the soil available nutrients was explained by traits such as OM, pH, and MBC. The results of SEM indicated that soil available nutrient content was mainly influenced by soil OM, followed by pH. Although soil texture parameters had no direct influence on soil available nutrient content. Both sand and clay indirectly affect soil available nutrient content by negatively affecting the pH, while clay also indirectly affects soil available nutrient content by positively influencing MBC and OM, thus confirming that soil texture not only influences the physicochemical properties of soil but is also an important factor affecting soil microbial activities and organic matter mineralization.

Figure 9.
Structural equation model (SEM) showing the direct and indirect effects of soil texture parameters, soil microorganisms, and physicochemical properties on rice agronomic traits. The green and red arrows in the SEM indicate positive and negative relationships, respectively. Continuous and dashed arrows indicate significant and nonsignificant relationships, respectively. Numbers at arrows are standardized path coefficients. Correlation coefficients marked with “**” and “*” are significant at p < 0.01 and p < 0.05, respectively. The width of the arrows is proportional to the effect size of the relationship. R2 values denote the proportion of variance explained for each variable.
4. Discussion
4.1. Nutrient Characteristics of Paddy Soil with Different Textures
The effect of soil texture on soil nutrients is mainly caused by changes in soil environmental factors, such as soil hydraulic properties, water-holding capacity, pore composition, and distribution, which affect soil microbial system composition, activity, and function, thereby impacting nutrient cycling [32,33,34]. Parton et al. [35] considered that soil texture is the main controlling factor for the mineralization and immobilization of OM, and the ratio of silt and clay can control the stability of insoluble organic matter. Rastetter et al. [36] combined soil texture with moisture content as the main variable regulating microbial activity and nutrient cycling. Raich et al. [37] also proposed that changes in soil texture could affect soil nutrient status by affecting the functionality of microorganisms. In our experiment, 31 soil samples from major rice-producing provinces in China were collected and used as test soil samples, which were classified into four types of soil texture according to the USDA soil texture classification criteria; the results of the analysis of the nutrient content of four types of paddy soil showed that the four textures differed in many nutrient indexes. In addition, considering the overall pattern of soil physicochemical properties, the PCA of soil physicochemical properties, soil microbial status, and soil texture factors of different texture paddy soils also showed that the difference in nutrient content and physicochemical properties between soils can be reflected in soil texture. However, because silty loam and silt soil belong to the same subclass of soil, many soil samples were distributed at the texture delineation boundaries in the triangular coordinate map (Figure 3); the distribution areas of silty loam and silt paddy soil overlapped in the PCA plot, which made them difficult to differentiate on the PCA plot.
Soil texture is the main factor controlling plant root development and soil biodiversity, affecting the soil chemical cycle and regulating soil fertility [38]. The relationship between soil physicochemical properties and texture depends on the degree of soil disturbance and the time of recovery [39]. In paddy fields with frequent soil disturbances, the effects of soil texture on different nutrient indexes were different. Jian et al. [30] explored the nutrient mineralization and immobilization capacity of four types of paddy soil and found that purple clayey soil had the strongest nitrogen sequestration capacity, granitic sandy soil had the worst nitrogen sequestration capacity, and there was no significant difference among the four types of soil in phosphorus immobilization capacity. The results of our study were similar to the above studies; we found that there were differences in soil nutrients in soils with different soil textures; in all soil types except loamy sand, soil OM, TN, and TK contents increased with increasing clay content, while soil TP content was highest in sandy loam. Among soil available nutrients, the highest AN content was found in silt loam with the highest clay content. AK content increased with silt content and was highest in silt soil. The highest AP content was found in sandy loam. The difference might be attributed to the different adsorption and desorption conditions of different available nutrients in the soil. In addition, soil CEC increased with increasing soil clay content, which was similar to the results of previous studies [40,41].
4.2. The Relationship between Soil Particle Size and Soil Nutrient Content
The correlation analysis of the physicochemical traits of 31 paddy soils indicated that the clay content of paddy soil was significantly positively correlated with the soil TN, AN, and OM contents, which has been reported in different ecosystems, as the colloidal nature of the secondary minerals contained in the clay particles and the larger surface area favor the attachment and accumulation of organic matter and nitrogen [11,42]. Soil TP and AP contents were negatively correlated with clay content, indicating that the soil phosphorus cycle was independent of the organic carbon and nitrogen cycles, which might be due to differences in microbial mineralization and immobilization pathways, as well as the difference in microbial regulation of C, N and P homeostasis and immobilization [43,44]. Previous studies have also observed that the soil AP content in sandy soil is significantly higher than that in loam soil and is positively correlated with sand content [13,45,46]. Mengel et al. [47] reported that silt and clay play an important role in the supply of plant potassium in loess-derived soils with high mica content. Zubillaga et al. [48] showed that silt particles could contribute up to 52% to soil potassium content in some soils. Li et al. [49] reported that soil silt was significantly negatively correlated with TK content but significantly positively correlated with AK. Our results showed similar findings; the AK content was significantly and positively correlated with the silt content, which might be attributed to the special mineral composition and high specific surface area of silt; this leads to the diffusion and migration of available nutrients slowing, allowing accumulation, especially under conditions of high soil moisture, such as paddy soil [47,50]. In addition, the CEC of tillage layer soil was positively correlated with soil clay and silt content, which was similar to the results of previous studies [29,34,51], as the increase in clay content increased the specific surface area of soil colloids and soil charge, which in turn improved the adsorption capacity of the soil for ions.
4.3. The Nutrient Absorption and Yield of Rice Grown in Paddy Soil with Different Textures
The absorption and accumulation of nutrients by rice plants is not only the most direct measure of soil nutrient supply capacity but also the basis for the morphological construction and yield formation in rice production [52,53,54,55]. Different soil physicochemical conditions could affect the cycling of soil nutrients and the release of available nutrients, thereby influencing plant nutrient absorption. Zheng et al. [56] showed that soil texture affected N accumulation and distribution in flue-cured tobacco, affecting as well as the soil bacterial community. Wang et al. [57] also showed that both maize yield and nitrogen accumulation increased significantly with the increase of soil clay content under various irrigation practices. However, Li et al. [58] highlighted that maize yield and nitrogen accumulation in loamy soil were significantly higher than in clay and sandy soil. The differences among these results might be caused by the differences in planting methods and meteorological conditions in the planting regions. At a larger scale of planting regions, Chen et al. [59] conducted a meta-analysis of data from various integrated rice–animal co-culture systems on a global scale and concluded that the soil clay content played a key role in predicting rice yield. Asai et al. [60] used the Bayesian approach to quantitatively assess the impact of fertilizer on rice yields in Africa, and the results indicated that clay had a significant effect on the fertilizer efficiency of rice, with high clay soils exhibiting higher yield increases than low clay soils. In this study, we compared the nutrient accumulation of the same rice variety grown in 31 different soil samples without fertilizer; the results showed that the accumulation of N, P, and K in rice was the highest in silt loam and silt soils with high clay content, followed by sandy loam, and was the lowest in loamy sand soil. Additionally, soil texture also affected dry matter accumulation in rice plants. As the clay content of the soil decreased, the dry matter accumulation decreased in the order of silt loam > silt > loamy sand > sandy loam soils, and the decrease in clay content also decreased the harvest index, thereby resulting in a reduction in rice yield.
The supply of available nutrients in paddy soil was the direct source of nutrients absorbed by rice plants, and the rice nutrients derived from soil accounted for over 70% of the rice total nutrient absorption [23,24,25]. As shown in Mantel’s test, rice yield and dry matter accumulation were significantly and positively correlated with soil clay content and significantly and negatively correlated with soil sand content. By combining SEM analysis, we could better explain the impact pathways of soil texture on rice yield and nutrient accumulation; the results showed that sand could have a negative effect on the available nutrient content of the soil mainly through its effect on soil pH, which was unfavorable to rice dry matter accumulation and yield formation. On the other hand, clay has colloidal properties and a larger specific surface area, which can positively regulate soil available nutrient content by positively influencing the soil organic matter and soil microbial activity, thus promoting the rice accumulation of nutrients and the formation of yield.
5. Conclusions
The difference in soil texture affects the nutrient content of paddy soil, which in turn affects the nutrient absorption and yield formation of rice. Clay in paddy fields increases the content of soil organic matter and the amount of soil microorganisms, thereby enhancing soil fertility, facilitating the absorption of nutrients by rice, and increasing yield. Silt was conducive to the release of readily available potassium, while sand particles had a negative effect on soil available nutrients by influencing soil pH. The silt loam and silt paddy soil with a fine texture exhibits higher CEC and conservation ability of nutrients, leading to improved nutrient content of organic matter and nitrogen in the tillage layer. This was beneficial for the absorption and accumulation of nutrients by rice during cultivation, as well as for the distribution of dry matter to the panicle, thereby promoting the rice yield. These results reflected the differences in the soil base nutrient supply capacity of different textured soils under no mineral fertilizer; however, in actual rice production, the application of mineral fertilizers is essential for high rice yields. Soil physicochemical properties can affect the transport and transformation of mineral fertilizers, while exogenous nutrient inputs can also disrupt the release of soil base nutrients. The response of soil texture to the mineral fertilizer use efficiency in rice production needs to be further explored.
Supplementary Materials
The following supporting information can be downloaded at: https://www.mdpi.com/article/10.3390/agronomy14061339/s1, Figure S1: Rice N, P, and K content of different organs in paddy soils of different textures. Different lowercase letters in the figure indicate that the data of different soil types have significant differences at p < 0.05; Table S1: Geographical distribution and soil type of sampling sites in different sampling paddy fields; Table S2: The contents of partial available N and microbiological indicators of different textures of soils. Different lowercase letters indicate that the data of different soil types in the same column are significantly different at p < 0.05. ** and * indicate significance at p = 0.01 and at p = 0.05, respectively.
Author Contributions
C.Y.: conceptualization, writing—original draft, writing—review and editing, and investigation. G.Z.: writing—review and editing, and investigation. Y.T. and Y.X.: investigation. G.C. and C.X.: methodology. X.Z.: project administration. S.C. and Y.L.: data curation. D.W.: conceptualization, data curation, writing—review and editing, and funding acquisition. All authors have read and agreed to the published version of the manuscript.
Funding
This study is supported by the Zhejiang “Ten thousand talents” plan science and technology innovation leading talent project (2020R52035), the National Rice Industry Technology System (CARS-01-31), and the Agricultural Science and Technology Innovation Program (CAAS-ZDRW202001).
Data Availability Statement
Data from this study are included in the article/Supplementary Materials; further inquiries can be directed to the corresponding author.
Conflicts of Interest
The authors declare that they have no known competing financial interests or personal relationships that could have appeared to influence the work reported in this paper.
References
- Juma, N.G. Interrelationships between soil structure/texture, soil biota/soil organic matter and crop production. Geoderma 1993, 57, 3–30. [Google Scholar] [CrossRef]
- Richer-de-Forges, A.C.; Arrouays, D.; Chen, S.C.; Dobarco, M.R.; Libohova, Z.; Roudier, P.; Minasny, B.; Bourennane, H. Hand-feel soil texture and particle-size distribution in central France. Relationships and implications. Catena 2022, 213, 15. [Google Scholar] [CrossRef]
- Takahashi, T.; Nakano, K.; Nira, R.; Kumagai, E.; Nishida, M.; Namikawa, M. Conversion of soil particle size distribution and texture classification from ISSS system to FAO/USDA system in Japanese paddy soils. Soil Sci. Plant. Nutr. 2020, 66, 407–414. [Google Scholar] [CrossRef]
- Wu, K.N.; Zhao, R. Soil texture classification and its application in China. Acta Pedol. Sin. 2019, 56, 227–241, (In Chinese with English Abstract). [Google Scholar]
- Dobarco, M.R.; Bourennane, H.; Arrouays, D.; Saby, N.P.A.; Cousin, I.; Martin, M.P. Uncertainty assessment of GlobalSoilMap soil available water capacity products: A French case study. Geoderma 2019, 344, 14–30. [Google Scholar] [CrossRef]
- Rudiyanto Minasny, B.; Chaney, N.W.; Maggi, F.; Giap, S.G.E.; Shah, R.M.; Fiantis, D.; Setiawan, B.I. Pedotransfer functions for estimating soil hydraulic properties from saturation to dryness. Geoderma 2021, 403, 115194. [Google Scholar] [CrossRef]
- Matus, F.J.; Lusk, C.H.; Maire, C.R. Effects of soil texture, carbon input rates, and litter quality on free organic matter and nitrogen mineralization in Chilean rain forest and agricultural soil. Commun. Soil Sci. Plant Anal. 2007, 39, 187–201. [Google Scholar] [CrossRef]
- Matus, F.J. Fine silt and clay content is the main factor defining maximal C and N accumulations in soils: A meta-analysis. Sci. Rep. 2021, 11, 6438. [Google Scholar] [CrossRef] [PubMed]
- Li, G.L.; Pang, X.M. Effect of land-use conversion on C and N distribution in aggregate fractions of soils in the southern Loess Plateau, China. Land Use Policy 2010, 27, 706–712. [Google Scholar] [CrossRef]
- Six, J.; Conant, R.T.; Paul, E.A.; Paustian, K. Stabilization mechanisms of soil organic matter: Implications for C-saturation of soils. Plant Soil 2002, 241, 155–176. [Google Scholar] [CrossRef]
- Gentile, R.M.; Vanlauwe, B.; Six, J. Integrated soil fertility management: Aggregate carbon and nitrogen stabilization in differently textured tropical soils. Soil Biol. Biochem. 2013, 67, 124–132. [Google Scholar] [CrossRef]
- Rakhsh, F.; Golchin, A. Investigation of mineralization of organic nitrogen under the influence of type, content of clay and exchangeable cations. J. Water Soil 2018, 31, 1691–1711. [Google Scholar]
- Wang, H.J.; Shi, X.Z.; Yu, D.S.; Weindorf, D.C.; Huang, B.; Sun, W.X.; Ritsema, C.J.; Milne, E. Factors determining soil nutrient distribution in a small-scaled watershed in the purple soil region of Sichuan Province, China. Soil Tillage Res. 2009, 105, 300–306. [Google Scholar] [CrossRef]
- Mao, H.R.; Cotrufo, M.F.; Hart, S.C.; Sullivan, B.W.; Zhu, X.F.; Zhang, J.C.; Liang, C.; Zhu, M.Q. Dual role of silt and clay in the formation and accrual of stabilized soil organic carbon. Soil Biol. Biochem. 2024, 192, 109390. [Google Scholar] [CrossRef]
- Kaiser, K.; Guggenberger, G. Mineral surfaces and soil organic matter. Eur. J. Soil Sci. 2010, 54, 219–236. [Google Scholar] [CrossRef]
- Scott, N.A.; Cole, C.V.; Elliott, E.T.; Huffman, S.A. Soil textural control on decomposition and soil organic matter dynamics. Soil Sci. Soc. Am. J. 1996, 60, 1102–1109. [Google Scholar] [CrossRef]
- Fohrafellner, J.; Keiblinger, K.M.; Zechmeister-Boltenstern, S.; Murugan, R.; Spiegel, H.; Valkama, E. Cover crops affect pool specific soil organic carbon in cropland—A meta-analysis. Eur. J. Soil Sci. 2024, 75, 13472. [Google Scholar] [CrossRef]
- Deng, N.Y.; Grassini, P.; Yang, H.S.; Huang, J.L.; Cassman, K.G.; Peng, S.B. Closing yield gaps for rice self-sufficiency in China. Nat. Commun. 2019, 10, 1725. [Google Scholar] [CrossRef]
- Peng, S.B.; Tang, Q.Y.; Zou, Y.B. Current status and challenges of rice production in China. Plant Prod. Sci. 2009, 12, 3–8. [Google Scholar] [CrossRef]
- National Bureau of Statistics. China Statistical Yearbook; China Statistical Press: Beijing, China, 2021. Available online: https://www.stats.gov.cn/zsk/snapshoot?reference=3c8ef061923f94fcc7a8b7f9dc6cbc75&siteCode=tjzsk (accessed on 17 June 2024).
- Li, X.X.; Cao, J.; Huang, J.L.; Xing, D.Y.; Peng, S.B. Effects of topsoil removal on nitrogen uptake, biomass accumulation, and yield formation in puddled-transplanted rice. Field Crop. Res. 2021, 265, 108130. [Google Scholar] [CrossRef]
- Gathala, M.K.; Ladha, J.K.; Kumar, V.; Saharawat, Y.S.; Kumar, V.; Kumar, V.; Sharma, P.K. Effect of tillage and crop establishment methods on physical properties of a medium-textured soil under a seven-year rice-wheat rotation. Soil Sci. Soc. Am. J. 2011, 75, 1851–1862. [Google Scholar] [CrossRef]
- Hou, Y.P.; Xu, X.P.; Kong, L.L.; Zhang, L.; Wang, L.C. The combination of straw return and appropriate K fertilizer amounts enhances both soil health and rice yield in Northeast China. Agron. J. 2021, 113, 5424–5435. [Google Scholar] [CrossRef]
- Xu, X.P.; Xie, J.G.; Hou, Y.P.; He, P.; Pampolino, M.F.; Zhao, S.C.; Qiu, S.J.; Johnston, A.M.; Zhou, W. Estimating nutrient uptake requirements for rice in China. Field Crop. Res. 2015, 180, 37–45. [Google Scholar] [CrossRef]
- Ye, C.; Ma, H.Y.; Huang, X.; Xu, C.M.; Chen, S.; Chu, G.; Zhang, X.F.; Wang, D.Y. Effects of increasing panicle-stage N on yield and N use efficiency of indica rice and its relationship with soil fertility. Crop J. 2022, 10, 1784–1797. [Google Scholar] [CrossRef]
- Hu, Q.C.; Lu, C.D. Selectivity of potassium adsorption by soils. Acta Pedol. Sin. 2002, 39, 707–713, (In Chinese with English Abstract). [Google Scholar]
- Yu, T.Y.; Peng, H.C.; Tang, H.M.; Ren, T.Z.; Yang, G.L.; Li, Y.Y.; Xiao, X.P.; Tang, W.G.; Chen, F. Soil enzyme activities and their relationships with soil physico-chemical properties in paddy soils derived from different parent materials under double-rice cropping system in south China. Acta Pedol. Sin. 2013, 50, 1043–1047, (In Chinese with English Abstract). [Google Scholar]
- Li, X.Y.; Sun, J.; Wang, H.H.; Li, X.; Wang, J.; Zhang, H.W. Changes in the soil microbial phospholipid fatty acid profile with depth in three soil types of paddy fields in China. Geoderma 2017, 290, 69–74. [Google Scholar] [CrossRef]
- Rao, B.K.R.; Siddaramappa, R. Influence of tree leaf litters and paddy straw on the nutrient availability in two paddy soils of South Karnataka, India. Arch. Agron. Soil Sci. 2007, 53, 405–422. [Google Scholar]
- Jian, Y.; Zhu, J.; Peng, H.; Xiong, L.P.; Cai, J.P.; Ji, X.H. Adsorption and desorption characteristics of nitrogen and phosphorus in paddy soils from different parent materials. Agric. Sci. Technol. 2021, 22, 26–36. [Google Scholar]
- Lu, R. Soil Chemical Analysis Method for Agriculture; China Agriculture Science and Technique Press: Beijing, China, 2000. [Google Scholar]
- Lilly, A.; Lin, H.S. Using soil morphological attributes and soil structure in pedotransfer functions. Dev. Soil Sci. 2004, 30, 115–141. [Google Scholar]
- Oades, J.M.; Waters, A.G. Aggregate hierarchy in soils. Soil Res. 1991, 29, 815–828. [Google Scholar] [CrossRef]
- Plante, A.F.; Conant, R.T.; Stewart, C.E.; Paustian, K.; Six, J. Impact of soil texture on the distribution of soil organic matter in physical and chemical fractions. Soil Sci. Soc. Am. J. 2006, 70, 87–296. [Google Scholar] [CrossRef]
- Parton, W.J.; Schimel, D.S.; Cole, C.V.; Ojima, D.S. Analysis of factors controlling soil organic matter levels in Great Plains grasslands. Soil Sci. Soc. Am. J. 1987, 51, 1173–1179. [Google Scholar] [CrossRef]
- Rastetter, E.B.; Ryan, M.G.; Shaver, G.R.; Melillo, J.M.; Nadelhoffer, K.J.; Hobbie, J.E.; Aber, J.D. A general biogeochemical model describing the responses of the C and N cycles in terrestrial ecosystems to changes in CO2, climate, and N deposition. Tree Physiol. 1991, 9, 101–126. [Google Scholar] [CrossRef] [PubMed]
- Raich, J.W.; Rastetter, E.B.; Melillo, J.M.; Kicklighter, D.W.; Steudler, P.A.; Peterson, B.J.; Grace, A.L.; Moore, B.; Vorosmarty, C.J. Potential net primary productivity in South America: Application of a global model. Ecol. Appl. 1991, 1, 399–429. [Google Scholar] [CrossRef] [PubMed]
- Silva, M.; Poly, F.; Guillaumaud, N.; van Elsas, J.D.; Salles, J.F. Fluctuations in ammonia oxidizing communities across agricultural soils are driven by soil structure and pH. Front. Microbiol. 2012, 3, 77. [Google Scholar]
- Shahadat, H.M.; Mustafizur, R.; Saiful, A.M.; Mizanur, R.M.; Solaiman, A.; Baset, M. Modelling of soil texture and its verification with related soil properties. Soil Res. 2018, 56, 421–428. [Google Scholar]
- Malone, B.; Searle, R. Updating the Australian digital soil texture mapping (Part 1*): Re-calibration of field soil texture class centroids and description of a field soil texture conversion algorithm. Soil Res. 2021, 59, 419–434. [Google Scholar] [CrossRef]
- Sessitsch, A.; Weilharter, A.; Gerzabek, M.H.; Kirchmann, H.; Kandeler, E. Microbial population structures in soil particle size fractions of a long-term fertilizer field experiment. Appl. Environ. Microbiol. 2001, 67, 4215–4224. [Google Scholar] [CrossRef] [PubMed]
- Hemkemeyer, M.; Dohrmann, A.B.; Christensen, B.T.; Tebbe, C.C. Bacterial preferences for specific soil particle size fractions revealed by community analyses. Front. Microbiol. 2018, 9, 149. [Google Scholar] [CrossRef] [PubMed]
- Bicharanloo, B.; Shirvan, M.B.; Dijkstra, F.A. Decoupled cycling of carbon, nitrogen, and phosphorus in a grassland soil along a hillslope mediated by clay and soil moisture. Catena 2022, 219, 10. [Google Scholar] [CrossRef]
- Brodlin, D.; Kaiser, K.; Hagedorn, F. Divergent patterns of carbon, nitrogen, and phosphorus mobilization in forest soils. For. Glob. Change 2019, 2, 66. [Google Scholar] [CrossRef]
- Wo, B.; Józefowska, A.; Likus-Cielik, J.; Chodak, M.; Pietrzykowski, M. Effect of tree species and soil texture on the carbon stock, macronutrient content, and physicochemical properties of regenerated postfire forest soils. Land Degrad. Dev. 2021, 32, 5227–5240. [Google Scholar]
- Zheng, Z.; Parent, L.E.; Macleod, J.A. Influence of soil texture on fertilizer and soil phosphorus transformations in Gleysolic soils. Can. J. Soil Sci. 2003, 83, 395–403. [Google Scholar] [CrossRef]
- Mengel, K.; Rahmatullah; Dou, H.R. Release of potassium from the silt and sand fraction of loess-derived soils. Soil Sci. 1998, 163, 805–813. [Google Scholar] [CrossRef]
- Zubillaga, M.M.; Conti, M. Importance of the textural fraction and its mineralogic characteristics in the potassium contents of different argentine soils. Commun. Soil Sci. Plan. 2008, 25, 479–487. [Google Scholar] [CrossRef]
- Li, Y.Q.; Ma, J.W.; Xiao, C.; Li, Y.J. Effects of climate factors and soil properties on soil nutrients and elemental stoichiometry across the Huang-Huai-Hai River Basin, China. J. Soils Sediments 2020, 20, 1970–1982. [Google Scholar] [CrossRef]
- Tian, L.M.; Zhao, L.; Wu, X.D.; Hu, G.J.; Fang, H.B.; Zhao, Y.H.; Sheng, Y.; Chen, J.; Wu, J.C.; Li, W.P.; et al. Variations in soil nutrient availability across Tibetan grassland from the 1980s to 2010s. Geoderma 2019, 338, 197–205. [Google Scholar] [CrossRef]
- Pelster, D.E.; Chantigny, M.H.; Angers, D.A.; Bertrand, N.; Macdonald, J.D.; Rochette, P. Can soil clay content predict ammonia volatilization losses from subsurface-banded urea in eastern Canadian soils? Can. J. Soil Sci. 2018, 98, 556–565. [Google Scholar] [CrossRef]
- Ma, J.Y.; Chen, T.T.; Lin, J.; Fu, W.M.; Feng, B.H.; Li, G.Y.; Li, H.B.; Li, J.C.; Wu, Z.H.; Tao, L.X.; et al. Functions of nitrogen, phosphorus and potassium in energy status and their influences on rice growth and development. Rice Sci. 2022, 29, 166–178. [Google Scholar]
- Rakotoson, T.; Senthilkumar, K.; Johnson, J.M.; Ibrahim, A.; Kihara, J.; Sila, A.; Saito, K. Estimating nutrient concentrations and uptake in rice grain in sub-Saharan Africa using linear mixed-effects regression. Field Crop. Res. 2023, 299, 108987. [Google Scholar] [CrossRef] [PubMed]
- Huang, S.H.; Pu, L.J.; He, G.L.; Wang, X.Q.; Chen, D.J.; Xie, X.F.; Qie, L.; Dan, Y.; Zhang, R.; Gong, Z.S.; et al. Silicon in soil and its interaction with nitrogen, phosphorus, and potassium nutrients on rice yield: A case study of paddy fields in the Taihu Lake region, China, without a history of silicon fertilization. Soil Tillage Res. 2024, 238, 106027. [Google Scholar] [CrossRef]
- Xu, Z.; He, P.; Yin, X.Y.; Struik, P.C.; Ding, W.C.; Liu, K.L.; Huang, Q.H. Simultaneously improving yield and nitrogen use efficiency in a double rice cropping system in China. Eur. J. Agron. 2022, 137, 126513. [Google Scholar] [CrossRef]
- Zheng, M.Y.; Zhu, P.; Zheng, J.Y.; Xue, L.; Zhu, Q.F.; Cai, X.J.; Cheng, S.; Zhang, Z.F.; Kong, F.Y.; Zhang, J.G. Effects of soil texture and nitrogen fertilisation on soil bacterial community structure and nitrogen uptake in flue-cured tobacco. Sci. Rep. 2021, 11, 22643. [Google Scholar] [CrossRef] [PubMed]
- Wang, Z.C.; Liu, J.J.; Hamoud, Y.A.; Wang, Y.S.; Qiu, R.J.; Agathokleous, E.; Hong, C.; Shaghaleh, H. Natural 15N abundance as an indicator of nitrogen utilization efficiency in rice under alternate wetting and drying irrigation in soils with high clay contents. Sci. Total Environ. 2022, 838, 156528. [Google Scholar] [CrossRef] [PubMed]
- Li, X.Y.; Wang, Y.; Feng, G.Z.; Xu, Z.; Meng, F.C.; Gao, Q. Differential fertilizer nitrogen fates in maize cropping system among three soil textures based on 15N. Field Crop. Res. 2023, 291, 108780. [Google Scholar] [CrossRef]
- Chen, B.P.; Guo, L.J.; Tang, J.C.; Li, Y.S.; Li, C.F. Comprehensive impacts of different integrated rice-animal co-culture systems on rice yield, nitrogen fertilizer partial factor productivity and nitrogen losses: A global meta-analysis. Sci. Total Environ. 2024, 915, 169994–169999. [Google Scholar] [CrossRef]
- Asai, H.K.; Saito, K.; Kawamura, K. Application of a Bayesian approach to quantify the impact of nitrogen fertilizer on upland rice yield in sub-Saharan Africa. Field Crop. Res. 2021, 272, 108284. [Google Scholar] [CrossRef]

Disclaimer/Publisher’s Note: The statements, opinions and data contained in all publications are solely those of the individual author(s) and contributor(s) and not of MDPI and/or the editor(s). MDPI and/or the editor(s) disclaim responsibility for any injury to people or property resulting from any ideas, methods, instructions or products referred to in the content. |
© 2024 by the authors. Licensee MDPI, Basel, Switzerland. This article is an open access article distributed under the terms and conditions of the Creative Commons Attribution (CC BY) license (https://creativecommons.org/licenses/by/4.0/).