Article

The Effect of Exogenous Selenium Supplementation on the Nutritional Value and Shelf Life of Lettuce

School of Modern Industry for Selenium Science and Engineering, Wuhan Polytechnic University, Wuhan 430048, China
*
Author to whom correspondence should be addressed.
Agronomy 2024, 14(7), 1380; https://doi.org/10.3390/agronomy14071380
Submission received: 29 May 2024 / Revised: 20 June 2024 / Accepted: 24 June 2024 / Published: 27 June 2024
(This article belongs to the Section Innovative Cropping Systems)

Abstract

:
Lettuce (Lactuca sativa) is rich in vitamins, minerals, and bioactive components, serving as an important source of selenium (Se) intake for humans. This study investigated the effects of Se treatment on lettuce using different concentrations of sodium selenite (Na2SeO3), focusing on biomass, physiological indicators, nutritional composition, and physiological changes during storage. Through correlation analysis of the transcriptome and Se species, the absorption and conversion mechanisms of Se in lettuce were revealed. The results showed that Se treatment initially increased the chlorophyll content in lettuce, followed by a decrease. Soluble sugar, soluble protein, total phenols, and anthocyanins increased at low Se concentrations but decreased at high concentrations. Flavonoid content decreased only at 1 mg/L Se, while other treatments were higher than the control group. GSH content and superoxide dismutase, catalase, and peroxidase activities initially increased and then decreased, while malondialdehyde (MDA) content first decreased and then increased. Five Se species, including Se (IV), Se (VI), selenocysteine (SeCys2), selenomethionine (SeMet), and methylselenocysteine (MeSeCys), were detected in lettuce leaves after Se treatment, with SeMet being the most abundant. During storage, Se-treated lettuce exhibited lower weight loss, a*, b*, browning index, and color difference (ΔE) values compared to the control group. CAT and POD activities and GSH content also followed a trend of initial increase followed by a decrease. Transcriptome data analysis revealed that genes such as MYB1, RPK1, PTR44, NTRC, WRKY7, and CSLD3 were associated with the stress response of Se-treated lettuce.

1. Introduction

Selenium (Se) is an essential trace element for human bodies. A total of 25 selenoproteins have been identified in human cells, exhibiting various biological activities such as immune response and antioxidation. Se plays a crucial role in immune regulation, antioxidation, and disease prevention [1]. It is an integral component of numerous selenoproteins and coenzymes, including glutathione peroxidase, thioredoxin reductase, and iodothyronine deiodinases, regulating cellular oxidative stress responses through the redox reaction system [2]. The distribution of Se resources in soil is uneven, and currently, at least 1 billion people worldwide are Se-deficient. Especially in developing countries, insufficient Se intake through diet poses health risks [3]. Prolonged Se insufficiency has been implicated in the onset of severe health disorders, including Keshan disease and Kashin-Beck disease. The human body has a narrow range of Se requirements, and excessive Se intake may cause vomiting, hair loss, diarrhea, and other symptoms. According to data from the Institute of Medicine of the National Academy of Sciences, the recommended dietary Se intake for adults is 55 µg/day, with an upper limit of 400 µg/day [4]. Bio-Se biofortification has been proven to be the most effective method for Se intake in Se-deficient areas, and vegetables are an important source of Se supplementation for humans. Moreover, organic Se is relatively safer and more efficient [5,6].
In nature, Se exists primarily in both inorganic and organic forms. Inorganic forms include selenate (SeO42−), selenite (SeO32−), selenide (Se2−), and elemental Se (Se0), while organic forms include selenocysteine (SeCys) and selenomethionine (SeMet) [7]. Se is primarily utilized by plants in the form of inorganic salts, namely selenite (Se IV) and selenate (Se VI). Selenate is absorbed within plants through sulfate transporters [8], while selenite enters the plant interior through active transport mediated by phosphate transporters [9]. Plants exhibit the capacity to metabolize inorganic Se into organic Se, a crucial biocompatible form that is indispensable for the proper functioning of human immune and reproductive systems, thyroid function, and intracellular enzyme activities. Nowadays, the cultivation of Se-enriched crops has been firmly established as an innovative and promising approach for the production of Se-rich agricultural products [10]. Se regulates the formation of chlorophyll and enhances leaf photosynthetic efficiency by influencing the interaction between two enzymes, 5-aminolevulinic acid dehydratase and porphobilinogen deaminase, both containing -SH groups. This, in turn, benefits crop yield increase and quality optimization [11]. Apart from Se biofortification in crops, Se also participates in plant metabolism, enhancing the synthesis of secondary metabolites and reducing abiotic and biotic stresses on plants [12]. Furthermore, Se can enhance the activity of antioxidant enzymes in plants and induce the synthesis of non-enzymatic antioxidants such as glutathione (GSH), ascorbic acid, proline, flavonoids, and alkaloids, thereby improving the antioxidant capacity of plants [13]. In plants, Se counteracts oxidative stress caused by internal or external factors by increasing GSH peroxidase activity, extending the shelf life of fruits and vegetables. It can also delay the senescence of fruit and vegetable crops by reducing ethylene production [14,15].
Lactuca sativa, belonging to the Asteraceae family, originated in the Mediterranean region and is widely cultivated globally as a vegetable. It is renowned for its high water content, ranging from 94–95%, and its low-fat, low-sodium, and relatively low-calorie profile. Lettuce is rich in vitamins, minerals, and bioactive components such as polyphenols, carotenoids, and chlorophyll [16]. The secondary metabolites present in lettuce, including flavonoids, anthocyanins, and terpenoids, exhibit a diverse array of health-beneficial properties. These metabolites possess antioxidant, anti-inflammatory, anti-diabetic, anticancer, and anti-cardiovascular disease effects. Consequently, it is regarded as one of the most popular vegetables and a recognized healthy food [17]. As a fresh vegetable, the color, nutritional content, and shelf life of lettuce are critical factors influencing consumer purchase decisions [18]. Se biofortification in vegetables not only enhances their nutritional value but also positively impacts growth, stress resistance, and shelf life extension.
This study aimed to assess the impact of varying concentrations of Na2SeO3 on physiological parameters in lettuce, encompassing photosynthetic pigments, nutritional components, and antioxidant enzyme activity. To achieve this, lettuce seedlings were treated with different concentrations of Na2SeO3, enabling a comprehensive evaluation of the effects on these key physiological indicators. The appearance color, water loss rate, and physiological indicators of the Se-enriched biofortified lettuce were measured during storage to analyze the ability of different concentrations of Se treatment to improve the shelf life of lettuce. Additionally, the conversion mechanism of Na2SeO3 into organic Se in lettuce was explored through the analysis of transcriptome data obtained from Se-treated lettuce and the correlation with different forms of Se content.

2. Materials and Methods

2.1. Cultivation and Treatment of Lettuce

The lettuce variety used in the experiment is iceberg lettuce (Lactuca sativa L.), which was purchased from Qingfeng Yingke Seed Co., Ltd. (Xingning, China). Na2SeO3 was employed as an exogenous Se source for the hydroponic treatment of the lettuce. The Na2SeO3 was procured from Jingcheng Chemical Co., Ltd. (Wuhan, China). The lettuce seedlings were cultivated in a controlled plant culture chamber, maintained at a constant temperature of 25 °C. The photoperiod was set to 12 h of light exposure alternating with 12 h of darkness, ensuring optimal growth conditions. The relative humidity was maintained at 40%, and the light flux density was adjusted to range between 300 and 380 μmol·(m−2s−1) to simulate natural lighting conditions.
The experimental protocol was initiated on 30 October 2022, commencing with the pretreatment of lettuce seeds. Approximately 100 visually healthy seeds were carefully selected and subsequently randomized into five distinct groups. They were soaked for 30 min and then placed in trays lined with gauze for germination for five days. After germination, unhealthy or non-germinated seeds were discarded, and the remaining seedlings were transferred to the light culture chamber for cultivation. Once the seedlings reached the three-leaf-one-heart stage, robust and uniform plants were chosen for transplantation. Half-concentration Hoagland nutrient solution was used for the hydroponic cultivation of plants, with a pH value of 6.0 and an electrical conductivity of 2.26 ms/cm. Foliar spraying was applied with Na2SeO3 concentrations of 0 mg/L, 0.5 mg/L, 1 mg/L, 1.5 mg/L, and 2 mg/L. The lettuce plants were grown for a total of 45 days from sowing to harvest. Upon harvest, the plants were rinsed three times with ultrapure water to remove surface impurities. the pretreated seedlings were further partitioned into two distinct subsets: one dedicated to physiological index measurements and the other reserved for subsequent transcriptome and metabolome analysis.

2.2. Determination of Growth Indicators

For each treatment, three lettuce plants with relatively consistent growth were selected to measure their biomass, shoot length, and root length. Chlorophyll content was determined using a 95% ethanol extraction method [19]. The OD470, OD649, and OD665 values were measured using a UV spectrophotometer, and the following calculations were made based on the recorded data: Ca = 13.95A665 − 6.88A649, Cb = 24.96A649 − 7.32A665, Cx·c = (1000A470 − 2.05Ca − 114.8Cb)/24, Pc = (C × V × N)/(W × 1000). Here, Ca, Cb, and Cxc represent the contents of chlorophyll a, chlorophyll b, and carotenoids (mg/L), respectively. A665, A649, and A470 represent the absorbance of photosynthetic pigment extracts at 665 nm, 649 nm, and 470 nm, respectively. C represents the concentration of photosynthetic pigments (mg/L), V denotes the volume of the extract (mL), N represents the dilution ratio, and W refers to the fresh weight of the sample (g).
The contents of anthocyanins (AKPL021M), ascorbic acid (AKVI005M), total phenols (AKPL016M), flavonoids (AKPL015M), soluble sugars (AKPL008M), soluble proteins (AKPR015), and malondialdehyde (MDA, AKFA013M) were determined using corresponding detection reagent kits (Beijing Boxbio Biotech Co., Ltd., Beijing, China). These nutritional indicators were measured using an Epoch microplate spectrophotometer (BioTek Instruments, Inc., Vermont, USA) following the manufacturer’s instructions. The concentrations of anthocyanins (µmol/g) were determined at 530 nm and 700 nm, ascorbic acid (mg/g) at 265 nm, total phenols (mg/g) at 760 nm, flavonoids (mg/g) at 510 nm, soluble sugars (mg/g) at 620 nm, and soluble proteins (mg/g) at 595 nm. The MDA content was calculated using the formula CMDA = 6.45 × (A532 − A600) − 0.56 × A450, where C represents the concentration of MDA in the solution being tested, and A532, A600, and A450 correspond to the absorbance values measured at 532 nm, 600 nm, and 450 nm, respectively.

2.3. Determination of Antioxidant Indicators

The catalase (CAT) activity and glutathione (GSH) content were quantitatively analyzed using specific reagent kits (AKAO003-2M, AKPR008M) procured from Beijing Box Biotechnology Technology Co., Ltd. (Beijing, China). Additionally, the activities of superoxide dismutase (SOD) and peroxidase (POD) were accurately determined using reagent kits (A001-2-2, A084-3-1) sourced from Nanjing Jiancheng Biotechnology Research Institute (Nanjing, China).
The activity of SOD was measured by defining one enzyme activity unit as the quantity of enzyme necessary to induce a 50% reduction in the photochemical reduction rate of nitro-blue tetrazolium. POD activity was quantified as one unit corresponding to a change of 0.01 in A470 per minute. Similarly, CAT activity was measured as one enzyme activity unit representing a decrease of 0.1 in A240 per minute.
To determine GSH content, a standard curve was constructed using a GSH standard solution (10 μg/mL). The GSH content was then calculated based on the formula Y = 0.067 × A412 − 0.0005, where A412 denotes the absorbance value recorded at a wavelength of 412 nm following a reaction duration of 20 min for the respective sample, and R2 = 0.9943 indicates the goodness of fit of the standard curve.

2.4. Determination of Total Se Content and Identification of Se Species

The total Se content in the lettuce samples was measured using atomic fluorescence spectroscopy [20]. Approximately 0.2 g of each sample was placed in a digestion tube, and 7 mL of HNO3 was added. The samples were then digested in a digestion instrument. After digestion, the samples were driven in an acid-driven instrument at 120–140 °C until they reached a size comparable to a green bean. The digested samples were transferred to centrifuge tubes and diluted to 10 mL with 10% HCl for detection. The total Se content in the lettuce was calculated using the formula K1 = (C × V × N)/(W × 1000), where C represents the mass concentration of total Se (μg/L), V is the total volume of the digested solution to be tested (mL), N is the dilution factor, and W is the dry weight of the sample (g).
The lettuce samples were analyzed for their Se species content using inductively coupled plasma-mass spectrometry (ICP-MS) as described in Herath et al. [21]. Standard curves were established using five Se-standardized compounds: SeCys2, SeMet, MeSeCys, Se4+, and Se6+, procured from the China National Institute of Metrology. For Se extraction, approximately 0.1 g of the sample was hydrolyzed with protease K and protease E. This hydrolysis process involved sonication at 37 °C for 1 h, followed by centrifugation at 10,000 rpm for 20 min. The supernatant was filtered through a 0.22-micron filter membrane.
The content of Se species in the lettuce was calculated using the formula K2 = (C × V × N)/(W × 1000), where C is the mass concentration of the Se form expressed in μg/L, V represents the total volume of the digested solution being tested in milliliters, N is the dilution factor, and W is the dry weight of the sample in grams.

2.5. Determination of Color Difference

Several lettuce leaves of approximately the same size were selected and their color changes during storage were measured. The values of L*, a*, and b* were measured and accurately recorded utilizing a colorimeter, specifically the CR-400 from Konica Minolta. In this context, L* represented the brightness value, a* denoted the red-green value, and b* corresponded to the yellow-blue value. Along a time gradient of first day, third day, fifth day, and seventh day, three random locations were selected on the surface of fresh lettuce, and each group was measured three times. The browning index (BI) and color difference (ΔE) were determined using the equation specified in the methodology outlined by Wang et al. [22].

2.6. Transcriptome Sequencing and Data Analysis

Agarose gel electrophoresis was employed to assess the integrity of the sample RNA and detect the presence of potential DNA contamination. The purity of the RNA was subsequently determined using a NanoPhotometer, while the Qubit2.0 Fluorometer provided accurate quantitation of RNA concentration. Furthermore, the Agilent 2100 bioanalyzer was utilized to comprehensively assess the RNA integrity. Once a qualified library was constructed, different libraries were pooled in accordance with the requirements of effective concentration and target data volume for Illumina sequencing, ultimately generating 150 bp paired-end reads.
The sequencing process was based on the principle of Sequencing by Synthesis, which involves concurrent synthesis and sequencing. During this process, fluorescently labeled dNTPs, DNA polymerase, and linker primers were added to the flowcell for amplification. As each sequencing cluster elongated its complementary strands, the addition of each fluorescently labeled dNTP released a corresponding fluorescence signal. The sequencing instrument captured these fluorescence signals and converted them into sequencing peaks through computer software, thereby enabling the acquisition of sequence information for the target fragment.
The raw sequencing data underwent rigorous filtering using Fastp v0.19.3 to eliminate reads containing adapter sequences, sequences with an N content exceeding 10% of the base number, and sequences exhibiting low quality with a Q-score of 20 or below. The resulting clean reads were then utilized for all subsequent analyses. The reference genome and its annotation file were downloaded from the designated website, and an index was constructed using HISAT v2.1.0. The clean reads were aligned to the reference genome, and gene alignment was quantified using the feature Counts v1.6.2. Subsequently, the FPKM (fragments per kilobase of transcript per million mapped reads) of each gene was calculated, taking into account gene length. Differential expression analysis between groups was conducted using DESeq2 v1.22.1, and the Benjamini-Hochberg method was employed to adjust the p-values. Significant differential expression genes (DEGs) were determined based on the corrected p-value and the absolute value of log2foldchange. Additionally, GO functional analysis and KEGG pathway analysis were performed on the DEGs using GOseq (1.10.0) and KOBAS (v2.0.12) software, respectively.
Differentially expressed genes (DEGs) were subjected to weighted gene co-expression network analysis (WGCNA), utilizing the online platform (https://cloud.metware.cn/#/tools accessed on 13 February 2024). The outcomes of the WGCNA analysis served as a basis for screening regulatory genes implicated in these biological processes (BP). Additionally, Pearson correlation analysis was conducted using the ggplot2 package in R to assess the relationship between characteristic genes and the abundance of Se species within each identified module.

2.7. Statistical Analysis and Graph Plotting

Excel 2021 (Microsoft, Raymond, WA, USA) and SPSS v24.0 (IBM, Amonk, NY, USA) were used for statistical analysis of experimental data, and GraphPad Prism8 software was used for image drawing. Duncan’s multiple range test was used for the analysis of differences (p < 0.05). To guarantee the reproducibility and reliability of the experimental outcomes, three biological replicates were established for each group of data processing, and each biological replicate was further subjected to three technical replicates for measurement. For correlation analysis, Omic Studio (accessed on 8 November 2023; https://www.omicstudio.cn/tool) was utilized, with thresholds for positive and negative correlations set at ≥0.5 and ≤−0.5, respectively. These thresholds were chosen to identify significant relationships between variables, with a significance level of p < 0.05 employed to ensure the validity of the observed correlations.

3. Results

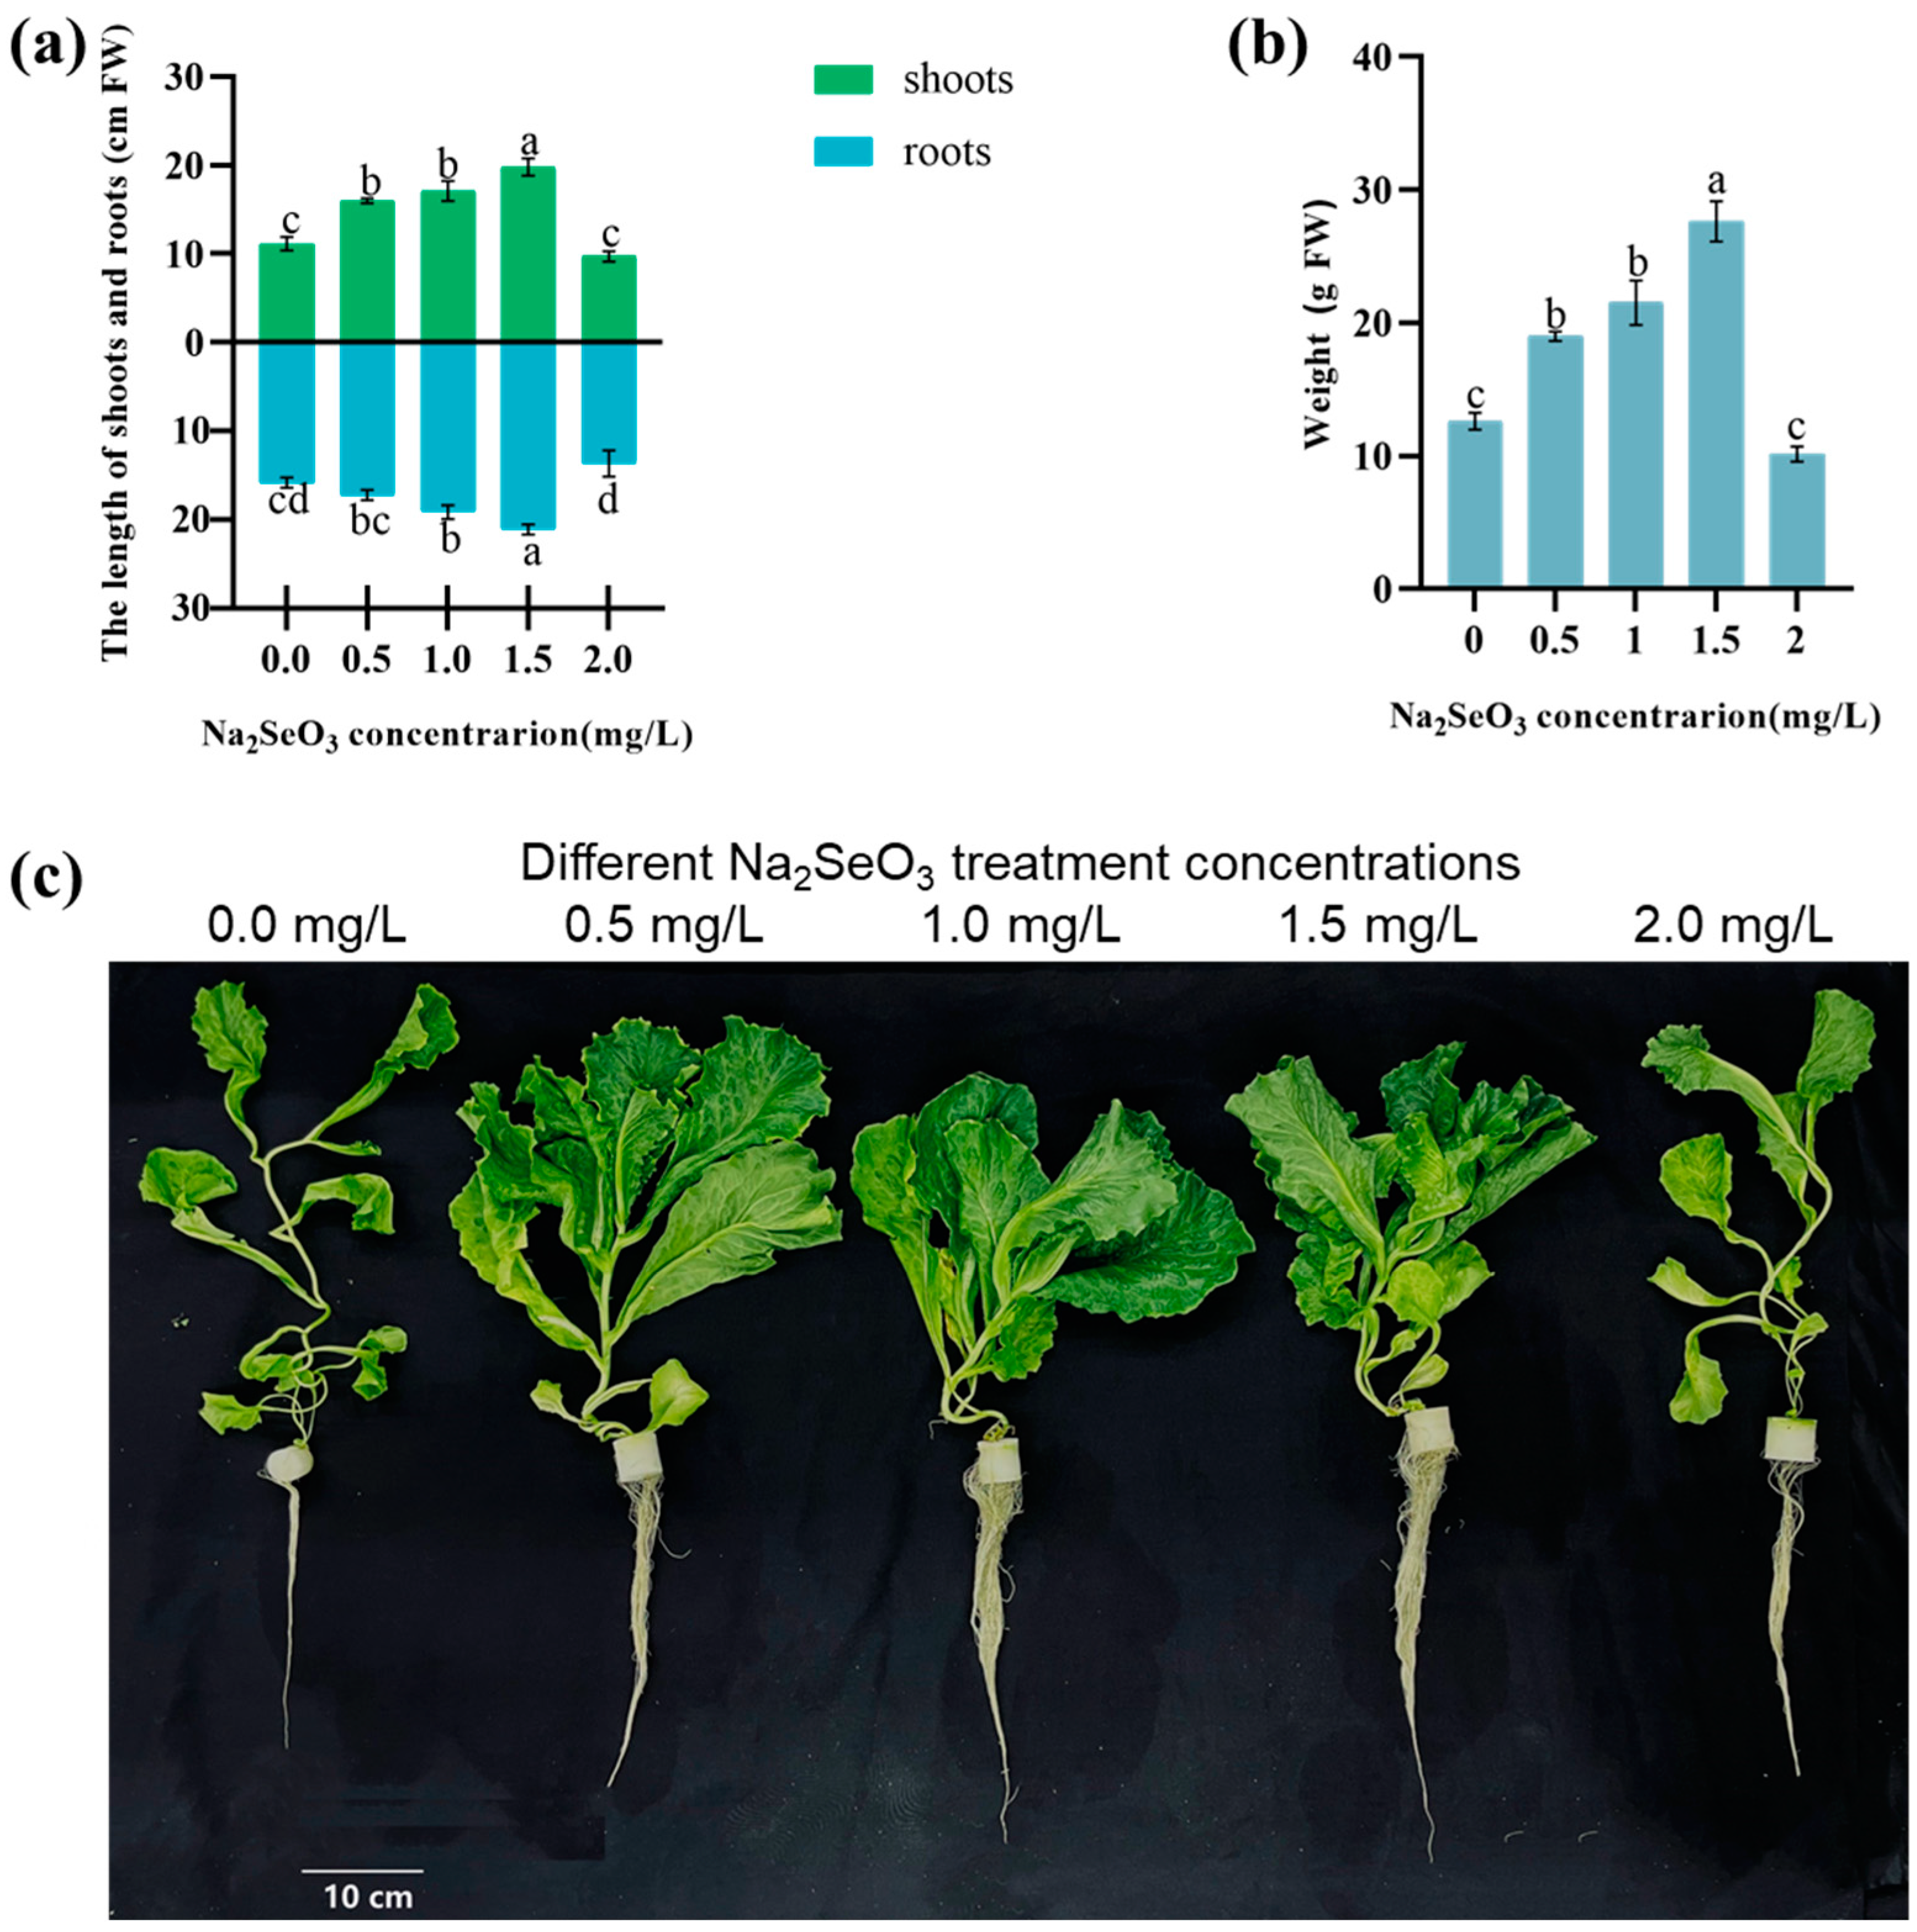
3.1. The Influence of Na2SeO3 Hydroponics on the Plant Biomass of Lettuce

The hydroponic culture with low concentrations of Na2SeO3 has a stimulatory effect on the growth of lettuce. When 0.5–1.5 mg/L of Na2SeO3 was added to the culture solution, both the shoot and root lengths of the plants increased compared to the control group (Figure 1a). Compared to the control, treatment with 0.5, 1, and 1.5 mg/L of Na2SeO3 significantly increased root lengths by 14.3%, 21.2%, and 52.5%, respectively, while shoot lengths were significantly increased by 43.4%, 53.3%, and 91.0%, respectively. However, the lengths of both the shoot and root decreased after treatment with a 2 mg/L solution of Na2SeO3.
As shown in Figure 1b, the biomass of lettuce treated with 0.5–1.5 mg/L of Na2SeO3 solutions increased significantly, by 50.5%, 70.6%, and 158%, respectively. However, the biomass of lettuce treated with a 2 mg/L solution of Na2SeO3 decreased.

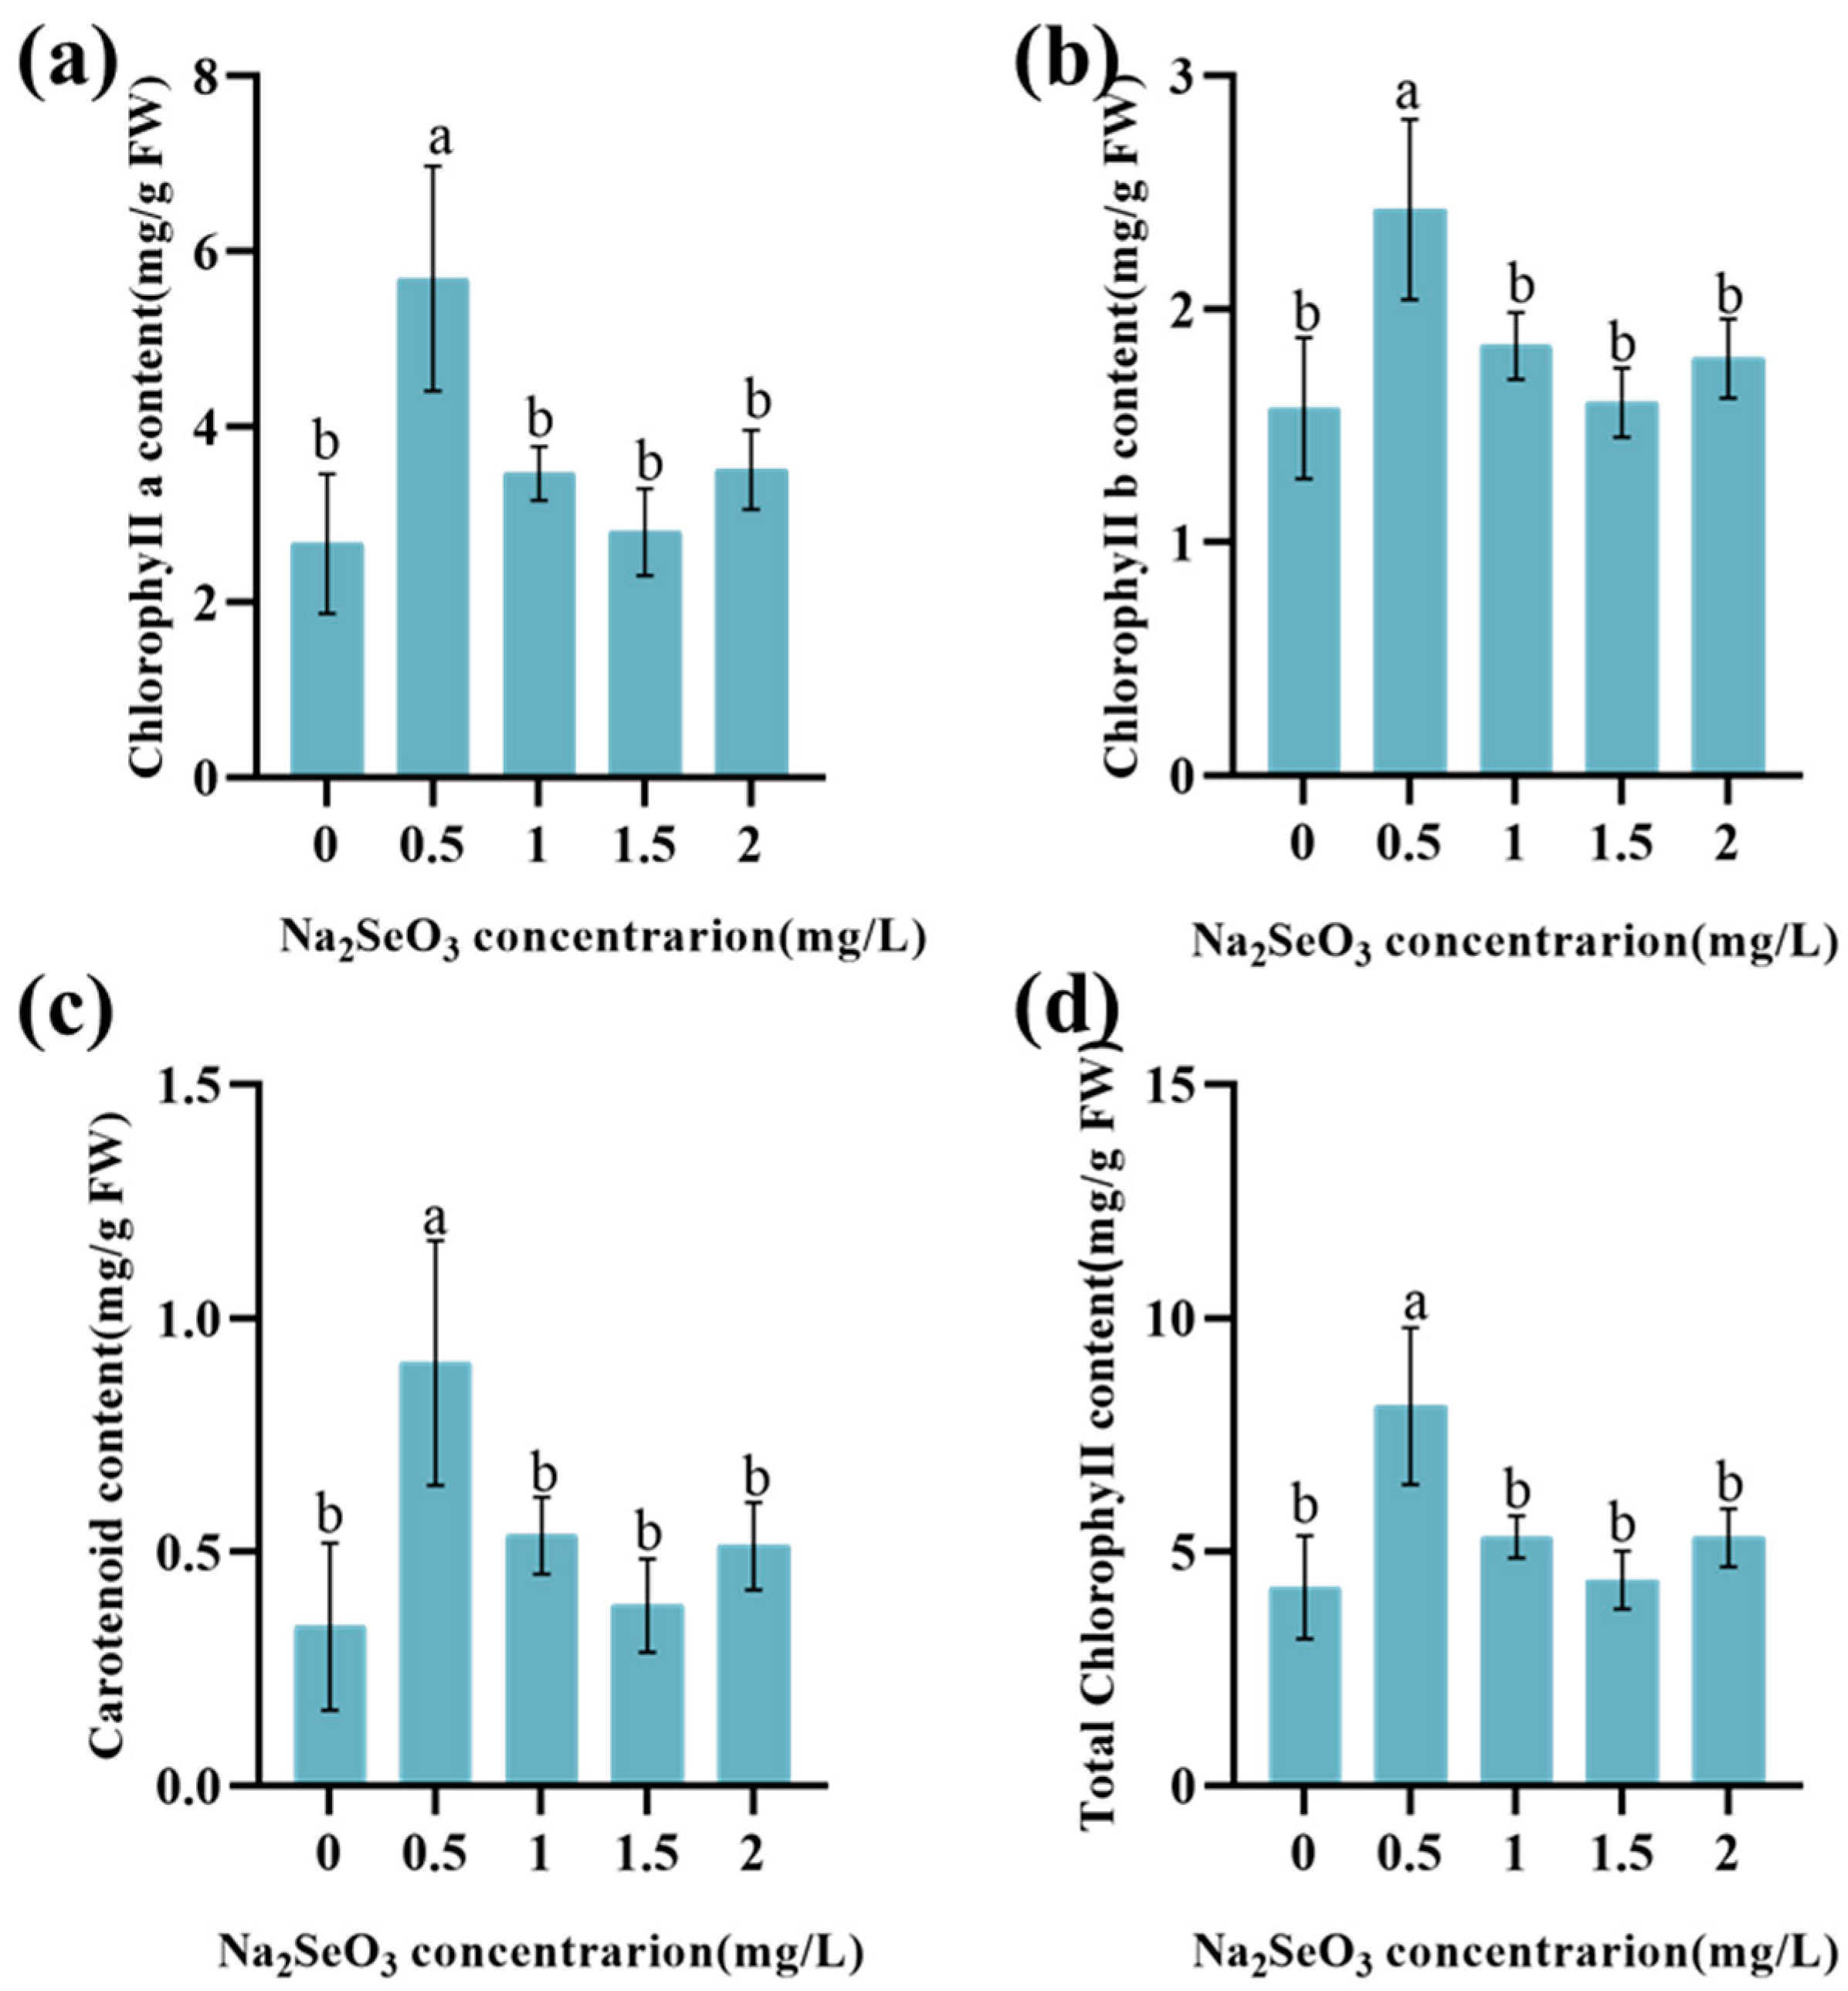
3.2. Effect of Na2SeO3 on the Content of Photosynthetic Pigments in Lettuce

The contents of chlorophyll and carotenoids in lettuce treated with different concentrations of selenite were higher than those in the control group, with significant increases only observed in the 0.5 mg/L treatment group compared to the control. Specifically, chlorophyll a increased by 1.14-fold (Figure 2a), chlorophyll b increased by 54.0% (Figure 2b), carotenoids increased by 1.65-fold (Figure 2c), and total chlorophyll increased by 91.5% (Figure 2d). While the contents in the other treatment groups were also higher than the control, these increases were not statistically significant.

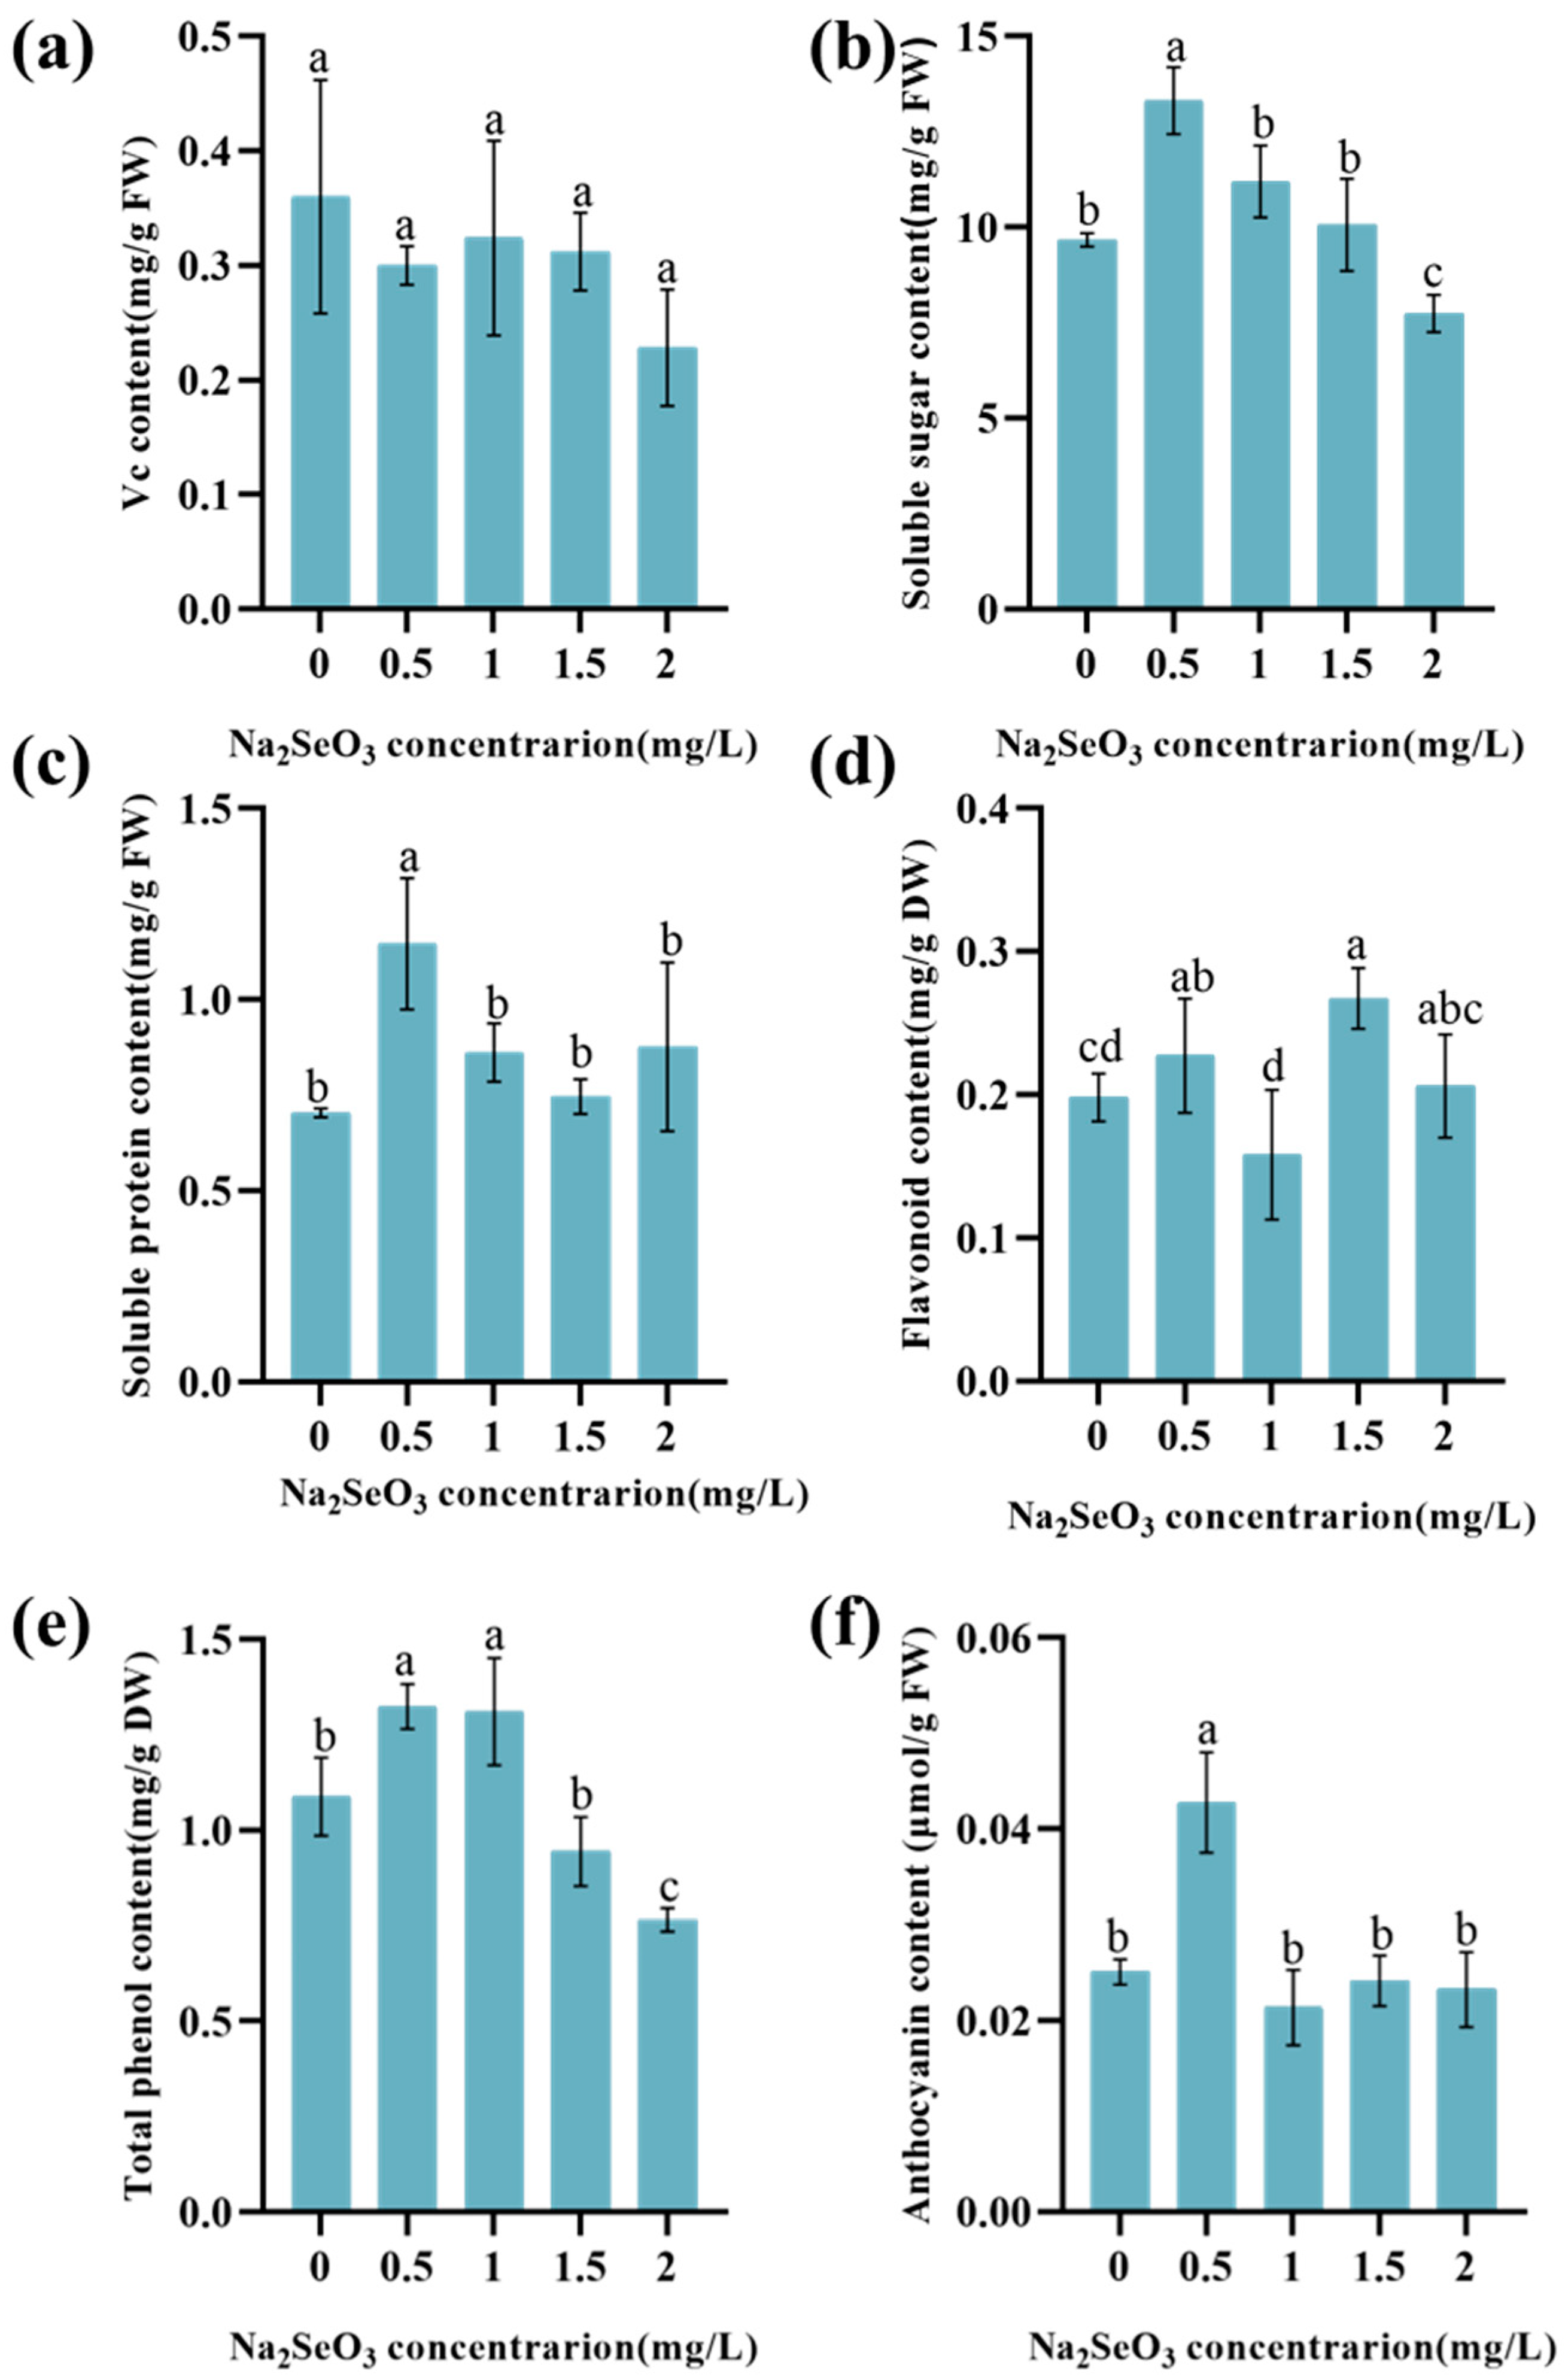
3.3. Effect of Na2SeO3 on the Nutritional Quality of Lettuce

Compared to the control group, the content of vitamin C (Vc) in lettuce treated with Na2SeO3 decreased slightly, but the difference was not statistically significant (Figure 3a). Treatment with 0.5, 1, and 1.5 mg/L of Na2SeO3 increased the soluble sugar content in lettuce leaves, with the 0.5 mg/L treatment resulting in a significant elevation of 37.8%. However, when treated with 2 mg/L of Na2SeO3, the soluble sugar content in lettuce decreased significantly by 19.8% (Figure 3b).
After treatment with 0.5 mg/L of Na2SeO3, the soluble protein content in lettuce increased significantly (by 63.1%) compared to the control group, while the other concentrations showed slightly higher levels but without significant differences (Figure 3c). Compared to the control, the flavonoid content in the 0.5 mg/L and 1.5 mg/L Na2SeO3 treatment groups increased significantly, by 14.6% and 34.8%, respectively. At a concentration of 1.0 mg/L, the flavonoid content decreased slightly but not significantly (Figure 3d).
Compared to the control group, the total phenolic content in the 0.5 and 1.0 mg/L Na2SeO3 treatment groups increased significantly, by 21.6% and 20.4%, respectively. However, at a concentration of 2 mg/L, the total phenolic content decreased significantly, by 29.6% (Figure 3e). Treatment with 0.5 mg/L of Na2SeO3 significantly enhanced the anthocyanin content in lettuce, increasing it by 70.3% compared to the control. However, treatments with 1.0 mg/L, 1.5 mg/L, and 2 mg/L of Na2SeO3 reduced the anthocyanin content in lettuce, but the differences were not statistically significant (Figure 3f).

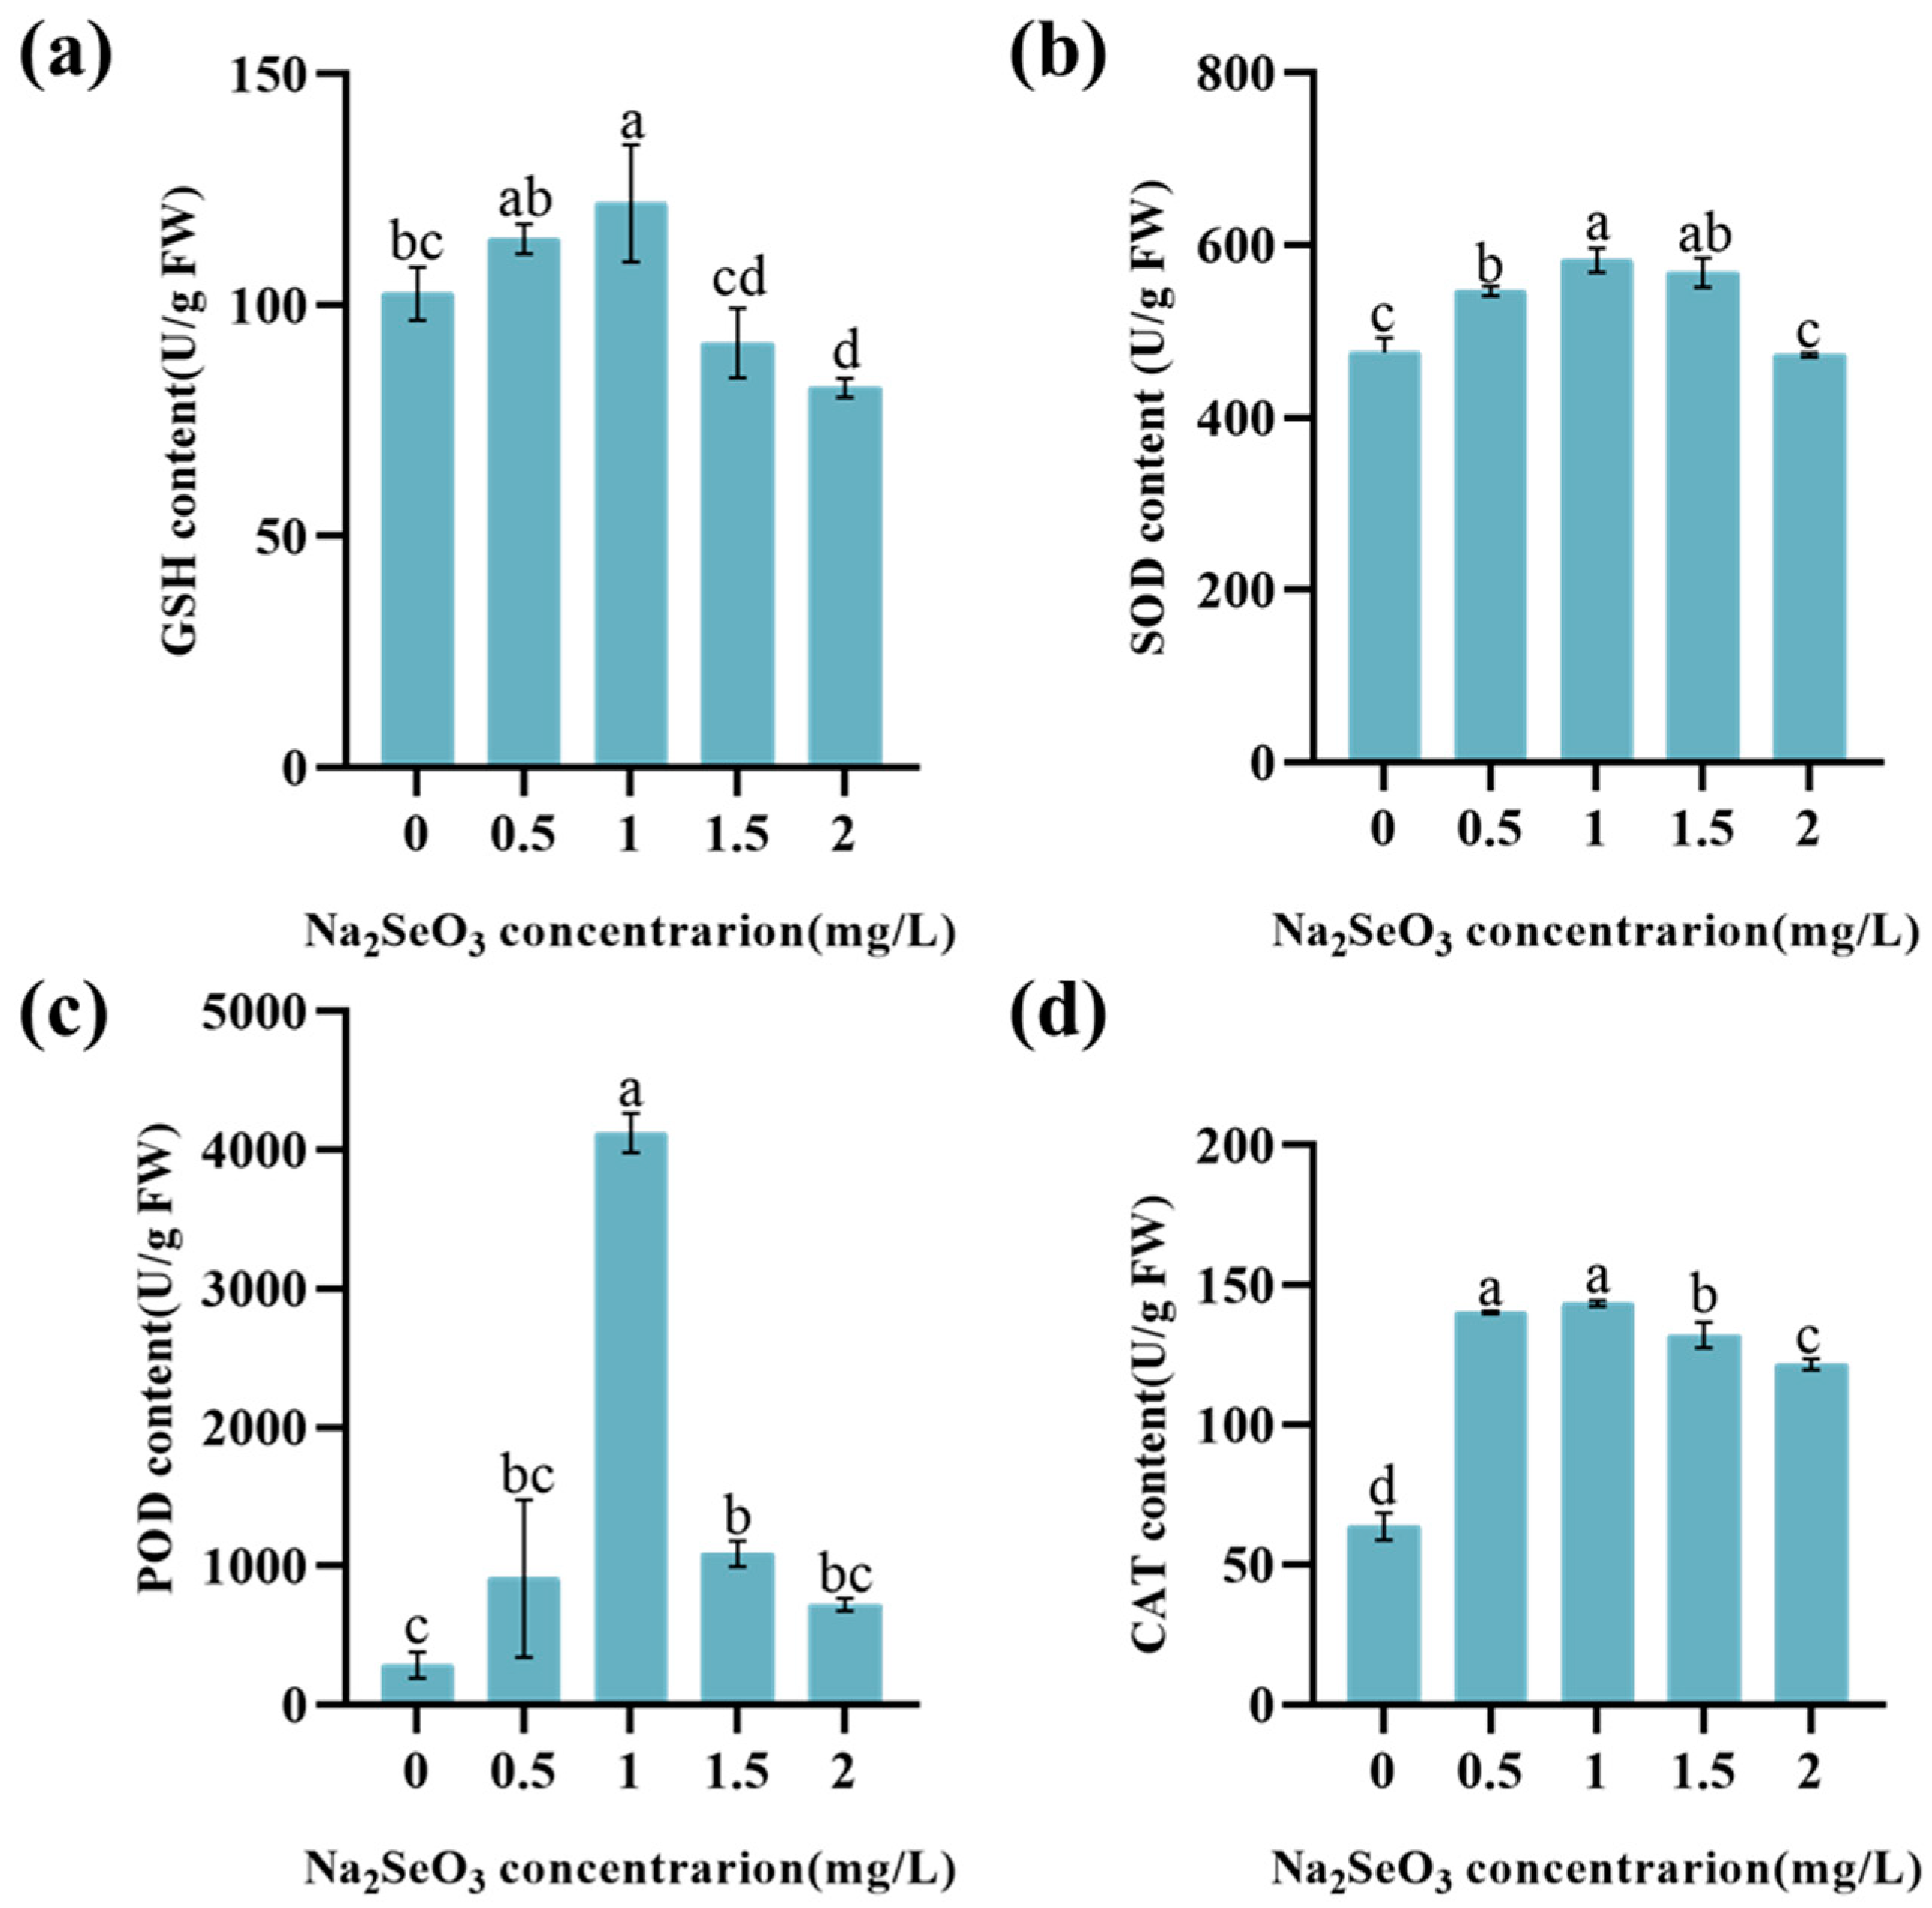
3.4. The Effect of Na2SeO3 on the Antioxidation Performance of Lettuce

After treating lettuce with 1.0 mg/L of Na2SeO3, its MDA content significantly decreased (by 35.1%) compared to the control group. However, upon treatment with 1.5 mg/L and 2 mg/L of Na2SeO3, the MDA content in lettuce leaves rose significantly, increasing by 99.8% and 21.8%, respectively (Figure 4).
The application of Na2SeO3 significantly influenced the GSH content and the activity of antioxidant enzymes in lettuce leaves (Figure 5). Treatment with 0.5 mg/L and 1.0 mg/L of Na2SeO3 resulted in an increase in GSH content in lettuce leaves, with the 1 mg/L concentration exhibiting a significant increase of 19.0%. Conversely, higher concentrations of Na2SeO3 caused damage to the lettuce leaves, as GSH content decreased in the 1.5 mg/L and 2.0 mg/L treatment groups, with the 2.0 mg/L treatment group experiencing a significant decrease of 19.8% (Figure 5a).
Compared to the control group, the SOD activity in lettuce leaves treated with 0.5 mg/L, 1.0 mg/L, and 1.5 mg/L of Na2SeO3 was significantly higher, increasing by 14.9%, 22.4%, and 19.3%, respectively. However, at a concentration of 2.0 mg/L, the SOD activity in the treated lettuce leaves decreased to the level of the control group (Figure 5b). Furthermore, treatment with 1.0 mg/L and 1.5 mg/L of Na2SeO3 significantly elevated the POD activity in lettuce, increasing by 13.26-fold and 2.76-fold, respectively (Figure 5c). Notably, following Na2SeO3 treatment, all treatment groups exhibited significantly higher CAT activity compared to the control group, with increases of 1.20-fold, 1.25-fold, 1.07-fold, and 91.3%, respectively (Figure 5d).

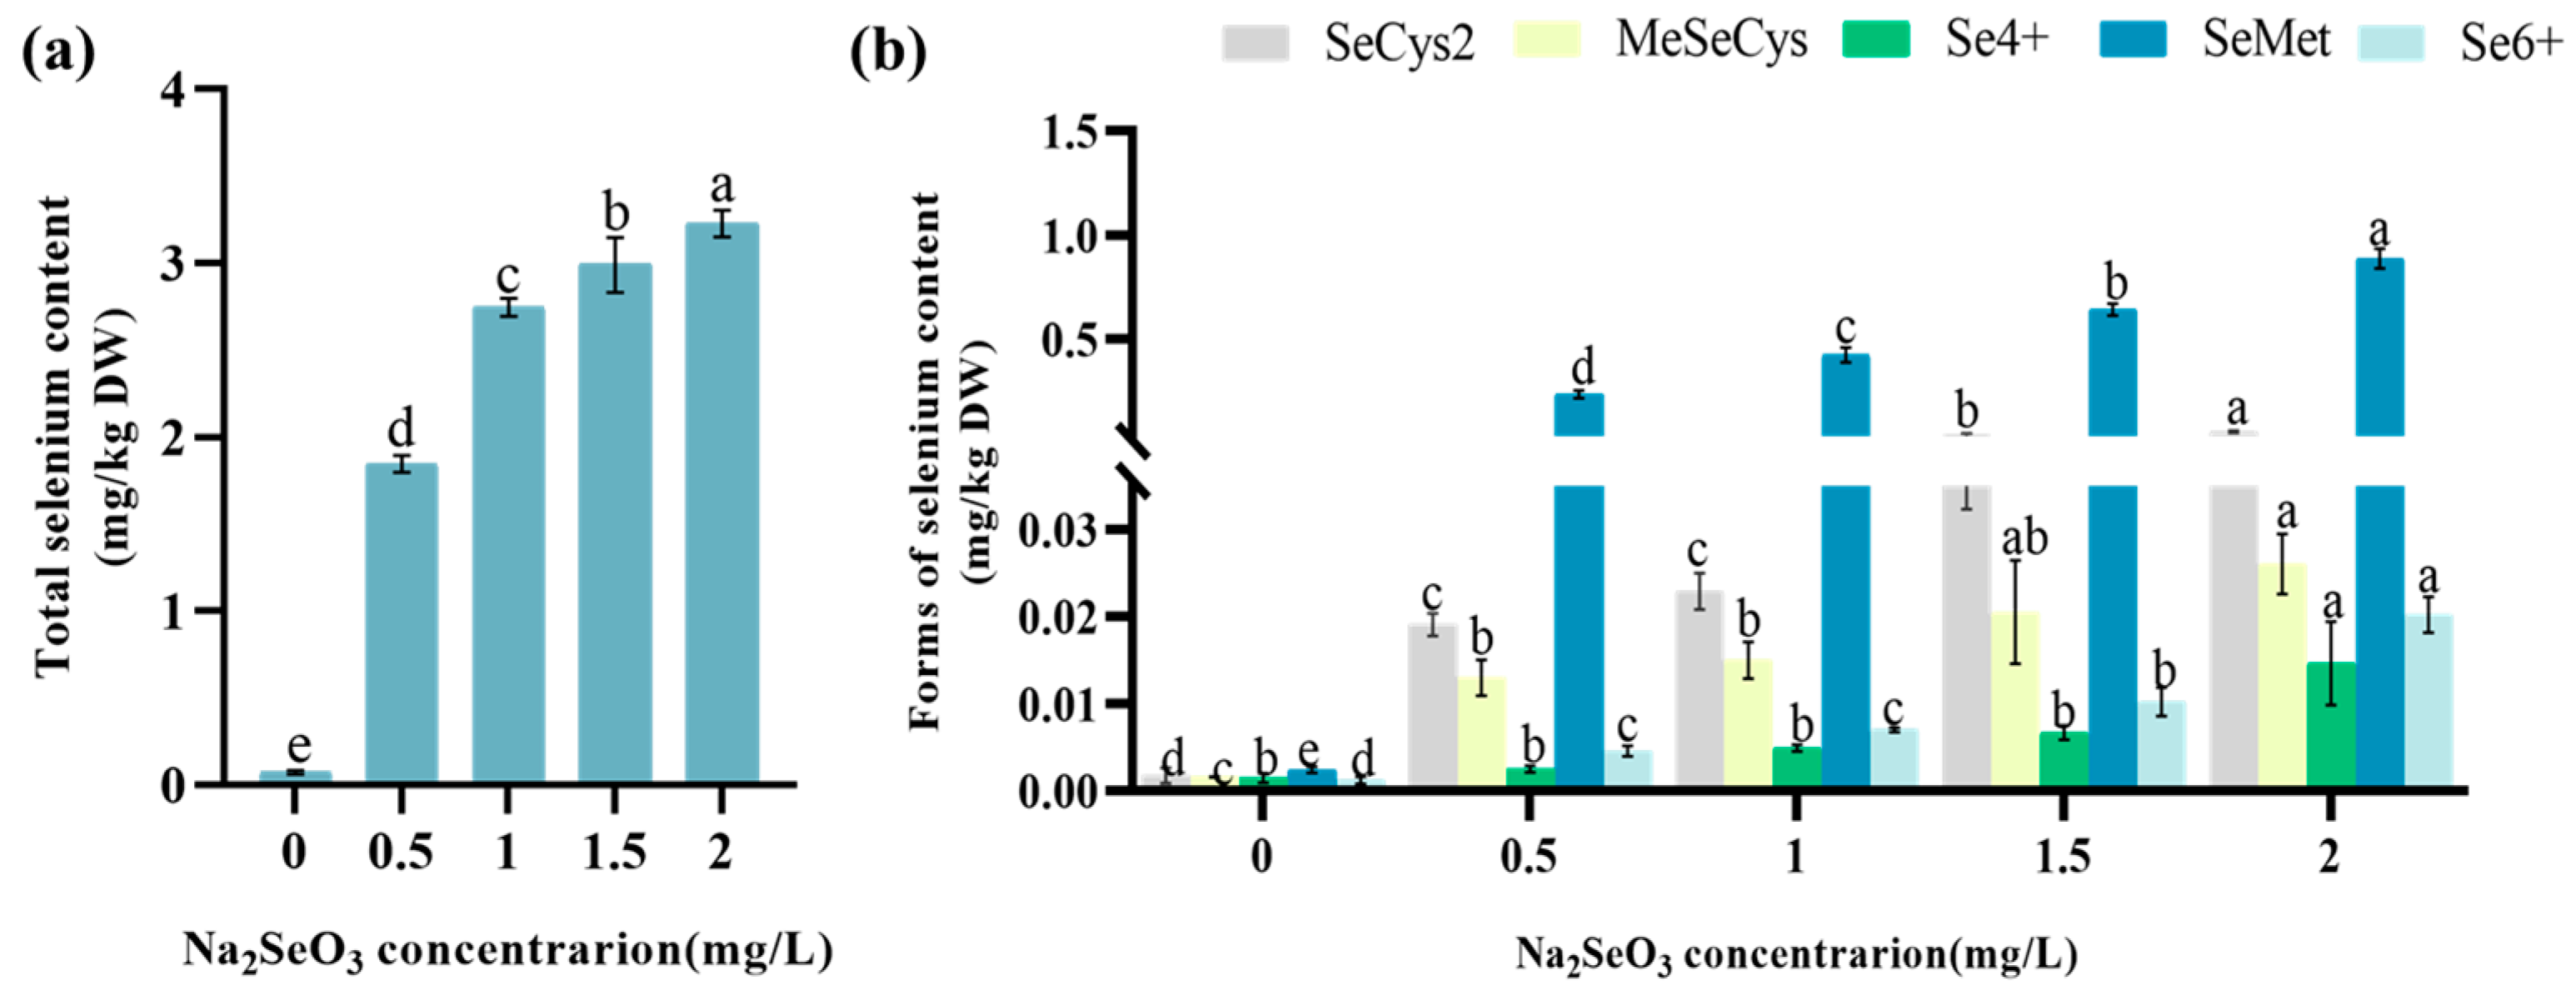
3.5. The Effect of Na2SeO3 Treatment on the Total Se and Se Species Content of Lettuce

After treatment with Na2SeO3, the total Se content in lettuce leaves increased with the concentration of the treatment (Figure 6a). The total Se contents in the leaves treated with 0.5–2.0 mg/L of Na2SeO3 were 1.85 mg/kg, 2.75 mg/kg, 2.99 mg/kg, and 3.23 mg/kg, respectively.
Among all the Na2SeO3 treatment groups, five Se species were detected, with SeMet accounting for the highest proportion, followed by SeCys2. As the Se treatment concentration increased, the proportion of organic Se gradually decreased, but it remained above 95% (Figure 6b). In the 0.5 mg/L treatment group, the proportions of SeCys2, MeSeCys, Se(IV), SeMet, and Se(VI) were 1.04%, 0.70%, 0.14%, 12.88%, and 0.24%, respectively, with organic Se accounting for 99.62%. In the 1 mg/L group, the percentages were 0.8%, 0.55%, 0.18%, 15.64%, and 0.26%, respectively, with organic Se accounting for 99.56%. In the 1.5 mg/L treatment group, the proportions were 1.38%, 0.69%, 0.22%, 21.54%, and 0.34%, respectively, with organic Se accounting for 99.44%. Finally, in the 2 mg/L group, the percentages were 1.80%, 0.81%, 0.45%, 27.54%, and 0.63%, respectively, with organic Se accounting for 98.92%.

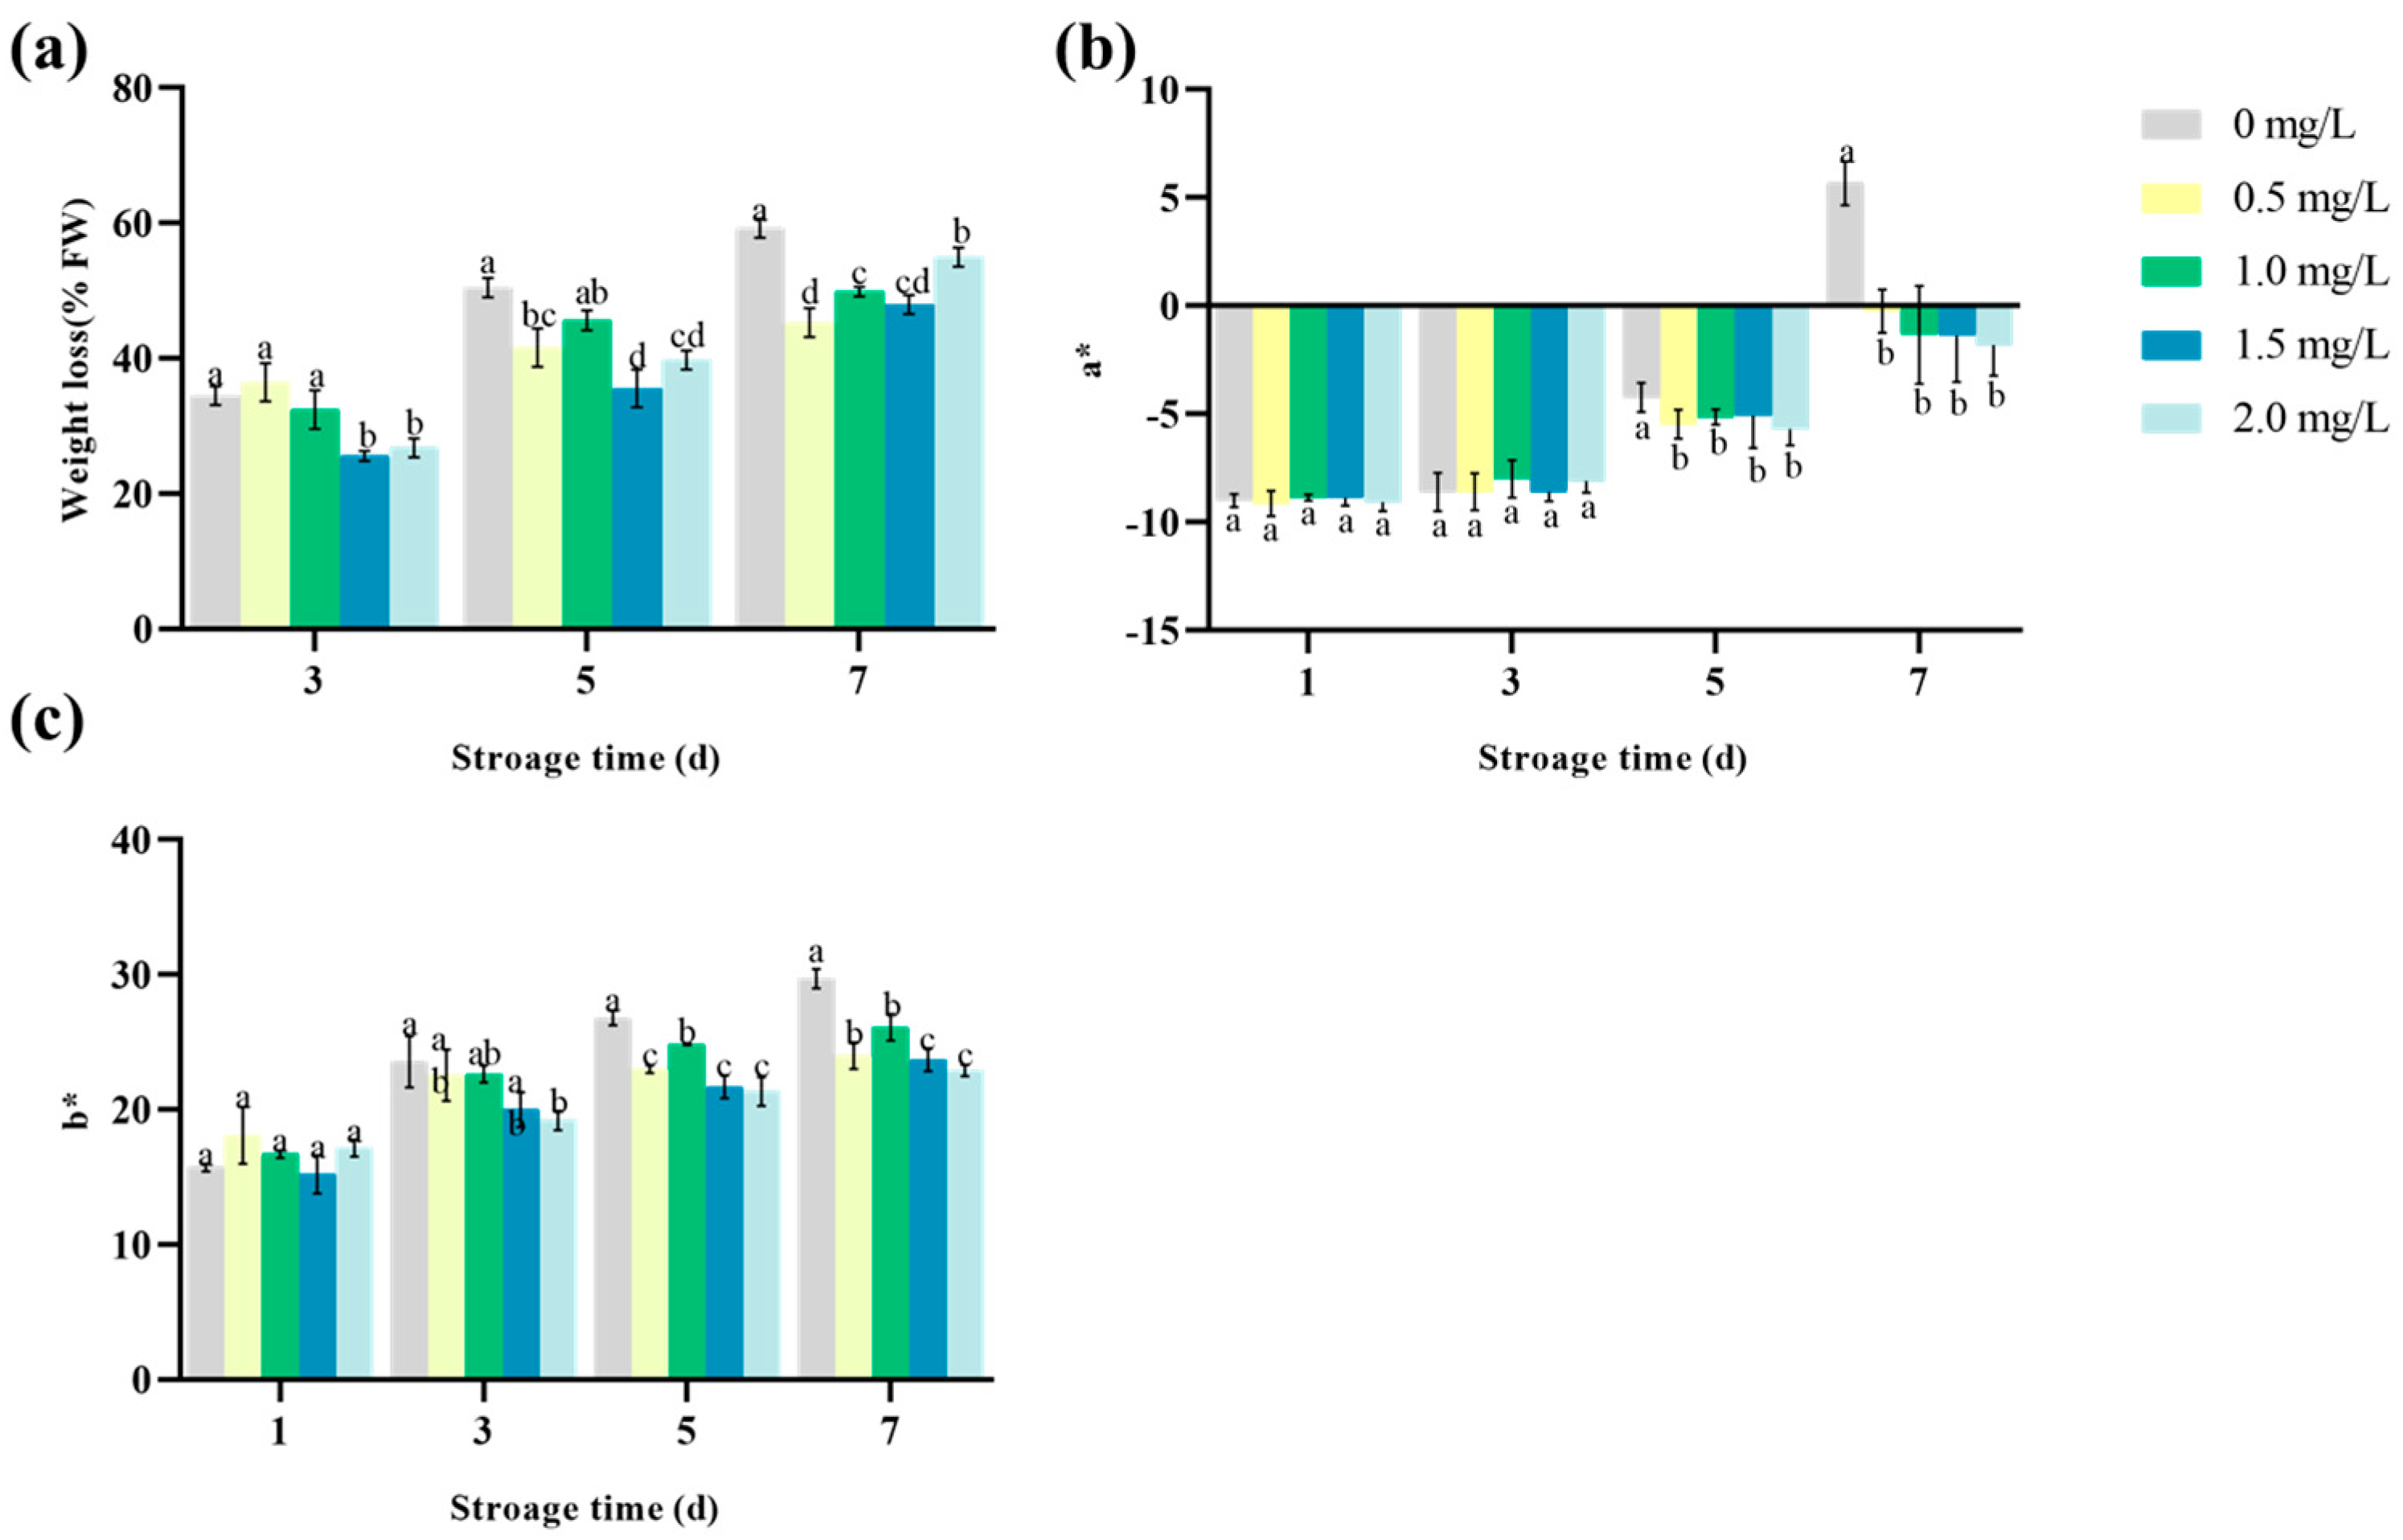
3.6. The Effect of Na2SeO3 on the Weight Loss and Browning of Lettuce

During storage at room temperature, the water loss rate of lettuce gradually increased, but the rate was significantly lower in lettuce treated with Na2SeO3 compared to the control group. On the third day, the water loss rates for the 1.5 mg/L and 2 mg/L treatments were significantly lower than the control. On the fifth day, the water loss rates for the 0.5 mg/L, 1.5 mg/L, and 2 mg/L treatments were all significantly lower than the control. By the seventh day, all treatment groups exhibited significantly lower water loss rates compared to the control, with the 0.5 mg/L Na2SeO3 treatment showing the lowest water loss rate (Figure 7a).
To assess the degree of senescence and browning in lettuce leaves during storage, a colorimeter was used to measure the a* and b* color values, representing the red-green and blue-yellow axes, respectively (Figure 7c, Figure S1). During the first three days of storage, there were no significant differences in a* values between the Na2SeO3 treatment groups and the control. However, on the fifth and seventh days, the a* values in the treatment groups were lower than in the control. Notably, on the seventh day, the a* values for the treatment groups were 95.9%, 76.5%, 75.9%, and 68.1% of the control, respectively. There were no significant differences in b* values on the first day of storage. However, on the third day, all treatment groups had lower b* values than the control, with the 2.0 mg/L treatment showing a significantly lower value, representing 18.4% of the control. On the fifth and seventh days, all treatment groups had significantly lower b* values compared to the control. On the fifth day, the treatment groups represented 14.1%, 7.2%, 19.0%, and 20.3% of the control, respectively, while on the seventh day, they represented 19.1%, 12.1%, 20.2%, and 22.8% of the control.
The BI values for lettuce treated with Na2SeO3 at concentrations ranging from 0.5 mg/L to 2 mg/L were all lower than the control group over the 7-day period. There were no significant changes in BI values between the treatment groups and the control during the first three days. However, it is noteworthy that on the seventh day, the BI values for all treatment groups were significantly lower than the control, with the 1.5 mg/L treatment group showing a significantly lower BI value than the others, representing 55.25% of the control (Figure 8a). The ΔE value represents the degree of color change on the surface at different time intervals, with higher ΔE values indicating greater color difference. As storage time increased, the ΔE values for lettuce treated with Na2SeO3 were lower than the control at different time points. On the fifth day, the ΔE value for the 0.5 mg/L treatment group was significantly lower than the other treatment groups, representing 51.02% of the control (Figure 8b). Therefore, Se-rich lettuce can maintain a better appearance (greenness) during short-term storage.

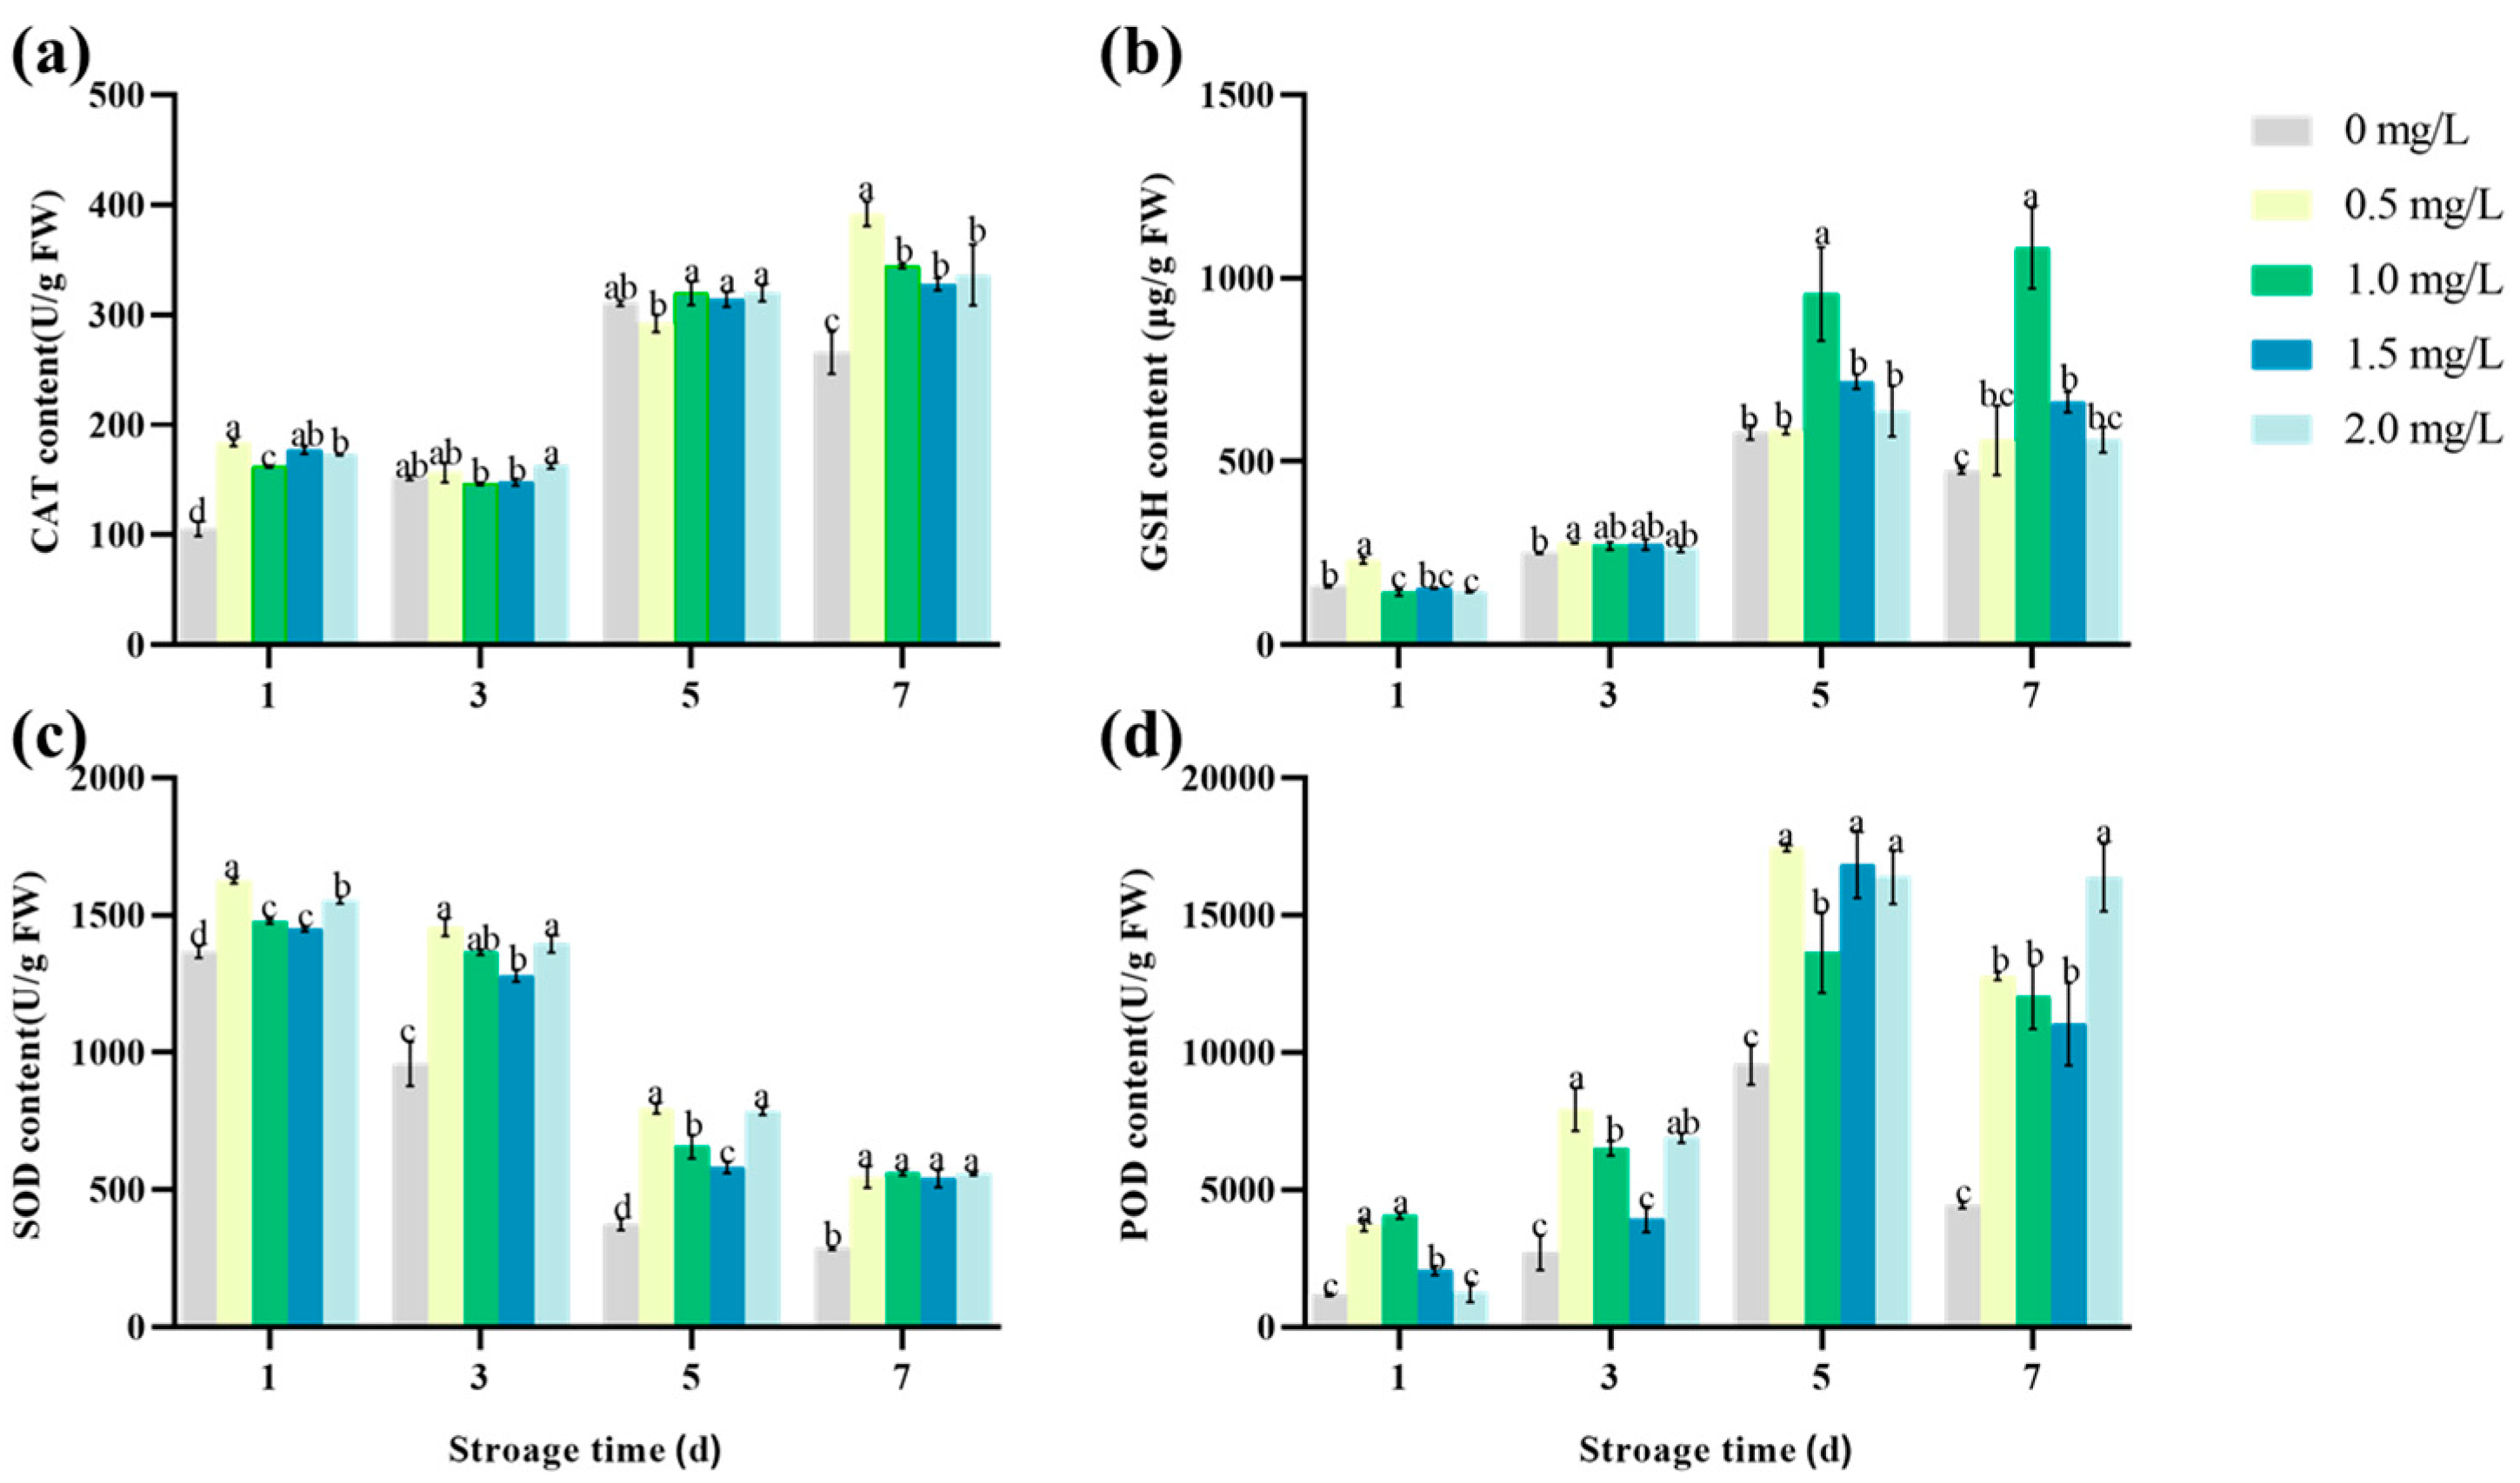
3.7. The Effect of Se on the Antioxidant Properties of Lettuce during Storage

Compared to the control group, lettuce cultivated with Na2SeO3 maintained a higher CAT activity during storage (Figure 9a). While the CAT activity in the control group initially increased and then decreased during the storage period, the CAT activity in the Na2SeO3-treated groups exhibited an upward trend. On the seventh day, it was observed that the enzyme activity in all treated groups was significantly elevated compared to the control group. Notably, the 0.5 mg/L treatment group demonstrated a particularly pronounced increase, achieving an enzyme activity level that was 1.47 times higher than that of the control.
During lettuce storage, the GSH content exhibited a trend of initial increase followed by a decrease. The GSH content peaked on the fifth day in the treatment groups with concentrations of 0, 0.5, 1.5, and 2 mg/L. Among them, the 1 mg/L treatment group had the highest GSH content of 957.17 μg/g, which was 1.65 times higher than that of the control. On the seventh day, the GSH content in the 1 mg/L treatment group reached its highest level of 1082.17 μg/g, which was 2.28 times that of the control (Figure 9b). Therefore, treatment with Na2SeO3 significantly enhanced the content of GSH.
With the prolongation of storage time, the SOD activity in lettuce leaves gradually decreased. However, the SOD activity in the Na2SeO3-treated groups remained higher than that in the control group. On the third day, the 0.5 mg/L treatment group exhibited the highest enzyme activity of 1455.22 U/g, which was 1.52 times higher than that of the control. On the fifth day, the SOD activity in the same treatment group peaked again, reaching 795.86 U/g, which was 2.36 times higher than that of the control. On the seventh day, the 1 mg/L treatment group had the highest SOD activity of 561.76 U/g, which was 1.96 times that of the control (Figure 9c). Therefore, lettuce treated with Na2SeO3 maintained higher SOD activity during storage.
Overall, the POD activity in lettuce exhibited a trend of initial increase followed by a decrease during storage. The POD activity peaked on the fifth day of storage, with the highest enzyme activity of 17,460 U/g observed in the 0.5 mg/L treatment group, which was 1.83 times higher than that of the control. The treated groups also exhibited significantly higher POD activity than the control group on other days. Similarly, compared to the control group, lettuce treated with Na2SeO3 maintained a higher POD activity during storage (Figure 9d).

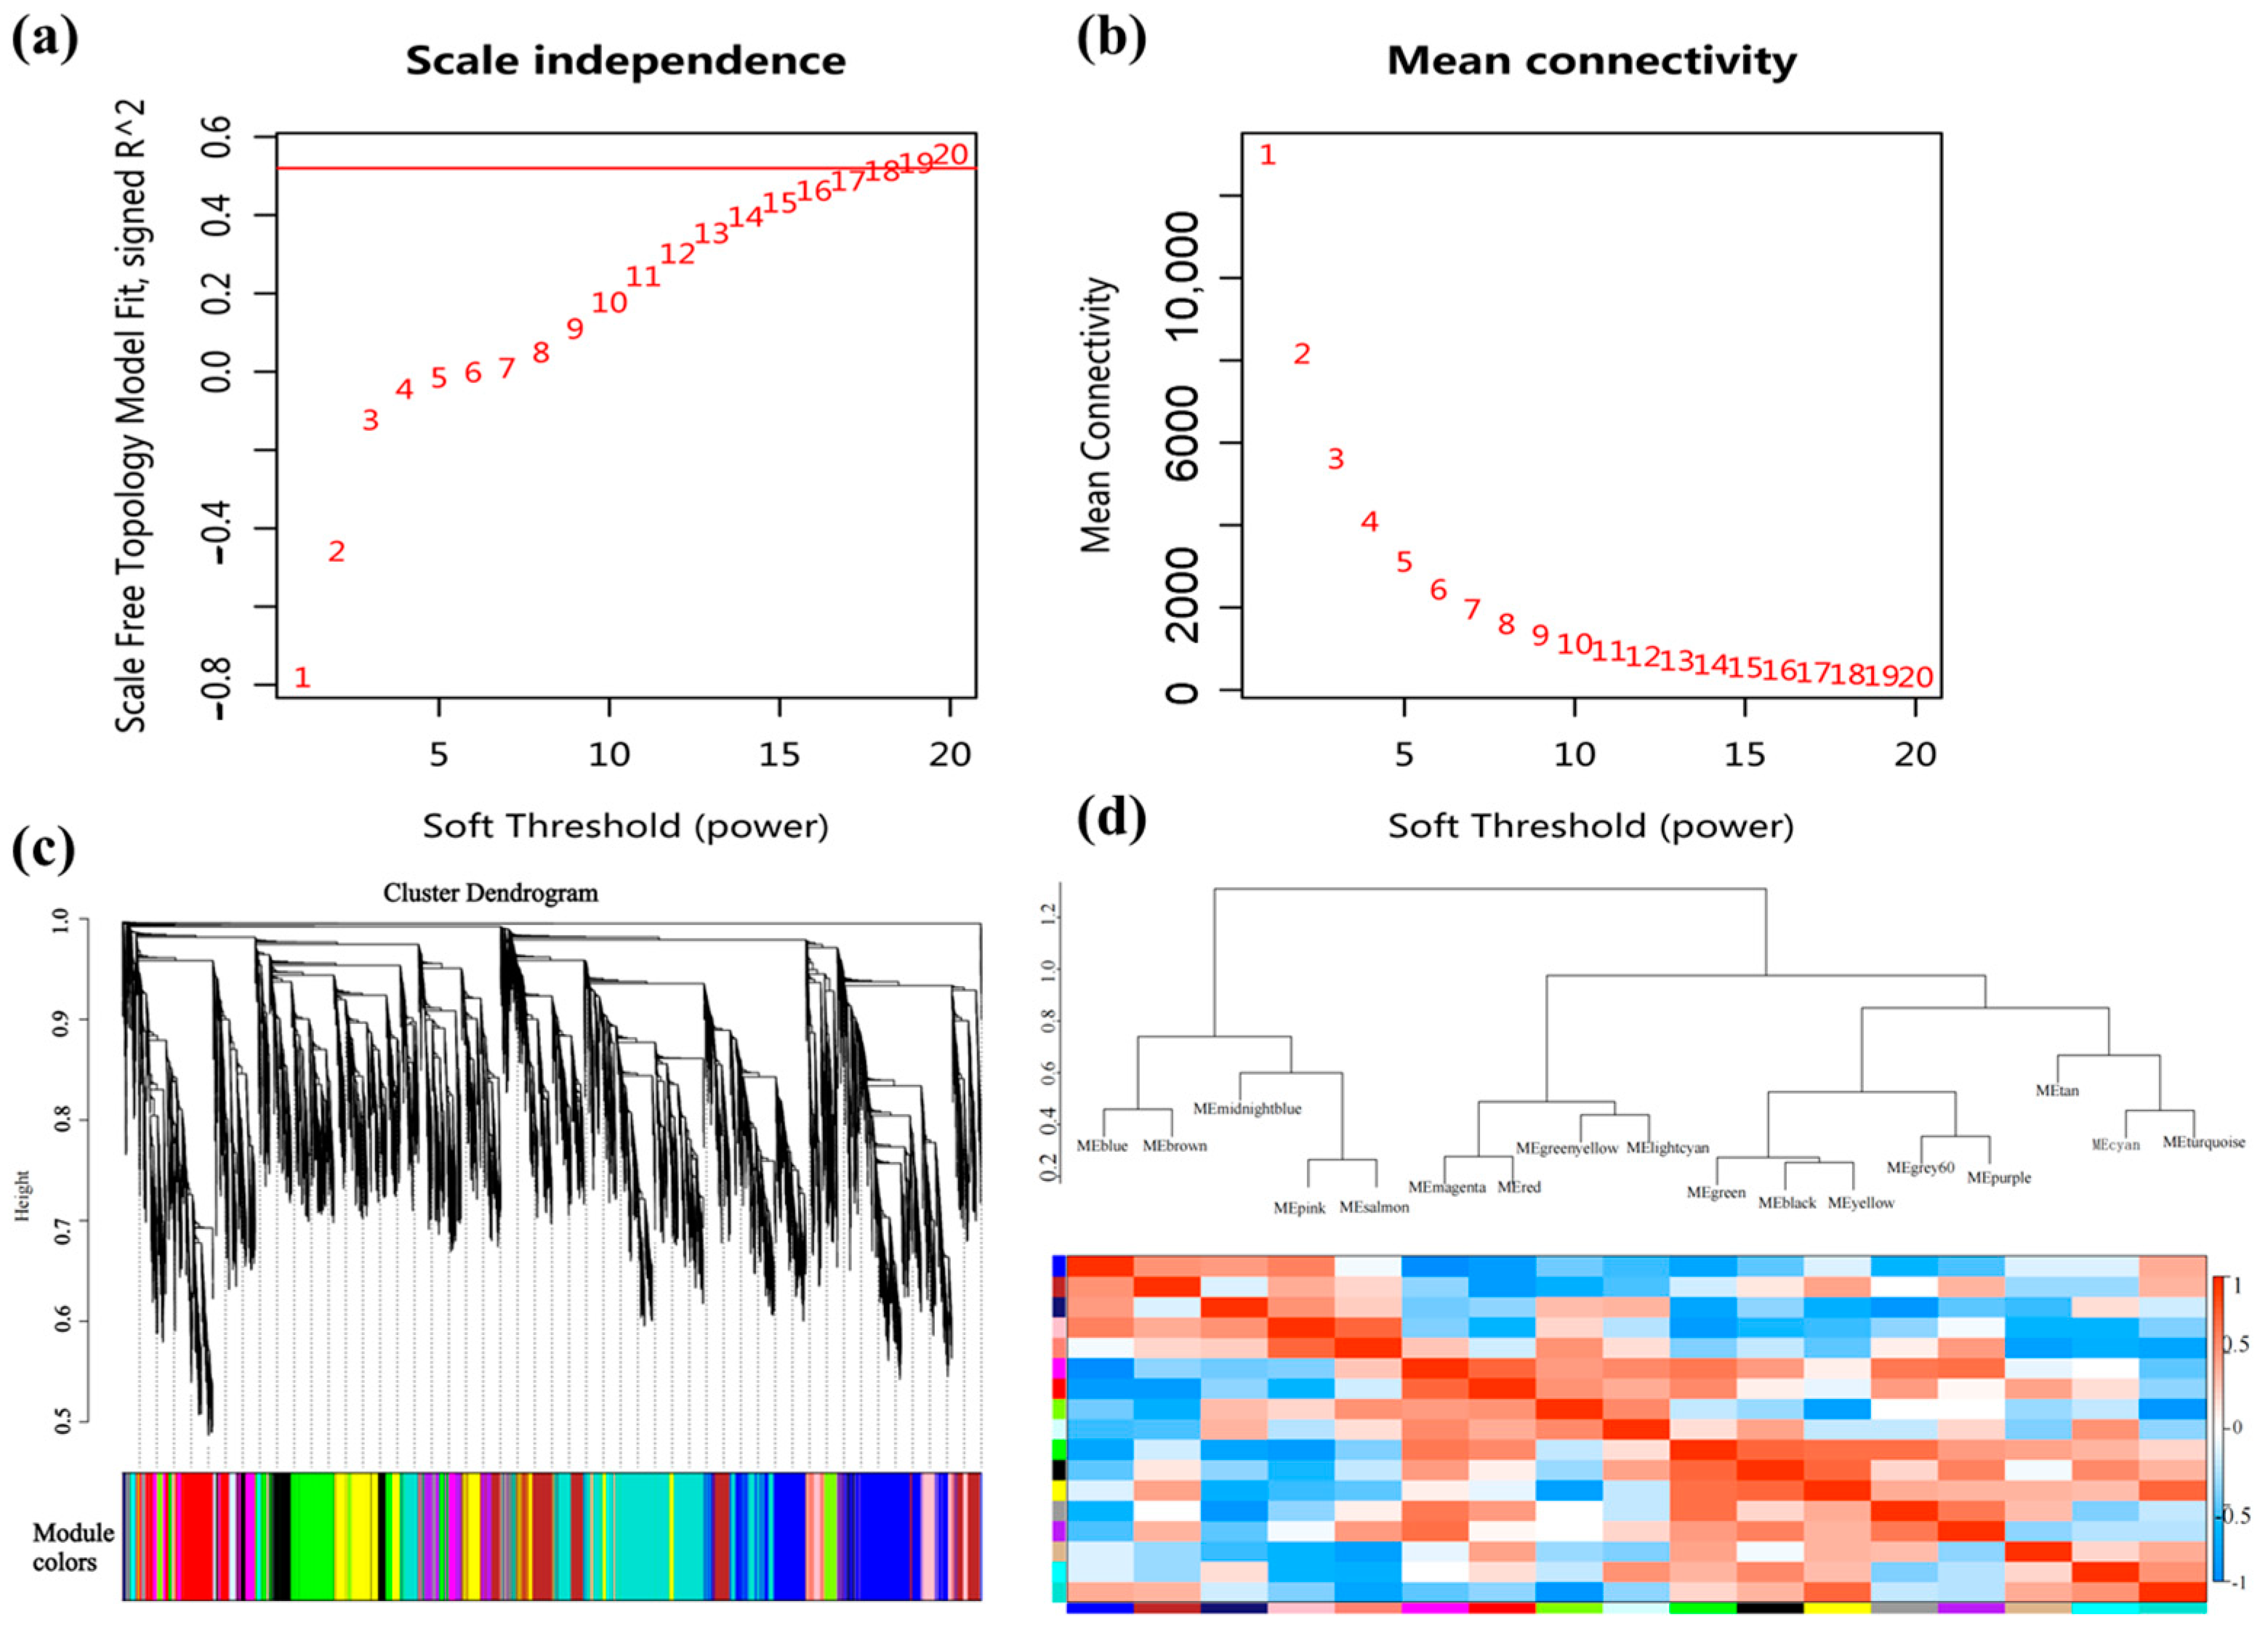
3.8. Transcriptome Data Analysis of Lettuce Treated with Na2SeO3

Table S1 presents the transcriptome data results of lettuce treated with different concentrations of Na2SeO3. The Pearson correlation coefficients of the three biological replicates were generally above 0.8, suggesting good reproducibility of the samples and the reliability of the transcriptome sequencing results (Figure S2). Based on the definition of DEGs, we identified DEGs under various Na2SeO3 concentrations using the criteria of a significance p-value ≤ 0.05 and an absolute value of log2foldchange ≥ 0.0. A total of four DEG comparison groups were established to identify DEGs. Following treatment with 0.5–2.0 mg/L Na2SeO3, the number of upregulated genes ranged from 1846 to 2834, while the number of downregulated genes ranged from 2874 to 1615 (Figure S3).
To identify gene co-expression modules related to Se metabolism in lettuce, we employed WGCNA. After rigorous filtering to exclude genes with low expression levels, 34,543 genes were retained for subsequent network construction. Based on the fitting index and average connectivity under different soft threshold values, a weighted coefficient β of 10 was determined when the fitting index R2 reached 0.6 for scale-free network construction (Figure 10a). Dynamic cutting of co-expressed gene clusters and merging of similar clusters yielded 17 modules. The gene module clustering dendrogram revealed the presence of only one category of co-expression modules (Figure 10b). In the correlation heatmap, Blue modules indicate a negative correlation, with a correlation coefficient between 0 and 0.5. The closer the value is to 0, the stronger the negative correlation. Red indicates a positive correlation, with a correlation coefficient between 0.5 and 1.0. The closer the value is to 1, the stronger the positive correlation (Figure 10c).
The WGCNA analysis distinguished DEGs into 17 related expression modules, which include 216 to 4762 genes, respectively (Figure 11a). To delve deeper into the relationships, a further correlation analysis was conducted between the module eigengenes and Se species (Figure 11b). The findings indicated that the Red and Magenta modules exhibited a positive correlation with organic Se content, whereas the Blue module displayed a negative correlation with the content of Se species. Notably, these three modules encompassed genes that were strongly implicated in Se accumulation in lettuce (Figure 11c).

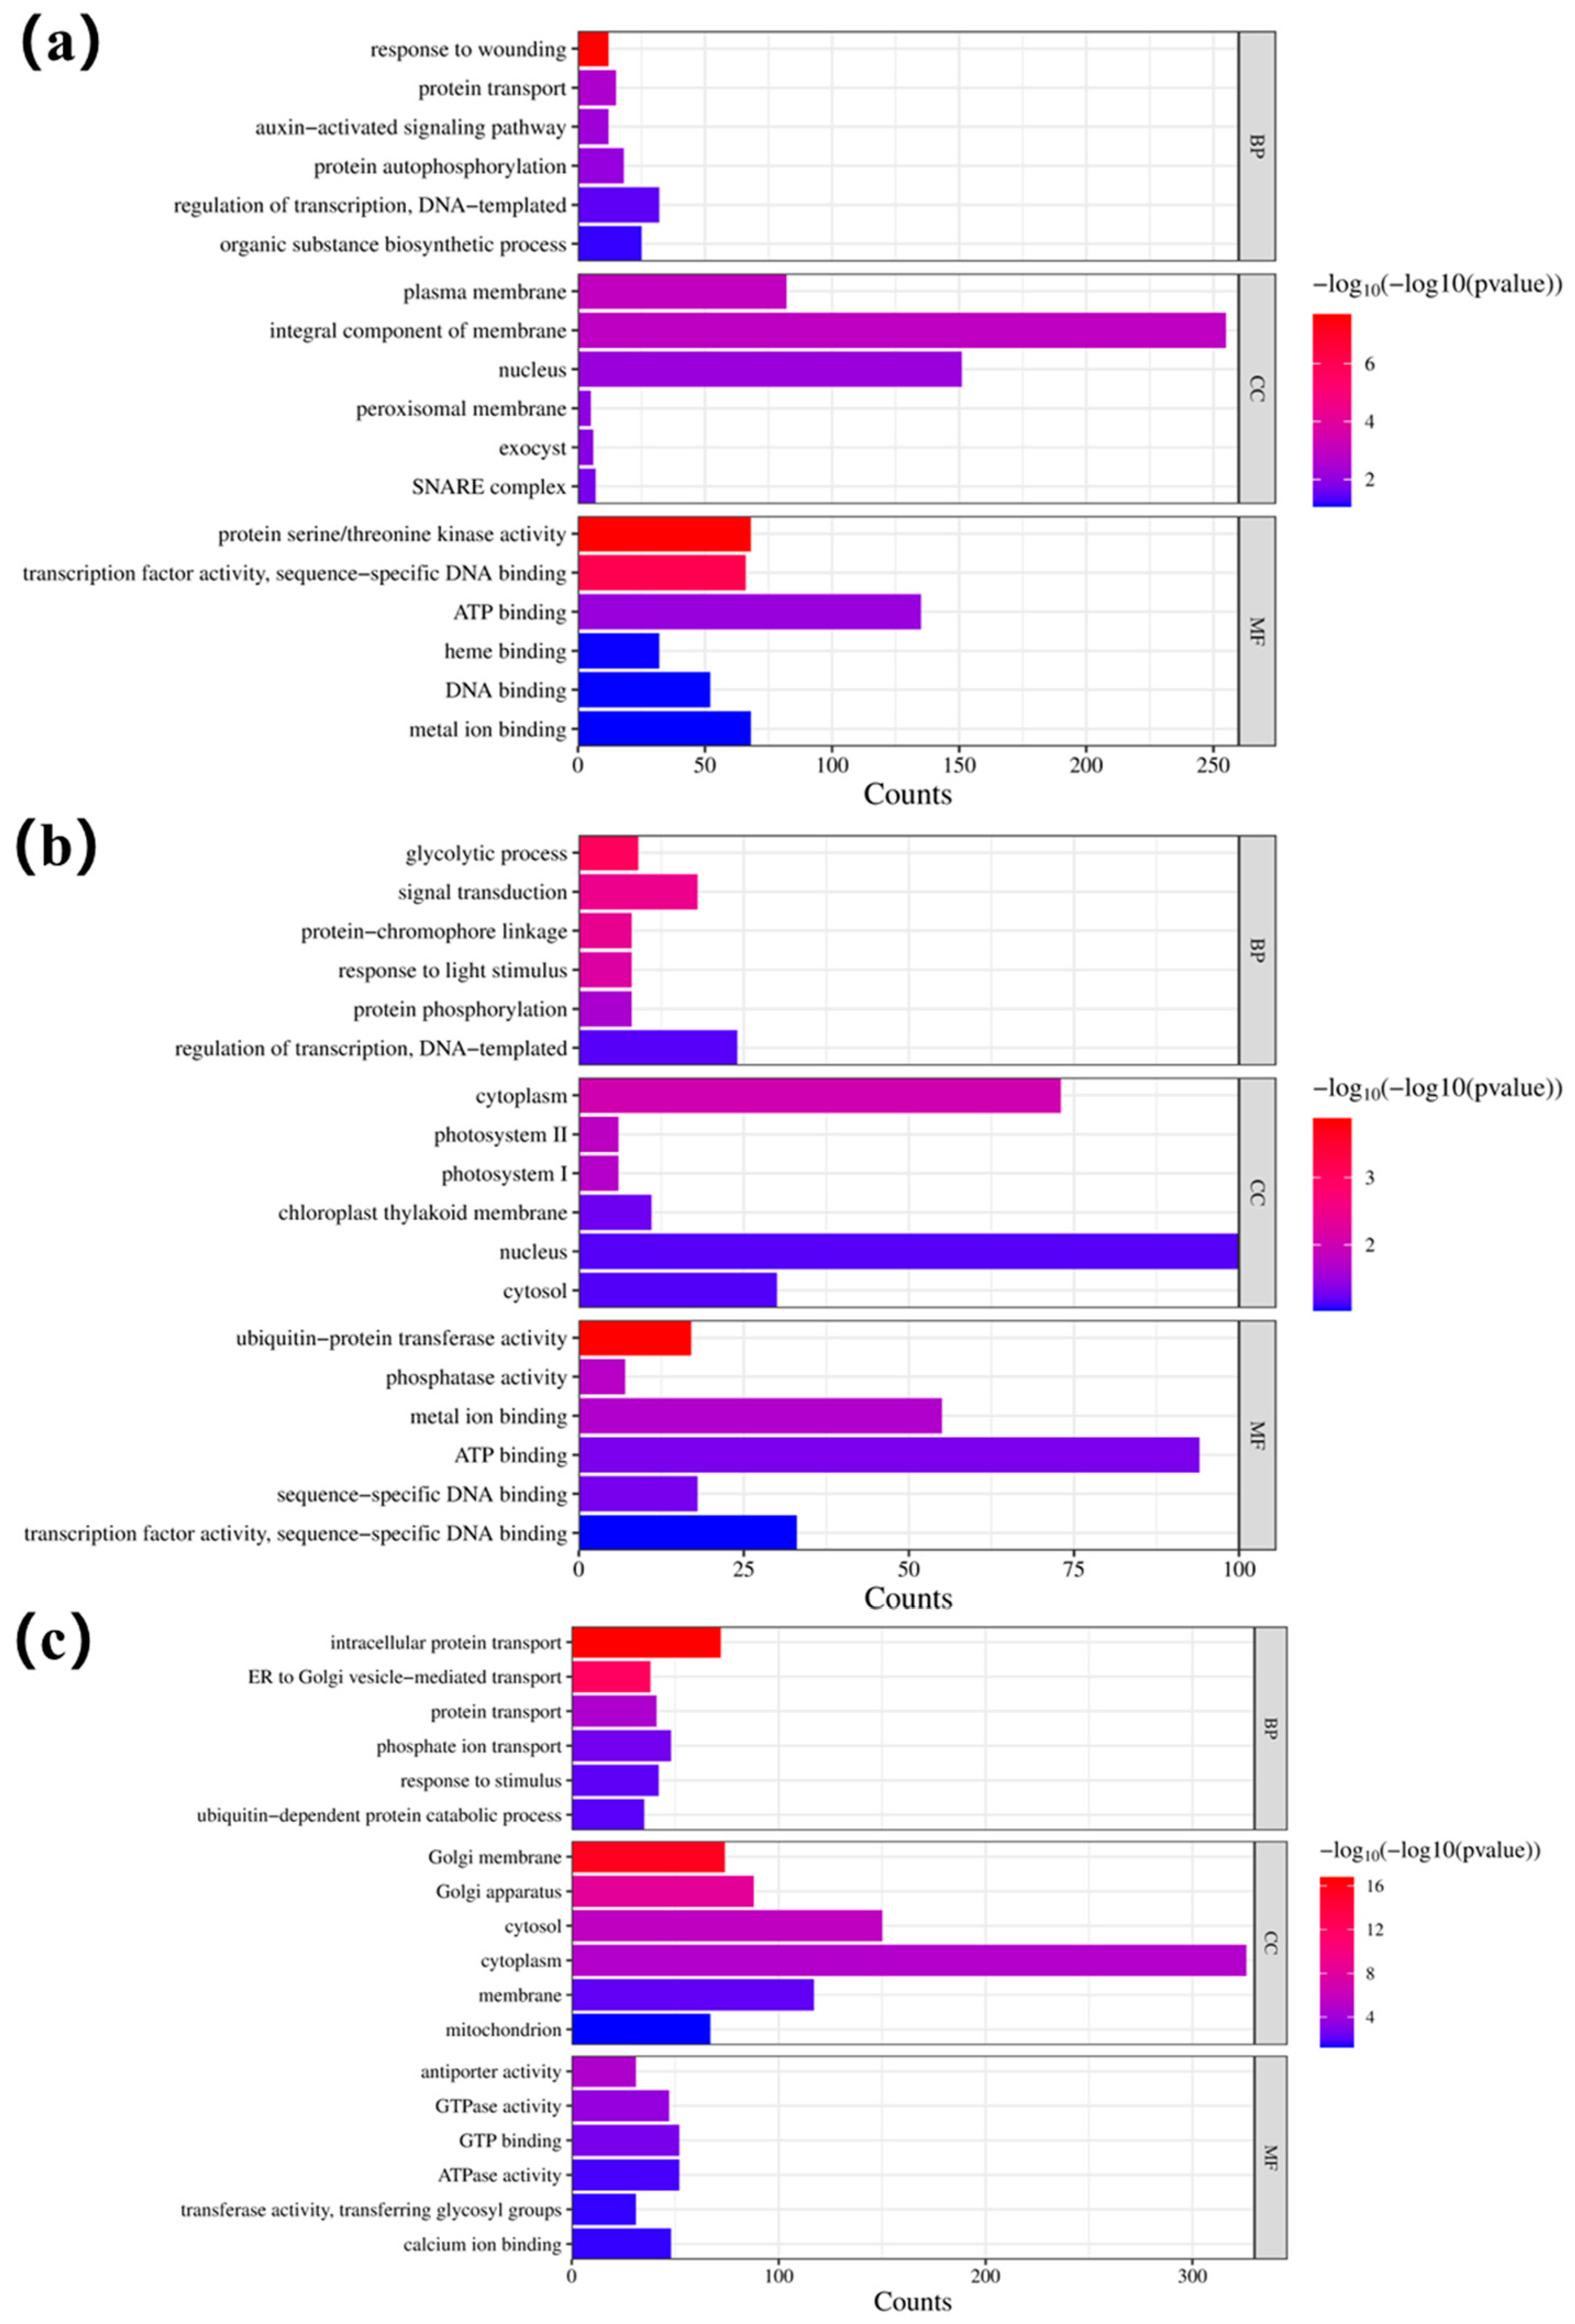
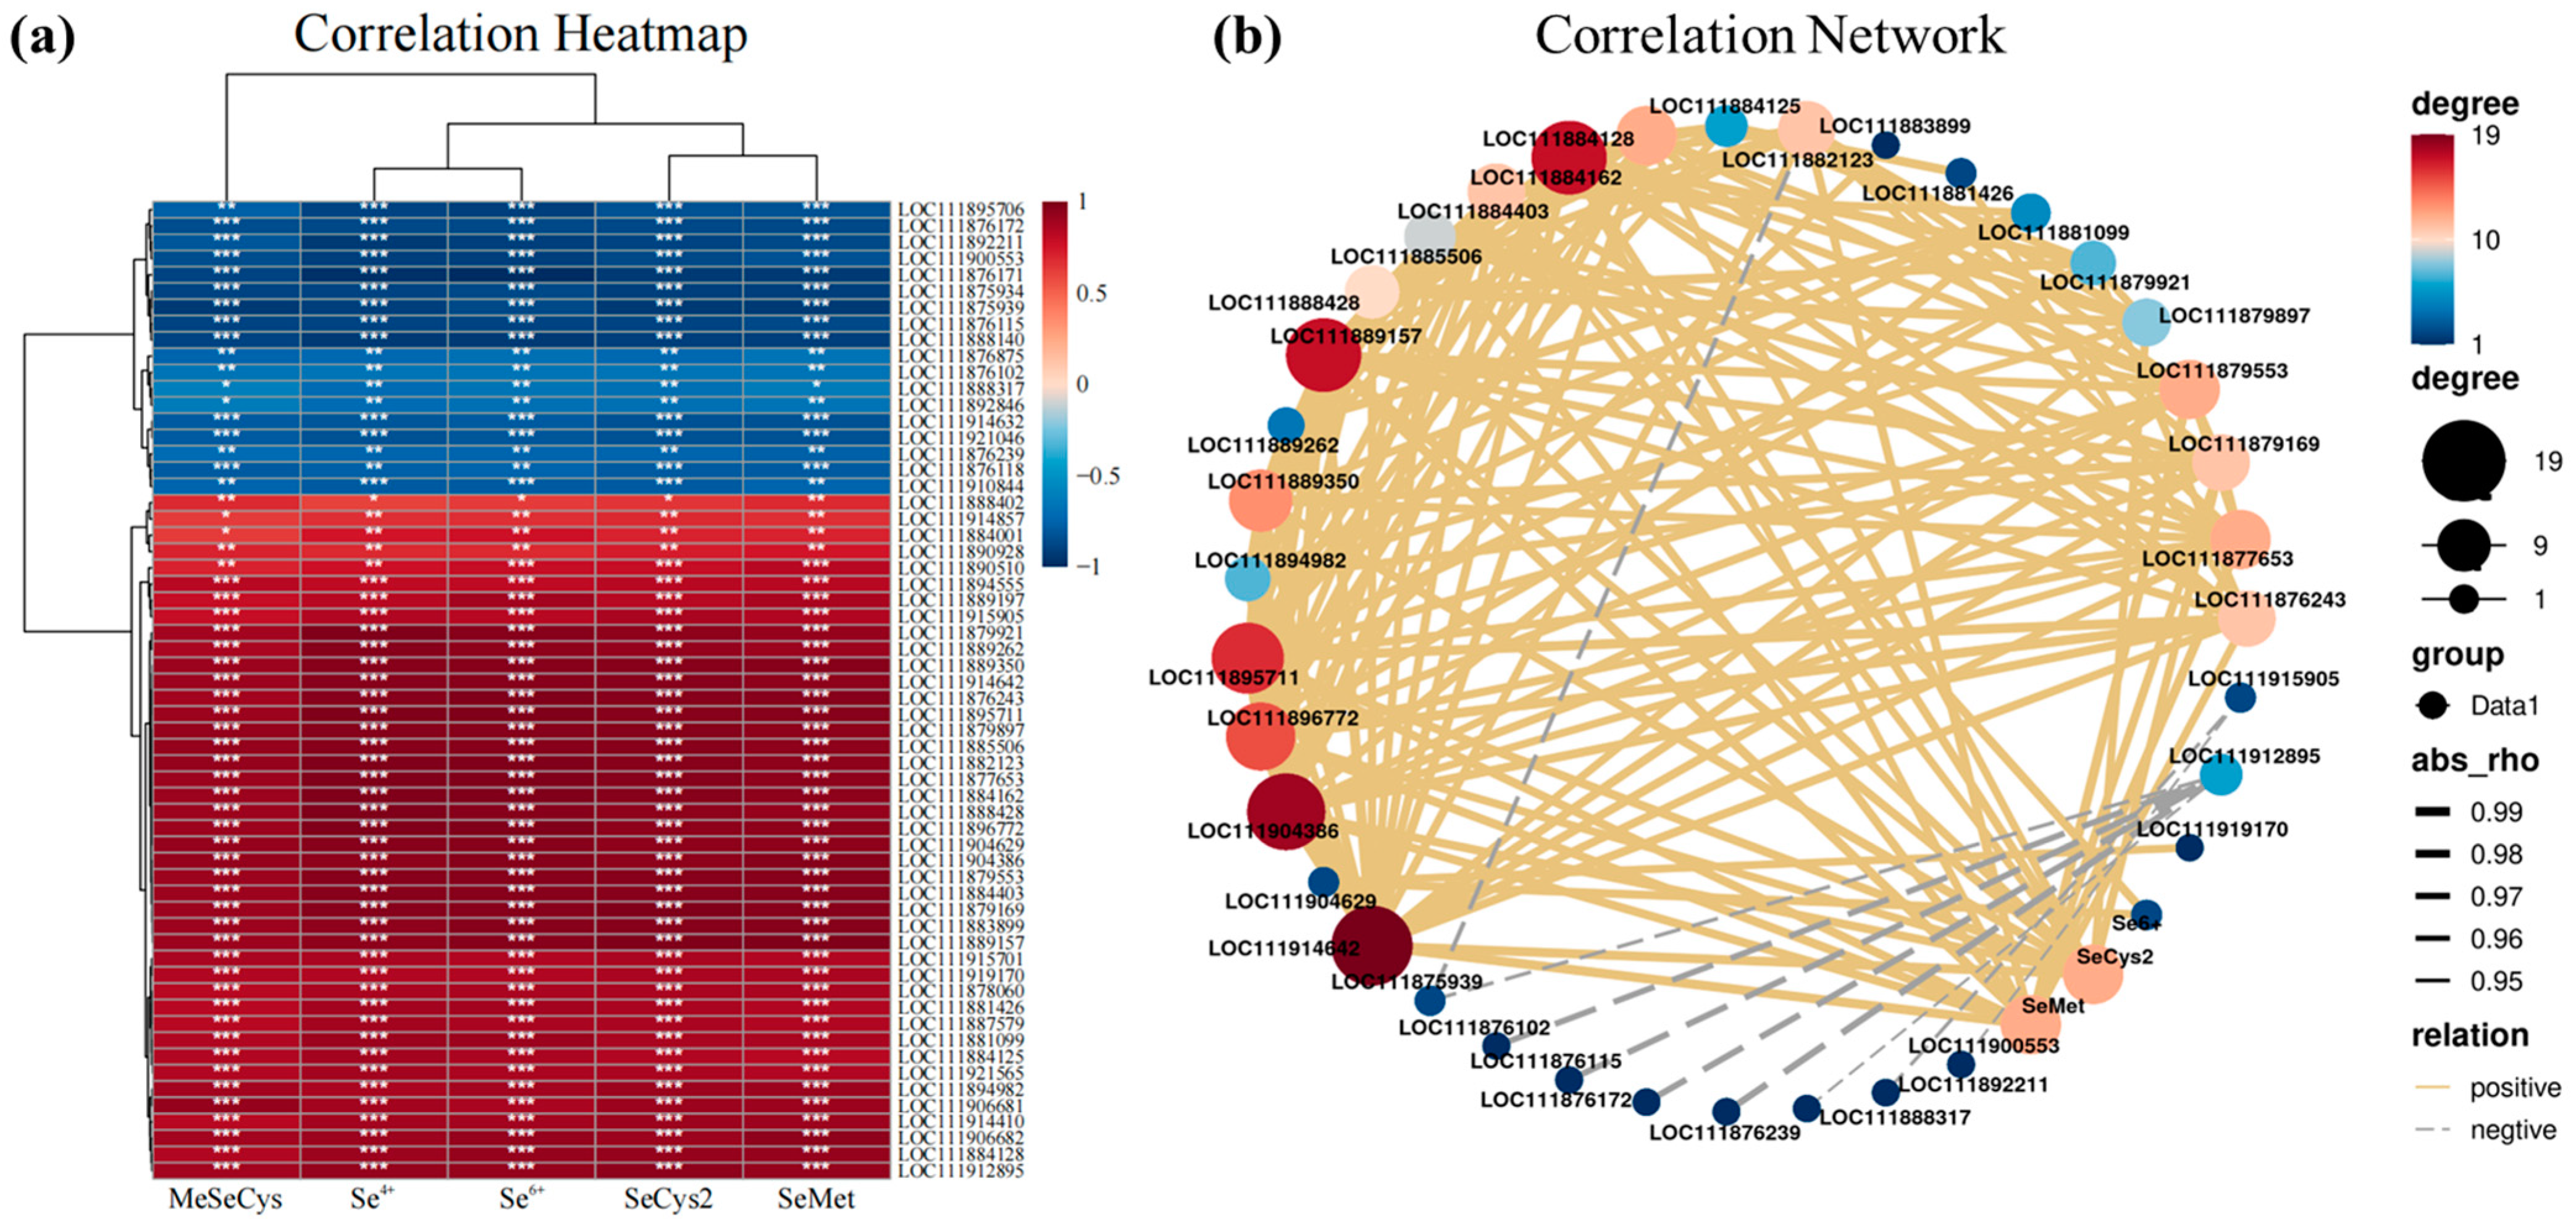
3.9. Gene Function Enrichment and Expression Regulation Analysis of Key Modules

To further analyze the functional genes associated with Se metabolism, the key genes from the aforementioned three modules were selected for GO and KEGG enrichment analyses (Figure 12). Genes within the Red module were predominantly enriched in functions pertaining to wound response in BP, protein serine/threonine kinase activity in molecular function (MF), and integral membrane component in cellular component (CC) (Figure 12a). The Magenta module genes were mainly enriched in the glycolytic process in BP, ubiquitin-protein transferase activity in MF, and nucleus in CC (Figure 12b). Meanwhile, the Blue module genes were predominantly enriched in intracellular protein transport in BP, Golgi membrane, and cytoplasm in CC (Figure 12c).
The results of KEGG revealed that genes within the Red module were predominantly enriched in metabolic pathways related to the biosynthesis of secondary metabolites, plant-pathogen interaction, and phenylpropanoid biosynthesis (Figure 13a). The Magenta module genes were mainly enriched in metabolic pathways, glycolysis/gluconeogenesis, and biosynthesis of secondary metabolites (Figure 13b). Additionally, the Blue module genes were primarily enriched in protein processing in the endoplasmic reticulum, proteasome, and mRNA surveillance pathway (Figure 13c).
The gene expression patterns indicated that all genes in the Red module were significantly upregulated under 1.5 mg/L–2 mg/L treatment, while those in the other groups were significantly downregulated (Figure 14a). Genes in the Magenta module were significantly upregulated under 1.0 mg/L, 1.5 mg/L, and 2.0 mg/L treatments, while those in the other groups were downregulated (Figure 14b). Conversely, genes in the Blue module were significantly downregulated under 1.0 mg/L, 1.5 mg/L, and 2.0 mg/L Na2SeO3 treatments, while those in the other groups were upregulated (Figure 14c).
Sixty genes displaying the utmost relevance to organic Se metabolism were chosen from among the three modules. To gain insights into their biological functions, functional annotations were conducted using detailed information retrieved from the NCBI database (Table S2). Figure 15a presents the correlation analysis results between the hotspot genes and Se content in different forms (p < 0.05). Among them, four genes, including LOC111887579 (NTRC), LOC111888428 (RPK1), LOC111882123 (PTR44), and LOC111890510 (MYB1), exhibited the highest correlation with organic Se content. Figure 15b displays the correlation network between the hotspot genes and Se content in different forms. Notably, LOC111914642 (HFA4C), LOC111889157 (WRKY7), and LOC111884162 (CSLD3) demonstrated the highest association with SeMet and SeCys.

4. Discussion

4.1. The Effect of Na2SeO3 on the Growth and Nutritional Quality of Lettuce

Research has shown that low-dose Se was beneficial for plant growth, while excessive Se had an inhibitory effect on plant development. Ahlam et al. observed that compared to the control group, low concentrations of Na2SeO3 treatment (2.5 and 5 mg/L) significantly increased the yield of quinoa. However, when the concentration of Na2SeO3 was raised to 10 and 20 mg/L, all growth parameters of quinoa were reduced [23]. Wang et al. conducted a hydroponic experiment using different concentrations of selenate (0, 0.15, 0.30, 1.50, 3.0, 5.0, 8.0 mg/L) on tea seedlings and found that the total Se content in the roots and new shoots increased with the Se concentration, but concentrations above 3 mg/L inhibited the growth of the tea plants [24]. Jia et al. treated tea plants with GlcN-Se-150, resulting in a 36.36% increase in leaf bud weight compared to the control group. However, the bud weight in the GlcN-Se-200 treatment group decreased slightly, possibly due to the excessively high Se concentration [25]. Chlorophyll a plays a crucial role in photosynthesis, while chlorophyll b and non-chlorophyll pigments assist in dissipating excess sunlight energy. Carotenoids protect plants from photodamage by reducing light stress [26]. Se treatment has been shown to improve plant growth conditions and enhance photosynthetic efficiency. Low concentrations of Se treatment significantly increase the content of chlorophyll a, b, total chlorophyll, and carotenoids in plants [27]. In this study, the application of low concentrations of Na2SeO3 effectively enhanced the photosynthetic pigment content in lettuce. KEGG analysis revealed that this treatment significantly activated metabolic pathways, including glucose metabolism/neogenesis and biosynthesis of secondary metabolites. These biochemical processes are intimately linked to the augmentation of plant height and biomass in lettuce. However, as the concentration of treatment increased, a decline in the photosynthetic pigment content of lettuce leaves was observed, ultimately suppressing its growth.
The nutritional quality of vegetables was usually related to the content of soluble protein, soluble sugar, Vc, total phenols, flavonoids, and anthocyanins. Cardoso et al. reported that Se treatment in rice resulted in an elevation of sulfur content, which in turn strengthened the antioxidant system and consequently led to an increase in Vc content [28]. Huang et al. observed that applying different concentrations of Se to radish leaves promoted the absorption of nutrients, resulting in a 25.13% increase in soluble sugar content [29]. Ding et al. reported that using different concentrations of Na2SeO3 combined with pulp and paper mill effluent (PFA) could enhance Se conversion in peanut sprouts and increase the content of soluble sugar and soluble protein [30]. Zhu et al. noted that Se treatment increased flavonoid content in tomatoes by 1.5 times [31]. Bachiega et al. applied 50 µM selenate to broccoli, resulting in a significant increase in total phenols [32]. Sabrina et al. found that Se biofortification also affected the total phenol content in apples [33]. Weronika et al. treated alfalfa, radish, and white mustard with Se (20 µmol/L), which increased anthocyanin accumulation but did not significantly alter the levels of 1-ascorbic acid or free radical scavenging activity [34]. Mohammad conducted a hydroponic experiment using different concentrations of Se (0, 0.125, 0.25, 0.50, and 1.00 mg/L) on wheat. At concentrations of 0.25–0.50 mg/L, there was a significant increase in bioactive components such as phenols, flavonoids, Vc, and anthocyanins [35].
Appropriate concentrations of Na2SeO3 promote the accumulation of various nutrients in lettuce, optimizing its growth performance and enhancing its nutritional value. Specifically, concentrations ranging from 0.5 mg/L to 1.5 mg/L of Na2SeO3 were found to significantly increase the levels of soluble sugars and soluble proteins. Additionally, these concentrations also promoted the accumulation of secondary metabolites such as flavonoids, total phenols, and anthocyanins. These findings are intimately linked to the activation and enrichment of metabolic pathways associated with DEGs, as revealed through KEGG analysis.

4.2. The Effect of Se on the Antioxidant Capacity of Lettuce

The antioxidant defense system of plants serves to prevent the accumulation of reactive oxygen species (ROS) and minimize cellular damage during stressful conditions and environmental challenges [36,37]. Se has been shown to mitigate oxidative damage in plants exposed to various environmental stressors, such as heavy metals, heat, and cold [38]. Appropriate concentrations of Se treatment can significantly enhance the activity of antioxidant enzymes, strengthen the antioxidant metabolism of plants, and reduce the production of ROS during plant metabolism. Barbara et al. employed Se biofortification to enhance the physiological tolerance of Valerianella locusta L. to heat stress. Heat stress treatment led to the accumulation of large amounts of H2O2 in the leaves of V. locusta, while Se treatment increased the activity of antioxidant enzymes such as POD and CAT, reduced GSH content, and thereby improved its heat tolerance [39]. Foliar application of Se alleviated cadmium-induced physiological stress in rice, enhancing antioxidant enzyme activity, GSH and protein content, and yield (7.58%), while reducing MDA and proline levels in the leaves [40]. Shalaby et al. conducted a biofortification study on lettuce grown in high-salt soil using four concentrations of Se (0, 50, 70, and 100 ppm). Their results showed that treatment with 100 ppm Se increased CAT and APX activity by 108.8% and 123.6%, respectively. Additionally, compared to the control, Se treatment at 100 ppm reduced electrolyte leakage in lettuce leaves by 68.4% and increased total yield by 42.1% [41]. Se also promotes growth and photosynthesis under salt stress in tomato seedlings by enhancing their chloroplast antioxidant defense system, while simultaneously reducing levels of ROS and MDA [42].
In the present study, a slight elevation in MDA content was observed upon treatment with 0.5 mg/L Na2SeO3. This observation could be attributed to the fact that low concentrations of Na2SeO3 did not trigger a stress response in antioxidant enzyme activity, resulting in a marginal increase in MDA. However, at a higher concentration of 1.0 mg/L, Na2SeO3 effectively potentiated the antioxidant enzyme activity in lettuce, mitigating oxidative damage and consequently decreasing MDA content. Furthermore, the upregulation of glutathione S-transferase gene expression is advantageous for augmenting the antioxidant metabolism in lettuce (Table S2), thereby mitigating the accumulation of MDA content. As Se concentrations continued to rise beyond the plant’s tolerance threshold, MDA levels increased again. All concentrations of Na2SeO3 treatment enhanced the activity of antioxidant enzymes in lettuce, with a general trend of initial increase followed by a decrease. The higher GSH content, SOD, POD, and CAT activity was observed at a concentration of 1.0 mg/L of Na2SeO3. Overall, the 1.0 mg/L treatment was effective in enhancing the antioxidant activity of lettuce and reducing oxidative damage.

4.3. The Impact of Na2SeO3 on the Changes in Total Se and Se Species Content in Lettuce

Se content serves as a crucial indicator for evaluating the quality of Se-rich crops, and it exhibits a positive correlation with the concentration of Na2SeO3 treatment in lettuce. At a concentration of 2.0 mg/L, the Se content reaches its peak. Analysis of Se species reveals the presence of five distinct forms: SeCys2, MeSeCys, Se(IV), SeMet, and Se(VI) in the treated groups, with varying concentrations. Among these Se species, SeCys2, MeSeCys, and SeMet, collectively classified as organic Se, constitute the majority, accounting for over 90% of the total Se content. Notably, the highest content of organic Se is observed at a concentration of 0.5 mg/L. Previous studies by Maila et al. have demonstrated that Se species are influenced by Se sources and application methods, with all inorganic Se treatments (both soil and foliar) enhancing Se content in soybeans compared to the control. Moreover, over 80% of the total Se in grains exists in the form of SeMet [43]. Zhou et al. conducted a study in which different concentrations of selenite, selenate, and Se yeast were injected into the substrate as Se supplements to produce Se-rich shiitake mushrooms. Their results indicate that Se content in shiitake mushrooms initially increases and then decreases over time. Based on Se accumulation in shiitake mushrooms, the utilization efficiency of Se follows the order: selenite > selenate > organic Se. SeMet is the primary Se species found in the fruiting bodies of shiitake mushrooms, and its proportion within the total Se content increases as the duration of selenite and selenate treatments increases [44].
The present study demonstrates that Na2SeO3 treatment can significantly enhance the total Se content and Se species in lettuce, suggesting that lettuce possesses strong potential for Se biofortification.

4.4. The Effect of Se on the Storage Ability of Lettuce

Se enhances the nutritional quality of lettuce while improving its stress resistance, thereby strengthening its storage capacity. Li et al. conducted a study to assess the quality changes in Se-enriched germinated brown rice (Se-GBR) and germinated brown rice (GBR) under varying temperature conditions. The study involved measuring the fatty acid value (FAV), peroxide value (POV), and carbonyl value (CV) at regular intervals of 45 days. Over the course of storage, a gradual elevation in FAV, POV, and CV was observed. Notably, Se-GBR exhibited significantly lower FAV, POV, and CV values compared to GBR, suggesting a beneficial role of Se in preserving rice quality [45]. Babalar et al. significantly increased Se concentrations in apple leaves and fruits through foliar Se application. Se application effectively enhanced Se content and nutritional characteristics in the fruits. Additionally, Se delayed fruit ripening and softened flesh by reducing ethylene biosynthesis, positively affecting apple quality and shelf life [46]. The pre-harvest application of 100 μmol/L selenite to the roots of cabbage resulted in an enhancement of antioxidant enzyme activities, including POD, CAT, GSH-Px, and GR. Additionally, this treatment led to an increase in the levels of AsA, GSH, phenolics, and flavonoids during the storage period. Furthermore, the selenite application mitigated post-harvest weight loss, retarded leaf yellowing, and suppressed protein degradation [47].
The current investigation reveals that lettuce treated with Na2SeO3 exhibited superior appearance color, color difference, and BI compared to the untreated group during storage. Additionally, the activity of antioxidant enzymes within the treated lettuce was higher than that of the control group. These findings suggest that Se biofortification is beneficial for extending the shelf life of lettuce, thereby enhancing its overall nutritional quality and marketability.

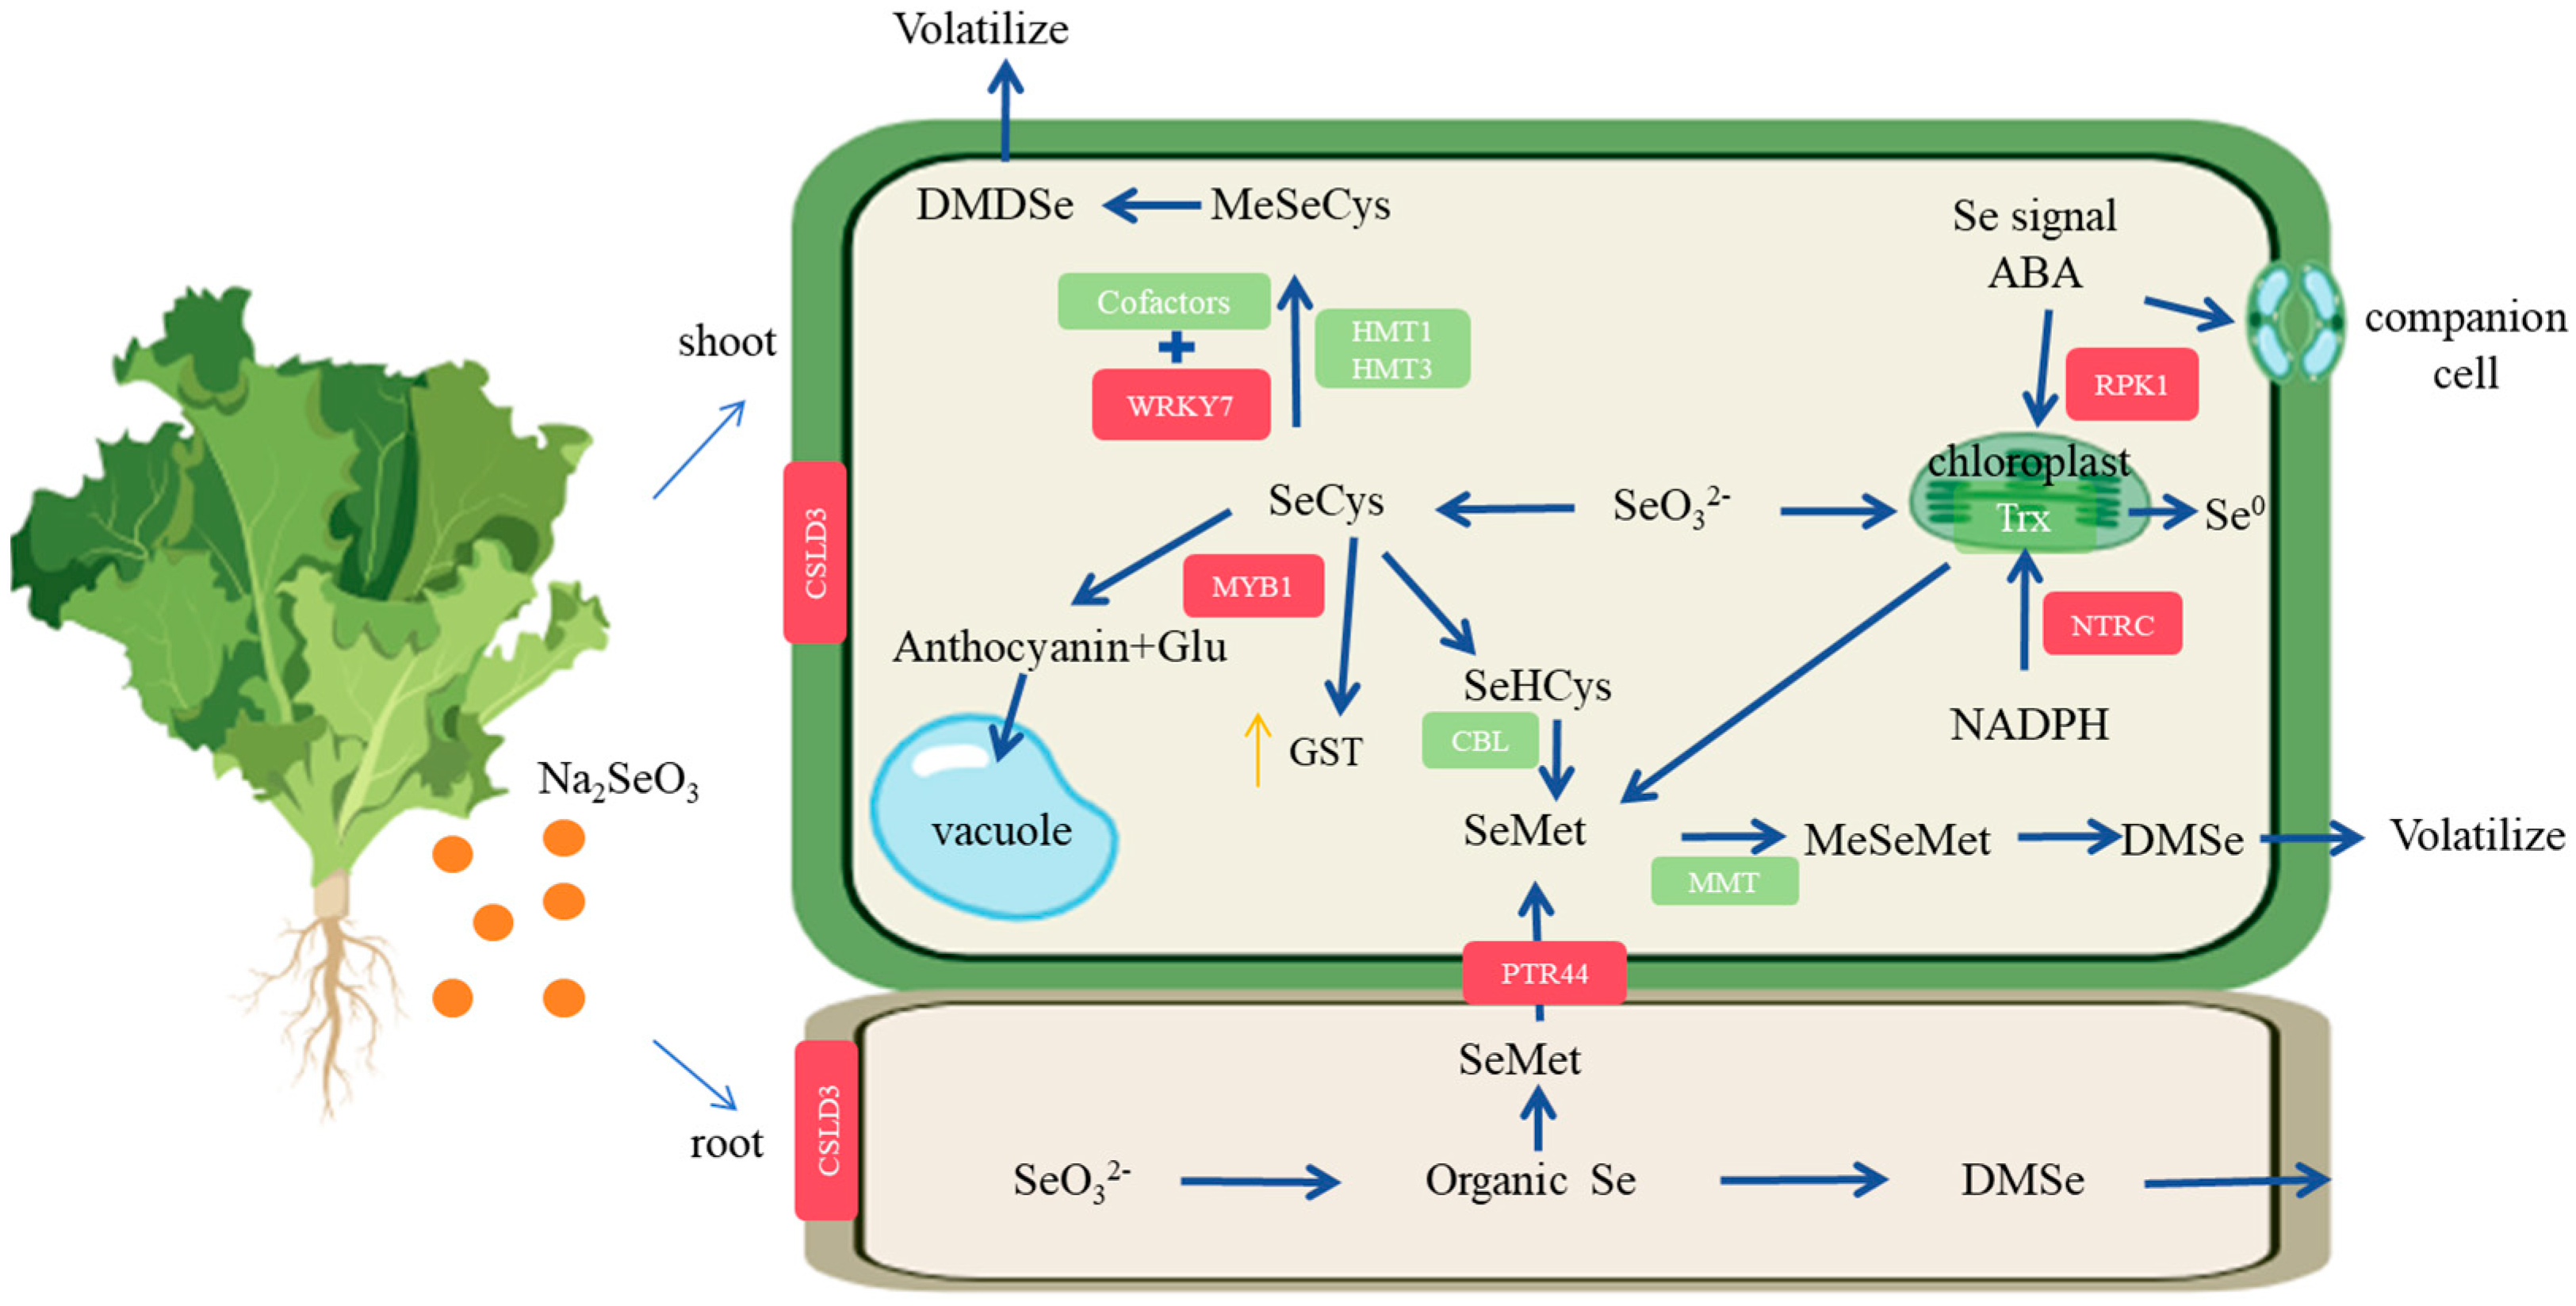
4.5. Molecular Mechanism of Lettuce Absorbing and Transforming Se

Selenate and selenite represent the two biologically accessible forms of Se present in soil. Additionally, organic Se compounds, which are also present in specific soil types, can be efficiently absorbed by plant roots [48]. Studies have shown that Se metabolism is closely associated with sulfur metabolism, allowing Se to be transported within plants via sulfur metabolic pathways [49]. Plants possess four distinct groups of sulfate transporters, all of which function as H+/sulfate co-transporters [50]. SULTRs1;1, SULTRs1;2, and SULTRs1;3 are high-affinity transporters, with SULTR1;1 and SULTR1;2 facilitating sulfate and selenate absorption in plant roots [51,52]. Inorganic phosphate (Pi) transporters may be involved in selenite absorption in plant roots, and overexpression of specific Pi transporters has been shown to significantly increase selenite uptake [53]. Studies in rice have revealed that the aquaporin NIP2;1 is involved in selenite absorption [54].
After absorption by the root system, Se(VI) is primarily transported to the shoot via the xylem through sulfate transporters (low-affinity transporters SULTRs2;1-2;2) and redistributed by the phloem [55]. Internally, selenate enters the vacuole primarily through anion channels and is expelled by transporters (SULTRs4;1-4;2) located in the vacuolar membrane [56]. Chloroplasts contain transporters (SULTRs3;1-3;5) that mediate selenate intake [57]. Additionally, plants can directly absorb SeCys and SeMet from the soil [58]. Transcriptome data analysis has indicated that genes such as MYB1, RPK1, PTR44, NTRC, WRKY7, and CSLD3 in lettuce are associated with the stress response to Se treatment.
The MYB family is a large group with four subfamilies, among which R2R3-MYB is the most common type regulating anthocyanin synthesis [59]. MYB1 serves as a key positive regulator of anthocyanin production. Overexpression in onions has been shown to induce anthocyanin production [60]. Se supplementation not only increases the total concentration of anthocyanins in mature wheat grains but also enhances the total flavonoid content [61]. Xia et al. found that the addition of Na2SeO3 significantly upregulated genes related to anthocyanin synthesis, leading to the accumulation of anthocyanin metabolites [62]. Varieties with high anthocyanin concentrations typically have higher Se concentrations, and colored varieties tend to have higher Se absorption rates. Se and anthocyanins may be linked through their shared R2R3-MYB transcription factors and glutathione S-transferases [63]. In the present study, treatment with 0.5 mg/L Na2SeO3 enhanced the accumulation of flavonoids and anthocyanins in lettuce, presumably due to the upregulation of MYB1 expression. Furthermore, the increased anthocyanin content facilitated the absorption and sequestration of Se within the lettuce, indicating a potential synergistic effect between these two biochemical processes.
Receptor-like protein kinase 1 (RPK1) was a pivotal gene-encoding leucine-rich repeat-containing receptor-like kinases (LRR-RLKs), and its transcriptional activation was triggered by diverse stress factors including abscisic acid (ABA), dehydration, high salinity, and low temperature [64]. In plant systems, the interaction between RPK1 and BAK1 facilitates the unidirectional phosphorylation of RPK1. Subsequently, RPK1 engages with CaM4, resulting in the generation of ROS and ultimately modulating the transcriptional profiles of genes implicated in senescence and cell death processes [65]. Compared to treatment with Se alone, the combined application of Se and ABA significantly enhances Se absorption and translocation to diverse regions of the leaf, including guard cells, as well as facilitates Se transportation within chloroplasts [66]. Additionally, Se treatment may lead to the phosphorylation of numerous transcription factors (WRKY, bHLH, and NAC) to adapt to Se stress responses [67]. In this study, RPK1 expression is induced by ABA, and under Se supplementation, Se + ABA promotes Se absorption and transport to guard cells and chloroplasts in the leaves.
The CSLD proteins were initially hypothesized to be responsible for synthesizing cellulose within developing pollen tubes [68]. CSLD2, CSLD3, and CSLD5 are also involved in the construction of newly formed cell walls during cytokinesis in plants [69]. Li et al. studied Se concentrations ranging from 0.5 to 6 μmol/L and found no negative effects on the fresh weight, dry weight, and root length of shoots and roots, which were all higher than those of the control group [70]. In this study, Se promotes the elongation of plant roots, and CSLD3 is involved in cell wall construction, where plant growth enhances Se absorption.
The NRT1/PTR family (NPF) proteins were initially characterized as nitrate transporters. In recent years, it has been discovered that this transporter family also mediates the transport of plant hormones such as auxin, ABA, and gibberellic acid, as well as secondary metabolites such as glucosinolates [71]. Bo’s research demonstrated that the addition of selenite can reduce the nitrate content in lettuce, suggesting that selenite may regulate the expression of NRT genes to mitigate nitrate accumulation in lettuce [72]. NRT1.1B plays a pivotal role in nitrate acquisition and transport in rice, and its overexpression can promote the translocation of SeMet from roots to aerial parts, thereby enhancing the content of organic Se in rice grains [73]. In this study, PTR44, a member of the NRT1/PTR family, facilitated the metabolism of selenite in roots, with most SeCys being converted to SeMet and a small fraction being transformed into MeSeCys.
WRKY transcription factors constitute an important family that plays a crucial role in plant biotic and abiotic stress responses [74,75]. Under Se stress, Arabidopsis thaliana rapidly induces the transcription of WRKY47, which is subcellularly localized in the nucleus. When WRKY47 is overexpressed, it directly or indirectly activates the expression of PHT1;4, enhancing Se translocation into plants [76]. In the present study, WRKY7 belongs to the WRKY transcription factor family and works synergistically with other cofactors to promote Se translocation.
NADPH-thioredoxin reductase C (NTRC) is a vital regulatory factor in leaf photosynthesis. The thioredoxin (Trx) system exists in plant chloroplasts [77]. In Escherichia coli, the Trx system serves as the primary Se delivery system from selenite to selenoproteins [78]. Thioredoxin reductases belong to a rare family of “selenoproteins” that contain the 21st amino acid, selenocysteine, within their protein sequences [79]. Kim et al. demonstrated the ability of thioredoxin to promote germination and seedling growth in barley in the presence of selenite [80]. In the present study, the addition of Na2SeO3 during lettuce cultivation synergistically promoted plant growth with thioredoxin.

5. Conclusions

Compared to the control group, the application of low-concentration Na2SeO3 had a significant effect on the growth, nutritional value, and antioxidative capacity of lettuce, enhancing its shelf life. After treatment with Na2SeO3, lettuce accumulated five primary forms of Se, with SeMet being the predominant organic Se species. During storage, lettuce from the treatment group exhibited lower weight loss, reduced browning, and improved color parameters (a*, b*, BI, and ΔE). Furthermore, antioxidant enzyme activity was elevated in the treated group. Transcriptome analysis revealed that MYB1 was involved in Se absorption and glutathione S-transferase activity, while RPK1 was associated with Se absorption and translocation to protective cells and chloroplasts in leaves. CSLD3 participated in cell wall construction in Se-treated plants, promoting growth, and PTR44 facilitated selenite absorption in roots. WRKY7 regulated the expression of downstream cofactors related to Se transport (Figure 16). These findings enhance our understanding of Se absorption and organic Se transformation in plants, providing valuable insights for Se biofortification in lettuce cultivation and shelf life extension strategies.

Supplementary Materials

The following supporting information can be downloaded at: https://www.mdpi.com/article/10.3390/agronomy14071380/s1, Figure S1: Changes in appearance of lettuce treated with different concentrations of Na2SeO3 during post-harvest storage at room temperature; Figure S2: Heatmap of gene expression level correlation in the transcriptome data of lettuce treated with different concentrations of Na2SeO3; Figure S3: Statistics of DEGs in lettuce treated with various concentrations of Na2SeO3 compared to the control group. The gray bars represent the total number of DEGs, the blue bars represent the number of downregulated genes, and the red bars represent the number of upregulated genes; Table S1: Transcriptome data analysis of lettuce treated with different concentrations of Na2SeO3; Table S2: Sixty highly correlated genes were identified from the Red, Magenta, and Blue modules through a WGCNA analysis.

Author Contributions

Conceptualization, writing—review and editing, validation, supervision, investigation, H.C. and L.L.; formal analysis, methodology, software, writing—original draft preparation, X.S. All authors have read and agreed to the published version of the manuscript.

Funding

This research was funded by the Wuhan Jianchun Technology Co., Ltd.—Horizontal scientific research cooperation project of the Wuhan Polytechnic University, grant number whpu-2023-kj-277. The research was also supported by the Horizontal science and technology of Enshi Se-De Bioengineering Co., Ltd., grant number se1-202102.

Data Availability Statement

The original contributions presented in the study are included in the article/Supplementary Materials, further inquiries can be directed to the corresponding author/s.

Acknowledgments

The smooth progress of this research was indebted to the careful guidance and invaluable resources provided by Shuiyuan Cheng, who has profound expertise and a rigorous attitude in the academic field and provided solid support for this study. Additionally, we would like to express our sincere gratitude to Yuanfei Chen and Siyuan Chang for their diligent efforts in data curation and proofreading. Their meticulousness and dedication have greatly contributed to the accuracy and reliability of the data presented In this paper.

Conflicts of Interest

The project was funded by Wuhan Jianchun Biotechnology Co., Ltd. and Enshi Sede Biotechnology Co., Ltd. The funders did not participate in the research design, collection, analysis, or data interpretation, and had no objections to the publication of the article.

References

  1. Xiao, T.; Boada, R.; Llugany, M.; Valiente, M. Co-application of Se and a biostimulant at different wheat growth stages: Influence on grain development. Plant Physiol. Biochem. 2021, 160, 184–192. [Google Scholar] [CrossRef] [PubMed]
  2. Xiang, J.; Rao, S.; Chen, Q.; Zhang, W.; Cheng, S.; Cong, X.; Zhang, Y.; Yang, X.; Xu, F. Research progress on the effects of selenium on the growth and quality of tea plants. Plants 2022, 11, 2491. [Google Scholar] [CrossRef] [PubMed]
  3. Zhang, L.; Song, H.; Guo, Y.; Fan, B.; Lu, B. Benefit–risk assessment of dietary selenium and its associated metals intake in China (2017–2019): Is current selenium-rich agro-food safe enough? J. Hazard. Mater. 2020, 398, 123224. [Google Scholar] [CrossRef] [PubMed]
  4. Krinsky, N.I.; Beecher, G.R.; Burk, R.F.; Chan, A.C.; Erdman, J.J.; Jacob, R.A.; Jialal, I.; Kolonel, L.N.; Marshall, J.R.; Taylor Mayne, P.R. Dietary reference intakes for vitamin C, vitamin E, selenium, and carotenoids. Inst. Med. 2000, 19, 95–185. [Google Scholar] [CrossRef]
  5. Schiavon, M.; Nardi, S.; Vecchia, F.D.; Ertani, A. Selenium biofortification in the 21st century: Status and challenges for healthy human nutrition. Plant Soil 2020, 453, 245–270. [Google Scholar] [CrossRef] [PubMed]
  6. Xie, M.; Sun, X.; Li, P.; Shen, X.; Fang, Y. Selenium in cereals: Insight into species of the element from total amount. Compr. Rev. Food Sci. Food Saf. 2021, 20, 2914–2940. [Google Scholar] [CrossRef] [PubMed]
  7. Wu, Z.; Bañuelos, G.S.; Lin, Z.-Q.; Liu, Y.; Yuan, L.; Yin, X.; Li, M. Biofortification and phytoremediation of selenium in China. Front. Plant Sci. 2015, 6, 136. [Google Scholar] [CrossRef]
  8. El Mehdawi, A.F.; Jiang, Y.; Guignardi, Z.S.; Esmat, A.; Pilon, M.; Pilon-Smits, E.A.H.; Schiavon, M. Influence of sulfate supply on selenium uptake dynamics and expression of sulfate/selenate transporters in selenium hyperaccumulator and nonhyper accumulator Brassicaceae. New Phytol. 2017, 217, 194–205. [Google Scholar] [CrossRef] [PubMed]
  9. Bai, B.; Zhang, S.; Suo, X.; Chen, W.; Shen, Y. Selenite uptake by Medicago sativa L. roots. Grassl. Sci. 2022, 68, 328–335. [Google Scholar] [CrossRef]
  10. Hossain, A.; Skalicky, M.; Brestic, M.; Maitra, S.; Sarkar, S.; Ahmad, Z.; Vemuri, H.; Garai, S.; Mondal, M.; Bhatt, R.; et al. Selenium biofortification: Roles, mechanisms, responses and prospects. Molecules 2021, 26, 881. [Google Scholar] [CrossRef]
  11. Kong, F.; Zhang, E.; Cao, Q.; Yang, F.; Li, G. Physiological function and absorption enrichment of selenium in staple crops. J. Northeast Agric. Sci. 2020, 45, 115–118. [Google Scholar] [CrossRef]
  12. Ma, X.; Xu, J.; Zhao, X.; Qu, L.; Gao, Y.; Huang, W.; Han, D.; Dang, B.; Xu, Z.; Jia, W. Selenium improves the control efficacy of Phytophthora nicotianae by damaging the cell membrane system and promoting plant energy metabolism. J. Agric. Food Chem. 2024, 72, 5073–5087. [Google Scholar] [CrossRef] [PubMed]
  13. Haghighi, M.; Ramezani, M.R.; Rajaii, N. Improving oxidative damage, photosynthesis traits, growth and flower dropping of pepper under high temperature stress by selenium. Mol. Biol. Rep. 2018, 46, 497–503. [Google Scholar] [CrossRef]
  14. Puccinelli, M.; Pezzarossa, B.; Rosellini, I.; Malorgio, F. Selenium enrichment enhances the quality and shelf life of basil leaves. Plants 2020, 9, 801. [Google Scholar] [CrossRef]
  15. Babalar, M.; Mohebbi, S.; Zamani, Z.; Askari, M.A. Effect of foliar application with sodium selenate on selenium biofortification and fruit quality maintenance of ‘Starking Delicious’ apple during storage. J. Sci. Food Agric. 2019, 99, 5149–5156. [Google Scholar] [CrossRef]
  16. Yang, X.; Gil, M.I.; Yang, Q.; Tomás-Barberán, F.A. Bioactive compounds in lettuce: Highlighting the benefits to human health and impacts of preharvest and postharvest practices. Compr. Rev. Food Sci. Food Saf. 2021, 21, 4–45. [Google Scholar] [CrossRef] [PubMed]
  17. Sawatdee, S.; Prommuak, C.; Jarunglumlert, T.; Pavasant, P.; Flood, A.E. Combined effects of cations in fertilizer solution on antioxidant content in red lettuce (Lactuca sativa L.). J. Sci. Food Agric. 2021, 101, 4632–4642. [Google Scholar] [CrossRef] [PubMed]
  18. Shi, M.; Gu, J.; Wu, H.; Rauf, A.; Emran, T.B.; Khan, Z.; Mitra, S.; Aljohani, A.S.; Alhumaydhi, F.A.; Al-Awthan, Y.S. Phytochemicals, nutrition, metabolism, bioavailability, and health benefits in lettuce-A comprehensive review. Antioxidants 2022, 11, 1158. [Google Scholar] [CrossRef]
  19. Su, S.; Zhou, Y.; Qin, J.G.; Yao, W.; Ma, Z. Optimization of the method for chlorophyll extraction in aquatic plants. J. Freshw. Ecol. 2010, 25, 531–538. [Google Scholar] [CrossRef]
  20. Deng, X.; Li, R.; Deng, S. Determination of the total content of arsenic, antimony, selenium and mercury in Chinese herbal food by chemical vapor generation-four-channel non-dispersive atomic fluorescence spectrometry. J. Fluoresc. 2020, 30, 949–954. [Google Scholar] [CrossRef]
  21. Herath, I.; Kumarathilaka, P.; Bundschuh, J.; Marchuk, A.; Rinklebe, J. A fast analytical protocol for simultaneous speciation of arsenic by ultra-high performance liquid chromatography (UHPLC) hyphenated to inductively coupled plasma mass spectrometry (ICP-MS) as a modern advancement in liquid chromatography approaches. Talanta 2020, 208, 120457. [Google Scholar] [CrossRef] [PubMed]
  22. Wang, X.; Zhang, X.; Jia, P.; Luan, H.; Qi, G.; Li, H.; Guo, S. Transcriptomics and metabolomics provide insight into the anti-browning mechanism of selenium in freshly cut apples. Front. Plant Sci. 2023, 14, 1176936. [Google Scholar] [CrossRef] [PubMed]
  23. Khalofah, A.; Migdadi, H.; El-Harty, E. Antioxidant enzymatic activities and growth response of quinoa (Chenopodium quinoa Willd) to exogenous selenium application. Plants 2021, 10, 719. [Google Scholar] [CrossRef] [PubMed]
  24. Wang, D.; Huang, Y.; Zhou, Z.; Li, T.; Wu, F.; Yao, Q. Effect of different concentrations of sodium selenate on the growth and physiological indicators of tea plants. Guihaia 2021, 41, 183–194. [Google Scholar] [CrossRef]
  25. Xu, J.; Zhang, Y.; Zhang, M.; Wei, X.; Zhou, Y. Effects of foliar selenium application on Se accumulation, elements uptake, nutrition quality, sensory quality and antioxidant response in summer-autumn tea. Food Res. Int. 2024, 175, 113618. [Google Scholar] [CrossRef] [PubMed]
  26. Cunha, M.L.O.; de Oliveira, L.C.A.; Mendes, N.A.C.; Silva, V.M.; Vicente, E.F.; dos Reis, A.R. Selenium increases photosynthetic pigments, flavonoid biosynthesis, nodulation, and growth of soybean plants (Glycine max L.). J. Soil Sci. Plant Nutr. 2023, 23, 1397–1407. [Google Scholar] [CrossRef]
  27. Xia, Y.; Liu, S.; Li, H.; Cong, X. Effects of selenium on physiological characteristics, selenium content and quality of garlic. Plant Nutr. Fertil. Sci. 2012, 18, 733–741. [Google Scholar]
  28. Cardoso, A.A.d.S.; Gomes, F.T.d.L.; Antonio, J.R.R.; Guilherme, L.R.G.; Liu, J.; Li, L.; Ligia, M.; Silva, S. Sulfate availability and soil selenate adsorption alleviate selenium toxicity in rice plants. Environ. Exp. Bot. 2022, 201, 104971. [Google Scholar] [CrossRef]
  29. Huang, S.; Yu, K.; Xiao, Q.; Song, B.; Yuan, W.; Long, X.; Cai, D.; Xiong, X.; Zheng, W. Effect of bio-nano-selenium on yield, nutritional quality and selenium content of radish. J. Food Compos. Anal. 2023, 200, 107742. [Google Scholar] [CrossRef]
  30. Ding, F.; Wei, X.; Dao, Y.; Zhao, F.; Wang, R.; Li, P. Use of fulvic acid-like compounds from pulp-derived black liquor for enhancing the selenium content of peanut buds. BMC Plant Biol. 2022, 22, 1–12. [Google Scholar] [CrossRef]
  31. Zhu, Z.; Zhang, Y.; Liu, J.; Chen, Y.; Zhang, X. Exploring the effects of selenium treatment on the nutritional quality of tomato fruit. Food Chem. 2018, 252, 9–15. [Google Scholar] [CrossRef]
  32. Bachiega, P.; Salgado, J.M.; de Carvalho, J.E.; Ruiz, A.L.T.; Schwarz, K.; Tezotto, T.; Morzelle, M.C. Antioxidant and antiproliferative activities in different maturation stages of broccoli (Brassica oleracea Italica) biofortified with selenium. Food Chem. 2016, 190, 771–776. [Google Scholar] [CrossRef]
  33. Groth, S.; Budke, C.; Neugart, S.; Ackermann, S.; Kappenstein, F.S.; Daum, D.; Rohn, S. Influence of a selenium biofortification on antioxidant properties and phenolic compounds of apples (Malus domestica). Antioxidants 2020, 9, 187. [Google Scholar] [CrossRef]
  34. Woch, W.; Hawrylak-Nowak, B. Selected antioxidant properties of alfalfa, radish, and white mustard sprouts biofortified with selenium. Acta Agrobot. 2019, 72, 1768. [Google Scholar] [CrossRef]
  35. Islam, M.Z.; Park, B.J.; Kang, H.M.; Lee, Y.T. Influence of selenium biofortification on the bioactive compounds and antioxidant activity of wheat microgreen extract. Food Chem. 2020, 309, 125763. [Google Scholar] [CrossRef]
  36. Li, T.; Yun, Z.; Zhang, D.; Yang, C.; Zhu, H.; Jiang, Y.; Duan, X. Proteomic analysis of differentially expressed proteins involved in ethylene-induced chilling tolerance in harvested banana fruit. Front. Plant Sci. 2015, 6, 845. [Google Scholar] [CrossRef]
  37. Walaa, A.; Shatlah, M.; Atteia, M.; Sror, H. Selenium induces antioxidant defensive enzymes and promotes tolerance against salinity stress in cucumber seedlings (Cucumis sativus). Arab Univ. J. Agric. Sci. 2010, 18, 65–76. [Google Scholar]
  38. Wu, Z.; Yuan, L.; Sun, C.; Xu, X.; Shi, W.; Han, L.; Wu, C. Effects of selenite on the responses of lettuce (Lactuca sativa L.) to polystyrene nano-plastic stress. Ecotoxicol. Environ. Saf. 2023, 262, 115138. [Google Scholar] [CrossRef]
  39. Hawrylak-Nowak, B.; Dresler, S.; Rubinowska, K.; Matraszek-Gawron, R.; Woch, W.; Hasanuzzaman, M. Selenium biofortification enhances the growth and alters the physiological response of lamb’s lettuce grown under high temperature stress. Plant Physiol. Biochem. 2018, 127, 446–456. [Google Scholar] [CrossRef]
  40. Jiang, S.; Du, B.; Wu, Q.; Zhang, H.; Deng, Y.; Tang, X.; Zhu, J. Selenium decreases the cadmium content in brown rice: Foliar Se application to plants grown in Cd-contaminated soil. J. Soil Sci. Plant Nutr. 2022, 22, 1033–1043. [Google Scholar] [CrossRef]
  41. Shalaby, T.; Bayoumi, Y.; Alshaal, T.; Elhawat, N.; Sztrik, A.; El-Ramady, H. Selenium fortification induces growth, antioxidant activity, yield and nutritional quality of lettuce in salt-affected soil using foliar and soil applications. Plant Soil 2017, 421, 245–258. [Google Scholar] [CrossRef]
  42. Diao, M.; Ma, L.; Wang, J.; Cui, J.; Fu, A.; Liu, H.Y. Selenium promotes the growth and photosynthesis of tomato seedlings under salt stress by enhancing chloroplast antioxidant defense system. J. Plant Growth Regul. 2014, 33, 671–682. [Google Scholar] [CrossRef]
  43. Silva, M.A.; de Sousa, G.F.; Bañuelos, G.; Amaral, D.; Brown, P.H.; Guilherme, L.R.G. Selenium speciation in se-enriched soybean grains from biofortified plants grown under different methods of selenium application. Foods 2023, 12, 1214. [Google Scholar] [CrossRef]
  44. Zhou, F.; Yang, W.; Wang, M.; Miao, Y.; Cui, Z.; Li, Z.; Liang, D. Effects of selenium application on Se content and speciation in Lentinula edodes. Food Chem. 2018, 265, 182–188. [Google Scholar] [CrossRef]
  45. Li, Y.; Liu, K.; Chen, F. Effect of selenium enrichment on the quality of germinated brown rice during storage. Food Chem. 2016, 207, 20–26. [Google Scholar] [CrossRef]
  46. Zhang, H.; Zhao, Z.; Zhang, X.; Zhang, W.; Huang, L.; Zhang, Z.; Yuan, L.; Liu, X. Effects of foliar application of selenate and selenite at different growth stages on Selenium accumulation and speciation in potato (Solanum tuberosum L.). Food Chem. 2019, 286, 550–556. [Google Scholar] [CrossRef]
  47. Chen, Z.; Zhang, L.; Peng, M.; Zhu, S.; Wang, G. Preharvest application of selenite enhances the quality of Chinese flowering cabbage during storage via regulating the ascorbate-glutathione cycle and phenylpropanoid metabolisms. Food Res. Int. 2023, 163, 112229. [Google Scholar] [CrossRef]
  48. Zhu, Y.; Pilon-Smits, E.A.H.; Zhao, F.; Williams, P.N.; Meharg, A.A. Selenium in higher plants: Understanding mechanisms for biofortification and phytoremediation. Trends Plant Sci. 2009, 14, 436–442. [Google Scholar] [CrossRef]
  49. Schiavon, M.; Pilon-Smits, E.A. Selenium biofortification and phytoremediation phytotechnologies: A review. J. Environ. Qual. 2017, 46, 10–19. [Google Scholar] [CrossRef]
  50. Gigolashvili, T.; Kopriva, S. Transporters in plant sulfur metabolism. Front. Plant Sci. 2014, 5, 107212. [Google Scholar] [CrossRef]
  51. Van Hoewyk, D.; Takahashi, H.; Inoue, E.; Hess, A.; Tamaoki, M.; Pilon-Smits, E.A.H. Transcriptome analyses give insights into selenium-stress responses and selenium tolerance mechanisms in Arabidopsis. Physiol. Plant. 2010, 132, 236–253. [Google Scholar] [CrossRef]
  52. Barberon, M.; Berthomieu, P.; Clairotte, M.; Shibagaki, N.; Davidian, J.C.; Gosti, F. Unequal functional redundancy between the two Arabidopsis thaliana high-affinity sulphate transporters SULTR1;1 and SULTR1;2. New Phytol. 2008, 180, 608–619. [Google Scholar] [CrossRef] [PubMed]
  53. Song, Z.; Shao, H.; Huang, H.; Shen, Y.; Wang, L.; Wu, F.; Han, D.; Song, J.; Jia, H. Overexpression of the phosphate transporter gene OsPT8 improves the Pi and selenium contents in Nicotiana tabacum. Environ. Exp. Bot. 2017, 137, 158–165. [Google Scholar] [CrossRef]
  54. Zhao, X.; Mitani, N.; Yamaji, N.; Shen, R.; Ma, J. Involvement of silicon influx transporter OsNIP2;1 in selenite uptake in rice. Plant Physiol. 2010, 153, 1871–1877. [Google Scholar] [CrossRef] [PubMed]
  55. Qu, L.; Xu, J.; Dai, Z.; Elyamine, A.M.; Huang, W.; Han, D.; Dang, B.; Xu, Z.; Jia, W. Selenium in soil-plant system: Transport, detoxification and bioremediation. J. Hazard. Mater. 2023, 452, 131272. [Google Scholar] [CrossRef] [PubMed]
  56. Kataoka, T.; Hayashi, N.; Yamaya, T.; Takahashi, H. Root-to-shoot transport of sulfate in Arabidopsis. Evidence for the role of SULTR3;5 as a component of low-affinity sulfate transport system in the root vasculature. Plant Physiol. 2004, 136, 4198–4204. [Google Scholar] [CrossRef] [PubMed]
  57. Trippe, R.C.; Pilon-Smits, E.A.H. Selenium transport and metabolism in plants: Phytoremediation and biofortification implications. J. Hazard. Mater. 2020, 404, 124178. [Google Scholar] [CrossRef] [PubMed]
  58. Kikkert, J.; Berkelaar, E. Plant uptake and translocation of inorganic and organic forms of selenium. Arch. Environ. Contam. Toxicol. 2013, 65, 458–465. [Google Scholar] [CrossRef] [PubMed]
  59. Zhang, Q.; Hao, R.; Xu, Z.; Yang, W.; Wang, J.; Cheng, T.; Pan, H.; Zhang, Q. Isolation and functional characterization of a R2R3-MYB regulator of Prunus mume anthocyanin biosynthetic pathway. Plant Cell Tissue Organ Cult. 2017, 131, 417–429. [Google Scholar] [CrossRef]
  60. Schwinn, K.E.; Ngo, H.; Kenel, F.; Brummell, D.A.; Davies, K.M. The onion (Allium cepa L.) R2R3-MYB gene MYB1 regulates anthocyanin biosynthesis. Front. Plant Sci. 2016, 7, e29526. [Google Scholar] [CrossRef]
  61. Zhang, F.; Li, X.; Wu, Q.; Lu, P.; Kang, Q.; Zhao, M.; Wang, A.; Dong, Q.; Sun, M.; Yang, Z.; et al. Selenium application enhances the accumulation of flavones and anthocyanins in bread wheat (Triticum aestivum L.) grains. J. Agric. Food Chem. 2022, 70, 13431–13444. [Google Scholar] [CrossRef]
  62. Xia, Q.; Shui, Y.; Zhi, H.; Ali, A.; Yang, Z.; Gao, Z. Exogeneous selenium enhances anthocyanin synthesis during grain development of colored-grain wheat. Plant Physiol. Biochem. 2023, 200, 107742. [Google Scholar] [CrossRef]
  63. Pu, Z.; Wei, G.; Liu, Z.; Chen, L.; Zheng, Y. Selenium and anthocyanins share the same transcription factors R2R3MYB and bHLH in wheat. Food Chem. 2021, 356, 129699. [Google Scholar] [CrossRef] [PubMed]
  64. Hong, S.W.; Jon, J.H.; Nam, K.H.G. Identification of a receptor-like protein kinase gene rapidly induced by abscisic acid, dehydration, high salt, and cold treatments in Arabidopsis thaliana. Plant Physiol. 1997, 113, 1203–1212. [Google Scholar] [CrossRef] [PubMed]
  65. Shang, Y.; Yang, D.; Ha, Y.; Nam, K.H. BAK1-induced RPK1 phosphorylation is essential for RPK1-mediated cell death in Arabidopsis. Biochem. Biophys. Res. Commun. 2021, 573, 125–131. [Google Scholar] [CrossRef]
  66. Wang, X.; Lu, W.; Zhao, Z.; Hao, W.; Du, R.; Li, Z.; Wang, Z.; Lv, X.; Wang, J.; Liang, D.; et al. Abscisic acid promotes selenium absorption, metabolism and toxicity via stress-related phytohormones regulation in Cyphomandra betacea Sendt. (Solanum betaceum Cav.). J. Hazard. Mater. 2023, 461, 132642. [Google Scholar] [CrossRef]
  67. Wu, J.; Guo, S.; Wang, J.; He, J.; Li, X.; Zhan, Y. The phosphoproteomic response of pepper (Capsicum annuum L.) seedlings to selenium stress. Horticulturae 2023, 9, 935. [Google Scholar] [CrossRef]
  68. Golz, J.F.; Oh, H.-Y.; Su, V.; Kusaba, M.; Newbigin, E. Genetic analysis of Nicotiana pollen-part mutants is consistent with the presence of an S-ribonuclease inhibitor at the S locus. Proc. Natl. Acad. Sci. USA 2001, 9, 15372–15376. [Google Scholar] [CrossRef] [PubMed]
  69. Gu, F.; Bringmann, M.; Combs, J.; Yang, J.; Bergmann, D.; Nielsen, E. The Arabidopsis CSLD5 functions in cell plate formation in a cell cycle dependent manner. Plant Cell 2016, 28, 1722–1737. [Google Scholar] [CrossRef]
  70. Li, Y.; Xiao, Y.; Hao, J.; Fan, S.; Dong, R.; Zeng, H.; Liu, C.; Han, Y. Effects of selenate and selenite on selenium accumulation and speciation in lettuce. Plant Physiol. Biochem. 2022, 192, 162–171. [Google Scholar] [CrossRef]
  71. Chiba, Y.; Shimizu, T.; Miyakawa, S.; Kanno, Y.; Koshiba, T.; Kamiya, Y.; Seo, M. Identification of Arabidopsis thaliana NRT1/PTR FAMILY (NPF) proteins capable of transporting plant hormones. J. Plant Res. 2015, 128, 679–686. [Google Scholar] [CrossRef]
  72. Lei, B.; Bian, Z.; Yang, Q.; Wang, J.; Cheng, R.-f.; Li, K.; Liu, W.-k.; Zhang, Y.; Fang, H.; Tong, Y. The positive function of selenium supplementation on reducing nitrate accumulation in hydroponic lettuce (Lactuca sativa L.). J. Integr. Agric. 2018, 17, 837–846. [Google Scholar] [CrossRef]
  73. Zhang, L.; Hu, B.; Deng, K.; Gao, X.; Sun, G.; Zhang, Z.; Li, P.; Wang, W.; Li, H.; Zhang, Z.; et al. NRT1.1B improves selenium concentrations in rice grains by facilitating selenomethinone translocation. Plant Biotechnol. J. 2018, 17, 1058–1068. [Google Scholar] [CrossRef] [PubMed]
  74. Feng, X.; Li, G.; Wu, W.; Lyu, H.; Wang, J.; Liu, C.; Zhong, C.; Shi, S.; He, Z. Expansion and adaptive evolution of the WRKY transcription factor family in Avicennia mangrove trees. Mar. Life Sci. Technol. 2023, 5, 155–168. [Google Scholar] [CrossRef] [PubMed]
  75. Yan, J.; Li, C.; Sun, L.; Ren, J.; Li, G.; Ding, Z.; Zheng, S. A WRKY transcription factor regulates Fe translocation under Fe deficiency in Arabidopsis. Plant Physiol. 2016, 171, 2017–2027. [Google Scholar] [CrossRef] [PubMed]
  76. Wu, X.; Tao, M.; Meng, Y.; Zhu, X.; Qian, L.; Shah, A.; Wang, W.; Cao, S. The role of WRKY47 gene in regulating selenium tolerance in Arabidopsis thaliana. Springer Singap. 2020, 14, 121–129. [Google Scholar] [CrossRef]
  77. Hou, L.Y.; Ehrlich, M.; Thormhlen, I.; Lehmann, M.; Geigenberger, P. NTRC plays a crucial role in starch metabolism, redox balance, and tomato fruit growth. Plant Physiol. 2019, 181, 976–992. [Google Scholar] [CrossRef] [PubMed]
  78. Atsuki, S.; Ryuta, T.; Riku, A.; Masao, I.; Satoru, H.; Kaito, K.; Yosuke, T.; Takuya, O.; Tatsuo, K.; Kei, G.; et al. Initial step of selenite reduction via thioredoxin for bacterial selenoprotein biosynthesis. Int. J. Mol. Sci. 2021, 22, 10965. [Google Scholar] [CrossRef] [PubMed]
  79. Johansen-Leete, J.; Payne, R.J. Selenium is the chalcogen of choice for selective reporting of thioredoxin reductase activity. Chem 2022, 8, 1175–1177. [Google Scholar] [CrossRef]
  80. Kim, Y.B.; Garbisu, C.; Pickering, I.J.; Prince, R.C.; Buchanan, B.B. Thioredoxin h overexpressed in barley seeds enhances selenite resistance and uptake during germination and early seedling development. Planta 2004, 218, 186–191. [Google Scholar] [CrossRef]
Figure 1. The effect of different concentrations of Na2SeO3 on the length and biomass of lettuce above and below ground. (a) Length of shoot and root portions of lettuce. (b) Biomass of lettuce. (c) Growth status of lettuce, with white scale bars representing 10 cm length. The bar charts are adorned with error bars representing the standard error of the mean, calculated from a sample size of three (n = 3). Additionally, various letters are employed to designate statistically significant disparities in the mean values, as determined by Duncan’s multiple range test, with a significance threshold of p < 0.05.
Agronomy 14 01380 g001
Figure 2. Impact of varying concentrations of Na2SeO3 treatment on photosynthetic pigments and carotenoid content in lettuce. (a) Chlorophyll a content. (b) Chlorophyll b content. (c) Carotenoid content. (d) Total chlorophyll content. Error bars in each subfigure represent the standard error of the mean (n = 3), indicating the reliability and precision of the measurements. Different letters above the bars indicate significant differences in the mean values based on Duncan’s multiple range test (p < 0.05), allowing for a statistical comparison across the treatment groups.
Agronomy 14 01380 g002
Figure 3. Impact of Na2SeO3 treatment on the nutritional composition of lettuce. (a) Vc content. (b) Soluble sugar content. (c) Soluble protein content. (d) Flavonoid content. (e) Total phenolic content. (f) Anthocyanin content. Error bars in each subfigure represent the standard error of the mean (n = 3), providing a measure of the reliability and precision of the measurements. Different letters above the bars indicate significant differences in the mean values based on Duncan’s multiple range test (p < 0.05).
Agronomy 14 01380 g003
Figure 4. Effects of Na2SeO3 treatment at different concentrations on MDA content in lettuce. The error bars depicted in the figure represent the standard error of the mean, calculated based on three replicate measurements (n = 3). Distinct letters are employed to denote statistically significant differences in the average MDA content among different treatment groups, as determined by Duncan’s multiple range test, conducted at a significance level of p < 0.05.
Agronomy 14 01380 g004
Figure 5. The effects of Na2SeO3 treatment at varying concentrations on the activities of antioxidant enzyme in lettuce. (a) GSH content in various treatment groups. (b) SOD activity. (c) POD activity. (d) CAT activity. The error bars depict the standard error of the mean (n = 3), whereas distinct letters denote significant disparities in the mean values, determined through Duncan’s multiple range test (p < 0.05).
Agronomy 14 01380 g005
Figure 6. The effects of different concentrations of Na2SeO3 treatment on the total Se content and Se species content of lettuce. (a) Total Se content in lettuce. (b) Se species distribution in lettuce. The error bars depict the standard error of the mean (n = 3), whereas distinct letters denote significant disparities in the mean values, determined through Duncan’s multiple range test (p < 0.05).
Agronomy 14 01380 g006
Figure 7. Effects of Na2SeO3 treatment on weight loss and chromatic values (a*, b*) of lettuce after seven days. (a) Weight loss rate of lettuce over 7 days. (b) Red-green chromatic value (a*). (c) Blue-yellow chromatic value (b*). The error bars depict the standard error of the mean (n = 3), whereas distinct letters denote significant disparities in the mean values, determined through Duncan’s multiple range test (p < 0.05).
Agronomy 14 01380 g007
Figure 8. Effects of Na2SeO3 treatment on browning degree and color difference in lettuce after seven days. (a) Browning index. (b) Color difference (ΔE value). The error bars depict the standard error of the mean (n = 3), whereas distinct letters denote significant disparities in the mean values, determined through Duncan’s multiple range test (p < 0.05).
Agronomy 14 01380 g008
Figure 9. Impact of Na2SeO3 treatment on antioxidant enzyme activities in lettuce after seven days of storage. (a) CAT enzyme activity. (b) GSH content. (c) SOD enzyme activity. (d) POD enzyme activity. Error bars represent the standard error of the mean (n = 3), and different letters indicate significant differences in the mean values based on Duncan’s multiple range test (p < 0.05).
Agronomy 14 01380 g009
Figure 10. WGCNA analysis of DEGs in lettuce treated with various concentrations of Na2SeO3 compared to the control group. (a) Scale-free fit index (R2) under various soft-thresholding powers, with the red line corresponding to R2 = 0.6. (b) Average connectivity at different soft-thresholding powers. (c) A WGCNA result generated using a dynamic tree-cutting approach, where distinct modules were identified and color-coded for clarity. (d) Heatmap visualizing the correlation among the various modules identified through WGCNA.
Agronomy 14 01380 g010
Figure 11. Correlation analysis was conducted to investigate the relationship between Se speciation content and transcriptomic expression modules across different treatment groups. (a) The distribution and quantity of differentially expressed genes (DEGs) within various modules were examined, revealing specific patterns of transcriptional regulation associated with different Se forms. (b) A correlation matrix was generated to assess the association between individual modules and phenotypic traits. (c) Direct correlation coefficients were calculated to quantify the relationship between different treatment samples and expression modules. The color blocks on the left represent distinct modules, facilitating the identification of patterns and trends in the correlation matrix.
Agronomy 14 01380 g011
Figure 12. GO enrichment analysis was conducted on DEGs within three distinct modules associated with Se speciation content. (a) GO enrichment results obtained for the Red module, which highlights specific biological processes and molecular functions perturbed by Se speciation. (b) GO enrichment outcomes for the Magenta module, emphasizing the functional categories influenced by Se. (c) GO enrichment findings for the Blue module, revealing further insights into the functional changes triggered by Se speciation.
Agronomy 14 01380 g012
Figure 13. KEGG enrichment analysis of DEGs in three modules associated with Se speciation content. (a) KEGG pathway enrichment for the Red module. (b) KEGG pathway enrichment for the Magenta module. (c) KEGG pathway enrichment for the Blue module.
Agronomy 14 01380 g013
Figure 14. Depiction of the relationships between Se species and gene transcription patterns in the Red, Magenta, and Blue Modules through correlation heatmaps and network analysis. (a) The expression patterns of the Red module under different concentrations of Na2SeO3 treatment; (b) Expression modules of Magenta module under different concentrations of Na2SeO3 treatment; (c) The expression patterns of the Blue module under different concentrations of Na2SeO3 treatment.
Agronomy 14 01380 g014
Figure 15. Correlation analysis between DEGs and Se species content in the Red, Magenta, and Blue modules. (a) Heatmap depicting the correlation coefficients between different Se species and module-specific genes across groups. White asterisks indicate the significance levels of the correlation analysis, with * representing p < 0.05, ** representing p < 0.01, and *** representing p < 0.001. (b) Correlation network diagram showing the relationships between Se species content and DEGs in the three modules. Solid lines represent positive correlations, while dashed lines represent negative correlations. The size of the circles indicates the number of correlated objects, and thicker lines represent stronger correlations. Positive correlation thresholds were set at greater than or equal to 0.99, while negative correlation thresholds were set at less than or equal to −0.95, with a p-value threshold of less than 0.05. The analysis was performed using R version 3.6.1 and the igraph package version 1.2.6.
Agronomy 14 01380 g015
Figure 16. Absorption, transformation, and transport mechanisms of Na2SeO3 in lettuce. The figure illustrates the key enzymes and metabolites involved in the Se metabolism of lettuce. CBL represents cystathionine beta-lyase; Trx, thioredoxin; MMT, methionine methyltransferase; NADPH, nicotinamide adenine dinucleotide phosphate reduced form; HMT1 and HMT3 are homologs of SMT (selenocysteine methyltransferase); GST, glutathione S-transferase; SeCys, selenocysteine; MeSeCys, methylselenocysteine; MeSeMet, methylselenomethionine; DMSe, dimethylselenium; DMDSe, dimethyldiselenide; Se0, elemental Se; Anthocyanin + Glu, anthocyanin conjugated with glutamic acid; ABA, abscisic acid; MYB1, positive regulator of anthocyanin biosynthesis; RPK1, receptor-like protein kinase 1; CSLD3, cellulose synthase-like protein D3; PTR44, protein NRT1/PTR FAMILY 2.10; WRKY7, transcription factor 7; NTRC, thioredoxin reductase. This figure summarizes the complex network of interactions between Se species and various enzymes and transcriptional regulators in lettuce, providing insights into the mechanisms underlying Se absorption, conversion, and translocation in this plant species.
Agronomy 14 01380 g016
Disclaimer/Publisher’s Note: The statements, opinions and data contained in all publications are solely those of the individual author(s) and contributor(s) and not of MDPI and/or the editor(s). MDPI and/or the editor(s) disclaim responsibility for any injury to people or property resulting from any ideas, methods, instructions or products referred to in the content.

