Article

Metabolomic Insights into Primary and Secondary Metabolites Variation in Common and Glutinous Rice (Oryza sativa L.)

1
Sanya Institute, Hainan Academy of Agricultural Sciences, Sanya 572000, China
2
Cereal Crops Institute, Hainan Academy of Agricultural Sciences, Haikou 571100, China
3
National Nanfan Research Institute (Sanya), Chinese Academy of Agricultural Sciences, Sanya 572024, China
4
State Key Laboratory of Crop Gene Resources and Breeding, Institute of Crop Sciences, Chinese Academy of Agricultural Sciences, Beijing 100081, China
*
Authors to whom correspondence should be addressed.
Agronomy 2024, 14(7), 1383; https://doi.org/10.3390/agronomy14071383
Submission received: 28 April 2024 / Revised: 22 June 2024 / Accepted: 24 June 2024 / Published: 27 June 2024
(This article belongs to the Special Issue Advances in Rice Physioecology and Sustainable Cultivation)

Abstract

:
Abstract: Interest in glutinous rice consumption has been expanding in East Asia. However, the extent of metabolite variation between common and glutinous rice has not been fully explored to identify metabolic targets for rice quality improvement. Thus, the objective of this study was to provide insights into the variation of metabolites and nutraceuticals between common and glutinous rice. Two black rice (common rice, BL-N, and glutinous rice, BL-G) and two white rice (common rice, WH-N, and glutinous rice, WH-G) types were analysed via LC-MS-based widely targeted metabolic profiling. We identified 441 and 343 types, including 160 key overlapping differentially accumulated metabolites between BL-N_vs_BL-G and WH-N_vs_WH-G, respectively. Glutinous rice showed a higher relative content of most categories of metabolites, except for quinones (in BL-N) and tannins (in WH-N). Seven vitamins, including B6, B3, B5, B13, isonicotinic acid, N-(beta-D-glucosyl)nicotinate, and 4-pyridoxic acid-O-glucoside, were significantly up-regulated in BL-G compared to BL-N. The biosynthesis of cofactors, zeatin biosynthesis, citrate cycle, amino acid metabolism, alpha-linolenic acid metabolism, and glyoxylate and dicarboxylate metabolism was the most differentially regulated pathway. Key differential metabolites in citrate cycle include citrate, isocitrate, fumarate, malate, succinate, and 2-oxoglutarate; in amino acid metabolism (L-serine, L-cysteine, L-lysine, L-glutamine, L-methionine, and L-tryptophan); and in glycolysis (UDP-glucose, D-glucose-1P, D-glucose-6P, and D-fructose-6P). The data resources in this study may contribute to a better understanding of the function and nutritional value of glutinous rice.

1. Introduction

The scientific assessment of the nutritional and medicinal values of foods is essential to reduce the incidence of chronic diseases and enhance the dietary consumption of high-quality agricultural products [1]. Among the widely cultivated crops, rice is the most vital staple food worldwide, making a high contribution to addressing the global hunger index and the achieving food security [2,3]. There are different types of rice, primarily distinguished by stickiness during cooking (glutinous/non-glutinous) and the colour of the grain (white/pigmented). Pigmented rice varieties include black, red, deep-purple, brown-reddish, etc., resulting from the accumulation of natural pigments in the seed coat, pericarp, and aleurone [4]. Pigmented rice grains are rich in a variety of nutraceuticals, including flavones, flavonols, isoflavones, anthocyanins, procyanidins, phenolics, tannins, tocols, sterols, γ-oryzanols, vitamins, amino acids, and essential oils compared to white rice [3,4,5,6]. Accordingly, most studies have focused on comparing the pigmentation processes and quality characteristics of white and pigmented rice [3,7,8]. In contrast, comparative metabolic explorations concerning the quality differences between common and glutinous rice are scarce, limiting rice quality improvement and value addition.
Normal and glutinous (sticky or waxy) rice seeds differ mainly in the amylose content of the endoderm. Glutinous rice consists principally of amylopectin and an amylose content of less than 2% [9]. It is mainly grown in Asian countries, especially in Southeast Asia, where it has long-standing cultural implications and offers basic nutritional and economic security to rice farmers [9,10]. For instance, waxy rice flour is the primary ingredient in the production of traditional snacks and foods such as “Mochi” (glutinous rice cakes), “Tang-yuan” (glutinous rice balls), etc. [10]. Setyaningsih et al. demonstrated that normal and waxy rice have different phenolic profiles, with higher total phenolic content in glutinous rice [11]. Although the potential of glutinous rice flours to become key ingredients in gluten-free baking has been demonstrated [12], it has been shown that non-glutinous rice flours have superior gluten-free bread performance abilities than sticky rice flours in terms of the viscosity, volume, resilience, and texture of pastes [13]. Compared to normal rice, which produces wines with a higher alcohol content, waxy rice produces sweeter wines [14]. In terms of medicinal value, studies have shown that glutinous rice materials have great therapeutic properties, especially against oxidation-related diseases, cancer, and diabetes [15,16,17,18,19]. In support to this, research by Nakayama et al. revealed that daily consumption of glutinous rice twice daily for six to eight weeks ameliorated glycaemic control in diabetic patients in Japan [20,21]. In view of the multidimensional cultural, medicinal, and socio-economic importance of glutinous rice, a thorough characterisation of the differences in metabolic profiles between normal and waxy rice could be conducive to understanding the modulatory functions of key metabolites in primary and secondary metabolism, gene–metabolite networks, and high-quality breeding in rice.
Metabolomics analytical technologies play an increasingly important role in assessing the nutritional quality of crop products [22,23,24]. Metabolomic technology employs high-throughput approaches to reveal differences in the accumulation patterns of small-molecule metabolites in crop-derived products, providing data to explore the potential regulatory roles of differential metabolites in diverse metabolic pathways [1,25,26]. This technology allows for the identification of metabolic biomarkers that are essential for authenticating and confirming the quality of crop-derived products and for systematically investigating the interactions between genes and nutritional components [27]. Among the different metabolomics approaches, widely targeted metabolite profiling is used to explore the global metabolome of plant-derived products, resulting in the accurate qualitative and quantitative identification of a wide range of metabolites and a thorough understanding of phenotypic diversity in plants [28,29,30,31]. It has been extensively applied to unravel variations in metabolite profiles associated with phenotypic changes in various crops, including rice [7,30], oilseed crops [31,32], eggplant [33], etc.
The present study applied ultra-performance liquid chromatography–mass spectroscopy (UPLC_MS/MS)-based widely targeted metabolomics to investigate the distribution and variability of primary and secondary metabolites in non-glutinous and glutinous rice seeds. Our aims were to identify the key differentially accumulated metabolites (DAMs), the major differentially regulated pathways, and the variation characteristics of vitamins between normal and waxy rice seeds. Our findings will contribute to the breeding of novel high quality rice varieties.

2. Materials and Methods

2.1. Plant Materials and Reagents

Four rice varieties were analysed in this study, the black glutinous rice variety Haiheinuo No. 2 (BL-G), the black non-glutinous rice variety Haifeng Heidao No. 3 (BL-N), the white glutinous rice variety Hainong shanlannuo No. 1 (WH-G), and the white non-glutinous rice variety Boyou 225 (WH-N). These are local elite indica varieties which are bred in the Hainan province of China and are also widely cultivated commercially in southern China. These varieties were provided by the Hainan Academy of Agricultural Sciences (Haikou, China). All rice varieties were cultivated in the same season conditions in Haikou, China. Thirty days after flowering, grains were harvested and collected in triplicate for each variety. Each replicate was a mixture of seeds from eight individual plants. After drying in the sun to a water content of 10–11%, the grains were stored in the dark at −80 °C until use. Prior to the UHPLC-MS analysis, samples were manually dehulled to produce brown rice, and any broken grains were removed. All chemicals were purchased from the Merck Company (Germany, Hesse, Darmstadt), while metabolite standards were from Sigma Aldrich (St. Louis, MO, USA) or BioBioPha (Kunming, China).

2.2. Metabolite Extraction and UPLC-MS/MS Analysis

All samples were freeze-dried using a vacuum freeze-dryer (Scientz-100F) and ground to powder using a mixer mill (MM 400, Retsch, Haan, Germany). The mill was operated at 30 Hz for 1.5 min. Subsequently, 100 mg of powder was extracted with 1.2 mL of 70% methanol for 12 h at 4 °C with mixing. After centrifugation at 15,000 g for 15 min, the supernatants were collected and filtrated through a 0.22 μm micropore membrane (SCAA-104, ANPEL, Shanghai, China). Extracts were stored at −20 °C until UPLC-ESI -MS/MS analysis at Metware Biotechnology Co., Ltd., (MWDB), Wuhan, China [7,30,31,34]. We mixed equal volumes of all extracts to produce quality control (QC) samples. The metabolomics analysis was conducted according to previously described methods [7,31,34]. The details of the liquid phase and MS conditions are provided in Table S1.

2.3. Identification and Quantification of Metabolites

The spectral information, retention time, and mass spectra were integrated for the qualitative identification of the metabolites. Specifically, Q1 (precursor ions) and Q3 (product ion) values, retention times, collision energy, fragmentation patterns, and de-clustering potential were compared with the standards when available (Sigma-Aldrich, St. Louis, MO, USA). Compounds were structurally identified using a self-built standard product database MWDB, followed by verification in open databases (KNApSAcK, MoTo DB, MassBank, HMDB, and METLIN) [7,30]. The relative levels of the metabolites were computed by triple quadrupole (QqQ) MS analysis using Analyst 1.6.3 software (AB Sciex, Toronto, ON, Canada).

2.4. Data Analysis

The data quality was evaluated, and metabolites with large deviations (coefficient of variation value ˃ 0.5) were discarded. Further, the Z-score was utilised to standardise the data. All multivariate analyses were performed in R (version 4.3.0). The quality of the raw data was ensured by prior validation and subsequent standardisation. The R packages pheatmap, cor, MetaboAnalystR, and prcomp were used for hierarchical clustering analysis, correlation analysis, orthogonal partial least squares discriminant analysis (OPLS-DA), and principal component analysis, respectively. Prior to the OPLS-DA analysis, the metabolite data were normalised by Log2-transformation. The VIP (Variable Importance in Projection) values of metabolites were extracted from the OPLS-DA results. The DAMs were sorted using the R ggplot2 program with thresholds of Log2FC ˃ 1, a p-value < 0.05, and a VIP ≥ 1. KEGG functional analysis of DAMs was performed by mapping http://www.kegg.jp/kegg/pathway.html (accessed on 28 December 2023), followed by metabolite set enrichment analysis. GraphPad Prism (v9.0.01, La Jolla, CA, USA) and Excel 2021 software were used for data processing and graph generation. The SRplot online platform was also used for graph construction [35]. TBtools software was used to generate high-quality Venn diagrams and heatmaps [36].

3. Results

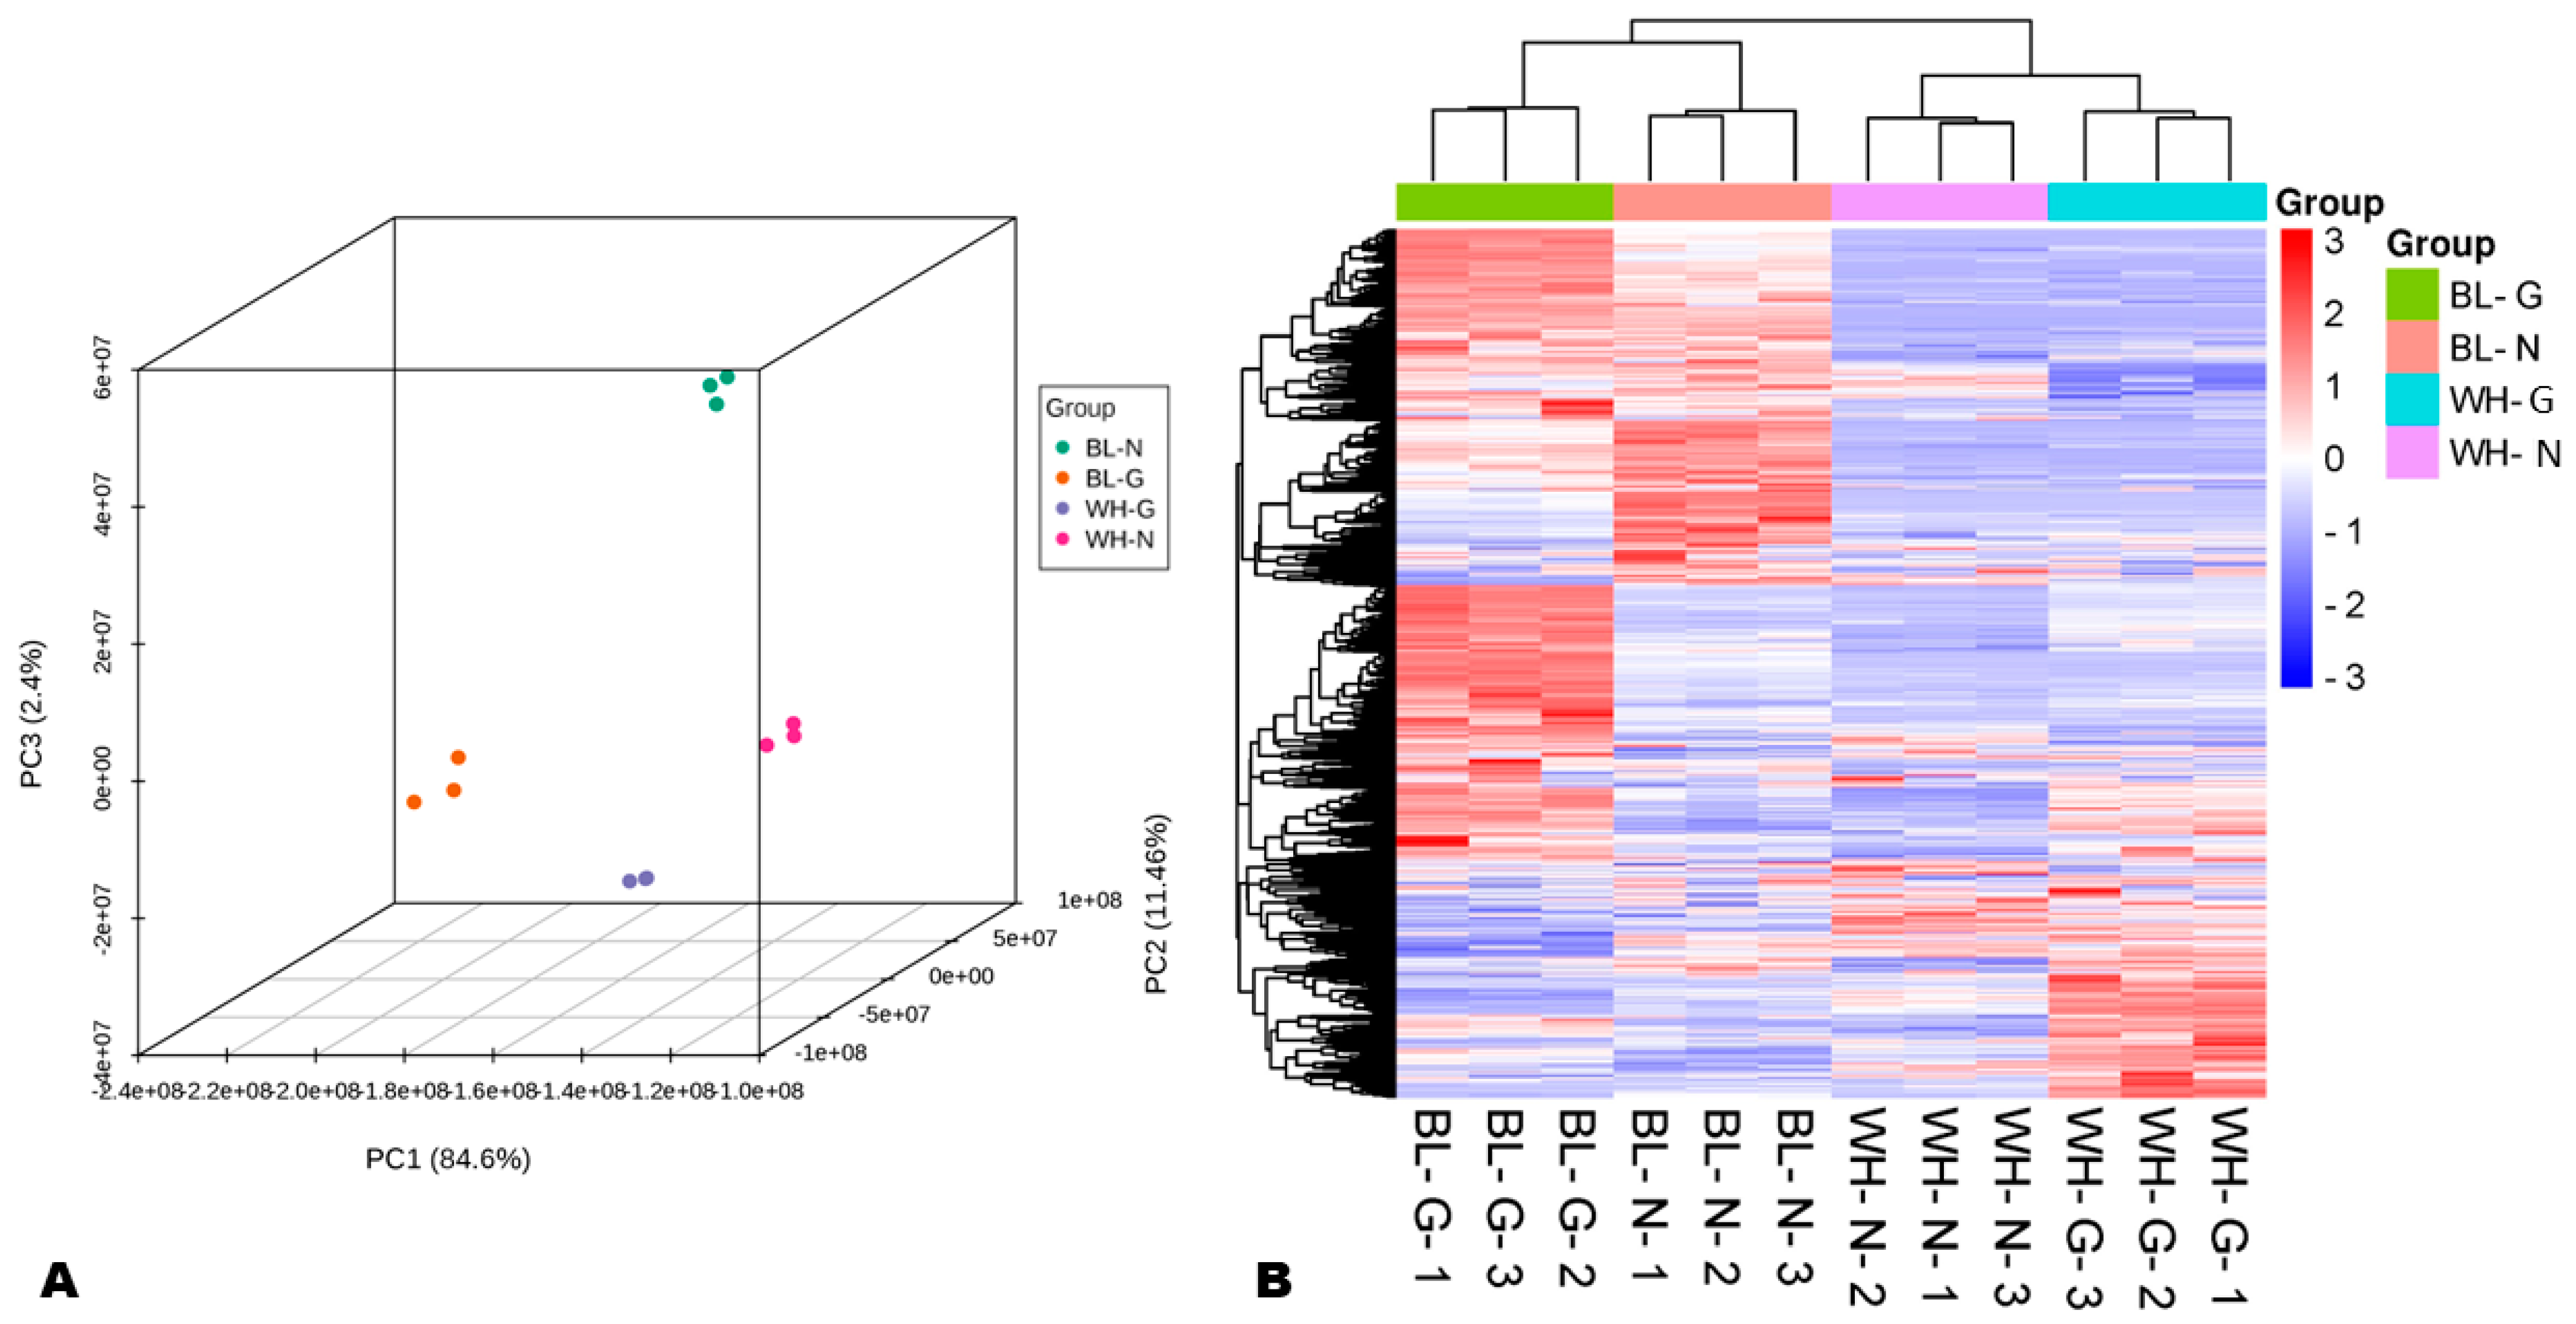
3.1. Distribution and Variation of Metabolites in Common and Glutinous Rice

To gain metabolomic insights into the variation of metabolites between common and glutinous rice, we subjected two black rice types (BL-N and BL-G) and two white rice types (WH-N and WH-G) to widely targeted metabolic profiling. The ion chromatograms of some identified compounds in the quality control (QC) samples are shown in Figure S1. The QC samples showed very high correlations (r ≥ 0.98), confirming the repeatability of the experiment (Figure S2). In total, we structurally identified 1292 metabolites, including flavonoids, lipids, lignans, phenolic acids, terpenoids, tannins, amino acids and derivatives, alkaloids, vitamins, organic acids, coumarins, and saccharides (Table S2).
In order to explore the variability and distribution of metabolites between common and glutinous rice, we carried out multivariate data analyses, including HCA (hierarchical clustering analysis) and PCA (principal component analysis) (Figure 1). As shown in Figure 1A, PCA revealed that the metabolite profiles of common rice seeds (BL-N and WH-N) were very different from those of glutinous rice (BL-G and WH-G). Interestingly, the HCA result supported the PCA findings (Figure 1B). Many metabolites exhibited higher relative levels in BL-G and WH-G compared to BL-N and WH-N, respectively (Figure 1B). Additionally, the PCA and HCA indicated that the metabolome of white rice is very different from that of black rice (Figure 1).

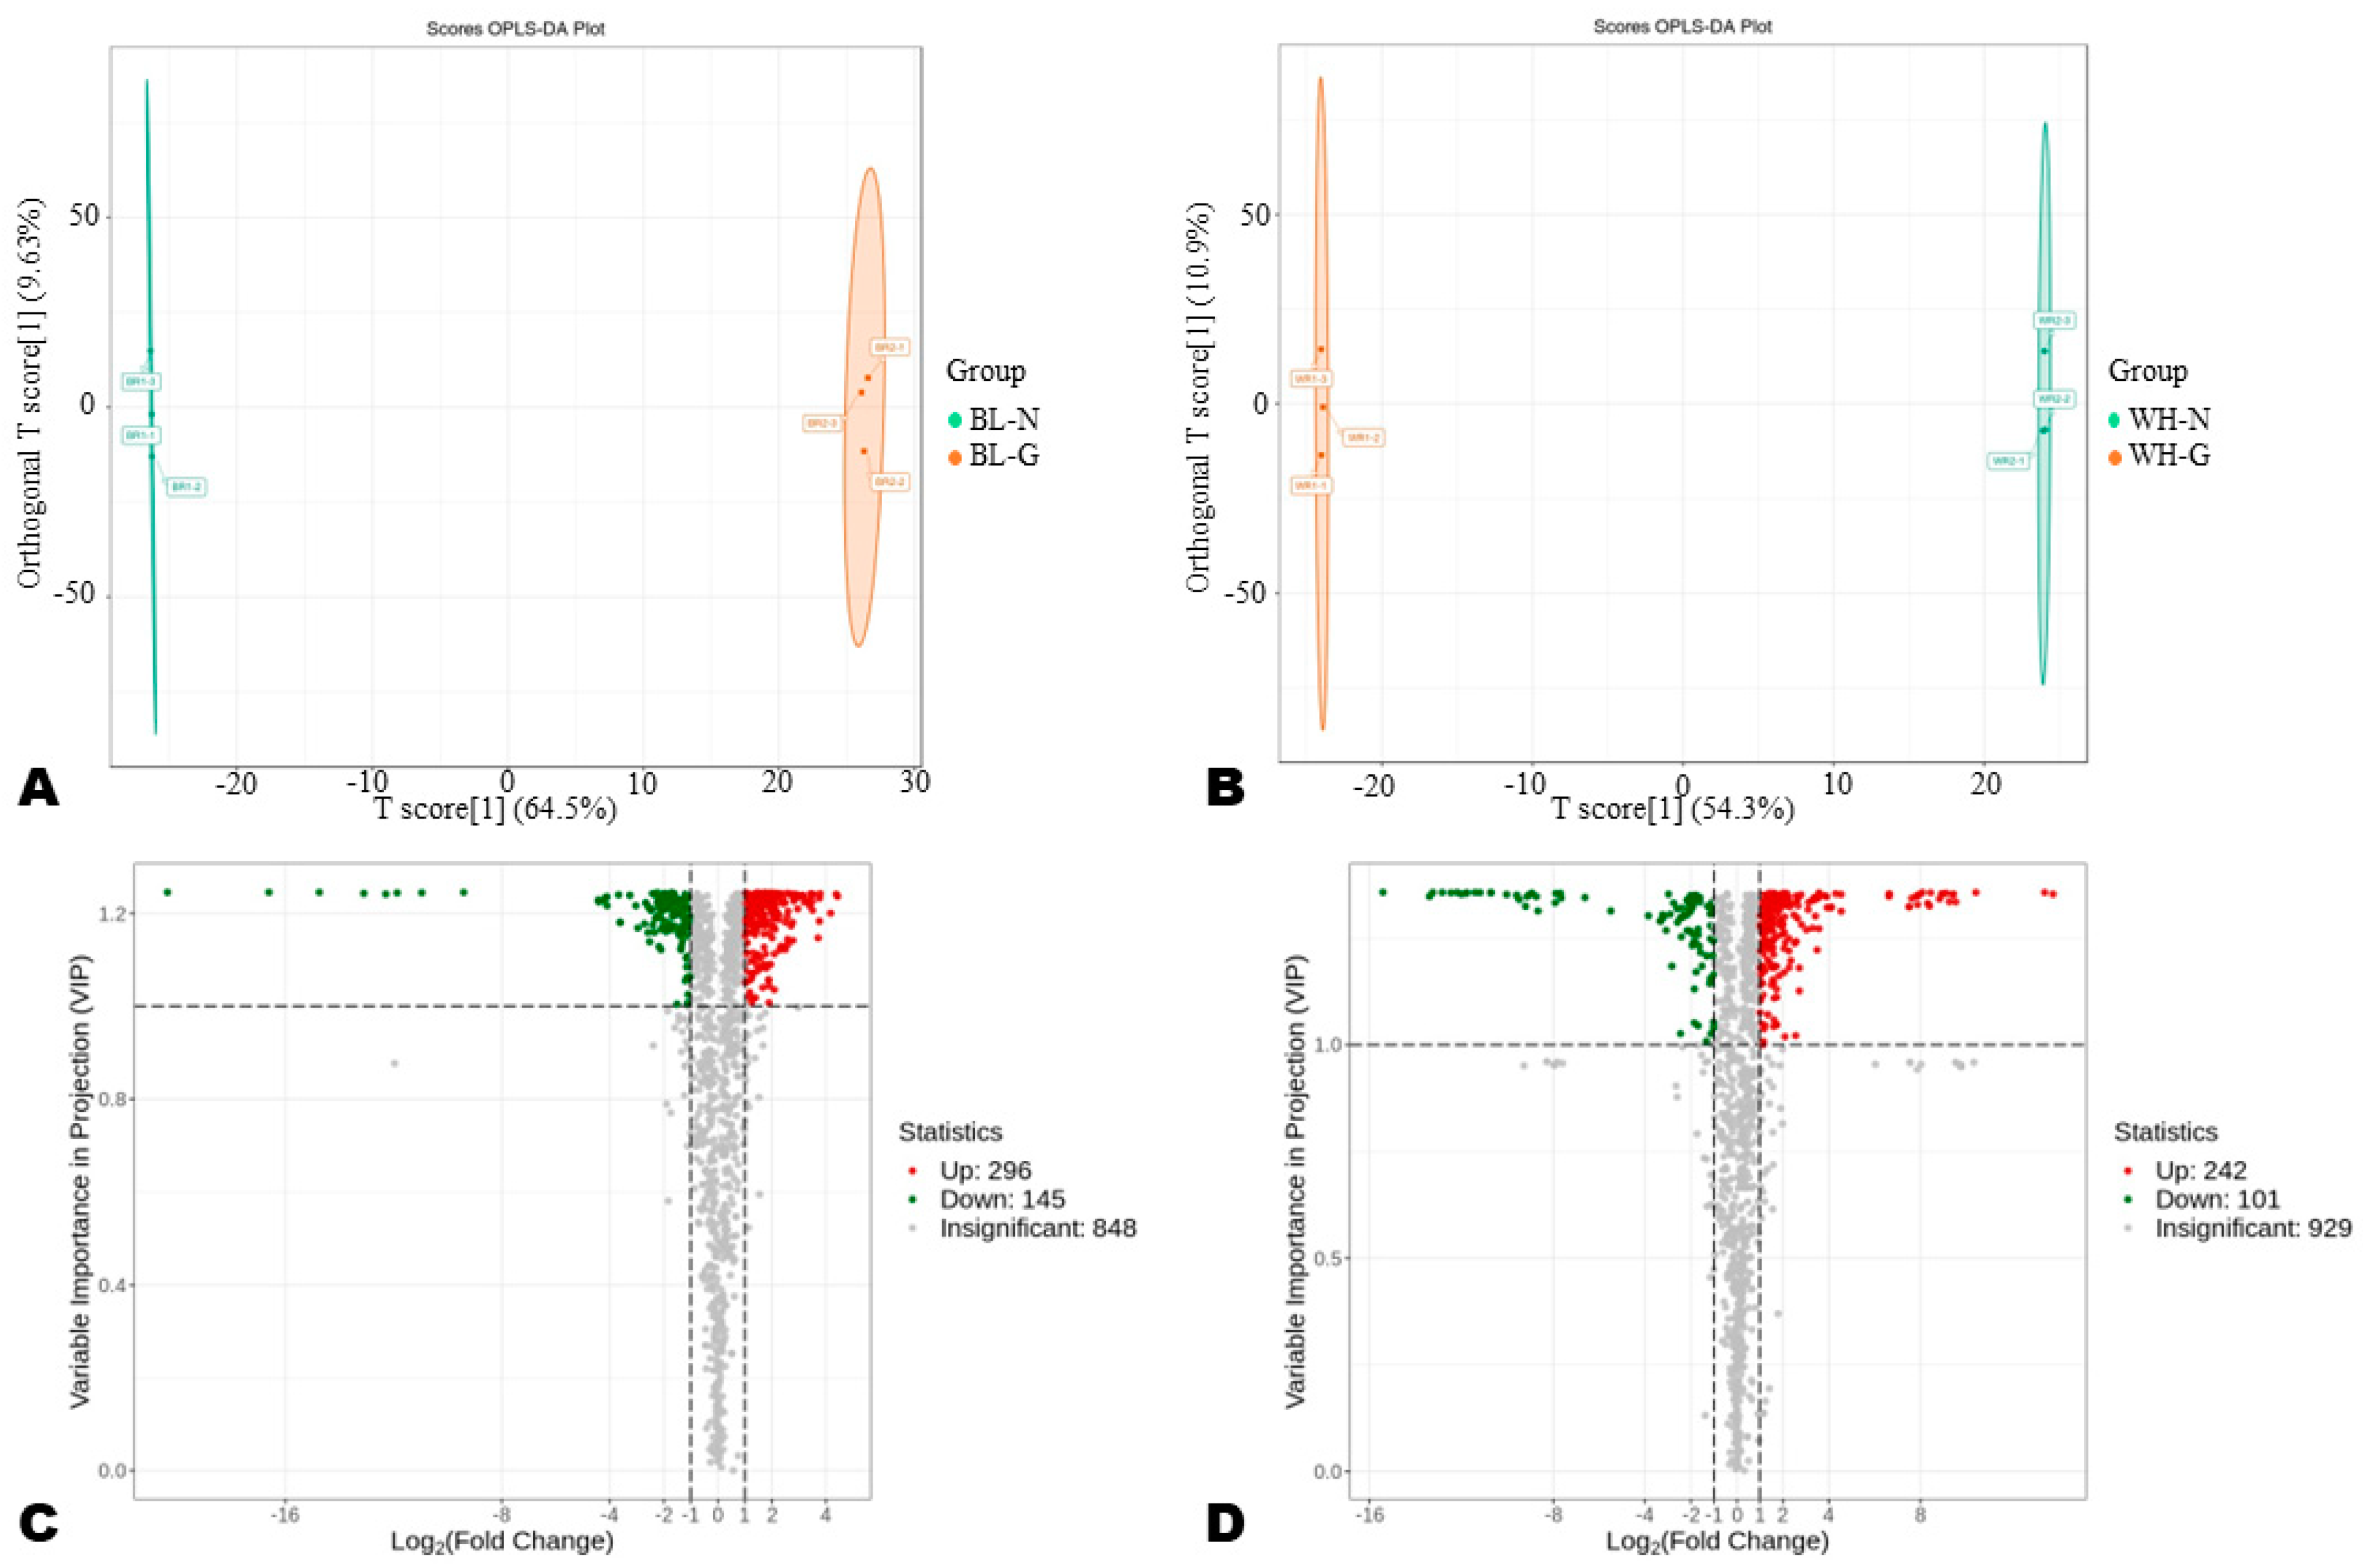
3.2. Differentially Accumulated Metabolites in Common and Glutinous Rice

DAMs are important resources for analysing quality differences and exploring variations in the regulation of metabolic processes between samples from different groups. Therefore, we performed an OPLS-DA analysis to detect significant DAMs between common and glutinous rice. The OPLS-DA score plots confirmed that the metabolite profiles of BL-G and WH-G were very different from those of BL-N and WH-N, respectively (Figure 2A,B). As shown in the permutation plots, the R2Y of the pairwise comparisons between BL-N_vs_BL-G and WH-N_vs_WH-G were equal to 1, and the Q2 values were higher than 0.965, confirming that the models were reliable (Figure S3A,B). By applying the thresholds of VIP ≥ 1, Log2FC > 1, and p-value < 0.05, we identified a total of 441 DAMs, including 296 up-regulated (in BL-G) DAMs, in a pairwise comparison between BL-N_vs_BL-G (Figure 2C). Meanwhile, 343 DAMs were detected between WH-N_vs_WH-G, with 242 DAMs up-regulated in WH-G (Figure 2D).
The top DAMs in BL-N and BL-G included protocatechuic acid methyl ester, syringopicroside, fagomine, rhoifolin, flaxidin-8-O-glucoside, velutin, 1-O-p-coumaroylquinic acid, etc. (Figure 3A and Figure S4). Meanwhile, acacetin-6-C-glucoside, swertisin, swertisin 8-methyl ester, p-coumaric acid-4-O-glucoside, dimethyl coniferin, hypoxanthine, rutin, etc., were the top DAMs between WH-N and WH-G (Figure 3B and Figure S5). Further, we constructed a Venn diagram to unveil key overlapped DAMs (Figure 3C). The result revealed 160 common DAMs in pairwise comparisons between BL-N_vs_BL-G and WH-N_vs_WH-G (Figure 3C and Table S3). These included 19.38% lipids, 16.88% phenolic acids, 16.25% flavonoids, 11.25% amino acids and derivatives, 9.38% alkaloids, 6.25% organic acids, 5% vitamins, etc. (Figure 3D).

3.3. Variation in Nutrients and Active Compounds

To investigate the variation in nutrients and bioactive compounds between common and glutinous rice, we calculated the sum of the relative contents of all metabolites within each class and constructed a heatmap (Figure 4A and Figure S6). The results showed that glutinous rice had higher relative contents of vitamins, alkaloids, lipids, free fatty acids, organic acids, terpenoids, saccharides, amino acids and derivatives, nucleotides and derivatives, and coumarins than common rice (Figure 4A and Figure S6A,B). WH-N and BL-N had higher relative contents of tannins and quinones compared to WH-G and BL-G, respectively (Figure 4A). We further proceeded to classify all DAMs in pairwise comparisons between BL-N_vs_BL-G and WH-N_vs_WH-G (Figure 4B). Supportively, the results showed that many metabolites belonging to lipids, phenolic acids, alkaloids, amino acids and derivatives, organic acids, free fatty acids, nucleotides and derivatives, and saccharides were up-regulated in WH-G and BL-G compared to WH-N and BL-N, respectively (Figure 4B). In contrast to black glutinous rice, many flavonoid compounds were up-regulated in white glutinous rice when compared to BL-N and WH-N, respectively (Figure 4B).

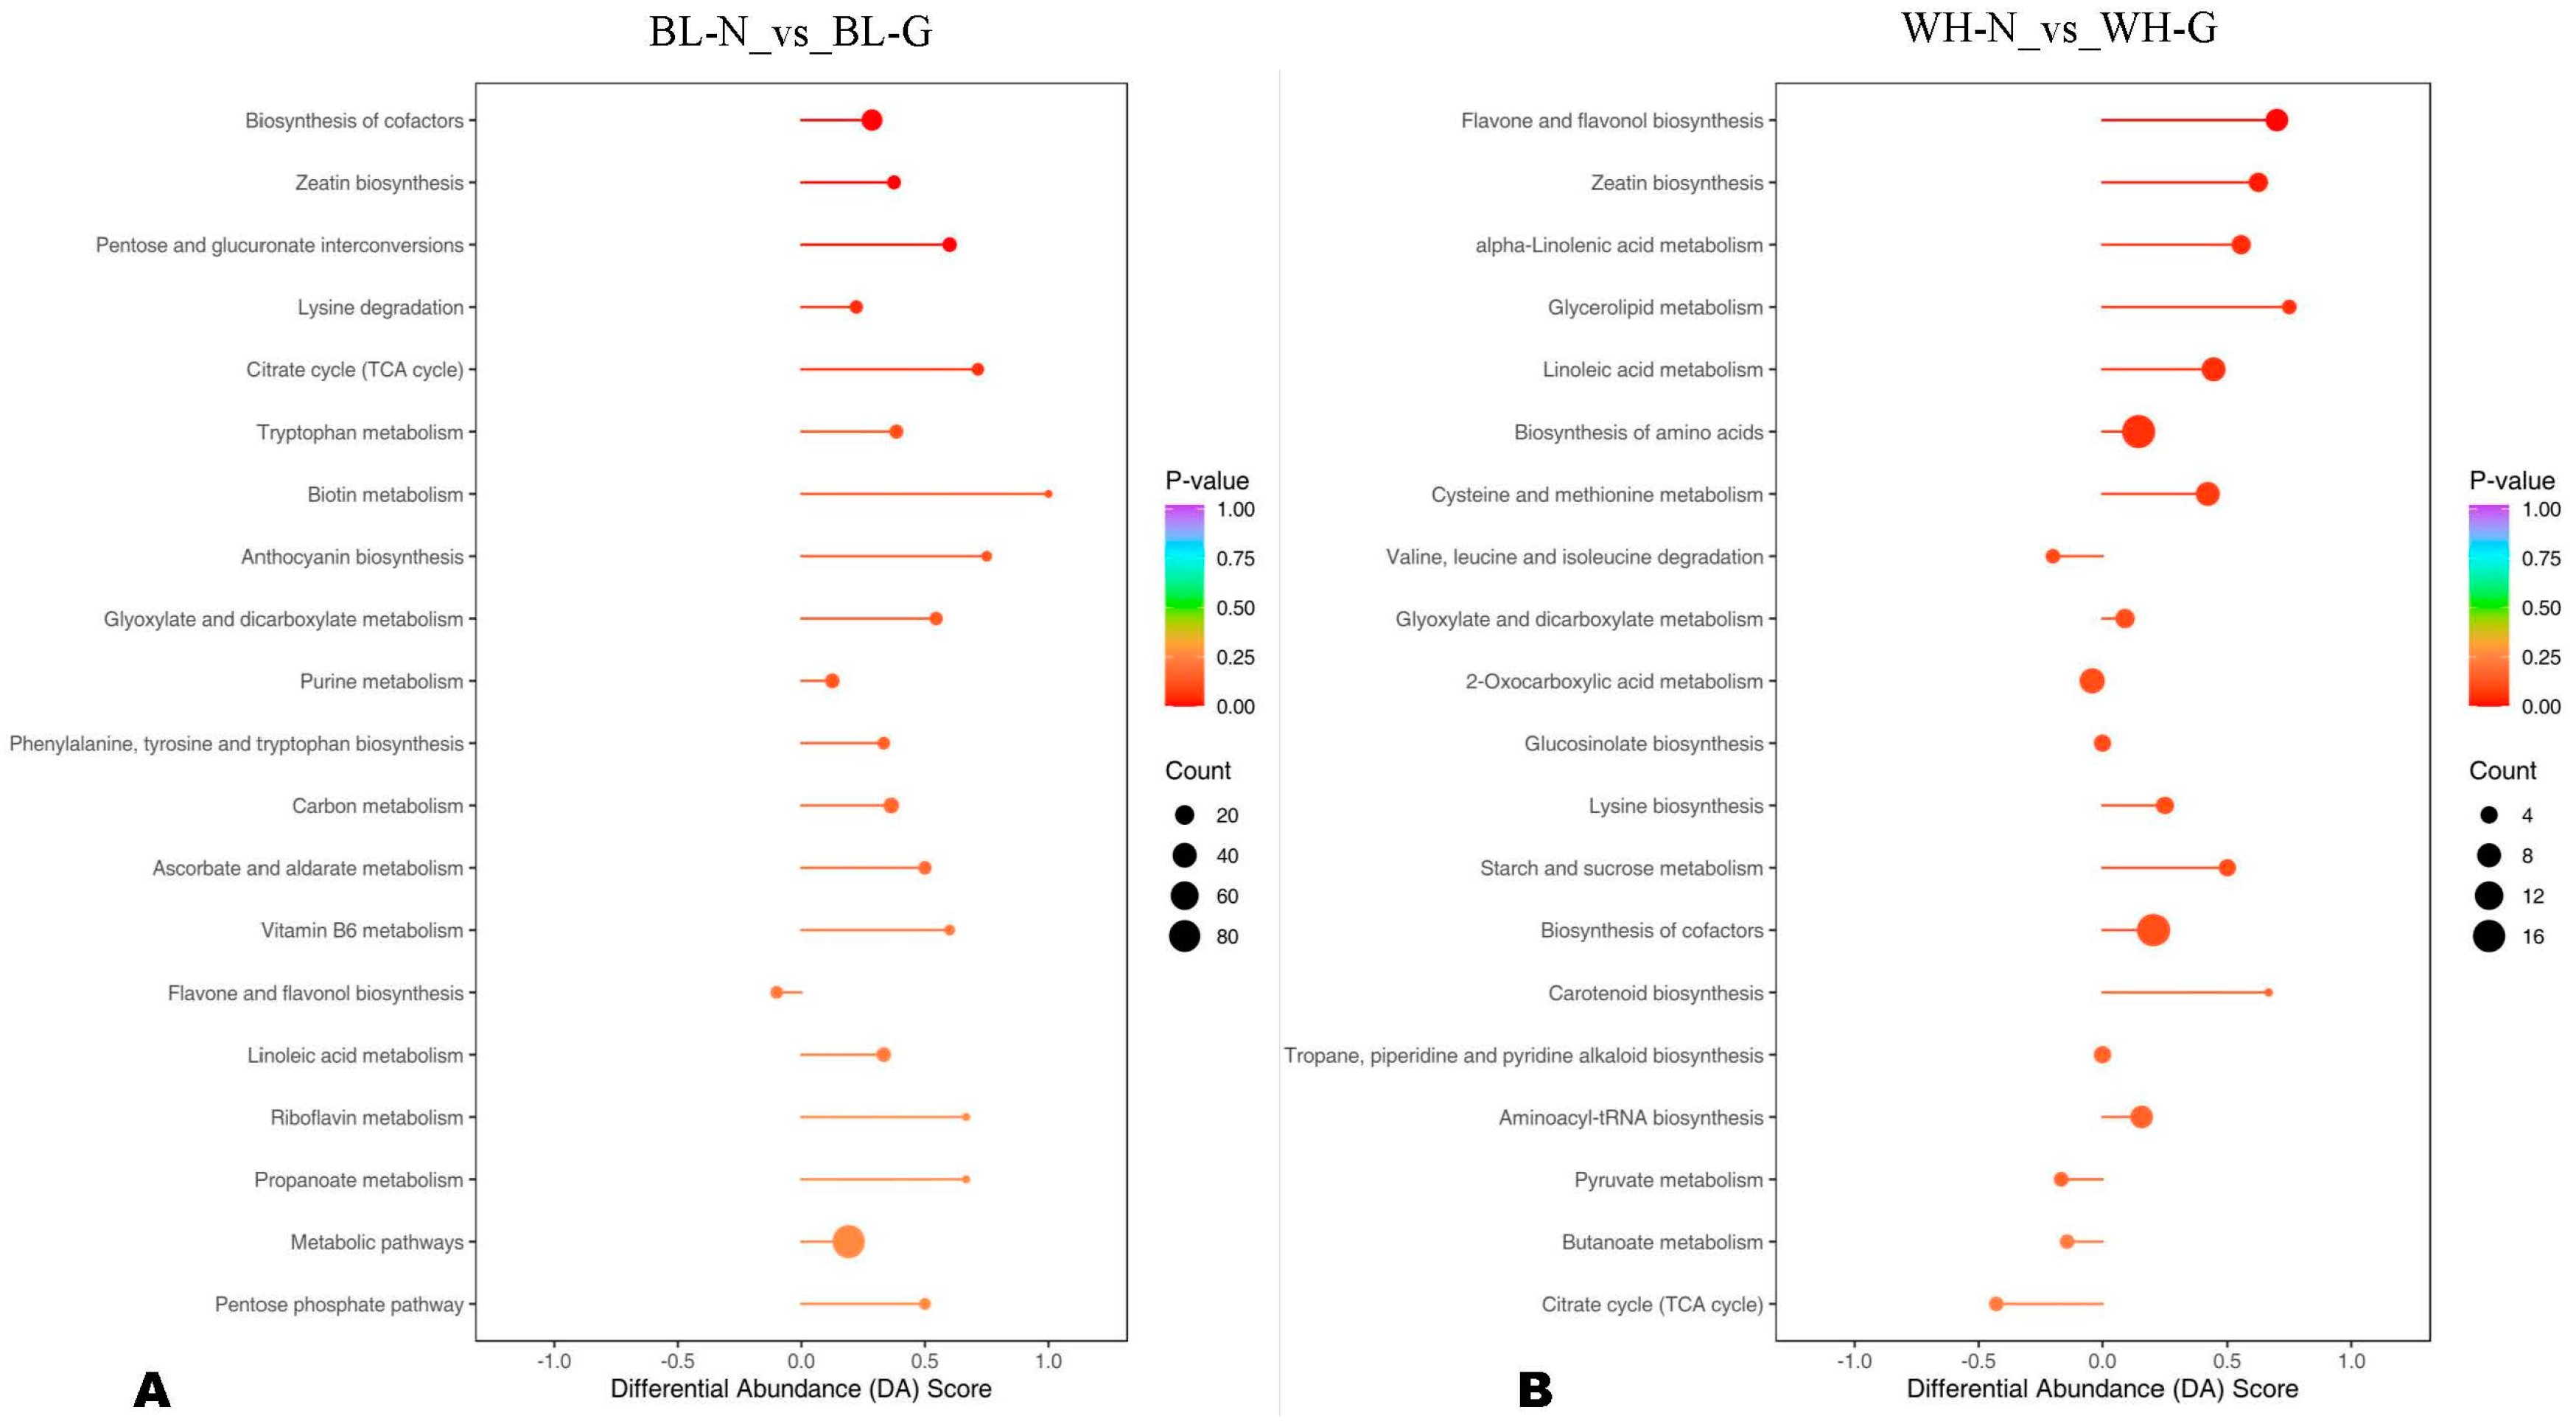
3.4. Major Differentially Regulated Metabolic Pathways

To gain insights into the differential metabolic regulation between BL-N and BL-G, and between WH-N and WH-G, we performed KEEG analysis of DAMs (Figure 5A,B). The major DRPs (differentially regulated pathways) identified between BL-N and BL-G were the biosynthesis of cofactors, zeatin biosynthesis, pentose and glucuronate interconversion, citrate cycle, lysine degradation, tryptophan metabolism, purine metabolism, carbon metabolism, linoleic acid metabolism, flavone and flavonol biosynthesis, and aromatic amino acid biosynthesis (Figure 5A). Similarly, flavone and flavonol biosynthesis, zeatin biosynthesis, biosynthesis of amino acids, linoleic and alpha-linolenic acid metabolism, cysteine and methionine metabolism, 2-oxocarboxilic acid metabolism, biosynthesis of cofactors, glyoxylate and dicarboxylate metabolism, and aminoacyl-tRNA biosynthesis were the major DRPs between WH-N and WH-G (Figure 5B).
To facilitate an overview of the key major DRPs between common and glutinous rice for their exploitation in future gene mining and gene–metabolite interaction studies, we constructed a diagram based on KEGG maps (Figure 6). The key differential metabolites in the citrate cycle include citrate, isocitrate, fumarate, malate, succinate, and 2-oxoglutarate. In the amino acid metabolism, the key DAMs were L-serine, L-cysteine, L-lysine, L-glutamine, L-methionine, and L-tryptophan. The key DAMs in glycolysis were UDP-glucose, D-glucose-1P, D-glucose-6P, and D-fructose-6P.

3.5. Variation Characteristics of Vitamins in Common and Glutinous Rice

Vitamins are essential components of rice quality. To explore the variations in the characteristics of vitamins in common and glutinous rice, we examined the relative contents of all differentially accumulated vitamins. As shown in Figure 7A–G, seven vitamins, including vitamin B6, vitamin B5, vitamin B13, vitamin B3, isonicotinic acid, N-(beta-D-glucosyl)nicotinate, and 4-pyridoxic acid-O-glucoside had higher relative contents in BL-G than in BL-N. Conversely, WH-G had higher contents of vitamin B6, vitamin B3, and isonicotinic acid than WH-N (Figure 7A,D,E).

4. Discussion

Understanding the metabolic characteristics that control the variations in the quality scores of different rice types is a prerequisite for the effective improvement of the nutritional and economic value of rice [37]. Among different rice types, glutinous rice plays important socio-cultural, nutritional, economic, and therapeutic roles worldwide, especially in East Asian countries [9,10,21,38]. Therefore, it is crucial to investigate global metabolome differences between normal and glutinous rice varieties and identify key metabolic resources for exploitation in quality breeding. Accordingly, the present study applied widely targeted metabolomics to unveil DAMs and differentially regulated pathways between common and glutinous rice types, with a particular emphasis on differential metabolites in critical metabolic processes and the variation characteristics of vitamins.
We identified and structurally characterised a total of 1292 metabolites in the two rice types, providing the chemical profiles of rice seed composition. Multivariate analyses revealed evidence of significant differences in the metabolite profiles of glutinous and normal rice seeds. Compared to common rice, glutinous rice seeds exhibited higher accumulations across all categories of metabolites except quinones (in BL-N) and tannins (in WH-N). These results suggest that glutinous rice varieties have a better nutritional quality than normal rice, which is consistent with previous studies that revealed that glutinous rice seeds have a better phenolic profile and higher antioxidant capacity than normal rice seeds [11]. Additionally, we noted that both black rice seed varieties (normal and glutinous) had higher contents of most identified metabolites than white rice seeds, indicating that they have attributes of superior quality. It was shown that the quality characteristics of pigmented rice, including chemical composition, physical appearance, aroma, and therapeutic properties, surpass those of white rice [4,39,40,41,42,43]. Further in-depth genetic and metabolic analysis of different coloured rice types is required to facilitate the achievement of quality breeding goals in rice.
We identified 441 and 343 DAMs between BL-N_vs_BL-G and WH-N_vs_WH-G, respectively, most of which were up-regulated in glutinous rice types. These results demonstrated the likely differential regulation of metabolic processes in the two rice types during caryopsis development. The functional analysis of DAMs consistently revealed that the biosynthesis of cofactors, zeatin biosynthesis, citrate cycle, amino acid metabolism, alpha-linolenic acid metabolism, and glyoxylate and dicarboxylate metabolism were the major differentially regulated metabolic pathways between glutinous and normal rice types. In addition, 160 key overlapping DAMs were uncovered, which could represent potential metabolic biomarkers and could be used for authentication and differentiation between glutinous and normal rice products. Further investigation into the dynamic regulation of metabolic components (genes and metabolites) and mechanisms related to these pathways at the transcriptional level between glutinous and common rice is necessary to understand the observed quality differences. Similarly, key DAMs and DRPs are fundamental resources for the future exploration of gene-metabolite networks underlying rice quality variation.
Rice quality is a complex trait influenced by many genes and metabolites whose expression is encoded by environmental conditions [44]. Many metabolic processes, such as glycolysis and the citrate cycle, are essential for normal growth, development, and high-quality grain yield in rice [45,46]. They play pivotal roles in energy metabolism and the biosynthesis of various metabolites [47]. Our study outlined key differential metabolites in the TCA cycle (citrate, isocitrate, fumarate, malate, succinate, and 2-oxoglutarate) and in glycolysis (UDP-glucose, D-glucose-1P, D-glucose-6P, and D-fructose-6P) between glutinous and common rice varieties. These metabolites and metabolic pathways should be investigated in future studies and may serve as references for identifying quality-related candidate for gene mining. For instance, it has been reported that reducing glucose-1P catabolism in the glycolytic process is crucial for the formation of amylose synthesis substrates (ADP-glucose and UDP-glucose) [46].
Amino acids are critical components of rice quality and provide important nutritional sources for humans [48]. An adequate supply of amino acids and carbohydrates during caryopsis development is essential for achieving excellent nutritional and eating quality in rice [49,50]. Six key differential amino acids were also identified, including L-serine, L-cysteine, L-lysine, L-glutamine, L-methionine, and L-tryptophan. Further studies on these key differential amino acids are required. Of these, tryptophan, in addition to its involvement in protein structure, is the precursor of important secondary metabolites, including auxin, melatonin, and serotonin, which have various physiological implications in higher plants [51]. Tryptophan is synthesised in plants together with phenylalanine and tyrosine via the shikimate/chorismate pathway [51]. A recent study revealed that the shikimate metabolism affects the aroma quality of rice varieties [52]. In our study, shikimate was also significantly differentially regulated between BL-N and BL-G, suggesting that the shikimate pathway may contribute to the variation in secondary metabolite profiles and quality traits of the two rice types. Therefore, the identification of key differential metabolites and metabolic pathways lays the foundation for future studies on the functions and nutritional value of common and glutinous rice.

5. Conclusions

Overall, this study reveals that glutinous rice seeds accumulate higher levels of most primary and bioactive secondary metabolites, including vitamins, alkaloids, lipids, free fatty acids, organic acids, terpenoids, saccharides, amino acids and derivatives, nucleotides and derivatives, and coumarins than common rice. Among the four rice types, black glutinous rice exhibited the best vitamin profile. We identified 160 key differentially accumulated metabolites, of which lipids, phenolic acids, flavonoids, amino acids and derivatives, and alkaloids were dominant. Furthermore, we unveiled the major DAPs, including biosynthesis of cofactors, zeatin biosynthesis, citrate cycle, amino acid metabolism, alpha-linolenic acid metabolism, and glyoxylate and dicarboxylate metabolism. Our results may facilitate the exploration of gene-metabolite interactions that govern variations in rice quality traits.

Supplementary Materials

The following supporting information can be downloaded at: https://www.mdpi.com/article/10.3390/agronomy14071383/s1. Figure S1: Multiple reaction monitoring (MRM) graphs of QC samples showing total ions current (TIC) of some identified metabolites in negative (A) and positive (B) ESI; Figure S2: Correlation analysis plot of QC samples; Figure S3: (A) and (B) Permutation plots of pairwise OPLS-DA analysis between BL-N_vs_BL-G and WH-N_vs_WH-G, respectively; Figure S4: Top twenty DAMs in pairwise comparison between BL-N_vs_BL-G; Figure S5: Top twenty DAMs in pairwise comparison between WH-N_vs_WH-G; Figure S6: Accumulation patterns of primary and secondary metabolites; Table S1: Liquid chromatography (A) and mass spectrometry (B) conditions; Table S2: List of the 1292 identified metabolites and their relative contents; Table S3: List of the 160 overlapped DAMs.

Author Contributions

Original draft preparation, M.Z.; conceptualisation, M.Z. and W.Q., data curation, J.H., J.R., X.X. and Y.L.; methodology, J.H., X.Y., L.Z. and Y.Y.; formal analysis, J.R., Y.L. and X.Y.; investigation, L.Z., X.X., Y.Y. and Q.Y.; supervision, F.X., Q.Y. and W.Q.; project administration, Q.T.; funding acquisition, M.Z., Q.Y., F.X. and W.Q. All authors have read and agreed to the published version of the manuscript.

Funding

This research was funded by the Project of Sanya Yazhou Bay Science and Technology City (grant number: SCKJ-JYRC-2023-31), the starting fund for high-scientific study of genius in Hainan Academy of Agricultural Sciences (grant number: HAAS2023RCQD17), Key R&D projects in Hainan Province (grant number: ZDYF2024XDNY165), and the Earmarked Fund for China Agriculture Research System (grant number: CARS-01-92).

Data Availability Statement

The data supporting reported results are included in this manuscript and its Supplementary Materials. The datasets analysed or generated will be made available on request.

Conflicts of Interest

The authors declare no conflicts of interest. The funders had no role in the design of the study; in the collection, analyses, or interpretation of data; in the writing of the manuscript; or in the decision to publish the results.

References

  1. Zhu, J.; Li, A.; Sun, C.; Zhang, J.; Hu, J.; Wang, S.; Zhou, N.; Xiong, Q. Rice Quality-Related Metabolites and the Regulatory Roles of Key Metabolites in Metabolic Pathways of High-Quality Semi-Glutinous Japonica Rice Varieties. Foods 2022, 11, 3676. [Google Scholar] [CrossRef] [PubMed]
  2. Sudan, J.; Urwat, U.; Farooq, A.; Pakhtoon, M.M.; Zaffar, A.; Naik, Z.A.; Batool, A.; Bashir, S.; Mansoor, M.; Sofi, P.A.; et al. Explicating Genetic Architecture Governing Nutritional Quality in Pigmented Rice. PeerJ 2023, 11, e15901. [Google Scholar] [CrossRef] [PubMed]
  3. Rathna Priya, T.S.; Eliazer Nelson, A.R.L.; Ravichandran, K.; Antony, U. Nutritional and Functional Properties of Coloured Rice Varieties of South India: A Review. J. Ethn. Foods 2019, 6, 11. [Google Scholar] [CrossRef]
  4. Melini, V.; Panfili, G.; Fratianni, A.; Acquistucci, R. Bioactive Compounds in Rice on Italian Market: Pigmented Varieties as a Source of Carotenoids, Total Phenolic Compounds and Anthocyanins, before and after Cooking. Food Chem. 2019, 277, 119–127. [Google Scholar] [CrossRef] [PubMed]
  5. Bordiga, M.; Gomez-Alonso, S.; Locatelli, M.; Travaglia, F.; Coïsson, J.D.; Hermosin-Gutierrez, I.; Arlorio, M. Phenolics Characterization and Antioxidant Activity of Six Different Pigmented Oryza sativa L. Cultivars Grown in Piedmont (Italy). Food Res. Int. 2014, 65, 282–290. [Google Scholar] [CrossRef]
  6. Chen, X.Q.; Nagao, N.; Itani, T.; Irifune, K. Anti-Oxidative Analysis, and Identification and Quantification of Anthocyanin Pigments in Different Coloured Rice. Food Chem. 2012, 135, 2783–2788. [Google Scholar] [CrossRef] [PubMed]
  7. Zhang, L.; Cui, D.; Ma, X.; Han, B.; Han, L. Comparative Analysis of Rice Reveals Insights into the Mechanism of Colored Rice via Widely Targeted Metabolomics. Food Chem. 2022, 399, 133926. [Google Scholar] [CrossRef]
  8. Pereira-Caro, G.; Cros, G.; Yokota, T.; Crozier, A. Phytochemical Profiles of Black, Red, Brown, and White Rice from the Camargue Region of France. J. Agric. Food Chem. 2013, 61, 7976–7986. [Google Scholar] [CrossRef] [PubMed]
  9. Jiang, C.; Rashid, M.A.R.; Zhang, Y.; Zhao, Y.; Pan, Y. Genome Wide Association Study on Development and Evolution of Glutinous Rice. BMC Genom. Data 2022, 23, 33. [Google Scholar] [CrossRef]
  10. Gautam, R.K.; Langyan, S.; Devi, S.V.; Singh, R.; Semwal, D.P.; Ali, S.; Mangat, G.S.; Sarkar, S.; Bagchi, T.B.; Roy, S.; et al. Genetic Resources of Sticky Rice in India: Status and Prospects. Genet. Resour. Crop Evol. 2023, 70, 95–106. [Google Scholar] [CrossRef]
  11. Setyaningsih, W.; Hidayah, N.; Saputro, I.E.; Lovillo, M.P. Study of Glutinous and Non-Glutinous Rice (Oryza sativa) Varieties on Their Antioxidant Compounds. In Proceedings of the International Conference on Plant, Marine and Environmental Sciences (PMES-2015), Kuala Lumpur, Malaysia, 1–2 January 2015; International Institute of Chemical, Biological & Environmental Engineering. pp. 26–31. [Google Scholar]
  12. Burešová, I.; Červenka, L.; Šebestíková, R.; Augustová, M.; Jarošová, A. Applicability of Flours from Pigmented and Glutinous Rice in Gluten-Free Bread Baking. Foods 2023, 12, 1324. [Google Scholar] [CrossRef]
  13. Gui, Y.; Chen, G.; Tian, W.; Yang, S.; Chen, J.; Wang, F.; Li, Y. Normal Rice Flours Perform Better in Gluten-Free Bread than Glutinous Rice Flours. J. Food Sci. 2022, 87, 554–566. [Google Scholar] [CrossRef]
  14. Palaniveloo, K.; Santhanaraju Vairappan, C. Biochemical Properties of Rice Wine Produced from Three Different Starter Cultures. J. Trop. Biol. Conserv. 2013, 10, 31–41. [Google Scholar]
  15. Chanthathamrongsiri, N.; Prompanya, C.; Leelakanok, N.; Jiangseubchatveera, N.; Semangoen, T.; Nuurai, P.; Khawsuk, W.; Petchsomrit, A. Rice Extract: Antioxidant Activities and Formulations. J. Appl. Pharm. Sci. 2022, 12, 126–133. [Google Scholar] [CrossRef]
  16. Guo, H.; Chariyakornkul, A.; Phannasorn, W.; Mahatheeranont, S.; Wongpoomchai, R. Phytochemical Profile and Chemopreventive Properties of Cooked Glutinous Purple Rice Extracts Using Cell-Based Assays and Rat Model. Foods 2022, 11, 2333. [Google Scholar] [CrossRef]
  17. Guo, H.; Punvittayagul, C.; Vachiraarunwong, A.; Phannasorn, W.; Wongpoomchai, R. Cancer Chemopreventive Potential of Cooked Glutinous Purple Rice on the Early Stages of Hepatocarcinogenesis in Rats. Front. Nutr. 2022, 9, 1–14. [Google Scholar] [CrossRef]
  18. Liang, C.; Guan, Z.; Wei, K.; Yu, W.; Wang, L.; Chen, X.; Wang, Y. Characteristics of Antioxidant Capacity and Metabolomics Analysis of Flavonoids in the Bran Layer of Green Glutinous Rice (Oryza sativa L. Var. Glutinosa Matsum). Sci. Rep. 2023, 13, 16372. [Google Scholar] [CrossRef] [PubMed]
  19. Xiong, Q.; Sun, C.; Li, A.; Zhang, J.; Shi, Q.; Zhang, Y.; Hu, J.; Zhou, N.; Wei, H.; Liu, B.; et al. Metabolomics and Biochemical Analyses Revealed Metabolites Important for the Antioxidant Properties of Purple Glutinous Rice. Food Chem. 2022, 389, 133080. [Google Scholar] [CrossRef]
  20. Nakayama, T.; Nagai, Y.; Uehara, Y.; Nakamura, Y.; Ishii, S.; Kato, H.; Tanaka, Y. Eating Glutinous Brown Rice Twice a Day for 8 Weeks Improves Glycemic Control in Japanese Patients with Diabetes Mellitus. Nutr. Diabetes 2017, 7, e273–e276. [Google Scholar] [CrossRef]
  21. Nakayama, T.; Nagai, Y.; Yasunaka, Y.; Uraguchi, T.; Wada, Y.; Sone, M.; Tanaka, Y. Effect of Eating Glutinous Brown Rice Twice a Day for 6 Weeks on Serum 1,5-Anhydroglucitol in Japanese Subjects without Diabetes. J. Nutr. Metab. 2020, 2020, 1–7. [Google Scholar] [CrossRef]
  22. Nayak, S.N.; Aravind, B.; Malavalli, S.S.; Sukanth, B.S.; Poornima, R.; Bharati, P.; Hefferon, K.; Kole, C.; Puppala, N. Omics Technologies to Enhance Plant Based Functional Foods: An Overview. Front. Genet. 2021, 12, 1–18. [Google Scholar] [CrossRef] [PubMed]
  23. Tiozon, R.J.N.; Sartagoda, K.J.D.; Serrano, L.M.N.; Fernie, A.R.; Sreenivasulu, N. Metabolomics Based Inferences to Unravel Phenolic Compound Diversity in Cereals and Its Implications for Human Gut Health. Trends Food Sci. Technol. 2022, 127, 14–25. [Google Scholar] [CrossRef] [PubMed]
  24. Xiao, Q.; Mu, X.; Liu, J.; Li, B.; Liu, H.; Zhang, B.; Xiao, P. Plant Metabolomics: A New Strategy and Tool for Quality Evaluation of Chinese Medicinal Materials. Chin. Med. 2022, 17, 45. [Google Scholar] [CrossRef]
  25. Dossou, S.S.K.; Xu, F.; Cui, X.; Sheng, C.; Zhou, R.; You, J.; Tozo, K.; Wang, L. Comparative Metabolomics Analysis of Different Sesame (Sesamum indicum L.) Tissues Reveals a Tissue-Specific Accumulation of Metabolites. BMC Plant Biol. 2021, 21, 352. [Google Scholar] [CrossRef] [PubMed]
  26. Wu, Q.; Gao, H.; You, Z.; Zhang, Z.; Zhu, H.; He, M.; He, J.; Duan, X.; Jiang, Y.; Yun, Z. Multiple Metabolomics Comparatively Investigated the Pulp Breakdown of Four Dragon Fruit Cultivars during Postharvest Storage. Food Res. Int. 2023, 164, 112410. [Google Scholar] [CrossRef] [PubMed]
  27. Li, S.; Han, Q.; Qiao, C.; Song, J.; Cheng, C.L.; Xu, H. Chemical Markers for the Quality Control of Herbal Medicines: An Overview. Chin. Med. 2008, 3, 7. [Google Scholar] [CrossRef] [PubMed]
  28. Ma, T.; Sun, Y.; Lin, J.; Wang, J.; Zhang, X.; Yan, T.; Jia, Y. Chemical Constituents and Mechanisms from Hemerocallis Citrina Baroni with Anti-Neuroinflammatory Activity. J. Funct. Foods 2023, 102, 105427. [Google Scholar] [CrossRef]
  29. Xiao, J.; Gu, C.; He, S.; Zhu, D.; Huang, Y.; Zhou, Q. Widely Targeted Metabolomics Analysis Reveals New Biomarkers and Mechanistic Insights on Chestnut (Castanea mollissima Bl.) Calcification Process. Food Res. Int. 2021, 141, 110128. [Google Scholar] [CrossRef] [PubMed]
  30. Chen, W.; Gong, L.; Guo, Z.; Wang, W.; Zhang, H.; Liu, X.; Yu, S.; Xiong, L.; Luoa, J. A Novel Integrated Method for Large-Scale Detection, Identification, and Quantification of Widely Targeted Metabolites: Application in the Study of Rice Metabolomics. Mol. Plant 2013, 6, 1769–1780. [Google Scholar] [CrossRef]
  31. Dossou, S.S.K.; Xu, F.; You, J.; Zhou, R.; Li, D.; Wang, L. Widely Targeted Metabolome Profiling of Different Colored Sesame (Sesamum Indicum L.) Seeds Provides New Insight into Their Antioxidant Activities. Food Res. Int. 2022, 151, 110850. [Google Scholar] [CrossRef]
  32. Kefale, H.; Segla Koffi Dossou, S.; Li, F.; Jiang, N.; Zhou, R.; Wang, L.; Zhang, Y.; Li, D.; You, J.; Wang, L. Widely Targeted Metabolic Profiling Provides Insights into Variations in Bioactive Compounds and Antioxidant Activity of Sesame, Soybean, Peanut, and Perilla. Food Res. Int. 2023, 174, 113586. [Google Scholar] [CrossRef]
  33. Zhou, X.; Liu, S.; Yang, Y.; Liu, J.; Zhuang, Y. Integrated Metabolome and Transcriptome Analysis Reveals a Regulatory Network of Fruit Peel Pigmentation in Eggplant (Solanum melongena L.). Int. J. Mol. Sci. 2022, 23, 3475. [Google Scholar] [CrossRef]
  34. Zhou, G.; Wu, S.; Chen, D.; Wu, X.; Cai, Q. Polyphenols and Phytohormones Profiling of Pre-Harvest Sprouting Resistant and Susceptible Wheat Genotypes. SN Appl. Sci. 2023, 5, 249. [Google Scholar] [CrossRef]
  35. Tang, D.; Chen, M.; Huang, X.; Zhang, G.; Zeng, L.; Zhang, G.; Wu, S.; Wang, Y. SRplot: A Free Online Platform for Data Visualization and Graphing. PLoS ONE 2023, 18, e0294236. [Google Scholar] [CrossRef]
  36. Chen, C.; Chen, H.; Zhang, Y.; Thomas, H.R.; Frank, M.H.; He, Y.; Xia, R. TBtools: An Integrative Toolkit Developed for Interactive Analyses of Big Biological Data. Mol. Plant 2020, 13, 1194–1202. [Google Scholar] [CrossRef] [PubMed]
  37. Prom-u-thai, C.; Rerkasem, B. Rice Quality Improvement. A Review. Agron. Sustain. Dev. 2020, 40, 28. [Google Scholar] [CrossRef]
  38. Qiu, S.; Abbaspourrad, A.; Padilla-Zakour, O.I. Changes in the Glutinous Rice Grain and Physicochemical Properties of Its Starch upon Moderate Treatment with Pulsed Electric Field. Foods 2021, 10, 395. [Google Scholar] [CrossRef]
  39. Chen, Y.; Zhao, Z.; Guo, S.; Li, Y.; Yin, H.; Tian, L.; Cheng, G.; Li, Y. Red Rice Seed Coat Targeting SPHK2 Ameliorated Alcoholic Liver Disease via Restored Intestinal Barrier and Improved Gut Microbiota in Mice. Nutrients 2023, 15, 4176. [Google Scholar] [CrossRef] [PubMed]
  40. Ou, S.J.L.; Yang, D.; Pranata, H.P.; Tai, E.S.; Liu, M.H. Postprandial Glycemic and Lipidemic Effects of Black Rice Anthocyanin Extract Fortification in Foods of Varying Macronutrient Compositions and Matrices. NPJ Sci. Food 2023, 7, 59. [Google Scholar] [CrossRef]
  41. Song, H.; Shen, X.; Zhou, Y.; Zheng, X. Black Rice Anthocyanins Alleviate Hyperlipidemia, Liver Steatosis and Insulin Resistance by Regulating Lipid Metabolism and Gut Microbiota in Obese Mice. Food Funct. 2021, 12, 10160–10170. [Google Scholar] [CrossRef]
  42. Suwannasom, N.; Thepmalee, C.; Khoothiam, K.; Thephinlap, C. Evaluation of Anti-Hyperglycemia and Complications of Red and Black Thai Jasmine Rice Cultivars in Streptozotocin-Induced Diabetic Rats. Molecules 2022, 27, 8043. [Google Scholar] [CrossRef] [PubMed]
  43. Wang, H.; Liu, D.; Ji, Y.; Liu, Y.; Xu, L.; Guo, Y. Dietary Supplementation of Black Rice Anthocyanin Extract Regulates Cholesterol Metabolism and Improves Gut Microbiota Dysbiosis in C57BL/6J Mice Fed a High-Fat and Cholesterol Diet. Mol. Nutr. Food Res. 2020, 64, 1–13. [Google Scholar] [CrossRef] [PubMed]
  44. Custodio, M.C.; Cuevas, R.P.; Ynion, J.; Laborte, A.G.; Velasco, M.L.; Demont, M. Rice Quality: How Is It Defined by Consumers, Industry, Food Scientists, and Geneticists? Trends Food Sci. Technol. 2019, 92, 122–137. [Google Scholar] [CrossRef] [PubMed]
  45. Zhou, H.; Li, Y.; Feng, S.; Wu, Z.; Zheng, D.; Feng, N. Joint Analysis of Transcriptome and Metabolome Revealed the Difference in Carbohydrate Metabolism between Super Hybrid Rice and Conventional Rice under Salt Stress. Plant Stress 2023, 10, 100251. [Google Scholar] [CrossRef]
  46. Zhang, H.; Chen, J.; Shan, S.; Cao, F.; Chen, G.; Zou, Y.; Huang, M.; Abou-Elwafa, S.F. Proteomic Profiling Reveals Differentially Expressed Proteins Associated with Amylose Accumulation during Rice Grain Filling. BMC Genom. 2020, 21, 714. [Google Scholar] [CrossRef] [PubMed]
  47. Zhang, Y.; Sampathkumar, A.; Kerber, S.M.L.; Swart, C.; Hille, C.; Seerangan, K.; Graf, A.; Sweetlove, L.; Fernie, A.R. A Moonlighting Role for Enzymes of Glycolysis in the Co-Localization of Mitochondria and Chloroplasts. Nat. Commun. 2020, 11, 4509. [Google Scholar] [CrossRef] [PubMed]
  48. Yang, J.; Zhou, Y.; Jiang, Y. Amino Acids in Rice Grains and Their Regulation by Polyamines and Phytohormones. Plants 2022, 11, 1581. [Google Scholar] [CrossRef] [PubMed]
  49. Guo, N.; Zhang, S.; Gu, M.; Xu, G. Function, Transport, and Regulation of Amino Acids: What Is Missing in Rice? Crop J. 2021, 9, 530–542. [Google Scholar] [CrossRef]
  50. Yibo, C.; Zhidong, W.; Chongrong, W.; Hong, L.; Daoqiang, H.; Degui, Z.; Lei, Z.; Yangyang, P.; Rong, G.; Shaochuan, Z. Comparisons of Metabolic Profiles for Carbohydrates, Amino Acids, Lipids, Fragrance and Flavones During Grain Development in Indica Rice Cultivars. Rice Sci. 2022, 29, 155–165. [Google Scholar] [CrossRef]
  51. Corpas, F.J.; Gupta, D.K.; Palma, J.M. Tryptophan: A Precursor of Signaling Molecules in Higher Plants BT—Hormones and Plant Response; Gupta, D.K., Corpas, F.J., Eds.; Springer International Publishing: Cham, Switzerland, 2021; pp. 273–289. ISBN 978-3-030-77477-6. [Google Scholar]
  52. Ghosh, P.; Banerjee, A.; Roychoudhury, A. Dissecting the Biochemical and Molecular-Genetic Regulation of Diverse Metabolic Pathways Governing Aroma Formation in Indigenous Aromatic Indica Rice Varieties. Mol. Biol. Rep. 2023, 50, 2479–2500. [Google Scholar] [CrossRef]
Figure 1. Diversity and variation of metabolites in common and glutinous rice. (A) Principal component analysis (PCA); (B) hierarchical clustering analysis (HCA). BL-N and WH-N are black and white non-glutinous rice, respectively. BL-G and WH-G are black and white glutinous rice, respectively.
Agronomy 14 01383 g001
Figure 2. DAMs in glutinous and common rice types. (A,B) OPLS-DA score plots of pairwise comparisons between BL-N_vs_BL_G and WH-N_vs_WH-G, respectively. (C,D) Volcano plots of DAMs in pairwise comparisons between BL-N_vs_BL-G and WH-N_vs_WH-G, respectively. BL-N and WH-N are black and white non-glutinous rice, respectively. BL-G and WH-G are black and white glutinous rice, respectively.
Agronomy 14 01383 g002
Figure 3. Top DAMs and key overlapped DAMs. (A,B): top ten DAMs in pairwise comparisons between BL-N_vs_BLG and WH-N_vs_WH-G, respectively. C1, (2r,3r,4s,5s,6r)-2-{[(1r,2r,4r)-2,4-dihydroxy-1,2,3,4-tetrahydronaphthalen-1-yl]oxy}-6-(hydroxymethyl)oxane-3,4,5-triol.(C) Venn diagram showing the 160 overlapped key DAMs between common and glutinous rice. (D) Classification of the 160 key DAMs. BL-N and WH-N are black and white non-glutinous rice, respectively. BL-G and WH-G are black and white glutinous rice, respectively.
Agronomy 14 01383 g003
Figure 4. (A) Accumulation patterns of primary and secondary metabolites in common and glutinous rice. (B) Classification of all DAMs in pairwise comparisons between BL-N_vs_BL-G and WH-N_vs_WH-G, respectively. BL-N and WH-N are black and white non-glutinous rice, respectively. BL-G and WH-G are black and white glutinous rice, respectively.
Agronomy 14 01383 g004
Figure 5. (A,B) KEGG annotation and enrichment results of all DAMs in pairwise comparisons between BL-N_vs_BL-G and WH-N_vs_WH-G, respectively. BL-N and WH-N are black and white non-glutinous rice, respectively. BL-G and WH-G are black and white glutinous rice, respectively.
Agronomy 14 01383 g005
Figure 6. Overview of the probable regulation of certain key metabolites mapped to metabolic pathways in pairwise comparisons between common and glutinous rice. Note: The green and red rectangles, respectively, indicate that the metabolite content is significantly down-regulated and up-regulated; the blue rectangle indicates no significant difference. BL-N and WH-N are black and white non-glutinous rice, respectively. BL-G and WH-G are black and white glutinous rice, respectively.
Agronomy 14 01383 g006
Figure 7. (AG) Variation of seven differentially accumulated bioactive vitamins in common and glutinous rice. BL-N and WH-N are black and white non-glutinous rice, respectively. BL-G and WH-G are black and white glutinous rice, respectively.
Agronomy 14 01383 g007
Disclaimer/Publisher’s Note: The statements, opinions and data contained in all publications are solely those of the individual author(s) and contributor(s) and not of MDPI and/or the editor(s). MDPI and/or the editor(s) disclaim responsibility for any injury to people or property resulting from any ideas, methods, instructions or products referred to in the content.

