Article

Case Study on the Effects of Sodium Carboxymethyl Cellulose and Biostimulants on Physiological and Photosynthetic Characteristics, Yield, and Quality of Apples

1
Institute of Water Resources and Hydropower, State Key Laboratory of Eco-Hydraulics in Northwest Arid Region of China, Xi’an University of Technology, Xi’an 710048, China
2
Xinjiang Institute of Water Resources and Hydropower Research, Urumqi 830049, China
*
Author to whom correspondence should be addressed.
Agronomy 2024, 14(7), 1403; https://doi.org/10.3390/agronomy14071403
Submission received: 9 May 2024 / Revised: 4 June 2024 / Accepted: 26 June 2024 / Published: 28 June 2024
(This article belongs to the Section Plant-Crop Biology and Biochemistry)

Abstract

:
The problem of poor water and fertilizer retention in sandy soils can lead to physiological growth restriction and yield and quality decline in apples. Sodium carboxymethyl cellulose (CMC) formula can improve the soil structure and increase the water- and fertilizer-holding capacity of the soil, and Biogenic Stimulant (BS) can improve the drought stress resistance of crops and promote the physiological growth of crops. Considering that CMC and BS may improve the physiological characteristics of sandy soil apples, in this study, CMC was coupled with BS in sandy apples, and the effects on the physiological characteristics, yield, and quality of apples were systematically investigated. The results showed that CMC and BS could increase leaf N, P, and K content, with the greatest increases seen in the Y2C2 treatment (9.28, 0.61, and 0.56 g kg−1, respectively) compared with the CK treatment. The SPAD values of leaves following the coupled CMC and BS treatment compared to the CK treatment were elevated in the range of 4.47–24.29% at the flowering and fruiting stage, 2.84–26.50% at fruit expansion stage, and 6.64–19.41% at maturation stage. In the light response data of different treatments, the maximum net photosynthetic rate occurred in the Y2C2 treatment, and the net photosynthetic rate, transpiration rate, and stomatal conductance were all the highest in the Y2C2 treatment during the fruit expansion stage, with the net photosynthetic rate being higher than that of the CK treatment by 5.09 µmol m−2 s−1. The combination treatments of CMC and BS increased apple yield by 10.69 to 27.62% as compared to the CK treatment, and also increased soluble reducing sugar, soluble solids, and VC and reduced the titratable acid content. There was no correlation between the SPAD value during fruit expansion (p > 0.05) and the other physiological indexes (p < 0.05). Through the established functional relationship between the application rate of CMC and BS and apple yield, the recommended BS application rate of 27 kg ha−1 and CMC application rate of 20.625 kg ha−1 could yield up to 43,357.8 kg ha−1.

1. Introduction

China is the largest producer and consumer of apples in the world [1,2], and the apple industry occupies an important position in the development of China’s fruit industry, which has a great impact on the economy of fruit regions, market supply, and export earnings [3]. Among them, not only is Xinjiang region one of the main apple-producing areas in China, but also, the planting area of apples in Xinjiang has increased by more than 6% year by year [4], of which sandy apple planting in Xinjiang accounts for about 20%, but sandy soils with poor water and fertilizer retention [5] can lead to the restriction of the growth and photosynthesis of the fruit trees [6], resulting in low fruit yield and poor quality. Therefore, determining how to promote apple growth and development and resistance through water and fertilizer conservation techniques is a challenge for fruit cultivation in such areas.
Sodium carboxymethyl cellulose (CMC) is an important water-soluble cellulose derivative with good hygroscopicity, is easily soluble in water, and forms a transparent viscous solution after dissolution, which can cause soil particles to form agglomerates in sandy soils and can have a good water retention effect. Currently, some studies have shown that the application of CMC to sandy loam can significantly reduce the water absorption and water infiltration of sandy loam, and can be used as a suitable water retention agent for sandy loam [7] to achieve the effect of sand fixation and water retention, and to improve the content of soil nitrate nitrogen and effective phosphorus [8,9].
Biogenic Stimulant (BS) is a foliar fertilizer composed of a variety of natural or biotechnologically modified substances; it is not a traditional fertilizer or pesticide, and does not provide plants with essential nutrients, but rather, activates the plant’s physiological mechanisms to enhance the nutrient uptake of the plant, stimulate the growth characteristics of the crop, and enhance the crop’s resistance [10]. With the development of their processing technology, BS-based products, mainly microbial fermentation products, protein hydrolysis products, algal plant extracts, humic acids, and amino acids, have been rapidly developed and have been used to improve the efficiency of resource utilization [11,12] and enhance the quality of agricultural products [13,14], crop resilience [15,16], etc., and can either be applied via the roots or via foliar spraying without a negative impact on the environment [17,18]. In recent years, BS has been successfully applied to crops such as wheat [19], soybean [20], corn [21], and cabbage [22]. However, fewer studies have been reported on the application of BS to fruit trees, especially since the mechanism of promoting growth in sandy apples is not clear.
Foliar fertilizer is one of the most important ways to supplement nutrients in fruit trees using cell division, expansion, and shortening of the growth cycle, thus increasing fruit yield and improving fruit quality [23,24]. The main contributors to apple sweetness are aldehydes [25], and BS has a higher content of apple esters compared to ordinary amino acid foliar fertilizers and 15 more apple flavor substances than ordinary foliar fertilizers [26]. However, the effect of BS on the physiology of fruit trees is still unclear, especially in the cultivation of sandy apples, and the range of its application rate still needs to be further studied.
Therefore, this study was conducted to investigate the effects of CMC and BS on N, P, K, SPAD, the photosynthetic characteristics of apple leaves, yield, soluble solids, titratable acid, soluble reducing sugar, and VC in a coupled trial in a sandy soil apple orchard in Alar City, Xinjiang, to explore the ways to increase the yield and improve the quality of apples, and to reveal the thresholds of BS and CMC application for optimal yield and quality, so as to provide a reference basis for planting sandy soil apples. This study will provide a reference basis for apple cultivation in sandy soil.

2. Materials and Methods

2.1. Overview of the Experimental Area

The experimental field is located in the 10th Regiment of Alar City, the 1st Division of Xinjiang Production and Construction Corps, China (40°39′ N, 81°16′ E). The experimental site is located in a typical inland extreme arid climate zone, with a multi-year average temperature of 11 ± 1 °C, annual rainfall of about 50 mm, annual evapotranspiration of up to 2100 mm or so, annual total solar radiation of 552.73 kJ cm−2, total annual sunshine hours of about 2900 h, and a frost-free period of more than 200 d. The soil water-holding capacity of the field at 0–120 cm is 18.5% (volume). The average bulk weight of the soil is 1.51 g cm−3, the water table is around 3.0 m, the soil texture is sandy, and the bulk weights and particle compositions of different soil layers are shown in Table 1.

2.2. Experimental Design

The experiment was carried out in April–August 2023. The fruit tree variety was 9-year-old Royal Gala, the fruit tree planting spacing was 1 m × 4 m, and the main fruit planting mode was adopted. The drip irrigation pipe arrangement was 1 row of double pipes, to prevent the removal of orchard grass from destroying the drip irrigation pipe; the drip irrigation pipes were set up to the left and right every 30 cm along the tree rows at a distance of 50 cm from the ground through bamboo poles; the flow rate of the drip head was 4 L h−1; and the spacing of the drip head was 50 cm. The specific arrangement is shown in Figure 1 below. Apple fertility stage can be divided into three cycles: the flowering and fruiting stage (10 April to 7 May), the fruit expansion stage (8 May to 31 July), and the maturation stage (31 July to 20 August).
The experiment was conducted under the same irrigation and fertilization conditions, with a total of 32 irrigations and 32 fertilizer applications during the whole life cycle, with an irrigation quota of 550 mm. The soil conditioner was sodium carboxymethyl cellulose (CMC), with three gradients (C1 (12 kg ha−1), C2 (24 kg ha−1), and C3 (36 kg ha−1)) designed. The crop Biogenic Stimulant was based on a self-developed BS (Table 2 for BS components, physical and chemical properties, and functions), and three gradients were designed (Y1 (15 kg ha−1), Y2 (22.5 kg ha−1), and Y3 (30 kg ha−1)). A total of 9 treatments were designed using the full combination of CMC and BS, in addition to one control treatment (CK) without CMC and BS application. Each treatment covered an area of 0.08 ha, and the total experimental area of the 10 treatments was 0.8 ha. Four rows of trees were used for each treatment, with 1 row being 50 m long (trees spaced 1 m apart and 4 m apart in rows), and there were 200 sample trees for each treatment. At the beginning of the reproductive period, a furrow was applied by digging a trench of 40 cm in length and width and 20 cm in depth at 40 cm from the root of the tree on a single side, and the amendment was applied by mixing it evenly with the soil. At the same time, the BS was applied by drip application with water using a differential pressure fertilizer tank three times during the flowering and fruiting stage, the young fruit stage, and the fruit expansion stage. Nitrogen required during the experiment was provided through urea at 46%, and phosphate and potash fertilizers were selected from potassium dihydrogen phosphate, containing P2O5 ≥ 52% and K2O ≥ 34%, and applied with special ammonium compound fertilizer containing N ≥ 19%, P2O5 ≥ 19%, and K2O ≥ 19%. All treatments had the same irrigation regime, fertilization regime, and level of cultivation management. The specific experimental design is shown in Table 3 below.

2.3. Measurement of Indicators

(1)
Soil bulk density and particle composition
Before the beginning of the apple’s reproductive period, soil profiles were dug in the test area, and samples were taken from the 0–120 cm soil layer (0–20 cm, 0–40 cm, 0–60 cm, 0–80 cm, 0–100 cm, 0–120 cm) using the ring knife method, which was repeated three times for each soil layer to determine the soil bulk density, and the average value of the three bulk densities was taken as the bulk density of that soil layer. A suitable amount of soil sample was taken from each soil layer, and the soil was analyzed by particle size analysis using a Laser particle sizer (Mastersize2000 laser, Malvern Panalytical, Malvern City, UK) particle sizer, and the soil texture of the experimental field was determined according to the international soil texture classification standard by determining the proportion of soil particles in different particle size ranges.
(2)
Measurement of leaf SPAD
In the flowering and fruiting stage (20 April and 3 May), fruit expansion stage (10 June and 15 July), and maturation stage (3 August and 12 August), in each treatment, we randomly selected three fruit trees and used 5 leaves from each for calibration, at noon, using a handheld chlorophyll meter (SPAD-502 Plus, KONICA MINOLTA, Tōkyō, Japan) to determine the SPAD value of the leaves; each leaf was measured five times to take the average value.
(3)
Determination of leaf nitrogen, phosphorus, and potassium content
During fruit expansion (12 July) and maturity (10 August), 10 leaves of the same age were randomly selected for each treatment to be cleaned, allowed to absorb water, killed, dried, and crushed in a digestion oven, and the digested solution was fixed to 100 mL with water and filtered. Nitrogen and phosphorus were determined by a Flow injection analyzer (AA3 continuous flow analyzer, SEAL, Darmstadt, Germany), and potassium was determined by the flame photometric method.
(4)
Measurement of photosynthetic indexes
On the fourth day (4 August) after irrigation during the maturation stage of fruit trees, under sunny conditions, the leaves were measured in the same way as SPAD leaves, and each treatment was repeated three times. A portable photosynthesis system (CIRAS-3, PP SYSTEMS, USA) was used to measure the photosynthetic indexes, such as the net photosynthetic rate, transpiration rate, intercellular carbon dioxide, and stomatal conductance, of the leaves of apple trees from 10:00 to 13:00, and the results were averaged.
During the apple fruit expansion stage (July 15), the portable photosynthesis system (CIRAS-3, PP SYSTEMS, Amesbury, USA) was used to determine the light response curve of apple tree leaves for each treatment, and the light quantum flux density was set at 1800, 1500, 1200, 900, 600, 400, 200, 150, 100, 50, and 0 (μmol m−2 s−1) for 11 gradients, and the net photosynthesis rate was plotted according to the different light quantum flux densities. Light response curves were plotted according to the net photosynthetic rate at different light quantum flux densities, and the apparent quantum efficiency, maximum net photosynthetic rate, light compensation point, light saturation point, and dark respiration rate of the plants under different treatments were determined.
The right-angle hyperbola correction model is shown in the following equation.
P n = α 1 β I 1 + γ I I L C P
P n —apple leaf net photosynthetic rate, μmol m−2 s−1;
α —apparent quantum yield;
I—photon flux density, μmol m−2 s−1;
L C P —light compensation point, μmol m−2 s−1;
β —light suppression coefficient;
γ —coefficients independent of I.
Dark respiration rate R d :
R d = α L C P
R d —dark respiration rate, μmol m−2 s−1.
Light saturation point ( L S P ):
L S P = β + γ 1 + γ L C P / β 1 γ
L S P —light saturation point, μmol m−2 s−1.
Maximum net photosynthetic rate ( P n m a x ):
P n m a x = α 1 β L S P 1 + γ L S P L S P L C P
P n m a x —maximum net photosynthetic rate of apple tree, μmol m−2 s−1.
(5)
Measurement of yield indexes
During the maturation stage (20 August), in each treatment, five sample trees were randomly selected for fruit picking and weighed to find the yield of a single fruit tree, and the yield per hectare was obtained by multiplying the yield of a single fruit tree by the number of fruit trees in 1 hectare.
(6)
Measurement of quality indexes
During the maturation stage (20 August), five sample trees were randomly selected in each treatment, and 10 fruits were randomly picked from the periphery of the canopy. The fruits were crushed and mixed, and the juice was taken to determine the soluble solids using a Soluble Solids Measuring Instrument (WYT-32 hand-held refractometer, Shanghai Leigu Instrument Co., Ltd., Shanghai, China), the titratable acid via NaOH neutralization titration, the soluble reducing sugar via anthrone colorimetry, and the VC via the 2,6-dichloroindophenol sodium method.

2.4. Data Processing

Microsoft Excel 2019 was used to organize the data, Origin2021 was used for plotting and data fitting, and the LSD method in SPSS19.0 was used for significant ANOVA (p < 0.05).

3. Results and Analysis

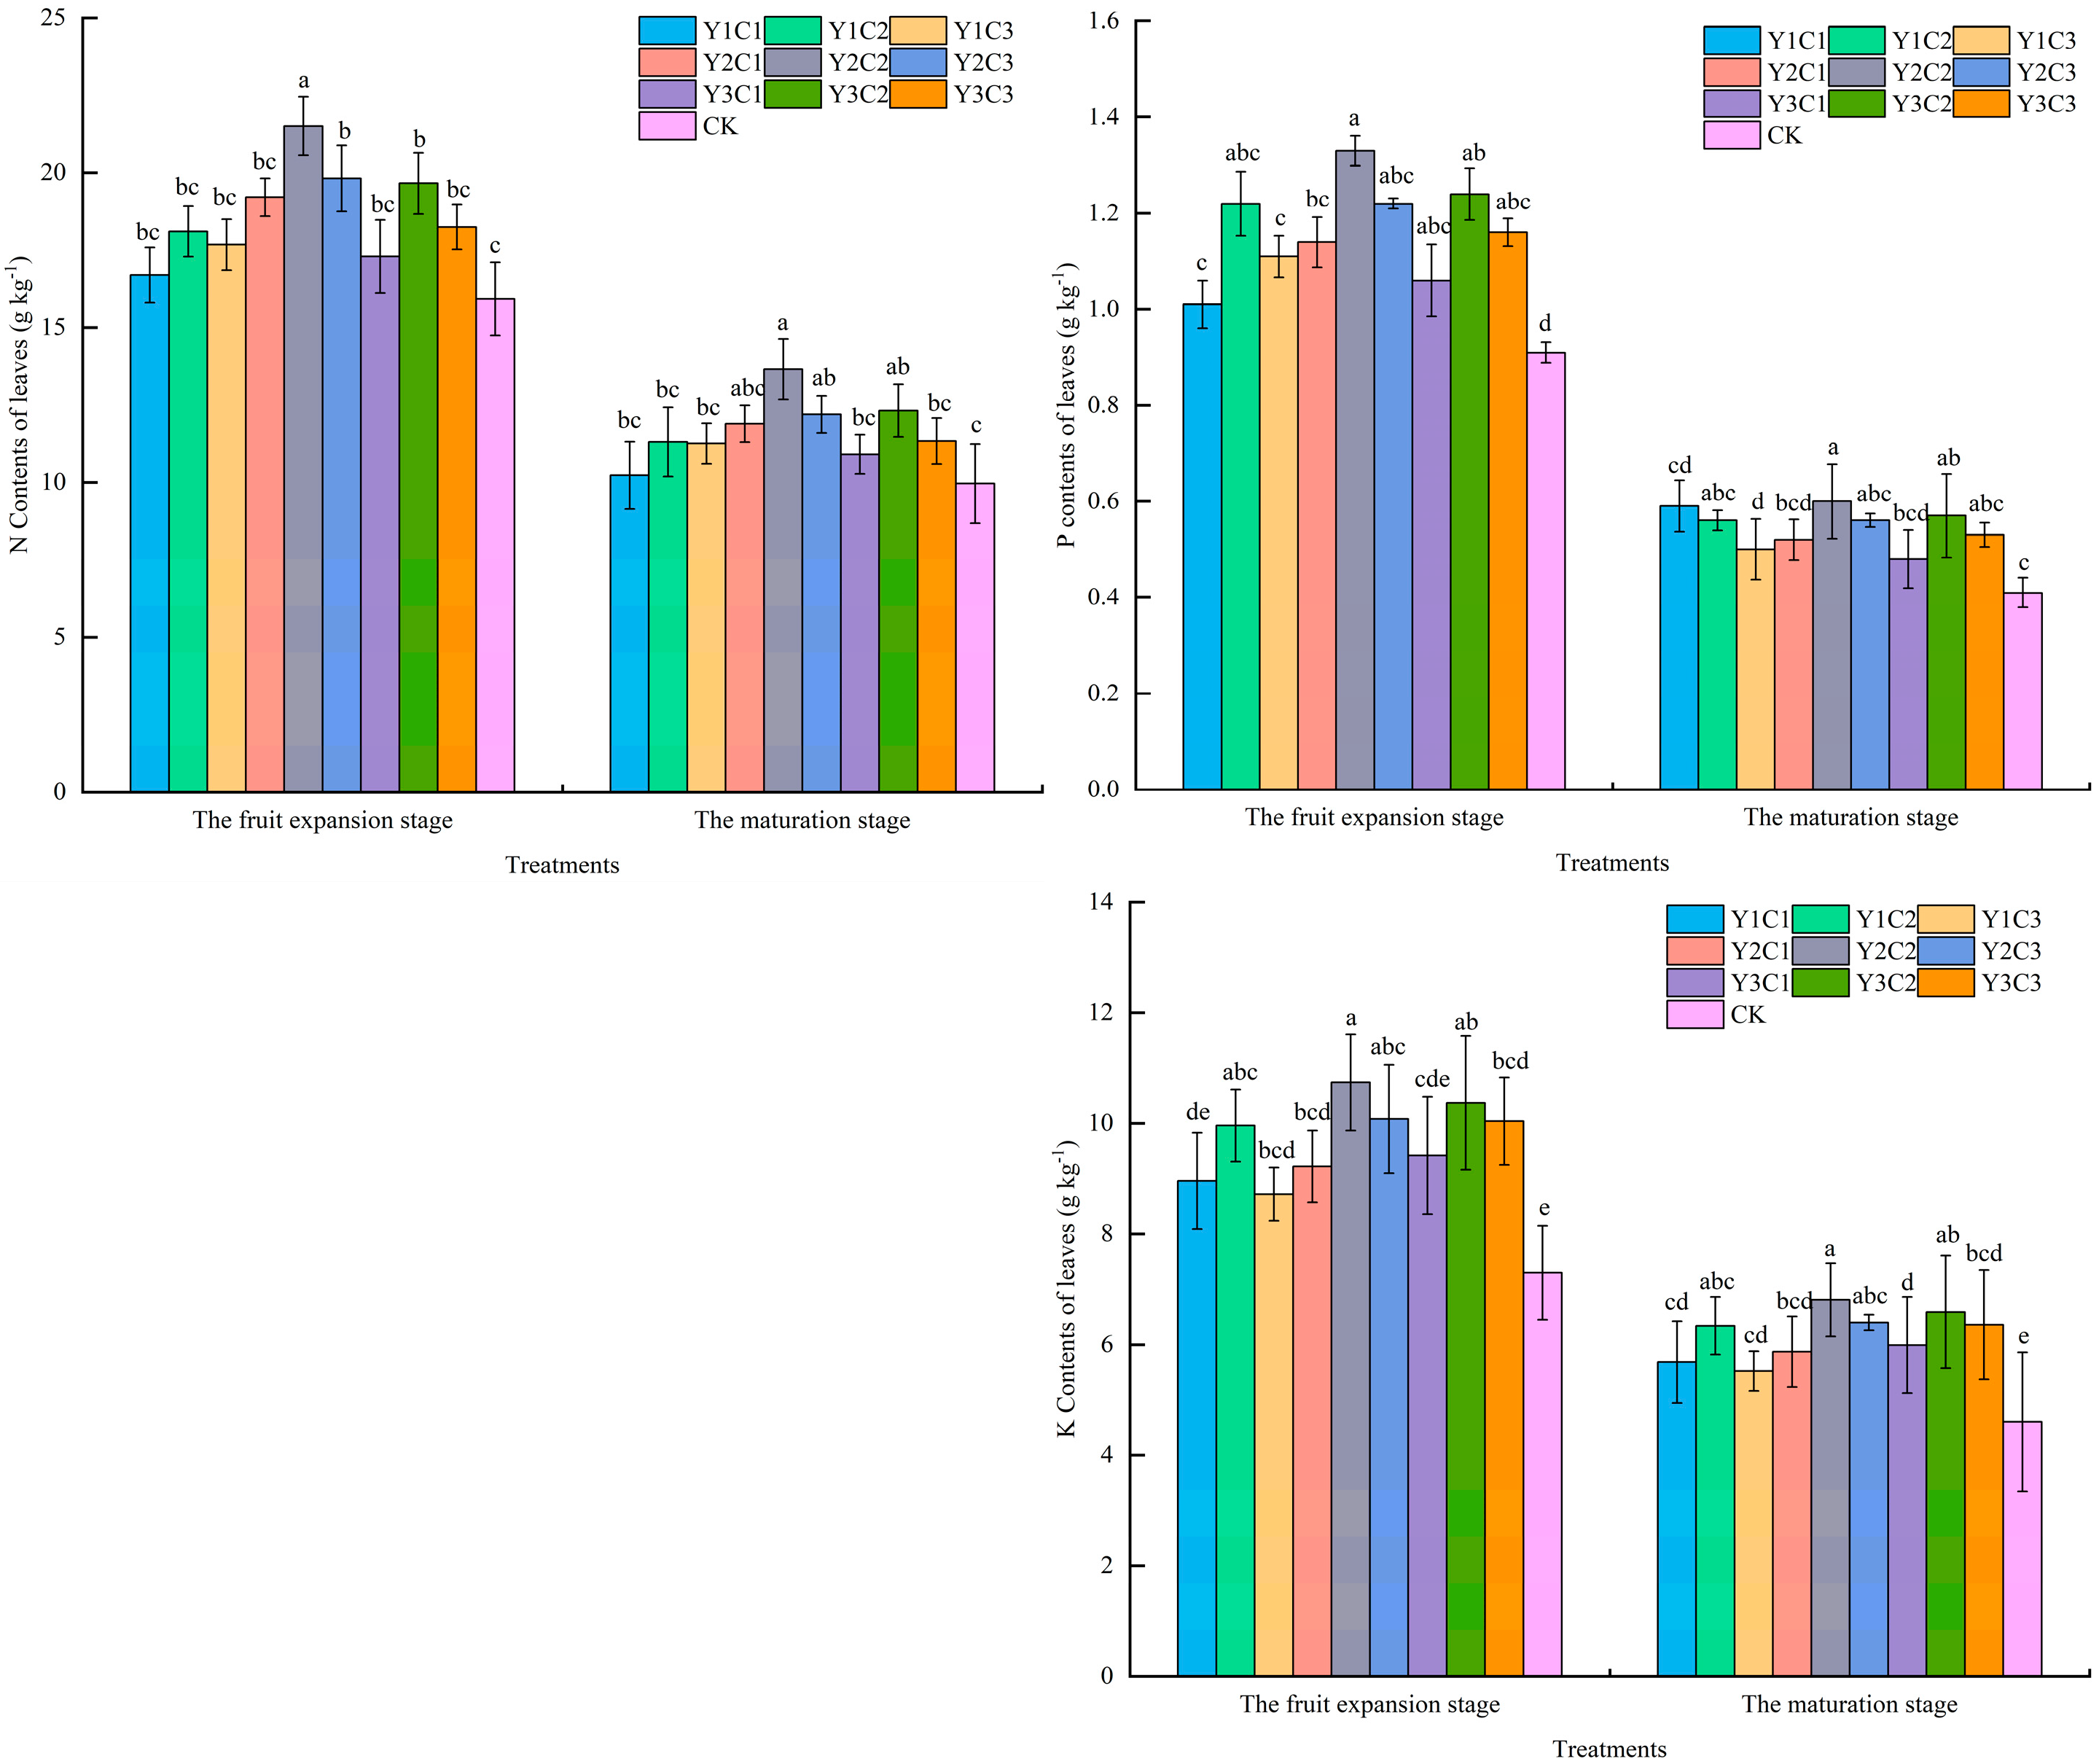
3.1. Apple Leaf Nutrients

The changes in the N, P, and K content of apple leaves in different treatments are shown in Figure 2. There was no interaction between the effects of the CMC and BS treatments on the N, P, and K content of apple leaves (p > 0.05), but there was a single significant effect on leaf N, P, and K content (p < 0.05). The N, P, and K content of leaves in all treatments tended to increase as the apple fertility cycle progressed. Under the same lifetime BS condition, a change trend of first increasing and then decreasing appeared with an increase in CMC application, indicating that too much CMC application would reduce leaf N, P, and K content. Under the same CMC application condition, with an increase in the BS application rate, there was a change trend of increasing and then decreasing, which indicated that there was a quadratic relationship between leaf N, P, and K content and BS application rate, and there was an optimal application threshold. Among all the treatments, the Y2C2 treatment showed the highest leaf N, P, and K content, while the CK treatment showed the lowest leaf N, P, and K content. The leaf N, P, and K contents in the two treatments were significantly different (p < 0.05), with differences of 9.28, 0.61, and 0.56 g kg−1, respectively.

3.2. Apple Leaf SPAD Values

The changes in the SPAD values of apple leaves in different treatments are shown in Figure 3. There was no interaction between the CMC and BS treatments and the SPAD of apple leaves at the flowering and fruiting stage and the maturation stage (p > 0.05), but there was an interaction with the SPAD of leaves at the fruit expansion stage (p < 0.05), which might be because leaves at the flowering and the fruiting stage are small and the uptake of BS was not sufficient, and the SPAD values of leaves at the maturation stage had reached the peak value; thus, the CMC and BS treatments could not further enhance leaf SPAD values. The leaf SPAD of all treatments showed an upward trend with the climacteric period, and there was no downward change in the maturation stage, which was caused by the tree species. The fruit varieties in this study were early-maturing “Gala”, and although it was the maturation stage in August, the trees were still in the state of growth, so the leaf SPAD did not decline. The leaf SPAD of the CMC and BS coupling treatments was significantly higher than that of the CK treatment at different climatic stages (p < 0.05), and the leaf SPAD of Y3C2 was the highest in the flowering and fruiting stage, but the leaf SPAD of the Y2C2 treatment was the largest in the fruit expansion and maturation stages, which indicated that spraying the Y3 concentration of BS treatments was better during the flowering and fruiting stage, but from the viewpoint of the long-term effect, spraying the Y3 concentration of BS treatments was better. At the flowering and fruiting stage, there was no significant difference in leaf SPAD between the Y1 treatments (C1, C2, and C3 treatments) (p > 0.05), a significant difference in leaf SPAD between the Y2 treatments (p < 0.05), and a partially significant difference in SPAD between the Y3 treatments, which indicated that both the Y1 and Y2 concentrations of BS treatments were not as effective as the Y2 concentration of BS treatments. As fertility progressed, the differences between treatments with the same BS application rate were not significant. This indicated that the enhancement of the leaf SPAD of apple trees by CMC and BS application was not linear, but showed a pattern of change with the amount of application firstly increasing and then decreasing. The overall performance of the coupled CMC and BS treatment in comparison to the CK treatment in terms of leaf SPAD value enhancement ranged from 4.47 to 24.29% at the flowering and fruiting stage, 2.84 to 26.50% at the fruit expansion stage, and 6.64 to 19.41% at the maturation stage.

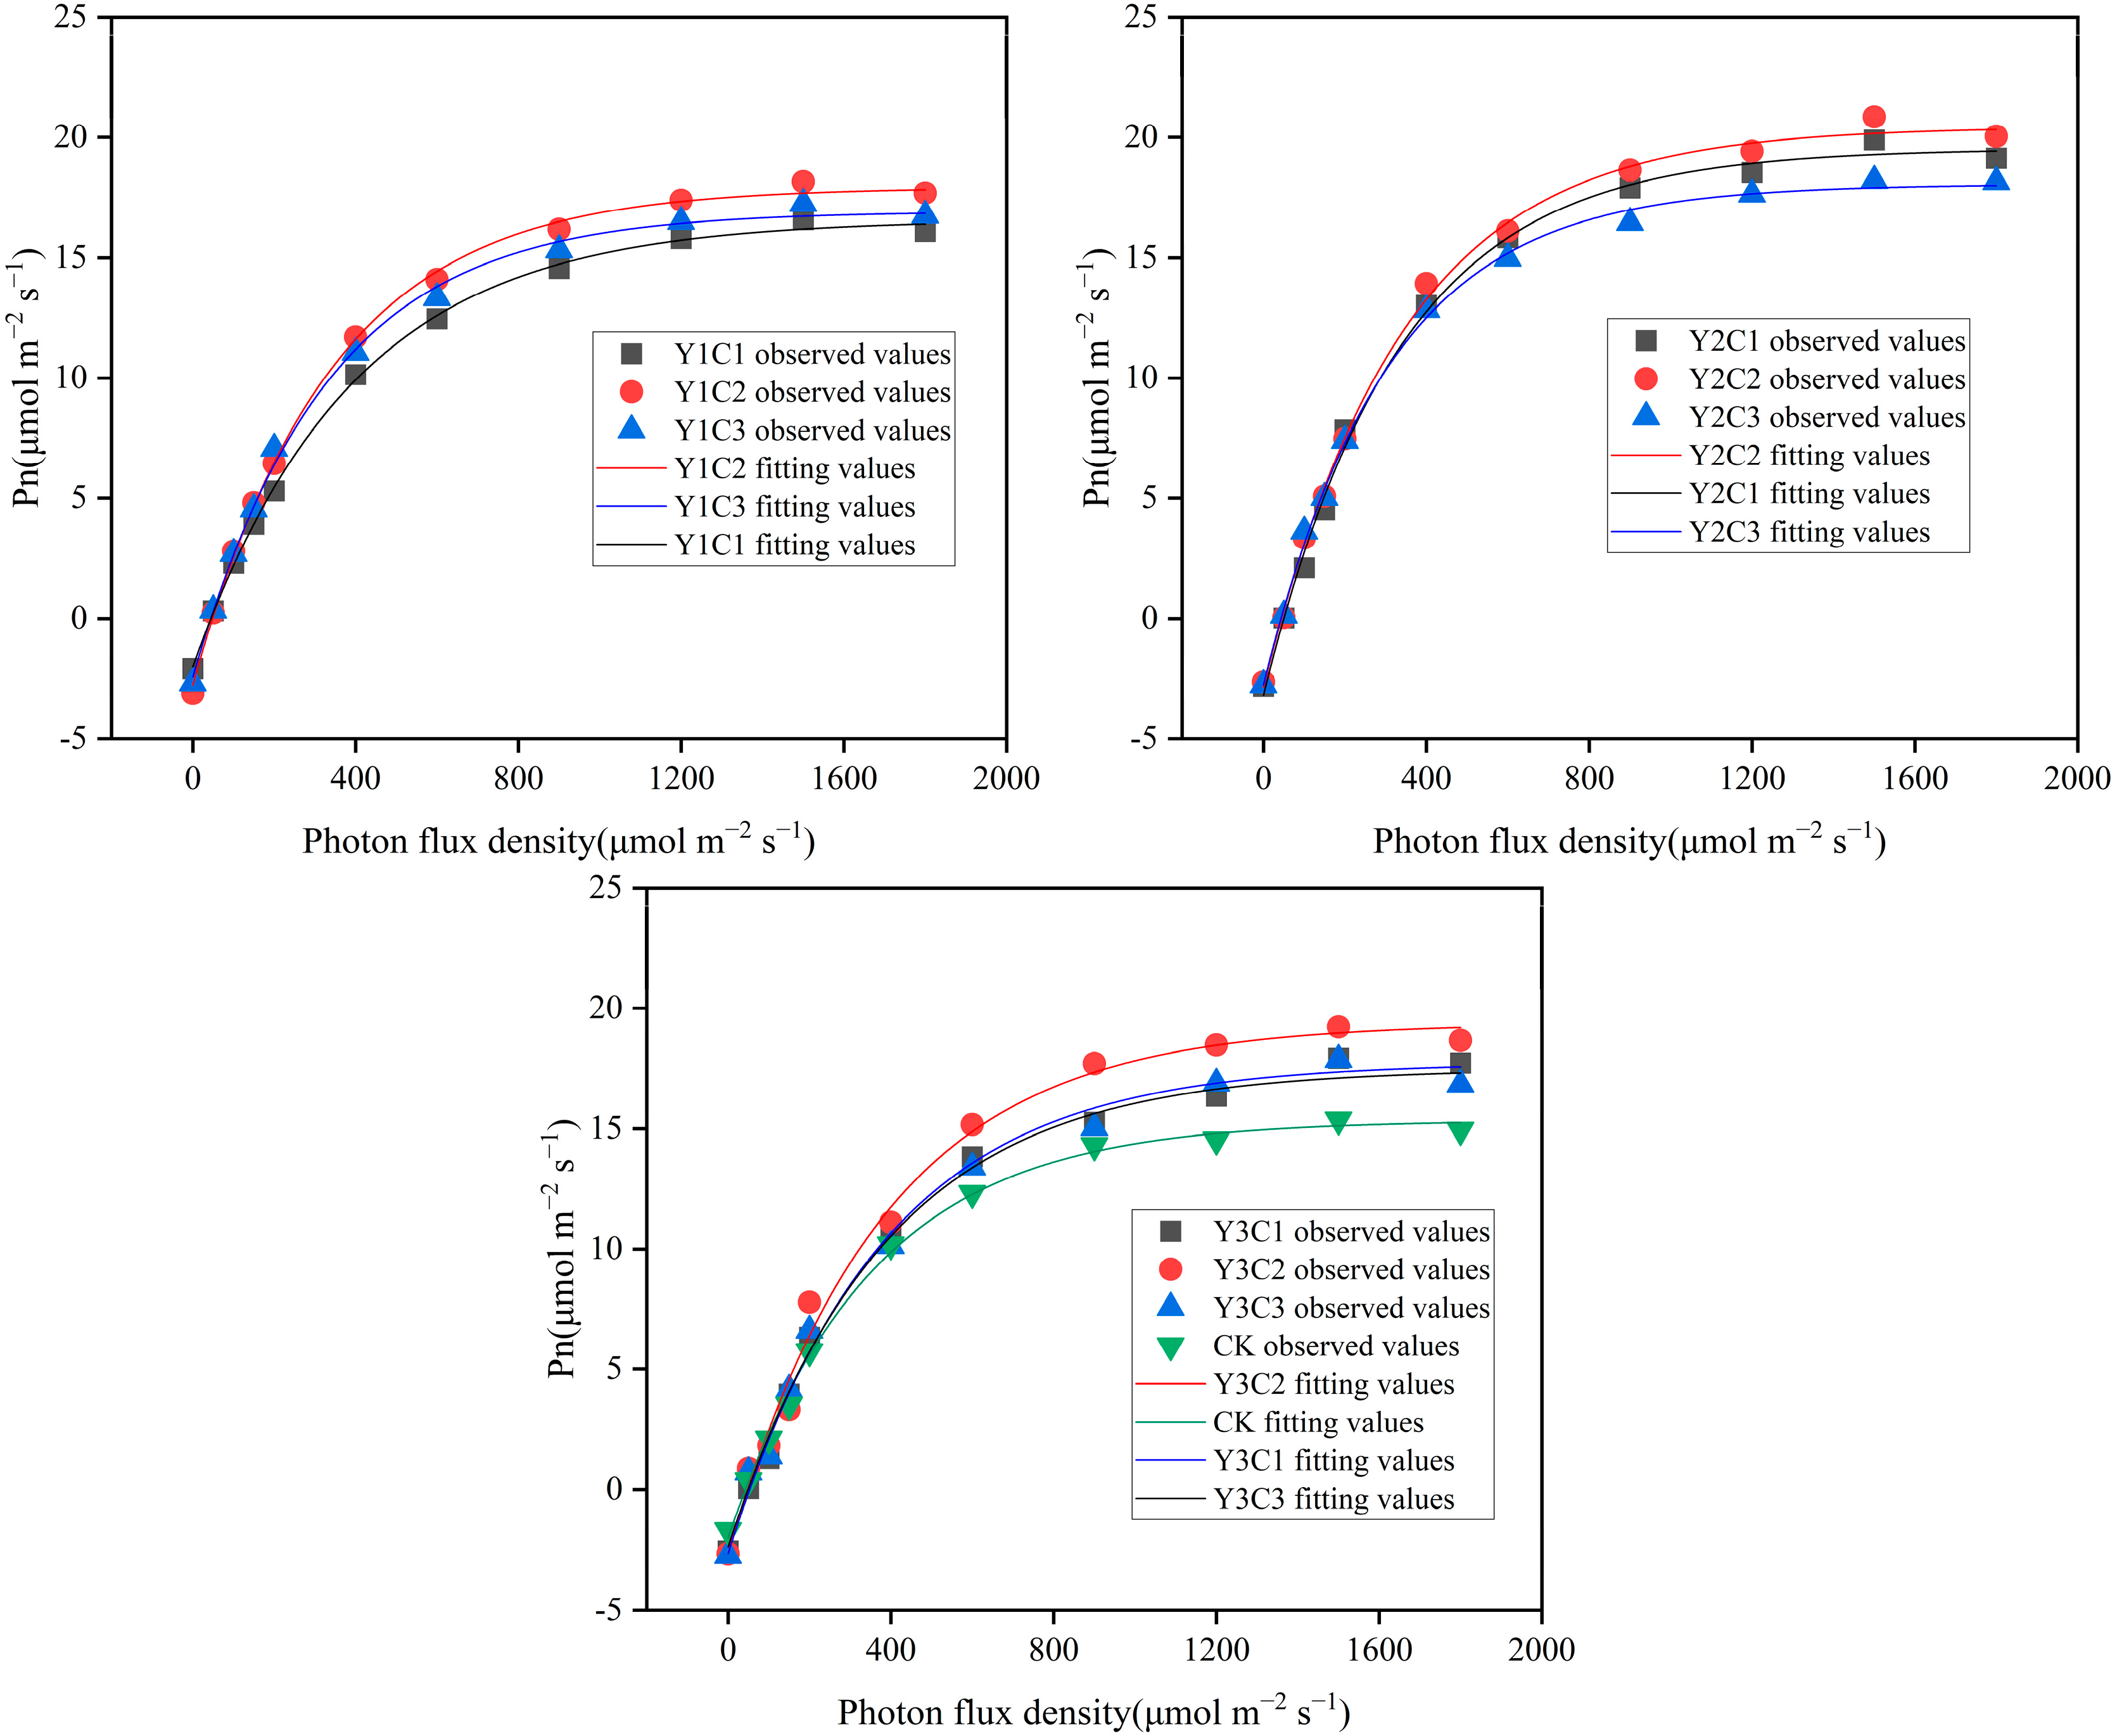
3.3. Apple Light Response Curves

The light response curves of different treatments are shown in Figure 4, and the right-angle hyperbola correction model was used to fit the net photosynthetic rate of the apple to the photon flux density. The fit was high, and the net photosynthetic rate of the apple in all treatments showed the same trend regarding the change in photon flux density, which showed a trend of increasing first and then tending to level off. The net photosynthetic rate at the highest point of light response (at a light intensity of 1500 µmol m−2 s−1) of all treatments was the highest in the Y2C2 treatment and the smallest in the CK treatment.
The results of photosynthetic apparent quantum efficiency α, light compensation point (LCP), light saturation point (LSP), and dark respiration rate (Rd) in different treatments were calculated by the right-angle hyperbola correction model, as shown in Table 4. When the same amount of BS was applied (taking the Y2 treatment as an example), the α of different treatments showed that the Y2C3 treatment was the largest and the Y2C1 treatment was the smallest. When the same amount of CMC was applied (taking the C2 treatment as an example), the α of different treatments showed that the Y2C2 treatment was the largest and the Y3C2 treatment was the smallest. LCP showed a pattern of first increasing and then decreasing with increasing amounts of CMC and BS treatments. LCP showed a pattern of first increasing and then decreasing with an increase in CMC and BS application. The LSP values of different treatments showed that the Y3C1 treatment was the largest and the CK treatment was the smallest. The range of available light intensity was the difference between the light saturation point and light compensation point, and the available light intensity under each treatment ranged from 1372.30 to 1823.18 µmol m−2 s−1, with the maximum value occurring for the Y3C1 treatment, which was significantly increased by 32.86% compared with that of the CK treatment. Rd increased in different treatments compared to the CK treatment, with the Y2C1 treatment being the largest, with an increase of 1.272 µmol m−2 s−1 compared to the CK treatment, and the Y1C1 treatment being the smallest, with an increase of 0.205 µmol m−2 s−1 compared to the CK treatment. The net photosynthetic rates of the CMC and BS treatments were greater than that of the CK treatment, with the largest value of net photosynthetic rate in the Y2C2 treatment, and the largest value in the Y1C1 treatment. The Y1C1 treatment had the smallest net photosynthetic rate value.

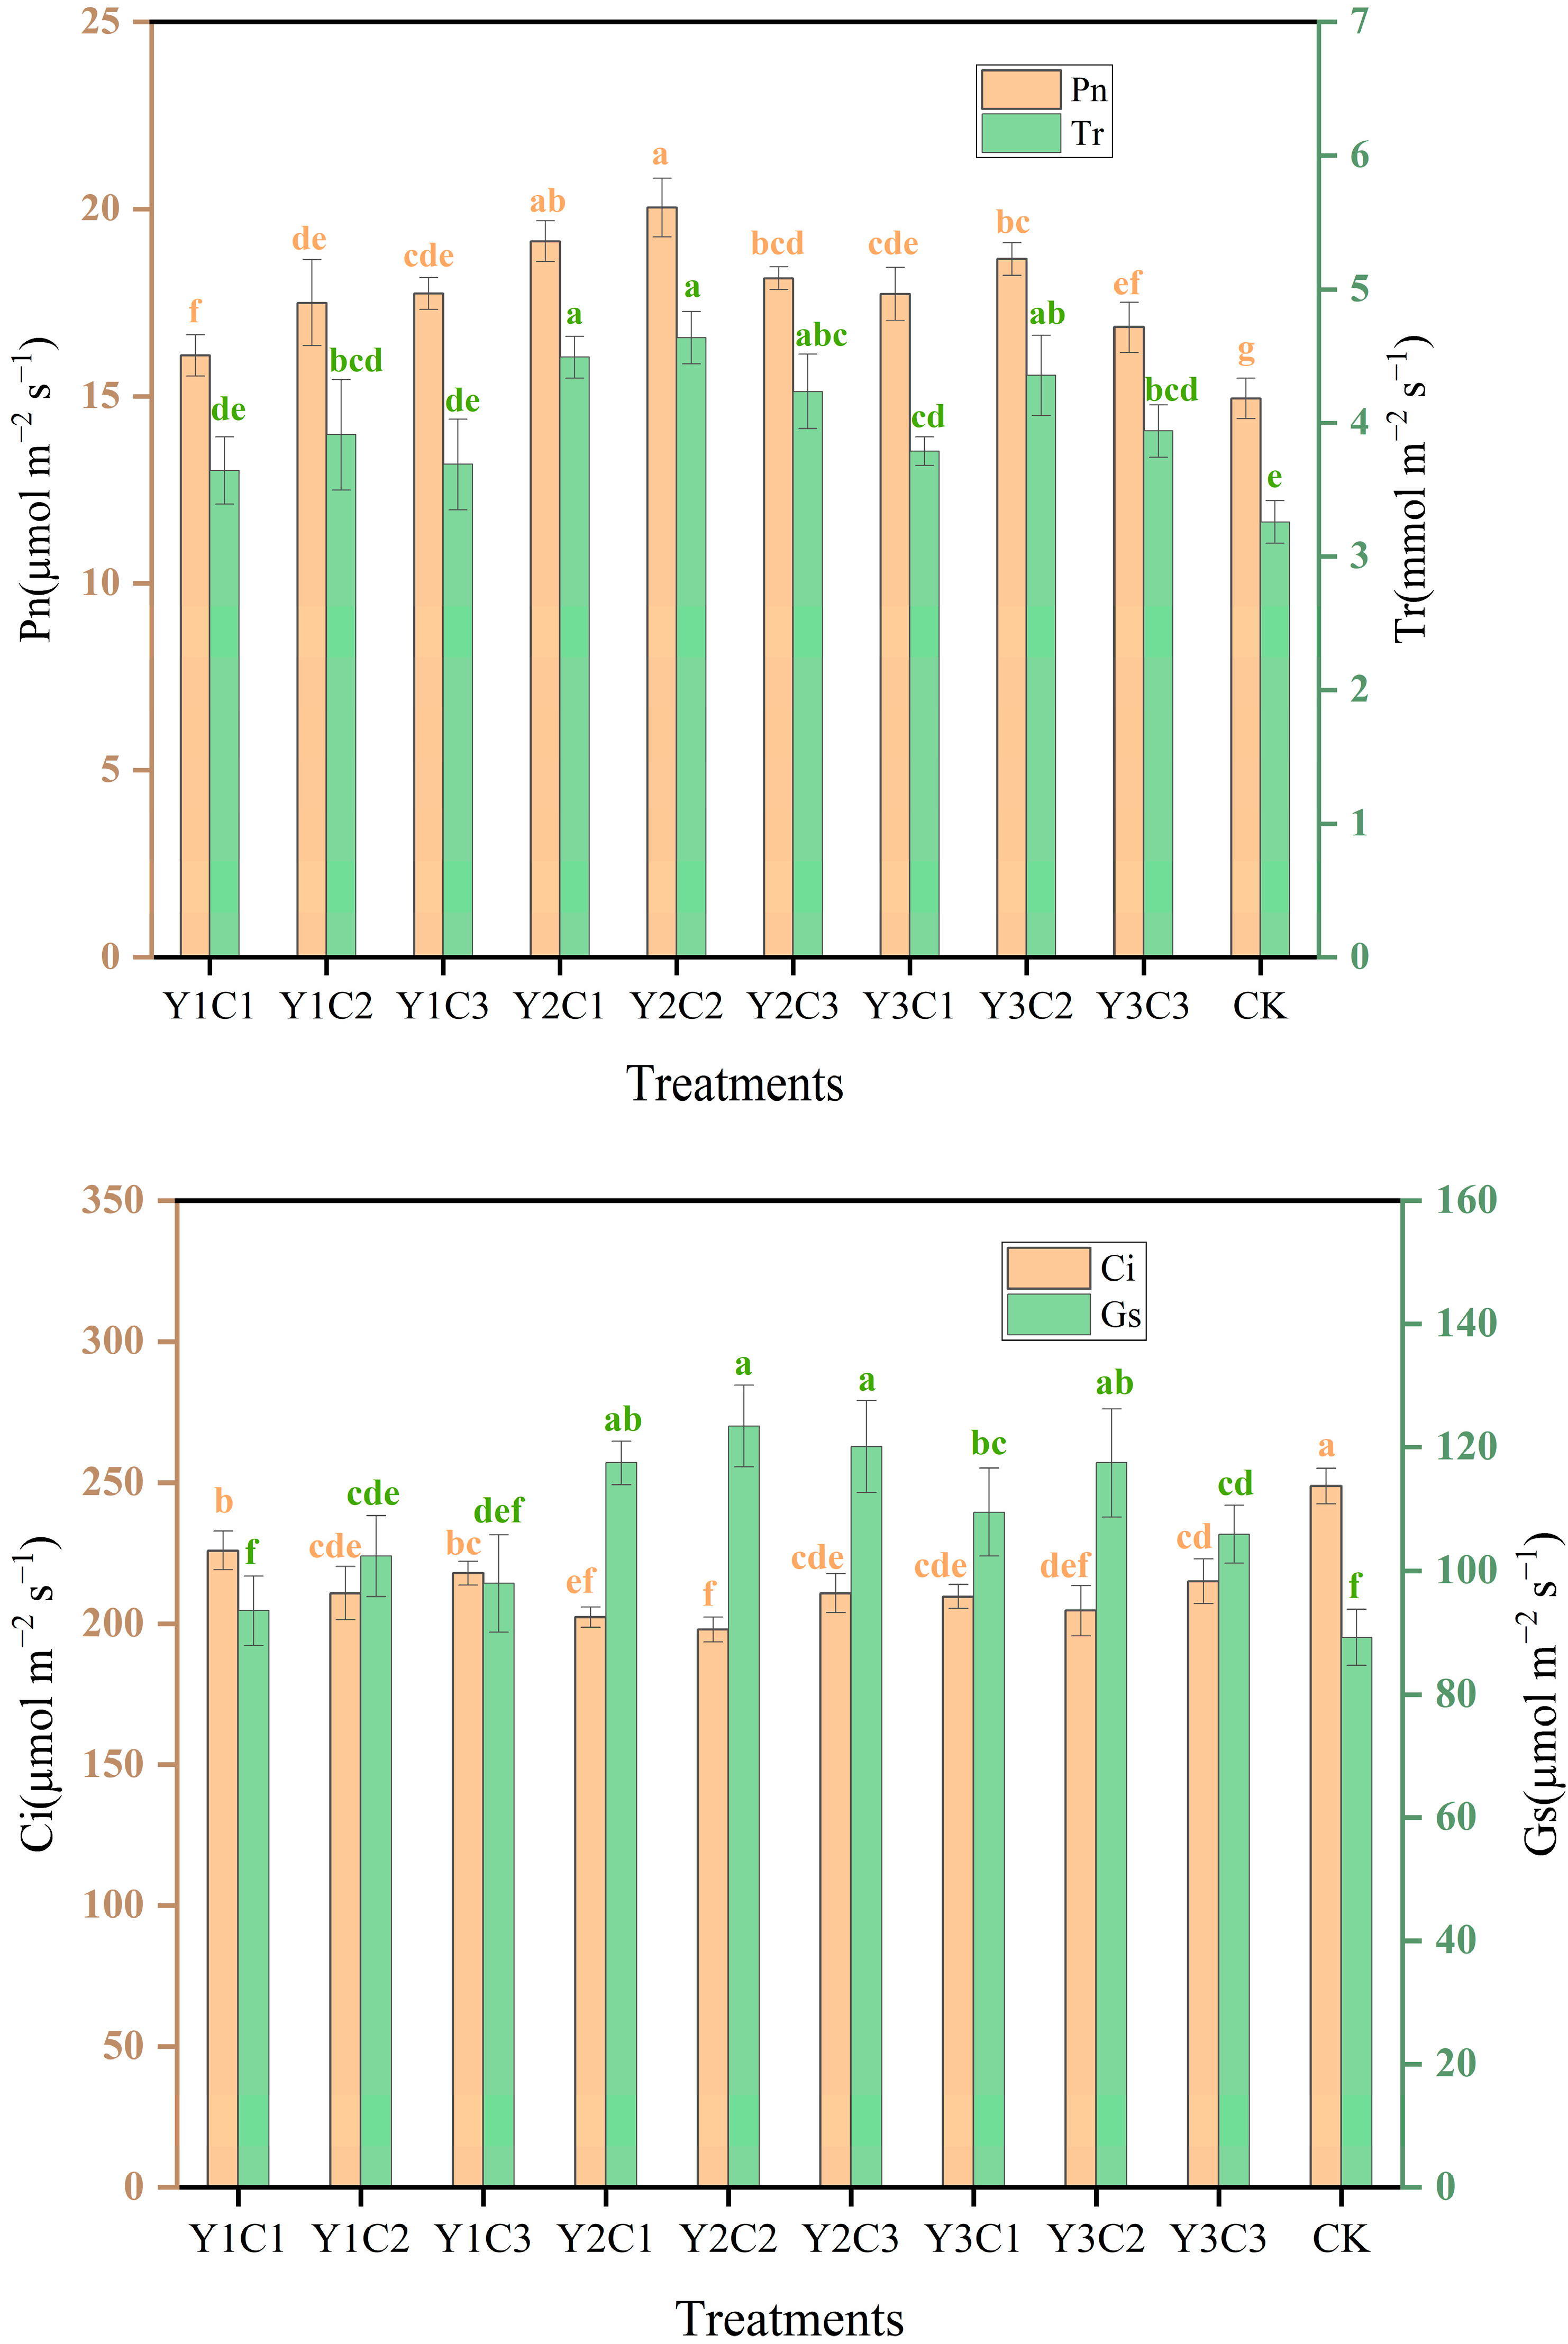
3.4. Photosynthetic Characteristics of Apple Leaves

The net photosynthetic rate (Pn), transpiration rate (Tr), stomatal conductance, and intercellular CO2 concentration of apple leaves in different treatments are shown in Figure 5. The net photosynthetic rate (with an interaction and a significant effect of one factor on the net photosynthetic rate), transpiration rate (no interaction and a significant effect of one factor on the transpiration rate), and stomatal conductance (without an interaction and a significant effect of one factor on the transpiration rate) of the coupled BS and CMC treatment were higher than those of the CK treatment. When the same amount of BS was applied (Y2 treatment, for example), the net photosynthetic rate, transpiration rate, and stomatal conductance were the largest in the Y2C2 treatment and the smallest in the Y2C3 treatment. When the same amount of CMC was applied (C2 treatment, for example), the net photosynthetic rate, transpiration rate, and stomatal conductance were the largest in the Y2C2 treatment and the smallest in the Y1C2 treatment, the net photosynthetic rate, transpiration rate, and stomatal conductance showed an increase and then a decrease in the net photosynthetic rate, transpiration rate, and stomatal conductance with increasing amounts of the BS and CMC treatments. The net photosynthetic rate and stomatal conductance increased with the application of the BS and CMC treatments. Among all the treatments, the net photosynthetic rate, transpiration rate, and stomatal conductance of the Y2C2 treatment were the largest, in which the net photosynthetic rate was higher than that of the CK treatment by 5.09 µmol m−2 s−1, transpiration rate was higher than that of the CK treatment by 1.38 mmol m−2 s−1, and stomatal conductance was higher than that of the CK treatment by 34.19 µmol m−2 s−1. The intercellular CO2 concentrations of all the treatments were similar to the net photosynthetic rate and transpiration rate of the Y1C2 treatment, and the net photosynthetic rate, transpiration rate, and stomatal conductance showed the opposite change characteristics.

3.5. Apple Yield and Quality

The yields and quality of different treatments are shown in Table 5. The yields of both the BS and CMC coupling treatments were significantly different (p < 0.05) from the CK treatment, but the differences in yields between the BS and CMC coupling treatments were not significant (p > 0.05), and among all the treatments, the highest yield was obtained from the Y2C2 treatment, with a yield enhancement of 27.62% compared to the CK treatment, and the yield of the Y1C1 yield enhancement was small, 10.69% higher than that of the CK treatment. The range of apple yield enhancement by the coupled BS and CMC treatment was 10.69–27.62%.
The quality of all treatments increased with an increase in BS and CMC application and then decreased. Among the coupled treatment of BS and CMC, the contents of reducing sugar, soluble solids, and VC in the Y2C2 treatment were the highest and were significantly different from those in the CK treatment (p < 0.05), and were 20.47%, 20.59%, and 25.37% higher than those in the CK treatment; the lowest reducing sugar was in the Y1C1 treatment, and was 10.69% higher than in the CK treatment; and the lowest reducing sugar was in the Y1C1 treatment, and was 10.69% lower than in the CK treatment. Reducing sugars were the lowest in Y1C3 treatment, and were 3.14% higher than in the CK treatment; soluble solids were the lowest in the Y1C1 treatment, and were 6.66% higher than in the CK treatment; and vitamin C was the lowest in the Y1C3 treatment, and was 4.60% lower than in the CK treatment.

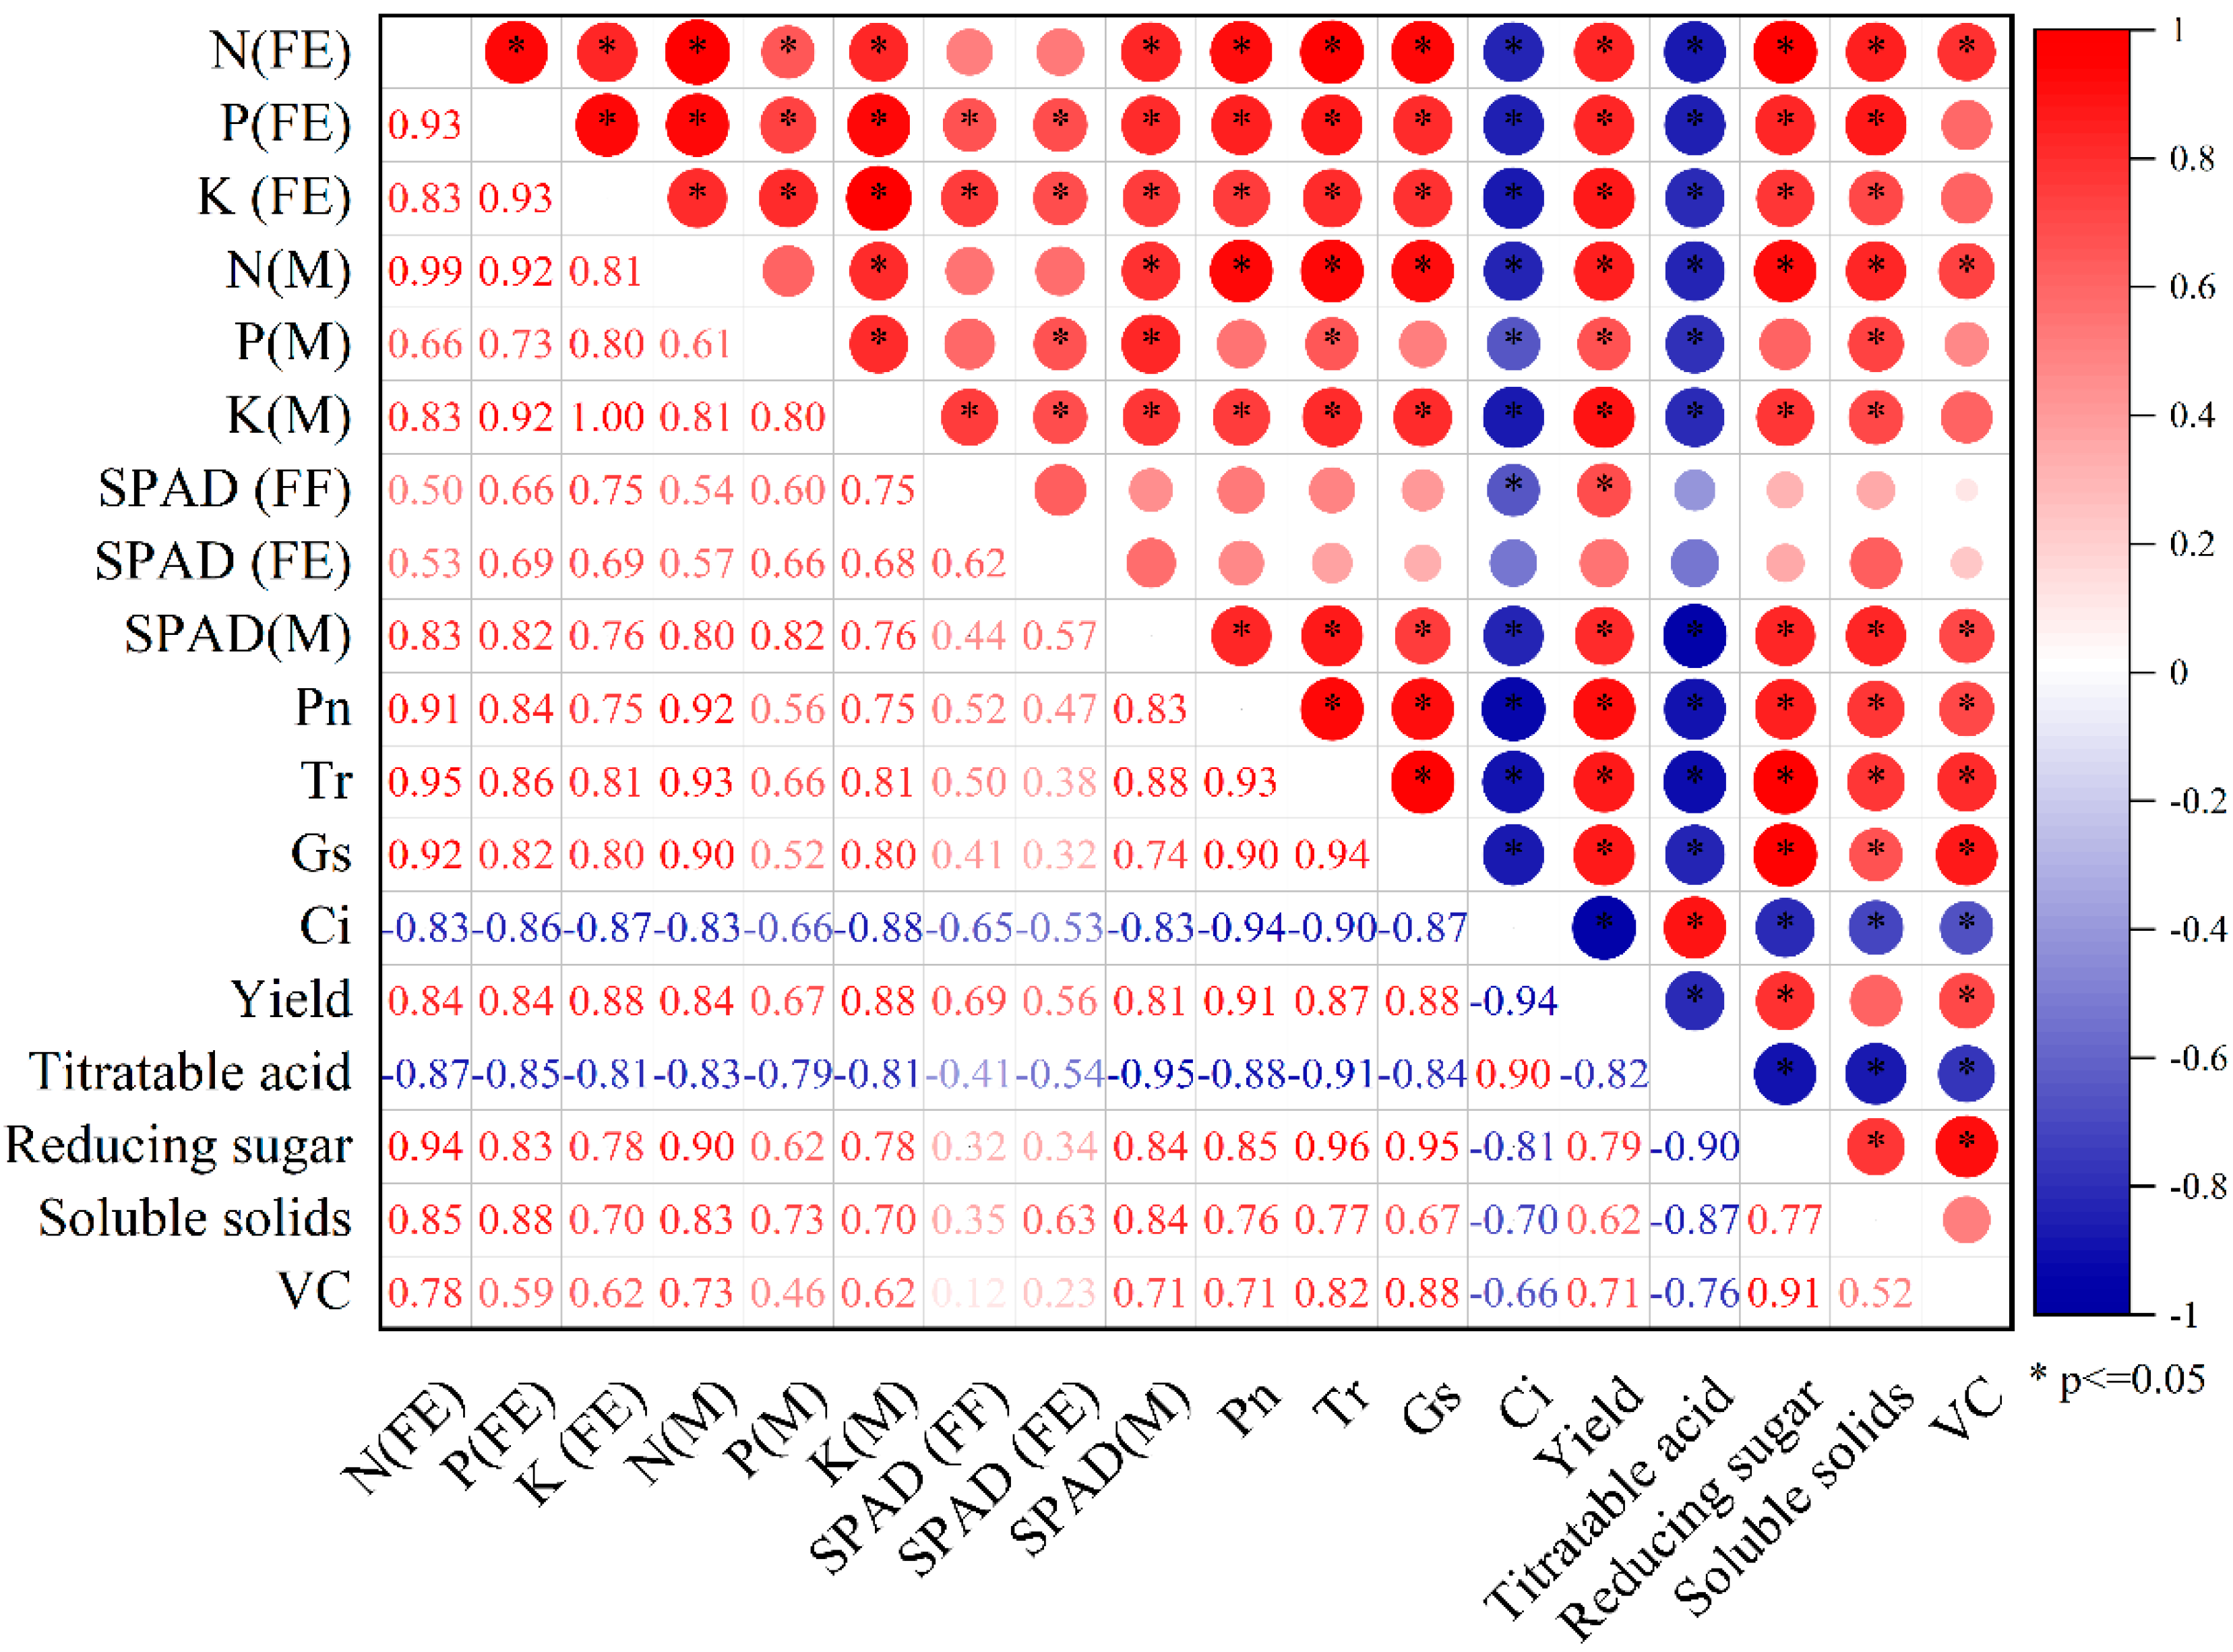
3.6. Correlation Analysis of Apple Yield and Quality with Physiological Indicators

Upon analyzing the correlation between different physiological indexes and yield and quality indexes of apples, as shown in Figure 6, except for the non-significant correlation between yield and SPAD at the fruit expansion stage (p > 0.05), yield showed a significant correlation with all other indexes (p < 0.05), and had the highest positive correlation with net photosynthesis rate, and the highest negative correlation with intercellular CO2 concentration. Net photosynthetic rate showed a significant correlation with SPAD at maturity, and the correlation coefficient was the largest. SPAD at the ripening stage was significantly correlated with leaf nitrogen, phosphorus, and potassium content at the fruit expansion and maturation stages. This indicates that higher leaf N, P, and K content promotes the growth of the leaf SPAD value, resulting in an increase in leaf net photosynthetic rate and the enhancement of apple yield. SPAD and titratable acid at the maturation stage showed a significant negative correlation and correlation coefficient; leaf K content at the fruit expansion stage showed a significant correlation with soluble reducing sugar content, and the correlation coefficient was the highest; leaf P content at the fruit expansion stage had the highest correlation with soluble solids; and leaf K content at the fruit expansion stage had the highest correlation with VC.

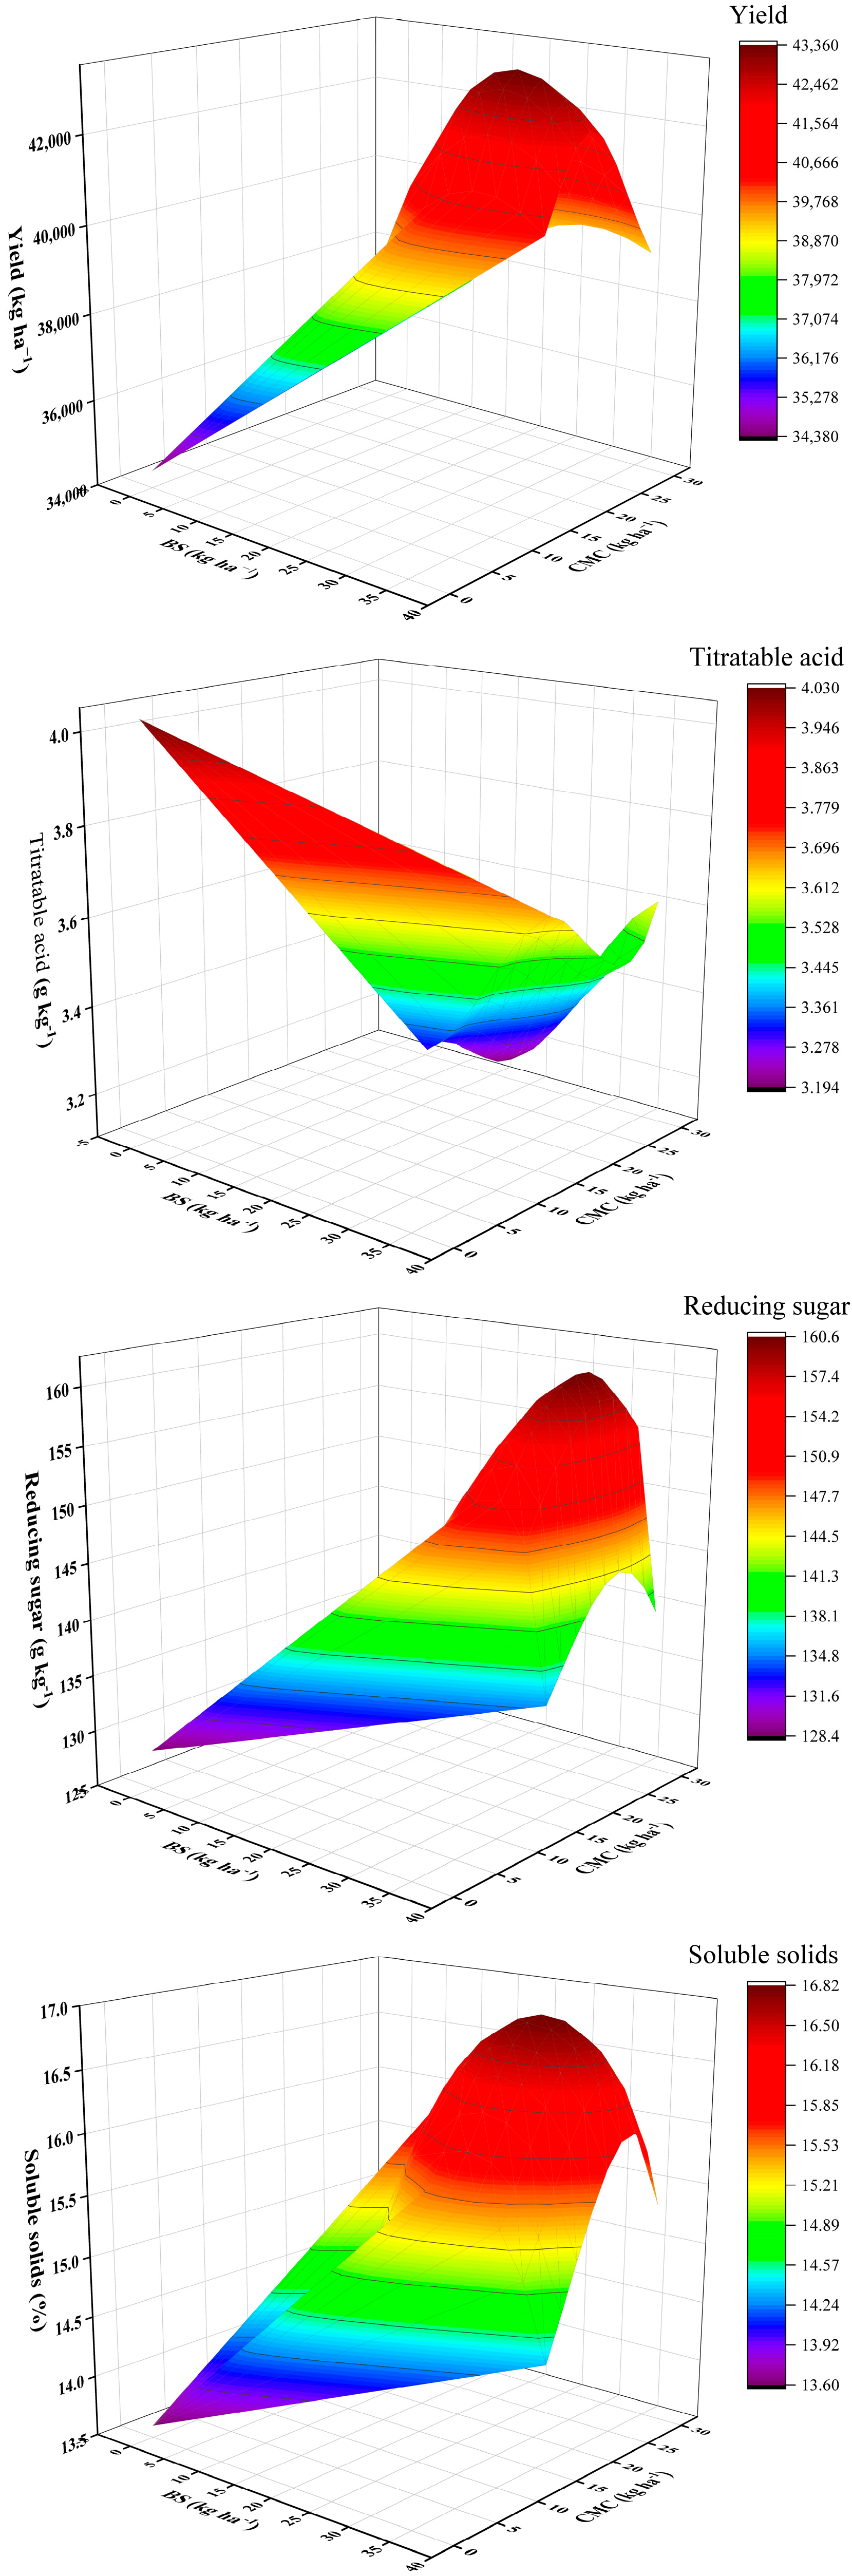
3.7. Functional Relationship between the Optimal Application Rate of BS and CMC and Yield and Quality Indexes

For determining the relationship between the optimal coupled BS and CMC application amount and yield, titratable acid, reducing sugar, soluble solids, and VC were assessed, as in Figure 7. By taking the extremes of the functional equation, we obtained the optimum amount of BS and CMC to be applied for optimum yield, and the functional expression is shown in the following equation:
Y = 34,399.63 + 219.33 x 2.48 x 2 3122.92 y + 77.75 y 2 1 + 0.00197 x 0.088 y + 0.00218 y 2   R 2 = 0.98
A = 4.03 181.83 x + 7.37 x 2 0.085 x 3 + 325.25 y 6.97 y 2 1 + 3.29 x + 23.88 y + 1.62 y 2 0.059 y 3   R 2 = 0.99
S = 128.43 + 6514.72 x 40.72 x 2 2.47 x 3 3504.4 y + 63.72 y 2 1 + 62.79 x 1.32 x 2 31.55 y + 0.59 y 2   R 2 = 0.99
Z = 13.6 + 7.55 x 0.175 x 2 1.16 y + 0.25 y 2 0.0065 y 3 1 + 0.35 x 0.0084 x 2 + 0.27 y 0.0067 y 2   R 2 = 0.98
V = 11.51 0.058 x + 0.02 x 2 0.0004 x 3 0.2002 y 0.0024 y 2 1 + 0.0097 x 0.022 y   R 2 = 0.99
where x is the BS application rate, kg ha−1; y is the CMC application rate, kg ha−1; Y is the yield, kg ha−1; A is the titratable acid content, g kg−1; S is the soluble reducing sugar content, g kg−1; Z is the soluble solids content, %; and V is the VC content, mg kg−1.
The relationship between BS and CMC application and apple yield and quality is shown in Figure 7. Apple yield, soluble reducing sugar, soluble solids, and vitamin C showed an increasing and then decreasing trend with the application of BS and CMC, and apple titratable acid showed a decreasing and then increasing pattern with the application of BS and CMC. The fitted regression equations were used to calculate the first-order partial derivatives, and then, the system of equations with partial derivatives equal to zero was solved to find the extreme points, and finally, the second-order partial derivatives were calculated and utilized to determine the extreme values of the functions at these points to obtain the CMC and BS application rates that maximized the yield and quality of the apples. The maximum yield was 43,357.8 kg ha−1 for a BS application rate of 27 kg ha−1 and a CMC application rate of 20.625 kg ha−1, VC content up to 14.26 mg kg−1 at 27.1 kg ha−1 BS and 24.375 kg ha−1 CMC, reducing sugars up to 160.59 g kg−1 at 30.4 kg ha−1 BS and 24.375 kg ha−1 CMC, and soluble reducing sugars up to 2.5 g kg−1 at 24.3 kg ha−1 BS and 26.25 kg ha−1 CMC. The soluble solids content was as high as 16.82% at 24.3 kg ha−1 of BS and 26.25 kg ha−1 of CMC and decreased to 16.82% at 21 kg ha−1 of BS and 26.25 kg ha−1 of CMC.

4. Discussion

(1)
The mechanism of BS and CMC in improving soil
Soil is the foundation of plant growth, and the water-holding and fertilizing properties of soil will directly affect the growth of crops Sandy soils have poor water and fertilizer retention, and require high drought and resilience for apples, so this study was carried out using a coupled treatment of BS and CMC developed independently by our team. CMC has a high degree of viscosity and moisture absorption, which has the effect of improving sand fixation [27], and it can enhance soil water retention and fertilizer performance [8]. BSs are different from both pesticides and conventional fertilizers in that, in addition to their stimulatory effects and induction of stress resistance mechanisms, many of their components have the function of providing or improving nutrition and increasing nutritional efficiency directly for crops. Macroscopically, they are a series of organic and inorganic compounds or microbial products that can improve the nutritional and health status of crops, increase the utilization rate of pesticides and fertilizers, stimulate the natural physiological processes of crops, improve crop stress tolerance, and ultimately increase crop yield and improve quality [10], and microscopically, they are a series of organic or inorganic compounds or microbial products that can affect the level of gene expression and regulate physiological, biochemical, and signaling processes through a variety of pathways, which, in turn, affects the metabolism of nutrients, water, and assimilatory product metabolism of a series of organic or inorganic molecules [28]. The main components of BS are glycine, proline, Bacillus subtilis, fulvic acid, and sodium alginate oligosaccharide, of which glycine is the amino acid with the smallest molecular weight and the simplest structure, cannot easily be absorbed and utilized by microorganisms [29], and can provide a certain amount of nitrogen for the growth of apples. Proline can reduce the osmotic potential of cells and maintain and improve the water-holding capacity of plant tissues [30]. Bacillus subtilis can effectively improve soil structure, enhance soil organic carbon content, and increase soil water retention [31]. The structure of xanthate includes a large number of chelates formed by the interaction of oxygen-containing functional groups, which affects the nutrient uptake of crops [32], and at the same time, enhances soil water content [33]. As an oligosaccharide, sodium alginate oligosaccharide can provide nutrients for plants, enhance crop photosynthetic rate, and promote carbohydrate accumulation and yield increase [34], and it is also rich in growth substances such as cytochromes, amines, and indole compounds [35]. Bacillus subtilis [36], fulvic acid [37], and CMC [38,39] in the BS improved soil’s agglomeration and structural properties, and increased soil’s water-holding capacity, after filling the soil structure with the right amount of water after irrigation, which was conducive to increasing soil glycine, proline, sodium alginate oligosaccharide, nitrogen, phosphorus, potassium, and other nutrients in soil turnover and migration, as water and fertilizer uptake and utilization by apple trees provides a soil environment and nutrient base. On the other hand, the application of BS can reduce leaf malondialdehyde content, electrical conductivity, and leaf dehydration rate, significantly increase relative water content, and alleviate drought stress injury [40,41]; it can regulate the physiological processes of crops [42], activate signaling pathways [43], and improve the efficiency of photosynthesis in crops and the utilization of natural resources (water, organic matter, fertilizers, etc.), thus achieving the effect of increasing efficiency, reducing quantity, and improving quality.
(2)
Effect of BS and CMC on leaf SPAD
Chlorophyll (SPAD) is the main pigment for photosynthesis in plants, and is the basis of photosynthetic efficiency in crops. Chlorophyll plays an important role in photosynthesis [44], and the higher its content, the more favorable it is for plant growth and development [45]. There is an obvious linear relationship between SPAD value and chlorophyll content [46,47,48], which can represent the content of leaf chlorophyll; however, nitrogen is the main synthesis component for synthesizing chlorophyll, and there is an obvious relationship. The coupling of CMC and BS provides a certain amount of nitrogen for the crop and promotes the absorption and utilization of nitrogen by the crop, and this shows that the SPAD value of the leaves in the CMC and BS treatments is higher than that in the CK treatment. The SPAD of crop leaves will show a change trend of increasing and then decreasing with the advancement of the fertility period [49,50]; however, the SPAD in this study showed an increasing trend with the advancement of the fertility period, and there was no decreasing trend in the ripening period, which was mainly related to the apple varieties, and the fruit varieties in this study were early-maturing. The fruit tree variety in this study was early-maturing “Gala”, and the harvesting period was in mid-to-late August, which was a period when the apples were already ripe for harvesting, but the climate was still favorable for crop growth, so the apple trees’ branches and leaves were still in a lush state.
(3)
Mechanism of the effect of BS and CMC on enhancing the photosynthetic properties of leaves
Photosynthesis, as the main driving force for plant growth and production in terrestrial ecosystems, is the source of energy required by plants to maintain growth [51]. The crop light saturation point and net photosynthetic rate are important indicators of the strength of the photosynthetic capacity of crops, but the process of photosynthesis in crops is more complex and varies with different species, reproductive periods, and environmental changes [52]. Photosynthesis is mainly affected by both non-stomatal and stomatal limitations [53], and the rate at which ribulose 1,5-bisphosphate carboxylate oxidase reacts with CO2 to produce organic molecules (including the maximum rate of carboxylation, and the maximum rate of electron transfer) is the main non-stomatal limiting factor affecting the rate of light saturation and net photosynthesis in plant leaves [54,55]. Compared to C4 plants [56,57], it is relatively difficult to improve and enhance photosynthesis in C3 plants.
Phosphorus is the second most essential mineral nutrient for plants and plays an important role in plant growth, development, and reproduction, being a component of chlorophyll and ATP, and a limiting nutrient for plant growth [58]. Phosphorus also participates in many important physiological and biochemical processes such as photosynthesis and enzymatic reactions, and is involved in enzyme activity regulation and signal transduction processes through phosphorylation and dephosphorylation [59]. Therefore, phosphorus enhances the activity of 1,5-bisphosphate ribulose carboxylate oxidase by synthesizing ATP and promoting the photosynthetic properties of crops [60,61].
The phosphorus concentration in soil is usually 2000 times higher than that in plants, often in the form of aluminum/iron or calcium/magnesium phosphates [62], but the actual free phosphate content in soil that can be absorbed and utilized is low [63] and cannot easily be absorbed and directly utilized by plants. Microorganisms can catalyze the hydrolysis of organophosphorus through the synthesis of alkaline phosphatases and increase the availability of soil phosphorus [64], while the BS applied in this study contains components of Bacillus subtilis, which can convert inorganic or organic phosphorus in the soil into effective phosphorus that can be absorbed and utilized by the crop through the secretion of organic acids, etc. [65], which was ultimately demonstrated in this study as the phosphorus content of the BS and CMC treatments had higher leaf phosphorus content than that of the CK treatment.
CMC and BS promoted the uptake and utilization of nitrogen, phosphorus, and potassium in apples and elevated leaf SPAD values and 1,5 bisphosphate ribulose carboxylate oxidase activity, manifesting as an increase in the photosynthetic saturation point and net photosynthetic rate of apple leaves, which increased the accumulation of photosynthetic organic matter, and enhanced the yield and quality of apples.

5. Conclusions

The combination of the CMC and BS treatments increased the content of N, P, and K in leaves compared with the CK treatment, and with increasing amounts of CMC and BS, the change trend appeared to first increase and then decrease, and among all the treatments, the highest contents of nitrogen, phosphorus, and potassium in the leaves in the Y2C2 treatment were elevated by 9.28, 0.61, and 0.56 g kg−1, respectively, compared with the CK treatment. There was no interaction effect between CMC and BS on the SPAD of apple leaves in the flowering and fruiting stage (p > 0.05), but there was an interaction effect of CMC and BS on the SPAD of leaves at the fruiting stage (p < 0.05). The SPAD values of leaves in the coupled treatment of CMC and BS at the flowering and fruiting stage increased from 4.47% to 24.29% compared with those in the CK treatment, and the values of SPAD in leaves at the fruiting stage increased from 2.84% to 26.50%, and the values of SPAD in leaves at the ripening stage increased from 6.64% to 19.41%. In the light response data, the net photosynthetic rate of the different treatments was greater than that of the CK treatment, with an increase in the range of 1.04–5.03 µmol m−2 s−1, and the maximum value appeared in the Y2C2 treatment. Net photosynthetic rate, transpiration rate, and stomatal conductance all showed a pattern of increasing and then decreasing with an increase in BS and CMC application, and the maximum value still appeared in the Y2C2 treatment, which was higher than that in the CK treatment by 5.09 µmol m−2 s−1. Yield showed a significant correlation with the other indexes, except for SPAD during the period of fruit expansion (p > 0.05), and showed a positive correlation with net photosynthesis rate, and a positive correlation with SPAD. And the positive correlation with net photosynthetic rate was the highest. SPAD and titratable acid showed a significant negative correlation at maturity with the highest correlation coefficient, leaf N content at fruit expansion showed a significant correlation with soluble reducing sugar content with the highest correlation coefficient, leaf P content at fruit expansion showed the highest correlation with soluble solids, and leaf K content at fruit expansion showed the highest correlation with VC. Through the established functional relationship between CMC and BS application rate and apple yield, the recommended BS application rate of 27 kg ha−1 and CMC application rate of 20.625 kg ha−1 can yield up to 43,357.8 kg ha−1. It can be determined that CMC and BS play an important role in apple yield and quality improvement by improving the utilization rate of apple nutrients and enhancing the physiological characteristics of apples. The effect of CMC and BS on apples is to increase yield and quality through improving nutrient utilization and enhancing the physiological characteristics of apples, which could be an effective measure to solve the problem of low yield and quality caused by the physiological limitations of apples in sandy soil.

Author Contributions

Conceptualization, M.Z., W.M. and Q.W.; methodology, M.Z. and W.M.; software, Y.S. and Z.L.; validation, J.Z.; formal analysis, W.M.; data curation, X.W.; writing—original draft preparation, M.Z. and W.M.; writing—review and editing, M.Z., W.M. and Q.W.; funding acquisition, Y.B.; M.Z. and W.M. made equal contributions in this study. All authors have read and agreed to the published version of the manuscript.

Funding

This study was supported by the Major Science and Technology Special Projects in the Xinjiang Uygur Autonomous Region of China (2022A02003-2).

Data Availability Statement

Data are available on request due to restrictions, e.g., privacy or ethical. The data presented in this study are available on request from the corresponding author. The data are not publicly available as the scientific research project that funded this study has not yet been completed and all experimental data have not yet been fully analyzed.

Conflicts of Interest

The authors declare no conflict of interest.

References

  1. Shu, H.R.; Chen, X.D. The current task of the development of fruits industry in China. China Fruits 2018, 2, 1–3. [Google Scholar]
  2. Zhang, Q.Q.; Huo, X.X.; Liu, J.D.; Yang, H.L. The analysis and prediction of world apple production pattern and market dynamics. World Agric. 2016, 7, 147–152. [Google Scholar]
  3. Cheng, C.G.; Zhao, D.Y. Development orientation and trend of the apple industry under the new situation. China Fruits 2019, 1, 1–7. [Google Scholar]
  4. Wang, J.W.; Ma, Z.W. Research on the Development Path of Apple Industry in Aksu Prefecture, Xinjiang. Xinjiang Farm Res. Sci. Technol. 2022, 45, 25–28. [Google Scholar]
  5. Deng, Y.; Li, X.P.; Cui, F.R. Taxonomy of saline-alkali soil in Aksu area. J. Northwest A F Univ. 2006, 1, 113–116. [Google Scholar]
  6. Li, X.H. Effects of drought on apple growth and development and defensive measures. Mod. Agric. Sci. Technol. 2017, 15, 215–219. [Google Scholar]
  7. Ning, S.R.; Jumai, H.; Wang, Q.J.; Zhou, B.B.; Su, L.J.; Shan, Y.Y.; Zhang, J.H. Comparison of the Effects of Polyacrylamide and Sodium Carboxymethylcellulose Application on Soil Water Infiltration in Sandy Loam Soils. Adv. Polym. Technol. 2019, 2019, 6869454. [Google Scholar] [CrossRef]
  8. Yang, S.Q.; Xing, L.; Liu, H.Y.; Guo, P. Effects of sodium carboxymethyl cellulose application on soil properties of new cultivating farmland in loess plateau. J. China Agric. Univ. 2021, 26, 185–191. [Google Scholar]
  9. Xi, Y.Q.; Zhao, Y.; Li, S.Y. Effects of Three Kinds of Soil Amendments on Shear Strength of Aeolian Soil. Acta Pedol. Sin. 2018, 55, 1401–1410. [Google Scholar]
  10. Calvo, P.; Nelson, L.; Kloepper, J.W. Agricultural uses of plant biostimulants. Plant Soil 2014, 383, 3–41. [Google Scholar] [CrossRef]
  11. Gu, D.Y.; Wang, X.F.; Yang, F.J.; Jiao, J.; Wei, M.; Shi, Q.H. Effects of purified humic acid on growth and nutrient uptake of cucumber seedlings under low nitrogen stress. Humic Acid 2018, 4, 52. [Google Scholar]
  12. Ertani, A.; Pizzeghello, D.; Baglieri, A.; Cadili, V.; Tambone, F.; Gennari, M.; Nardi, S. Humic-like substances from agro-industrial residues affect growth and nitrogen assimilation in maize (Zea mays L.) plantlets. J. Geochem. Explor. 2013, 129, 103–111. [Google Scholar]
  13. Barrajon-Catalan, E.; Álvarez-Martínez, F.J.; Borras, F.; Perez, D.; Herrero, N.; Ruiz, J.J.; Micol, V. Metabolomic analysis of the effects of a commercial complex biostimulant on pepper crops. Food Chem. 2019, 310, 125818. [Google Scholar] [CrossRef] [PubMed]
  14. Jia, C.H.; Liu, Z.G.; Zhang, M.; Jia, J.W.; Zheng, L.; Wang, Q.B.; Wang, H.F. Effects of extracts from Paecilomyces variotii on the yield and quality of cherry radish. J. Agric. Resour. Environ. 2019, 36, 176–183. [Google Scholar]
  15. Feng, J.T.; Xing, Y.; Zhang, X.; Jia, Z.H.; Li, H.F.; Liu, X.Y.; Ge, S.F.; Jiang, Y.M. Effects of salicylic acid, abscisic acid and seaweed extract on drought resistance and nutrient uptake of apple seedlings under drought stress. China Fruits 2019, 06, 42–48. [Google Scholar]
  16. Panfili, I.; Bartucca, M.L.; Marrollo, G.; Povero, G.; Buono, D.D. Application of a Plant Biostimulant to Improve Maize (Zea mays) Tolerance to Metolachlor. J. Agric. Food Chem. 2019, 67, 12164–12171. [Google Scholar] [CrossRef]
  17. Yakhin, O.I.; Lubyanov, A.A.; Yakhin, I.A.; Brown, P.H. Biostimulants in Plant Science: A Global Perspective. Front. Plant Sci. 2017, 7, 238366. [Google Scholar] [CrossRef] [PubMed]
  18. Ali, Q.; Aahraf, M. Induction of Drought Tolerance in Maize (Zea mays L.) due to Exogenous Application of Trehalose: Growth, Photosynthesis, Water Relations and Oxidative Defence Mechanism. J. Agron. Crop Sci. 2011, 197, 258–271. [Google Scholar] [CrossRef]
  19. Wang, M.Y.; Wang, W.X.; Zhao, X.M.; Yi, H. Effect of chitooligosaccharide on Reducing Cryoinjury and Improving Metabolite of Winter Wheat seedings under Low Temperature Stress. J. Triticeae Crop. 2016, 36, 653–658. [Google Scholar]
  20. Martynenko, A.; Shotton, K.; Astatkie, T.; Petrash, G.; Fowler, C.; Neily, W.; Critchley, A.T. Thermal imaging of soybean response to drought stress: The effect of Ascophyllum nodosum seaweed extract. SpringerPlus 2016, 5, 1–14. [Google Scholar] [CrossRef]
  21. Qu, D.Y.; Gu, W.R.; Li, L.J.; Li, J.; Li, C.F.; Wei, S. Regulation of chitosan on the ascorbate-glutathione cycle in Zea mays seedling leaves under cadmium stress. Plant Sci. J. 2018, 36, 291–299. [Google Scholar]
  22. Pang, Q.Q.; Sun, G.W.; Cai, X.L.; Zhou, M.; Zhao, J.H.; Li, D.M. Effects of Fulvic Acid on Reactive Oxygen Metabolism and Related Gene Expression in Pakchoi under NO3—Stress. Mol. Plant Breed. 2018, 16, 5812–5820. [Google Scholar]
  23. Liu, B.Y.; Wang, L.; Yang, L.X.; Tong, X.Y.; Piao, Z.H.; Li, X. Effects of Different Leaf Fertilizers on Chlorophyll, Yield and Fruit Quality of Pingguoli. J. Anhui Agric. Sci. 2021, 49, 156–158. [Google Scholar]
  24. Li, Z.Q.; Bai, W.B.; Zhang, Y.L.; Wang, W.R.; Yan, H. Effects of Foliar Fertilizers on Fruit Quality of Fuji Line-Jinfu 2. J. Shanxi Agric. Sci. 2012, 40, 41–43. [Google Scholar]
  25. Erikson, U.G. Muscle Quality of Atlantic Salmon (Salmo salar) as Affected by Handling Stress. Ph.D. Thesis, Trondheim University, Trondheim, Norway, 1997. Available online: https://xueshu.baidu.com/usercenter/paper/show?paperid=0f6e3924373a83e327fa25232e8ad29b&site=xueshu_se&hitarticle=1 (accessed on 25 June 2024).
  26. Bao, D.D.; Xing, T.; Xu, Y.; Zhang, Z.J.; Tan, H.L.; Chen, H.Y. Analysis on the Effect of Spraying Different Amino Acid Foliar Fertilizers on the Volatile Substances of Aksu Red Fuji Apple. Mod. Food 2023, 29, 181–184. [Google Scholar]
  27. Genovese, M.; Viccione, G.; Rossi, F.; Guida, D.; Lenza, T.L.L. Using the Sodium Carboxymethylcellulose (CMC) as viscosity modifier to model the interstitial fluid in laboratory debris flows. In Latest Trends in Engineering Mechanics, Structures, Engineering Geology; Viccione, G., Guarnaccia, C., Eds.; WSEAS Press: Houston, TX, USA, 2014; pp. 179–186. [Google Scholar]
  28. Ramos, A.C.; Dobbss, L.B.; Santos, L.A. Humic matter elicits proton and calcium fluxes and signaling dependent on Ca2+-dependent protein kinase (CDPK) at early stages of lateral plant root development. Chem. Biol. Technol. Agric. 2015, 2, 1–12. [Google Scholar] [CrossRef]
  29. Lipson, D.A.; Raab, T.K.; Schmidt, S.K.; Monson, R.K. Variation in competitive abilities of plants and microbes for specific amino acids. Biol. Fertil. Soils 1999, 29, 257–261. [Google Scholar] [CrossRef]
  30. Zhu, A.M.; Zhang, Y.X.; Wang, X.G.; Tian, Y.L. Effects of Cutting Treaments in Late Autumn on Antioxidant Enzyme Activity and Proline Content in crown of Sandy Land Alfalfa in Wint. Acta Agrestia Sin. 2018, 26, 222–230. [Google Scholar]
  31. Xu, X.P.; Wang, Y.K.; Feng, H.; Zhao, X.N. Research Summary of the Soil Amendment’s Effect on Improving Soil, Cultivating Fertilizer and Increasing Yield. Chin. Agric. Sci. Bull. 2007, 9, 331–334. [Google Scholar]
  32. Berbara, R.L.L.; García, A.C. Humic Substances and Plant Defense Metabolism; Springer Science and Business Media: New York, NY, USA, 2014. [Google Scholar]
  33. Sun, Y.; Wu, J.X.; Qu, Z.; Han, N.; Lu, J.Y.; Ma, Y.Y.; Hu, Z.F. Effects of biochemical fulvic acid on the water-salt transport characteristics of soda saline-alkali soil with different textures. Trans. Chin. Soc. Agric. Eng. 2023, 39, 74–84. [Google Scholar]
  34. Zhang, Y.H.; He, A.L.; Yang, Z.P.; Zheng, C.F.; Du, J.; Bao, D.J.; Yao, J.; Yang, H.H. Effects of Root-irrigation with Alginate Oligosaccharide Solution on Photosynthetic Characteristics, Dry Matter Accumulation and Yield of Wheat. Acta Agric. Jiangxi 2018, 30, 1–5. [Google Scholar]
  35. Battacharyya, D.; Babgorahi, M.Z.; Rathor, P.; Prithiviraj, B. Seaweed extracts as biostimulants in horticulture. Sci. Hortic. 2015, 196, 39–48. [Google Scholar] [CrossRef]
  36. Qiu, Y. Application of Bacillus subtilis in Modern Agriculture. Hortic. Seed 2022, 7, 81–85. [Google Scholar]
  37. Lu, S.F.; Hu, S.Q.; Yan, C.X.; Shi, C.H. Study on the Preparation of Fulvic Acid from Cotton Stalk in Southern Xinjiang and Its Influence on Soil Properties. Humic Acid 2023, 6, 49–56+67. [Google Scholar]
  38. Li, Q.X.; Li, M.Y.; Dong, W.H. Research Progress on the Application of Carboxymethyl Cellulose in Soil Improvement. China Resour. Compr. Util. 2024, 42, 102–104. [Google Scholar]
  39. Halidaimu, J.M.; Ning, S.R.; Wang, Q.J.; Zhang, J.H. Comparative Analysis of the Effects of PAM and CMC on Soil Infiltration and Evaporation. J. Soil Water Conserv. 2020, 1, 121–127. [Google Scholar]
  40. Feng, J.T. Effects of Seaweed Extract on Drought Resistance and Nutrient Uptake of Apple Seedlings under Drought Stress. Agriculum Res. Areas 2019, 38, 80–85. [Google Scholar]
  41. Yang, J.; Yin, Y.H.; Shen, H. Effect of seaweed functional substances on drought resistance of flowering cabbage. Phosphate Compd. Fertil. 2019, 34, 34–42. [Google Scholar]
  42. Horinouchi, H.; Katsuyama, N.; Taguchi, Y.; Hyakumachi, B. Control of Fusarium crown and root rot of tomato in a soil system by combination of a plant growth-promoting fungus, Fusarium equiseti, and biodegradable pots. Crop Prot. 2008, 27, 859–864. [Google Scholar] [CrossRef]
  43. Li, G.Y.; Ding, H.Q.; Shen, J.L.; Shen, H. Study on preparation of water-soluble chitosan and its effect on drought resistance of Chinese flowering cabbage. Phosphate Compd. Fertil. 2018, 33, 30–34. [Google Scholar]
  44. Wali, M.; Gunsè, B.; Llugany, M.; Corrales, I.; Abdelly, C.; Poschenrieder, C.; Ghnaya, T. High salinity helps the halophyte Sesuvium portulacastrum in defense against Cd toxicity by maintaining redox balance and photosynthesis. Planta Int. J. Plant Biol. 2016, 244, 333–346. [Google Scholar] [CrossRef] [PubMed]
  45. Yan, A.L.; Wu, T.T.; Wang, Y.B.; Zhang, X.Q. The characteristics of cadmiun to lerance and accumulation in three kinds of ornamental plants. Acta Ecol. Sin. 2010, 30, 2491–2498. [Google Scholar]
  46. Ming, B.Y.; Huang, M.; Fu, X.J.; Yang, Q.S.; Zhou, N.; Guo, D.Q. Correlation analysis of SPAD value and chlorophyll content in leaves of Fritillaria thunbergii. South China Agric. 2023, 17, 34–37. [Google Scholar]
  47. Pan, J. Correlation analysis of SPAD value and chlorophyll content in apple leaves. Contemp. Hortic. 2017, 21, 39–40. [Google Scholar]
  48. Lei, Z.X.; AI, T.C.; Li, F.M.; Dong, W. The Relationships between SPAD Readings and the Contents of Chlorophyll and Nitrogen in Strawberry Leaves. J. Hubei Agric. Coll. 2001, 2, 138–140. [Google Scholar]
  49. Zhao, K.C.; Ye, Y.; Ma, J.; Qian, T.C.; Huang, L.F.; Zhuang, H.Y. Dynamic model and characteristic analysis of SPAD value in rice leaves after flowering. Jiangsu Agric. Sci. 2021, 49, 74–80. [Google Scholar]
  50. Zhang, Y.J.; Wang, L.; Bai, Y.L.; Lu, Y.L.; Zhang, J.J.; LI, G. Relationship of physiological and biochemical indicators with SPAD values in maize leaves at different layers. J. Plant Nutr. Fertil. 2020, 26, 1805–1817. [Google Scholar]
  51. Flexas, J.; Carrioui, M. Photosynthesis and photosynthetic efficiencies along the terrestrial plants phylogeny: Lessons for improving crop photosynthesis. Plant J. 2020, 101, 964–978. [Google Scholar] [CrossRef] [PubMed]
  52. Smith, N.G.; Keenan, T.F.; Prentice, I.C.; Wang, H.; Wright, I.J.; Niinemets, U.; Crous, K.Y.; Domingues, T.F.; Guerrieri, R.; Ishida, F.K.; et al. Global photosynthetic capacity is optimized to the environment. Ecol. Lett. 2019, 22, 506–517. [Google Scholar] [CrossRef]
  53. Jones, H.G. Partitioning stomatal and non-stomatal limitations to photosynthesis. Plant Cell Environ. 2010, 8, 95–104. [Google Scholar] [CrossRef]
  54. Veromann-Jürgenson, L.L.; Brodribb, T.J.; Niinemets, U.; Tosens, T. Variability in the chloroplast area lining the intercellular airspace and cell walls drive mesophyll conductance in gymnosperms. J. Exp. Bot. 2020, 71, 4958–4971. [Google Scholar] [CrossRef] [PubMed]
  55. Vian, A.; Stankovic, B.; Davies, E. Signalomics: Diversity and Methods of Analysis of Systemic Signals in Plants. In PlantOmics: The Omics of Plant Science; Springer: Berlin/Heidelberg, Germany, 2015; pp. 459–489. [Google Scholar]
  56. Wang, Y.; Chan, K.X.; Long, S.P. Towards a dynamic photosynthesis model to guide yield improvement. Plant J. 2021, 107, 343–359. [Google Scholar] [CrossRef] [PubMed]
  57. Evans, J.R. Improving Photosynthesis. Plant Physiol. 2013, 162, 1780–1793. [Google Scholar] [CrossRef] [PubMed]
  58. Hou, Y.P.; Kong, L.L.; Li, Q.; Yang, J.; Yin, C.X.; Qin, Y.B.; Zhang, L.; Yu, L.; Wang, L.C.; Xie, J.G. Studies on Effect of Different Phosphorus Levels on Yield, Nutrient Absorption of Rice and Soil Phosphorus Balance. J. Northeast Agric. Sci. 2016, 41, 61–66. [Google Scholar]
  59. Chiou, T.J.; Lin, S.I. Signaling network in sensing phosphate availability in plants. Annu. Rev. Plant Biol. 2011, 62, 185–206. [Google Scholar] [CrossRef] [PubMed]
  60. Liu, W.; Fan, W.H.; Liu, F.W.; Zhang, H.; Wang, G.L.; Yu, M.M.; Tian, L.D. Effects of Phosphorus on Photosynthesis and Antioxidant Enzyme System of Cucumber Seedlings under Cadmium Stress. Chin. J. Soil Sci. 2022, 53, 596–604. [Google Scholar]
  61. Feng, L.; Liu, S.Q.; Cheng, B.; Wang, Y.; Liu, Q.; Ma, G.Q.; Li, H. Effects of different phosphorus levels on yield, photosynthetic characteristics and quality of garlic under hydroponic culture. Soil Fertil. Sci. China 2014, 03, 38–43. [Google Scholar]
  62. Johan, P.D.; Ahmed, O.H.; Omar, L.; Hasbullah, N.A. Phosphorus transformation in soils following co-application of charcoal and wood ash. Agronomy 2021, 11, 2010. [Google Scholar] [CrossRef]
  63. Deng, H.Y.; Wang, Y.Y.; Guo, J.H. Uptake and utilization of phosphorus by plants. Rural Sci. Technol. 2022, 13, 71–75. [Google Scholar]
  64. Dixon, M.; Simonne, E.; Obreza, T.; Liu, G. Crop response to low phosphorus bioavailability with a focus on tomato. Agronomy 2006, 10, 617. [Google Scholar] [CrossRef]
  65. Mohamed, E.A.H.; Farag, A.G.; Youssef, S.A. Phosphate Solubilization by Bacillus subtilis and Serratia marcescens Isolated from Tomato Plant Rhizosphere. J. Environ. Prot. 2018, 9, 266–277. [Google Scholar] [CrossRef]
Figure 1. Apple planting pattern.
Agronomy 14 01403 g001
Figure 2. N, P, and K content of apple leaves under different treatments. Note: Different letters in the same column indicate significant differences at the p < 0.05 level.
Agronomy 14 01403 g002
Figure 3. Changes in SPAD values of apple leaves under different habitat control treatments. Note: Different letters in the same column indicate significant differences at the p < 0.05 level.
Agronomy 14 01403 g003
Figure 4. Changes in light response curves of apple leaves under different habitat conditioning treatments.
Agronomy 14 01403 g004
Figure 5. Photosynthetic characteristics under different habitat regulation treatments. Note: Different letters in the same column indicate significant differences at the p < 0.05 level.
Agronomy 14 01403 g005
Figure 6. Correlation of different physiological indicators with yield and quality indicators.
Agronomy 14 01403 g006
Figure 7. Relationship between optimal application rates of BS and CMC and yield and quality indexes.
Agronomy 14 01403 g007aAgronomy 14 01403 g007b
Table 1. Soil bulk density and particle composition in the experimental area.
Soil Depth
(cm)
Soil Dry Density
(g cm−3)
Sticky Grains
(%)
Powder
(%)
Sand
(%)
0–201.520.513.2196.28
20–401.581.868.2190.93
40–601.5101.4198.59
60–801.5301.2798.73
80–1001.4800.4299.58
100–1201.510.424.4395.15
Table 2. Ingredients of biostimulants.
IngredientPhysical PropertyChemical PropertyFunctions
GlycineWhite or off-white crystalline powder, odorless, with special sweet taste. Soluble in water, not easy to decompose.Chemical formula C2H5NO2, the constituent amino acid of the endogenous antioxidant reduced glutathione, is one of the simplest structures in the amino acid family. Glycine is able to undergo a variety of chemical reactions with other substances, such as salt formation, esterification and amidation.Amino acids that can be directly absorbed and utilized by the roots and leaves of crops are absorbed by plants as raw materials for growth hormones, which are involved in the growth and development of plants, can enhance the plant’s ability to adapt to adversity, and have a growth-promoting effect on the plant.
ProlineWhite crystal or crystalline powder state, soluble in water, not easy to decompose.Chemical formula C5H9NO2, a cyclic subamino acid whose molecular structure contains a pyrrolidine ring, which can be converted to glutamic acid in living organisms by the action of proline oxidase.Roots and leaves of crops can absorb amino acids, which are one of the components of plant proteins and can exist widely in the plant body in a free state, which can enhance the crops’ resilience to adversity (drought, salinity, heat, cold and frost).
Fulvic acidReddish brown or gray-black powdery substance, easily soluble in water.Humic acid with the molecular weight of a very small organic acid, aqueous solution pH value is usually in the range of 3–5, can reduce water surface tension and reduce contact angle, has certain redox properties.Can be directly absorbed and utilized by plant roots or leaves, and can adsorb nitrogen in the soil, chelate with phosphorus, transform phosphorus from soil to plant-absorbable form, and transform insoluble potassium to soluble potassium, which can improve plant drought resistance, cold resistance and resistance to pests and diseases, and as a kind of broad-spectrum plant growth regulator, it can effectively promote the growth of plants.
Bacillus subtilisA kind of bacillus genus, no pod membrane, with periplasmic flagellum; can move, reproduce faster, and is a kind of aerobic bacteria.In the process of metabolism, it produces a variety of enzymes, such as protease, α-amylase, cellulase, etc. It can produce active substances such as chytridiomycin, polymyxin, mycobacteriocin, short mycopeptide, etc., which have obvious inhibitory effects on pathogenic bacteria or endogenous infections of conditionally pathogenic bacteria.It can decompose organic materials and release nutrients such as nitrogen, phosphorus, and potassium to improve soil fertility. Forms a probiotic environment in the soil, promotes the formation of granular structure, improves the ability of soil to retain fertilizer and water, and increases soil looseness. Secretion of active substances can stimulate crop-growth-type endogenous hormones; for example, indole acetic acid, gibberellin, and other content increased.
Sodium alginate oligosaccharidesWhite or light yellow powder, easily soluble in water, dissolved in water to form a viscous colloidal solution.Alginate degradation from an oligosaccharide, containing a large number of carboxyl and hydroxyl groups and other functional groups; these functional groups have good water solubility and bioactivity, and can interact with multivalent ions to form hydrogels.It can increase the porosity of soil, have a regulating effect on the acidity and alkalinity of soil, stimulate the activity of the defense enzyme system in the plant body, promote the development of the plant root system, and improve the absorption and utilization of soil nutrients and water by the plant. As a new type of plant growth regulator, it can promote the growth of the plant, and improve the efficiency of photosynthesis and the efficiency of water utilization.
Table 3. Experimental table of habitat coupling and regulation of apple trees.
Deal withBS (kg ha−1)CMC (kg ha−1)
Y1C11215
Y1C21222.5
Y1C31230
Y2C12415
Y2C22422.5
Y2C32430
Y3C13615
Y3C23622.5
Y3C33630
CK00
Table 4. The characteristic values of non-rectangular hyperbolic modified models were fitted under different habitat control treatments.
Experimental
Treatments
αLCP
(µmol m−2 s−1)
LSP
(µmol m−2 s−1)
Rd
(µmol m−2 s−1)
Pnmax
(µmol m−2 s−1)
R2
Y1C10.04943.928671620.9562.164 16.28710.9991
Y1C20.06447.428241689.8863.047 17.920240.9993
Y1C30.06343.428941757.6982.753 16.966720.9982
Y2C10.06748.528621469.8933.231 19.402550.9948
Y2C20.06943.389281539.732.973 20.285070.9964
Y2C30.07241.732691606.8013.014 18.135750.9971
Y3C10.05651.78571874.9622.885 17.724050.9943
Y3C20.05447.352351448.9192.559 19.028970.9893
Y3C30.05348.420881705.7062.582 17.265780.9922
CK0.04741.526621413.8311.959 15.251370.9966
Table 5. Apple production and quality.
TreatmentTitratable
Acid (g kg−1)
Reducing
Sugar (g kg−1)
Soluble
Solids (%)
VC (mg 100 g−1)Yield (kg ha−1)
Y1C13.62 ± 0.10 b133.83 ± 4.93 cd14.57 ± 0.17 bc12.16 ± 0.22 cd38,070 ± 2792.42 ab
Y1C23.50 ± 0.11 bc139.41 ± 4.62 bcd15.70 ± 0.08 ab11.90 ± 0.36 cde40,050 ± 1402.00 ab
Y1C33.65 ± 0.08 b132.46 ± 1.59 cd15.43 ± 0.50 ab10.98 ± 0.55 e38,100 ± 2042.20 b
Y2C13.35 ± 0.11 bc150.77 ± 4.33 ab15.40 ± 0.37 ab13.85 ± 0.13 ab40,620 ± 750.60 ab
Y2C23.28 ± 0.07 c154.72 ± 3.89 a16.40 ± 0.29 a14.43 ± 0.42 a43,890 ± 1571.50 a
Y2C33.37 ± 0.15 bc152.35 ± 4.66 ab16.13 ± 0.54 a14.13 ± 0.20 a40,350 ± 2460.73 ab
Y3C13.67 ± 0.08 b136.70 ± 2.14 cd13.87 ± 0.37 cd12.96 ± 0.44 bc41,460 ± 2448.63 a
Y3C23.53 ± 0.07 bc146.27 ± 6.70 abc15.27 ± 0.49 ab12.65 ± 0.23 c42,480 ± 2682.95 a
Y3C33.64 ± 0.11 b140.60 ± 5.93 bcd14.73 ± 0.37 bc12.44 ± 0.39 cd38,730 ± 1837.61 ab
CK4.03 ± 0.10 a128.43 ± 2.37 d13.60 ± 0.16 d11.51 ± 0.30 de34,392 ± 837.38 c
Note: Data in the table are mean ± standard deviation, and different letters in the same column indicate significant differences at the p < 0.05 level, respectively.
Disclaimer/Publisher’s Note: The statements, opinions and data contained in all publications are solely those of the individual author(s) and contributor(s) and not of MDPI and/or the editor(s). MDPI and/or the editor(s) disclaim responsibility for any injury to people or property resulting from any ideas, methods, instructions or products referred to in the content.

