Abstract
Lucerne (Medicago sativa L.) forage production may be shifting towards the autumn–spring season, or in cooler environments, due to warmer and drier summers in Mediterranean Europe. This study aimed to evaluate the performance of lucerne cultivars with varying winter activity ratings (WAR) and hardiness in divergent environments of Greece: a cool highland versus a warm lowland. Highlywinter-active (HWA) cultivars were compared to semi-winter-active (SWA) ones for dry matter (DM) yield, seasonal harvest ratios, quality, and agronomic parameters. The SWA cultivars exhibited twice as many overwintered plants and higher summer yields, and were more productive (by 10.4%) in the cooler site. Conversely, HWA cultivars showed enhanced autumn yields and greater productivity (by 10.5%) in the warmer site. Notably, stability analyses revealed trade-offs between productivity and stability, with the most stable cultivar showing lower productivity (by 5.3–5.5%). Additionally, SWA cultivars exhibited higher crude protein content. Plant height and node number correlated with yields in the cool site but not in the warm, underscoring their effectiveness as indirect indicators in marginal environments. Outstanding temperature-specific cultivar responses fully justify the negative relation between winter activity and hardiness regarding productivity. This emphasizes the importance of matching cultivar winter activity and hardiness with specific microenvironments. Region-specific early screening could target the decoupling of the association between low winter activity and increased hardiness, enabling the optimization of cultivars for both traits, while interregional advanced line testing could capitalize on stability and resilience to address the challenges of climate change.
1. Introduction
Lucerne or alfalfa (Medicago sativa L.) has grown in Greece since antiquity [1]. Currently, it is a major spring crop occupying 119,000 ha and yielding annually 18.0 t/ha under irrigation and 7.0 t/ha under dryland conditions [2]. Lucerne stands out as the prevailing forage crop in the Mediterranean region and many parts of the world due to its high protein yield per unit area, high water-use efficiency, low establishment and tilling costs, minimal pesticide and herbicide requirements, high N2-fixation, and low NO3- leaching [3,4]. The dominance of lucerne in animal husbandry is attributed to its high nutritive value, characterized by high crude protein concentration (CP), digestibility, and palatability, along with low neutral (NDF) and acid detergent fiber (ADF), and lignin. Forage quality in lucerne is determined by the leaf/stem ratio and the degree of stem lignification, which increases significantly with the onset of flowering [5].
Genetic improvement in lucerne forage yield and nutritive value has shown only modest progress over the last few decades: major reasons are the lack of breeding materials and genetic resources, difficulties in selecting real hybrids or pure lines, a lack of advanced breeding methods, low breeding investment, long selection cycles, and high non-additive genetic variance [4,6]. Recent reports suggest improvements in productivity, with newly released cultivars exhibiting higher winter activity and disease tolerances. However, challenges persist in enhancing cultivar stability and resilience to extreme climatic events such as drought and cold, with trials revealing significant genotype × environment interactions (GEI) [7].
Significant GEI can arise from changes in the magnitude of genotype differences among environments (non-crossover interaction), changes in their relative ranking (crossover interaction), or a combination of both [8]. To leverage GEI profitably, it is necessary to maximize crop yield potential by minimizing GEI and selecting specific adaptations to distinct sub-regions or mega-environments, which are defined according to prevailing climatic, soil, and crop management practices [9]. In lucerne, large GEI implies that the highest-yielding cultivars may not be stable across environments [10]. Data from various environments in Italy demonstrate the importance of breeding for specific adaptation to achieve yield progress over local, top-performing commercial varieties [11,12,13]. The fragmented terrain in the Mediterranean region shapes different pedo-climatic microenvironments, resulting in high GEI [14].
The ongoing climate change in Mediterranean Europe is shifting forage production towards cooler environments with higher precipitation during autumn, winter, and spring [15]. Under these changing conditions, the degree of lucerne winter activity becomes a critical determinant of dry matter (DM) yield, allowing for better utilization of the extended growth period. Winter activity rating (WAR), also known as fall dormancy, is characterized by the reduction or pause of shoot plant height after the final autumn harvest, and is assessed against a set of check cultivars representing different dormancy classes [16]. Cultivar dormancy classes span from 3 to 10: dormant (3–4), semi-dormant (5), semi-winter-active (SWA) (6–7), and highly-winter-active (HWA) (8–10) [17]. Dormancy onset is triggered by decreasing temperatures and daylengths, and is closely linked to winter hardiness, plant survival, persistence, and forage nutritive value [18,19,20]. Dormant cultivars typically exhibit reduced shoot elongation and a decumbent shoot orientation in autumn, making them more winter hardy. Conversely, winter-active cultivars display extensive shoot elongation with a vertical orientation in autumn and may exhibit lower winter survival rates [21]. Winter hardy cultivars are physiologically adapted to withstand subzero temperatures without cellular damage, contributing to improved plant persistence and stand longevity, traits highly valued by growers [22,23]. However, environmental and management stresses can weaken plants, rendering them more susceptible to biotic stresses such as resident insects and pathogens, thereby reducing their winter survival [24].
The changing climate and fragmented terrain in the Mediterranean region pose a significant challenge in matching lucerne cultivars of various winter activities to specific microenvironments. While Greek cultivars generally demonstrate acceptable yield potential and persistence, there is a growing interest, particularly among sheep farmers, in introducing high WAR cultivars to enhance biomass production during the cool, high-precipitation season [25]. Consequently, elite cultivars with high WAR from abroad (Australia, USA, Italy) have undergone testing under both irrigated and dryland conditions to decipher yield and quality determinants amidst the current shifting conditions [25,26]. In brief, HWA cultivars outperformed in autumn harvests but lagged in summer yields, ultimately yielding similarly to local SWA cultivars. Notably, these findings pertain to lowland, warm-zone lucerne crops, overlooking cool, high-elevated, semi-mountainous environments.
Therefore, this study aimed to evaluate 16 lucerne cultivars sourced from various origins and classified into two winter-activity categories (HWA and SWA) across two distinct pedo-climatic environments to identify any adaptability advantages among the two classes.
2. Materials and Methods
2.1. Experimental Sites and Set Up
The study was conducted at two locations in central Greece: the semi-mountainous site of Dolichi (40°04′ N, 22°10′ E, 606 m a.s.l.) and the lowland site of Fanari (39°41′ N, 21°83′ E, 93 m a.s.l.) over four growing years (2017–2020, Figure 1). The soil at Dolichi is characterized as alkaline (pH 8.3), Cambisol sandy loam, while at Fanari, it is slightly alkaline (pH 7.9), Vertisol clay. Additional soil properties are detailed in Table 1. The two locations are typical of those sown to lucerne in Greece. However, Fanari is more fertile, with a pH closer to the optimum (6.6–7.5) for lucerne [4].
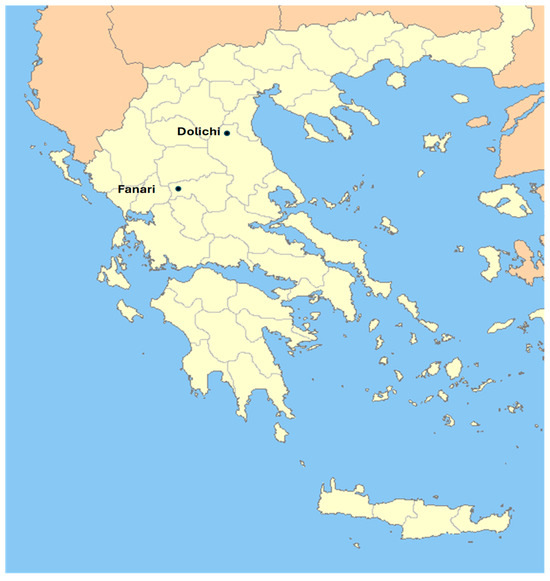
Figure 1.
Map of lucerne field experiments in Greece during (2017–2020).

Table 1.
Soil properties at 0–30 cm depth before the establishment of the experiments.
The climate in central Greece is characterized as Mediterranean. However, based on the Köppen–Geiger classification, Fanari is categorized as Csa (temperate, dry hot summer), but it also exhibits characteristics close to BSk (arid steppe, cold), whereas Dolichi is classified as Cfa (temperate without a dry season, hot summer) [27]. Climatic parameters during the four growing seasons are summarized in Table 2. Historical data (55-year average) indicates that Dolichi receives higher total precipitation (490 mm) compared to Fanari (426 mm), but experiences lower mean daily temperatures (21.4 °C vs. 25.0 °C) during the growing season (March–November). January typically exhibits the lowest temperatures, with Dolichi recording colder temperatures than Fanari, as evidenced by the 55-year mean low temperatures (−1.6 °C vs. 0.67 °C). Dolichi also holds the record low temperature of −16.2 °C (Table 2).
Table 2.
Precipitation (Prec., mm) and mean monthly temperature (T, °C) during the four years as compared to the 55 yr average (1955–2010).
The experiments were conducted using randomized complete block designs (RCBD) with 16 treatments (lucerne cultivars) replicated three times. Each plot measured 15 m in length, comprising six rows spaced 0.25 m apart (totaling 22.5 m2). A 1.5 m buffer zone separated neighboring plots, while a 2.5 m buffer zone separated blocks. Sowing occurred in April 2017 at a rate of 15 kg/ha.
In Dolichi, the preceding crop was bread wheat (Triticum aestivum L.), while in Fanari, it was maize (Zea mays L.). Lucerne seeds were not inoculated with rhizobia, but natural root nodulation was confirmed through visual examination. Basal fertilization, based on soil analysis recommendations, included 50 kg N/ha at both locations and 70 kg P2O5/ha in Fanari, and 150 kg P2O5/ha in Dolichi, broadcasted before seeding and incorporated into the soil. Additionally, 90 kg P2O5/ha was applied in early February at both sites in the subsequent years.
Weed control was achieved using Pulsar® 4 SL (imazamox 40 g/kg, BASF Hellas SA, Maroussi, Athens, Greece) through post-emergence application at the trifoliate stage and yearly application in mid-February in the subsequent years. The experiments were adequately watered to prevent drought stress, with a total of nine irrigations per year at Fanari (630 mm) and six at Dolichi (420 mm).
2.2. Genetic Materials
The trial comprised sixteen lucerne cultivars sourced from various origins, including both local and imported varieties and representing a mix of commercial and experimental development statuses. These cultivars were chosen to encompass two primary winter-activity classifications: SWA (WAR 6–7) and HWA (WAR 8–9). Each WAR rating was represented by four cultivars, totaling eight cultivars per class (Table 3).
Table 3.
Name, reported winter activity rating (WAR), origin and line development status (Commercial, Com.; Experimental, Exp.) of the 16 lucerne cultivars.
2.3. Yield and Agronomic Measurements
Within each plot, three randomly selected quadrats measuring 0.25 m2 were cut at 5 cm above the soil surface using hand shears at the beginning of the flowering stage (BBCH 60) [28]. Subsequently, the plots were mechanically mown, and all biomass was removed [29]. The fresh biomass samples from each plot were collected and weighed to determine the mean fresh biomass yield per plot. A subsample (~400 g) from each plot was dried in a forced-air oven at 75 °C until a constant weight was achieved. The dry matter yield (DMH) was then calculated in t/ha for each harvest occasion (DMH). The sum of DM over the season’s harvests represented the annual DM (DMA) for each cultivar. The sum of the DMA constituted the total production (DMT) over the four growing years. Additionally, for each harvest occasion, the ratio of DM to DMA (RH, g/kg) was computed as
In the establishment year (2017), three harvests were conducted, while in the following years (2018–2020), plots were harvested six times annually. The harvests were grouped to correspond temporally (every 35 days) and physiologically to the same seasons, such as mid-spring (H1, 10–20 April), late spring (H2, 15–25 May), early summer (H3, 20–30 June), late summer (H4, 25 July–5 August), early autumn (H5, 30 August–10 October), and late autumn (H6, 5–15 November). The mean RH of each harvest was used to compare the seasonal yield distribution.
The plant height to the top of the highest stem (PH) and the number of nodes on the main stem (NN) were measured on 10 randomly selected shoots (one per crown) in each plot, before the second harvest each season, and averaged. Additionally, approximately 25 days after the last harvest each year, the natural plant height (NPH) was measured on 10 plants per plot. This measurement used a scale from 1 to n with 5 cm increments and served as an indicator of autumn growth habit [16].
To monitor plant persistence, measurements were taken on initial plant density (IPD), final plant density (FPD), and plant survival (Survival). These measurements involved counting plants within a 1.0 m row length in the third and fourth rows of each plot. In the first year, the IPD count was performed at the trifoliate stage (BBCH 12) after establishment. In the subsequent years, the FPD count was conducted in mid-February on overwintering plants, with the FPD count of the previous year serving as the IPD for the following year. Plant survival was then determined annually according to the method outlined by Ventroni et al. (2010) [21] as
2.4. Quality Traits
In the second harvest in each year, all the dried subsamples were ground to pass a 1 mm screen and then analyzed for quality traits. Total nitrogen concentration (%N) was determined using the Kjeldahl method and crude protein concentration (CP) was calculated as %N × 6.25 [30]. Neutral detergent fiber (NDF) and acid detergent fiber (ADF) were measured according to Van Soest et al. [31] using an ANKOM 220 Fiber Analyzer (ANKOM Technology Corporation, 2052 O’Neil Road, Macedon, NY, USA). The relative feed value (RFV) was calculated according to Jeranyama and Garcia [32] as
2.5. Statistical Analyses
The sources of variation and the appropriate F-ratios were estimated through repeated measurement analysis of variance (ANOVA) for combined randomized complete block designs (RCBD) over the years (Y) and locations (L). Genotypes (G) and L were considered as fixed factors and Y as random effects for DMA, quality traits, and agronomic parameters to compare G between Y and L [33]. Two-way ANOVA was performed to compare G across Y within L for RH and one-way ANOVA compared G within each Y and L combination for DMA and DMT.
The Shapiro–Wilk test for normality on standardized conditional residuals indicated that the variables were normally distributed. Additionally, the ANOVA assumptions for the equality of the error variances and residual normality were satisfied based on Levene’s test and the normal quantile-quantile (QQ) plot method, respectively [34].
Means were compared using the LSD test at p < 0.05. Pearson correlation coefficients (r) between the agronomic traits, yield and quality were calculated using the statistical software IBM SPSS package v. 26 (IBM Corp., New York, NY, USA).
The multivariate model G plus G × E interaction (GGE) biplot was utilized to visualize the “which-won-where” pattern for analyzing the GEI within the two-way data matrix (where the environment corresponds to combinations L × Y). This analysis was conducted using the GGE-biplots package in R version 1.0-8 [35], following the methodology outlined by Yan [36].
3. Results
3.1. Growing Conditions
Over the four years of experimentation (2017–2020), the mean daily temperature during the growing season (March–November) in Dolichi averaged 21.5 °C, which was 3.3 °C lower compared to Fanari, where it averaged 24.8 °C. In Fanari, the summer months (June–August) experienced hot temperatures, with a mean daily temperature exceeding 31.0 °C. The coldest winters occurred in 2017 and 2019 for both locations, with Dolichi recording record-low temperatures in January 2017 (−16.7 °C) and 2019 (−14.4 °C). In January, the mean daily temperature was 5.5 °C in Dolichi and 9.1 °C in Fanari (Table 2).
3.2. Dry Matter Yield and Yield Ratios (RH)
The annual dry matter yield (DMA) was significantly influenced by years (Y), locations (L), genotypes (G), and their interactions, including two- and three-way interactions (Table 4). The significant G × Y × L effect suggests that G performance varied across different Y and L. Therefore, evaluation was conducted within each combination of Y × L (Table 5).
Table 4.
F-criterion and the statistical probabilities of the traits determined in 16 lucerne genotypes tested over four years (2017–2020) in two locations.
Table 5.
Comparisons for annual and total dry matter yield (DMA, DMT) of the 16 lucerne cultivars tested over four years (2017–2020) in Dolichi (Dol) and Fanari (Fan).
In the establishment year (2017), the lowest DMA was achieved, with values of 4.7 t/ha in Dolichi and 5.9 t/ha in Fanari, attributed to only three harvests being conducted. Total dry matter yield (DMT) was 10.2% higher in Fanari (63.7 t/ha) compared to Dolichi (57.8 t/ha). Notably, the highest DMA was recorded in Fanari during the second growing season (2018), reaching 20.2 t/ha. However, this yield decreased by 3.6% in 2019 (19.5 t/ha) and by 10.0% in 2020 (18.2 t/ha). Conversely, in Dolichi, the highest DMA was observed in 2019 (18.7 t/ha), declining by 4.5% in 2020.
Comparisons for DMT revealed that the HWA cvs. ‘Kalliopi’ and ‘59N59’ performed significantly better in Fanari, yielding 77.7 t/ha and 75.5 t/ha, respectively. In contrast, the SWA ‘Yliki’ was the highest-yielding in Dolichi, producing 65.5 t/ha (Table 5). The GGE biplot analysis for ranking the cultivars against the “ideal” for DMA and stability showed, in descending order, that the best cultivars across locations were ‘Icon’ > ‘Kalliopi’, ‘59N59’, ‘Blue Ace’, ‘57Q53’, ‘Yliki’, with cv. ‘Icon’ being the most stable (Figure 2). The DMT of cv. ‘Icon’ was inferior by 5.3% and 5.5% compared to the top-performing. In Fanari, the HWA cultivars exhibited a DMT higher by 10.4% (67.8 t/ha) compared to the SWA ones (61.4 t/ha). Conversely, in Dolichi, the DMT of the SWA cultivars was higher by 7.7% (Table 5). The most productive cultivars in terms of DMT, categorized by winter-activity rating, were those with a WAR of 6 in Dolichi, yielding 61.6 t/ha. Conversely, in Fanari, the cultivars classified as WAR 9 and WAR 8 were the best performing, with yields of 68.5 t/ha and 67.2 t/ha, respectively (Table 5). Specifically, the WAR 9 and WAR 8 cultivars yielded 10.5% more than the WAR 6 and WAR 7 cultivars in Fanari. Conversely, in Dolichi, the WAR 6 cultivars had the highest DMA, outperforming the WAR 8 and WAR 9 cultivars by 10.4%.
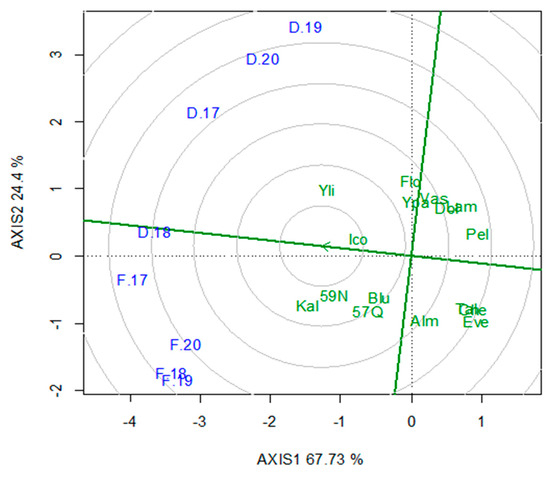
Figure 2.
GGE biplot for ranking 16 lucerne genotypes to the “ideal” for annual dry matter yield (DMA) and stability. Abbreviations: Cultivars are represented by the first three letters, with locations denoted as F for Fanari and D for Dolichi for each year (2017–2020). The center of the concentric circles represented the position of an “ideal” genotype, theoretically a genotype with both high mean DMA and stability. PC1 = 67.73, PC2 = 24.4, Sum = 92.13.
Significant differences were observed between cultivars regarding the seasonal yield distribution, as indicated by RH values (Table 6). Most cultivars exhibited high values during the spring harvests (RH1, RH2), with mean RH1 values of 277 g/kg in Dolichi and 290 g/kg in Fanari, considerably higher than the respective values for summer (RH3, RH4) and autumn harvests (RH5, RH6). Specifically, the combined spring harvests (RH1 + RH2) contributed the most to DMA, with a value of 470 g/kg, surpassing both summer (271 g/kg) and autumn harvests (259 g/kg). Notably, the top-yielding cultivars ‘Kalliopi’, ‘Yliki’, and ‘59N59’ exhibited higher RH1 or RH2 values compared to lower-yielding cultivars.
Table 6.
Comparisons of harvest ratios (RH) for the six harvests in 16 lucerne cultivars tested over four years (2017–2020) in Dolichi (Dol) and Fanari (Fan).
The first spring (RH1) and late-autumn (RH6) harvests were 4.7% higher (290 g/kg vs. 277 g/kg) and 9.3% higher (118 g/kg vs. 108 g/kg), respectively, in Fanari compared to Dolichi. Conversely, the summer harvests (RH3 + RH4) were 9.6% higher in Dolichi.
In Fanari, the top-yielding HWA cv. ‘Kalliopi’ exhibited higher RH1 and RH6 values (by 7.8% and 18.6%, respectively) compared to Dolichi. Similarly, the HWA cv. ‘59N59’ had higher RH1 and RH6 values (by 7.4% and 6.9%, respectively) in Fanari compared to Dolichi. Conversely, the SWA cv. ‘Yliki’ demonstrated 10.1% higher summer yields (RH3 + RH4) in Dolichi compared to Fanari (Table 6).
Regarding the seasonal yield distributions, the two WAR classes, SWA and HWA, exhibited a similar declining trend, with high spring yields (RH1 + RH2) followed by lower summer (RH3 + RH4) and autumn (RH5 + RH6) yields.
However, two significant crossover interactions were observed: the first in summer harvests (RH3 and RH4), where the SWA cultivars demonstrated significantly higher summer yields, and the second in late autumn (RH6), where the HWA cultivars outperformed the SWA cultivars (Figure 3).
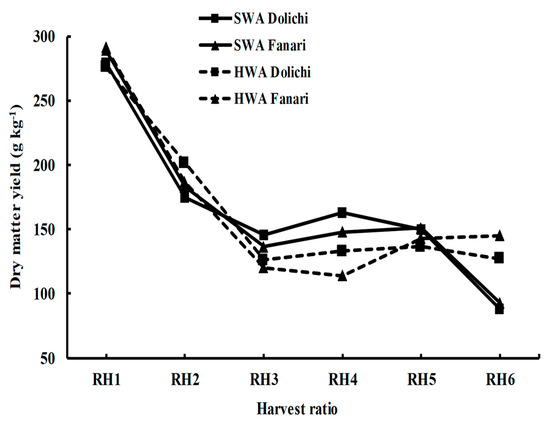
Figure 3.
Comparison of six harvest ratios (RH, g kg−1) between two winter activity rating classes (semi-winter-active, SWA; highly-winter-active, HWA) of 16 lucerne cultivars tested in Dolichi and Fanari for four years. Where H1, mid-spring; H2, late spring; H3, early summer; H4, late summer; H5, early autumn; H6, late autumn.
3.3. Agronomic Traits
Significant interactions between cultivars L and Y indicated the variable performance in plant height (PH), number of nodes (NN), natural plant height (NPH), and final plant density (FPD) (Table 4).
In the warmer climate of Fanari, the plants exhibited higher PH, NN, and NPH (Table 7). In Dolichi, the top-yielding cultivars were taller (>82.1 cm) compared to low-yielding cultivars, but this trend was not confirmed in Fanari. For example, the low-yielding cultivar ‘Evergreen’ reached a height of 90.0 cm. Similarly, regarding NN, the top-yielding cultivars had more NN in Dolichi, but this trend was not consistent in Fanari. The SWA cultivars had higher NN compared to the HWA ones in both sites. The two locations showed a strong correlation (r = 0.96, p < 0.01) in terms of autumn growth, as evidenced by NPH (Table 7).
Table 7.
Comparisons of plant height (PH), number of nodes (NN), and natural plant height (NPH) for the 16 lucerne cultivars tested over four years (2017–2020) in Dolichi (Dol) and Fanari (Fan).
Plant survival was lower in Dolichi (especially after the first cold winter in 2017), where the mean survival was 38.9% compared to 53.0% in Fanari. After the second, colder winter in 2019, the survival dropped to 24.9% in Dolichi and 36.7% in Fanari (Table 8). The final plant density (FPD), after the last harvest of the SWA cultivars in Dolichi, was double compared to that of the HWA (84.1 vs. 42.3 plants/m2), while no significant differences were found in Fanari. The SWA cvs. ‘Yliki’ and ‘Icon’ had almost double the FPD (99.9 and 98.4 plants/m2, respectively) compared to the HWA cvs. ‘Kalliopi’ and ‘59N59’ (56.7 and 55.1 plants/m2, respectively) in Dolichi.
Table 8.
Comparisons of initial plant density (IPD) in the establishment (2017), final plant density (FPD) after the last year (2020), and plant survival (Survival) in each year for the 16 lucerne genotypes tested over four years (2017–2020) in Dolichi (Dol) and Fanari (Fan).
Moderate to strong correlations were found for DMT with RH1, PH, NN, NPH, and survival (Table 9). The strongest correlations were realized in Dolichi, where DMT was positively correlated with RH1, PH, NN, and survival (r = 0.68, 0.73, 0.76 and 0.83, p < 0.01, respectively). In Fanari, DMT was moderately correlated with RH1 and weakly with PH and survival. The DMT was weakly correlated with NPH, negatively in Dolichi (r = −0.50, p < 0.05), and positively in Fanari (r = 0.50, p < 0.05). There were no significant correlations between any other harvest ratio with DMT.
Table 9.
Correlation coefficients for total dry matter yield (DMT), dry matter ratio at first harvest (RH1; mid-spring), plant height (PH), number of nodes (NN), natural plant height (NPH), and plant survival (Survival) for each location (Dolichi, Fanari) for the four growing seasons.
3.4. Forage Quality
Significant differences between cultivars were found for crude protein concentration (CP), neutral detergent fiber (NDF), acid detergent fiber (ADF) and relative feed value (RFV). Also, the two-way interactions (G × Y and G × L) were significant, while the three-way interaction (G × Y × L) was not significant only for CP (Table 4).
Cultivars ‘Icon’ and ‘Yliki’ exhibited the highest CP in both locations, ranging from 232 to 246 g/kg (Table 10). Additionally, CP was consistently higher in SWA cultivars in both locations. There were no significant differences among cultivars for NDF in either location, while for ADF significant but small differences were observed among cultivars in Dolichi. The RFV ranged from 152.1 in Fanari to 170.6 in Dolichi. Among the cultivars with high DMT, cv. ‘59N59’ exhibited high RFV in Dolichi, while minor differences were observed in Fanari.
Table 10.
Comparisons of protein concentration (CP), neutral detergent fiber (NDF), acid detergent fiber (ADF), and relative feed value (RFV) for the 16 lucerne cultivars tested over four years (2017–2020) in Dolichi (Dol) and Fanari (Fan).
Moderate to strong correlations were found between quality and agronomic traits, with the most important relations regarding CP and NN. Crude protein concentration was positively correlated with NN (r = 0.75 in Dolichi and r = 0.81 in Fanari).
4. Discussion
4.1. Cultivar and WAR Classes Adaptation to the Microenvironments
Exploiting GEI, by selecting cultivars tailored to specific microenvironments holds significant promise for enhancing productivity and sustainability in lucerne cropping systems [37]. However, considering frequent climatic extremes, cultivar productivity must be balanced with stability and resilience [7]. The GGE biplot analysis for yield uncovered crossover interactions, indicating different top-performing cultivars in the two locations. Thus, the HWA cvs. ‘Kalliopi’ and ‘59N59’ were well-adapted to Fanari, the more productive site, while the SWA cv. ‘Yliki’ matched with Dolichi, furthermore, the SWA cv. ‘Icon’ demonstrated the highest stability and adaptability across both microenvironments, though less productive as compared to the top-yielding cultivars. In a broader context, across the USA and Canada, cultivar stability was unrelated to productivity, with resilience negatively correlated with productivity [7].
Given the well-irrigated conditions of the trials, it is evident that the temperature difference during the growing season played a pivotal role in the observed crossover interactions. Considering the base growth temperature of 5 °C for field-grown alfalfa, and depending on genotype, plants could become less winter-active in Dolichi, whereas they remained quite active in Fanari [38].
The comparison between the WAR classes revealed a distinct response in the two microenvironments. Specifically, WAR 6 cultivars (e.g., ‘Yliki’) exhibited a 10.4% higher yield in Dolichi, whereas WAR 9 and WAR 8 cultivars (e.g., ‘Kalliopi’, ‘58N59’) produced 10.5% more in Fanari. Photoperiodism and air temperatures during autumn and winter play crucial roles in determining WAR, a trait that defines lucerne adaptation to varying climatic conditions [20]. Non-dormant cultivars are more productive in regions with mild winters because of the higher shoot elongation in autumn and faster regrowth after cutting. On the other hand, dormant cultivars have reduced shoot elongation and decumbent shoot orientation in autumn, but generally possess greater winter hardiness [21,39].
The assessment of seasonal yield distribution (RH) proved effective in exploiting cultivar adaptive responses concerning the WAR effect [25]. The spring and autumn harvests demonstrated greater productivity in Fanari, whereas summer yields were elevated in Dolichi. Accordingly, the two WAR classes exhibited crossover interactions; the HWA class displayed higher yields in spring and autumn, while the SWA class performed better in summer. In Fanari, the HWA cvs. ‘Kalliopi’ and ‘59N59’ showed greater responsiveness in autumn. Contrastingly, in Dolichi, the most responsive cultivar during summer was the SWA cv. ‘Yliki’. Previously, under irrigated, warm conditions in central Greece, HWA cultivars yielded higher in autumn, but certain native SWA cultivars were equally productive due to their higher yields in summer [26].
It has been reported that the peak DMA in lucerne can be achieved either in the second and third growing years or in the third and fourth ones [40,41]. In the present study, the highest DMA was obtained in the second growing season in Fanari, possibly because the warmer conditions enhanced faster growth. Conversely, in the cooler site Dolichi, the peak DMA was reached in the third season. The DMA decreased as the stand aged, but certain cultivars showed more persistence in aging. Environmental and management stresses can weaken plants, making them more susceptible to a combination of environmental stresses, resident insects, and pathogens, ultimately leading to their demise [24]. In our study, the HWA cultivars had nearly half the percentage of overwintered plants compared to the SWA genotypes under the harsh winters in Dolichi; however, no differentiation was evident under the mild winters in Fanari. Consequently, plant survival was a more indicative measure of productivity in Dolichi (r = 0.83) than in Fanari (r = 0.57). Winter hardiness in lucerne encompasses two processes: low-temperature acclimation in autumn and freezing-tolerance adaptation in winter [19,42,43]. Acclimation induced by falling temperatures and shortening photoperiods in early autumn is characterized by a reduced rate of aboveground biomass accumulation, with photosynthetic products being allocated to the rooting system to ensure cold tolerance [20,44]. Strong associations between autumn dormancy and winter hardiness have been documented [45], but breeders have successfully decoupled fall dormancy from winter hardiness, enabling optimization of cultivars for both traits [46,47].
Specific adaptation is crucial for optimal yield expression [48]. One method of improving locally adapted forage legumes has been to hybridize ecotypes with elite populations to leverage specific adaptation effects commonly found in landraces and natural populations [4,49]. Moreover, crossing between lucerne populations exhibiting high per se performance and varying WAR may provide a pathway to developing populations suited to environments with intermittent freezing conditions [50]. Greek lucerne genotypes have demonstrated winter hardiness even under local and even colder conditions, suggesting their utility as sources of cold tolerance [51,52]. An additional strategy involves introducing elite lucerne cultivars with specific autumn dormancy levels that match the winter hardiness needs of their target region [53].
Forage production in many parts of the Mediterranean region is expected to face challenges due to climate change, resulting in shifting growing seasons towards autumn–winter–spring due to drier, longer summers accompanied by severe heat waves [15]. Additionally, declining water tables and increased demand for urban water use have sparked interest in cultivating lucerne under alternative management systems, such as rainfed conditions or without irrigation during summer. Consequently, genotype × management system interactions should be considered [54,55]. These circumstances underscore the need for selecting cultivars with increased yield stability and resilience. Although cultivar productivity has increased with the year of cultivar release, stability has remained unchanged, while resilience to withstand climatic extremes (e.g., drought) has decreased [7]. The points emphasized above underscore the critical need for implementing regional breeding programs with tailored breeding strategies. Specifically, for high elevations, the selection of winter-hardy germplasm with enhanced spring–autumn productivity and accelerated growth immediately after establishment is imperative. Conversely, in lowlands, improving heat tolerance and summer productivity is essential. Early screening could be conducted in each target environment to optimize productivity through specific adaptation. Yet, advanced lines’ testing should take place across various environments, the marginal included, for exploiting GEI and genotype × management system interactions and selecting for increased stability and resilience.
4.2. Variation in Agronomic Traits
Lucerne genotypes exhibit significant variation in stem length and node number [56]. Despite being strongly influenced by environmental factors, these traits are heritable and easy to measure, making them cost-effective indirect selection indices for evaluating DM potential and quality [57]. In the present study, the PH and NN were more indicative assessments of DMT in the cool environment of Dolichi (r ≥ 0.73) than in Fanari (r ≤ 0.50).
The NPH serves as a proxy for lucerne growth in autumn and helps assess cultivar’s WAR by ranking cultivars based on their autumn growth. While WAR is primarily genetically determined, GEI plays a significant role, influenced by location [16]. This study reaffirmed the significant genetic influence on NPH and, by extension, WAR, as the cultivar ranking for NPH remained consistent across both locations.
4.3. Forage Quality
The nutritive value of lucerne is linked to high CP, RFV, and low NDF and ADF (Annicchiarico et al. 2015) [4]. In this study, lucerne hay demonstrated high quality based on CP (162–246 g/kg), NDF (352–426 g/kg), ADF (243–355 g/kg), and RFV (>140.4) [58]. The SWA cultivars, notably ‘Yliki’ and ‘Icon’, exhibited higher CP levels. Differentiation between cultivars for NDF, ADF and RFV was minimal across locations. Despite the absence of a relationship between cultivar release date and quality, improvements in forage quality can be achieved through agronomic practices [6,59]. Notably, CP levels correlated with high NN, reflecting a relationship between NN and leaf/stem ratio, and subsequently, CP levels [57].
5. Conclusions
Our results underscored the importance of aligning cultivar winter activity and hardiness with specific microenvironments. The SWA cultivars demonstrated superior yields in high-elevation cool sites, attributed to their heightened winter hardiness and increased yields during summer. In contrast, the HWA cultivars excelled in warm, low-elevation sites, benefiting from the absence of winter-related reductions in plant population and the enhanced spring and autumn yield. Additionally, stability analyses revealed trade-offs between productivity and stability, with the most stable and resilient cultivar, showing lower productivity. It is recommended that early screening occur regionally to exploit specific adaptations. Advanced line testing could be conducted interregional to exploit genotype stability and resilience. Specifically, in cooler, high-elevation sites, breeders could aim to decouple fall dormancy from winter hardiness and select germplasm that is more winter-active and hardy, enabling the optimization of cultivars for both traits. Conversely, in the lowlands, the focus could be on improving heat tolerance and summer productivity to achieve optimal yield expression and adaptation to anticipated climatic changes.
Funding
This research received no external funding.
Data Availability Statement
The data presented in this study are available on request from the corresponding author. The data are not publicly available due to privacy restrictions.
Acknowledgments
We thank I.T. Tsialtas Aristotle University of Thessaloniki, Faculty of Agriculture, Lab. of Agronomy for his extensive ending, the staff of the Institute of Industrial and Forage Crops, and the two farmers for conducting the cultivation work.
Conflicts of Interest
The author declares no conflicts of interest.
References
- Brough, R.C.; Robison, L.R.; Jackson, R.H. The historical diffusion of alfalfa. J. Agron. Educ. 1997, 6, 13–19. [Google Scholar] [CrossRef]
- Hellenic Statistical Authority. Fodder Plants for Hey. Areas and Production, by Region and Regional Unities. Available online: https://www.statistics.gr/en/statistics/-/publication/SPG06/ (accessed on 25 October 2020).
- Annicchiarico, P. Diversity, genetic structure, distinctness and agronomic value of Italian lucerne (Medicago sativa L.) landraces. Euphytica 2006, 148, 269–282. [Google Scholar] [CrossRef]
- Annicchiarico, P.; Barrett, B.; Brummer, E.C.; Julier, B.; Marshal, A.H. Achievements and challenges in improving temperate perennial forage legumes. Crit. Rev. Plant Sci. 2015, 34, 327–380. [Google Scholar] [CrossRef]
- Biazzi, E.; Nazzicari, N.; Pecetti, L.; Brummer, E.C.; Palmonari, A.; Tava, A.; Annicchiarico, P. Genome wide association mapping and genomic selection for lucerne (Medicago sativa) forage quality traits. PLoS ONE 2017, 12, e0169234. [Google Scholar] [CrossRef] [PubMed]
- Lamb, J.F.S.; Sheaffer, C.C.; Rhodes, L.H.; Sulc, R.M.; Undersander, D.J.; Brummer, E.C. Five decades of lucerne cultivar improvement: Impact on forage yield, persistence, and nutritive value. Crop Sci. 2006, 46, 902–909. [Google Scholar] [CrossRef]
- Picasso, V.D.; Casler, M.D.; Undersander, D. Resilience, stability, and productivity of lucerne cultivars in rainfed regions of north America. Crop Sci. 2019, 59, 800–810. [Google Scholar] [CrossRef]
- Allard, R.W.; Bradshaw, A.D. Implications of genotype-environment interaction in applied plant breeding. Crop Sci. 1964, 4, 503–508. [Google Scholar] [CrossRef]
- Kang, M.S. Using genotype-by-environment interaction for crop cultivar development. Adv. Agron. 1997, 62, 199–252. [Google Scholar] [CrossRef]
- Hakl, J.; Mofidian, S.M.A.; Kozova, Z.; Fuksa, P.; Jaromír, S. Estimation of lucerne yield stability for enabling effective cultivar selection under rainfed conditions. Grass Forage Sci. 2019, 74, 687–695. [Google Scholar] [CrossRef]
- Annicchiarico, P.; Piano, E. Use of artificial environments to reproduce and exploit genotype × location interaction for lucerne in northern Italy. Theor. Appl. Genet. 2005, 110, 219–227. [Google Scholar] [CrossRef]
- Annicchiarico, P.; Pecetti, L.; Torricelli, R. Impact of landrace germplasm, non-conventional habit and regional cultivar selection on forage and seed yield of organically grown lucerne in Italy. J. Agric. Sci. 2012, 150, 345–355. [Google Scholar] [CrossRef]
- Annicchiarico, P. Advances in the definition of adaptation strategies and yield-stability targets in breeding programs. In Quantitative Genetics, Genomics and Plant Breeding, 2nd ed.; Kang, M.S., Ed.; CAB International: Wallingford, UK, 2020; pp. 194–209. [Google Scholar] [CrossRef]
- Tsialtas, J.T.; Baxevanos, D.; Maslaris, N. Chlorophyll meter readings, leaf area index, and their stability as assessments of yield and quality in sugar beet cultivars grown in two contrasting environments. Crop Sci. 2014, 54, 265–273. [Google Scholar] [CrossRef]
- Ergon, Å.; Seddaiu, G.; Korhonen, P.; Virkajärvi, P.; Bellocchi, G.; Jørgensen, M.; Østrem, L.; Reheul, D.; Volaire, F. How can forage production in Nordic and Mediterranean Europe adapt to the challenges and opportunities arising from climate change? Eur. J. Agron. 2018, 92, 97–106. [Google Scholar] [CrossRef]
- Teuber, L.R.; Taggard, K.L.; Gibbs, L.K.; McCaslin, M.A.; Peterson, M.A.; Barnes, D.K. Fall Dormancy: Standard Tests to Characterize Lucerne Cultivars. Available online: http://www.naaic.org/stdtests/Dormancy2.html (accessed on 12 September 2019).
- Lattimore, M.-A. Lucerne Varieties. Prime Fact 1306 First Edition. Available online: https://www.dpi.nsw.gov.au/agriculture/pastures-and-rangelands/species-varieties/pf/factsheets/lucerne-varieties (accessed on 5 June 2013).
- Pembleton, K.G.; Cunningham, S.M.; Volenec, J.J. Effect of summer irrigation on seasonal changes in taproot reserves and the expression of winter dormancy/activity in four contrasting lucerne cultivars. Crop Pasture Sci. 2010, 61, 873–884. [Google Scholar] [CrossRef]
- Rimi, F.; Macolino, S.; Leinauer, B.; Lauriault, L.M.; Ziliotto, U. Fall dormancy and harvest stage impact on lucerne persistence in a subtropical climate. Agron. J. 2014, 106, 1258–1266. [Google Scholar] [CrossRef]
- Djaman, K.; Owen, C.; Koudahe, K.; O’Neill, M. Evaluation of different fall dormancy-rating lucerne cultivars for forage yield in a semiarid environment. Agronomy 2020, 10, 146. [Google Scholar] [CrossRef]
- Ventroni, L.M.; Volenec, J.J.; Cangiano, C.A. Fall dormancy and cutting frequency impact on lucerne yield and yield components. Field Crops Res. 2010, 119, 252–259. [Google Scholar] [CrossRef]
- Lambers, H.; Oliveira, R.S. Plant energy budgets: Effects of radiation and temperature. In Plant Physiological Ecology, 3rd ed.; Lambers, H., Chapin, F.S., Pons, T.L., Eds.; Springer: Cham, Switzerland, 2019; pp. 279–288. [Google Scholar]
- Xu, L.; Liu, Q.; Nie, Y.; Li, F.; Yang, G.; Tao, Y.; Lv, S.; Wu, X.; Ye, L. A multi-site evaluation of winter hardiness in indigenous lucerne cultivars in northern China. Atmosphere 2021, 12, 1538. [Google Scholar] [CrossRef]
- Beuselinck, P.R.; Bouton, J.H.; Lam, W.O.; Matches, A.G.; McCaslin, M.H.; Nelson, C.J.; Rhodes, L.H.; Sheaffer, C.C.; Volenec, J.J. Improving legume persistence in forage crop systems. J. Prod. Agric. 1994, 7, 311–322. [Google Scholar] [CrossRef]
- Baxevanos, D.; Loka, D.; Tsialtas, I.T. Evaluation of lucerne cultivars under rainfed Mediterranean conditions. J. Agric. Sci. 2021, 159, 281–292. [Google Scholar] [CrossRef]
- Baxevanos, D.; Voulgari, O.; Pankou, C.; Yiakoulaki, M.; Tsialtas, I.T. Comparing adaptive responses of new and old lucerne genotypes under irrigated Mediterranean conditions. Crop Pasture Sci. 2022, 73, 679–691. [Google Scholar] [CrossRef]
- Peel, M.C.; Finlayson, B.L.; McMahon, T.A. Updated world map of the Köppen-Geiger climate classification. Hydrol. Earth Syst. Sci. 2007, 11, 1633–1644. [Google Scholar] [CrossRef]
- Enriquez-Hidalgo, D.; Cruz, T.; Teixeira, D.L.; Steinfort, U. Phenological stages of Mediterranean forage legumes, based on the BBCH scale. Ann. Appl. Biol. 2020, 176, 357–368. [Google Scholar] [CrossRef]
- Pembleton, K.G.; Smith, R.S.; Rawnsley, R.P.; Donaghy, D.J.; Humphries, A.W. Genotype by environment interactions of lucerne (Medicago sativa L.) in a cool temperate climate. Crop Pasture Sci. 2010, 61, 493–502. [Google Scholar] [CrossRef]
- AOAC. Official Methods of Analysis; Association of Official Analytical Chemists: Gaithersburg, MD, USA, 2000. [Google Scholar]
- Van Soest, P.J.; Robertson, J.B.; Lewis, B.A. Methods for dietary fiber, neutral detergent fiber, and nonstarch polysaccharides in relation to animal nutrition. J. Dairy Sci. 1991, 74, 3583–3597. [Google Scholar] [CrossRef] [PubMed]
- Jeranyama, P.; Garcia, A.D. Understanding Relative Feed Value (RFV) and Relative Forage Quality (RFQ). SDSU Extension Extra, Paper 352. 2004. Available online: https://openprairie.sdstate.edu/cgi/viewcontent.cgi?article=1351&context=extension_extra (accessed on 8 January 2004).
- McIntosh, M.S. Analysis of combined experiments. Agron. J. 1983, 75, 153–155. [Google Scholar] [CrossRef]
- Kozak, M.; Piepho, H.-P. What’s normal anyway? Residual plots are more telling than significance tests when checking ANOVA assumptions. J. Agron. Crop Sci. 2018, 204, 86–98. [Google Scholar] [CrossRef]
- Frutos, E.; Galindo, M.P.; Leiva, V. An interactive biplot implementation in R for modeling genotype-by-environment interaction. Stoch. Environ. Res. Risk Assess. 2014, 28, 1629–1641. [Google Scholar] [CrossRef]
- Yan, W. Singular-value partitioning in biplot analysis of multi-environment trial data. Agron. J. 2002, 94, 990–996. [Google Scholar] [CrossRef]
- Annicchiarico, P. Breeding gain from exploitation of regional adaptation: An lucerne case study. Crop Sci. 2021, 61, 2254–2270. [Google Scholar] [CrossRef]
- Sharratt, B.S.; Sheaffer, C.C.; Baker, D. Base temperature for the application of the growing-degree-day model to field-grown alfalfa. Field Crops Res. 1989, 21, 95–102. [Google Scholar] [CrossRef]
- Marquez-Ortiz, J.J.; Lamb, J.F.S.; Johnson, L.D.; Barnes, D.K.; Stucker, R.E. Heritability of crown traits in alfalfa. Crop Sci. 1999, 39, 38–43. [Google Scholar] [CrossRef]
- Luo, X.Y.; Li, H.; Wang, F.G. Analysis of correlation and path on lucerne yield with different environments and years. In Prospects of Grassland Science and Industry for the 21st Century. Paper Collection of International Conference on Grassland Science and Industry; Chinese Grassland Society/China Association of Agricultural Societies: Beijing, China, 2001; pp. 351–354. [Google Scholar]
- Zhang, T.J.; Kang, J.M.; Guo, W.S.; Zhao, Z.X.; Xu, Y.P.; Yan, X.D.; Yang, Q.C. Yield evaluation of twenty-eight lucerne cultivars in Hebei province of China. J. Integr. Agric. 2014, 13, 2260–2267. [Google Scholar] [CrossRef]
- Brummer, E.C.; Shah, M.M.; Luth, D. Reexamining the relationship between fall dormancy and winter hardiness in alfalfa. Crop Sci. 2000, 40, 971–977. [Google Scholar] [CrossRef]
- Kallenbach, R.L.; Nelson, C.J.; Coutts, J.H. Yield, quality, and persistence of grazing- and hay-type lucerne under three harvest frequencies. Agron. J. 2002, 94, 1094–1103. [Google Scholar] [CrossRef]
- Lei, Y.; Hannoufa, A.; Yu, P. The use of gene modification and advanced molecular structure analyses towards improving lucerne forage. Int. J. Mol. Sci. 2017, 18, 298. [Google Scholar] [CrossRef] [PubMed]
- Schwab, P.M.; Barnes, D.K.; Sheaffer, C.C. The relationship between field winter injury and fall growth score for 251 alfalfa cultivars. Crop Sci. 1996, 36, 418–426. [Google Scholar] [CrossRef]
- Weishaar, M.A.; Brummer, E.C.; Volenec, J.J.; Moore, K.J.; Cunningham, S. Improving winter hardiness in nondormant lucerne germplasm. Crop Sci. 2005, 451, 60–65. [Google Scholar] [CrossRef]
- Jungers, J.M.; Brakke, M.; Rendahl, A.; Sheaffer, C.C. Identifying base temperature for lucerne germination: Implications for frost seeding. Crop Sci. 2016, 56, 2833–2840. [Google Scholar] [CrossRef]
- Oliveira, J.A.; Lopez, J.E.; Palencia, P. Agromorphological characterization, cyanogenesis and productivity of accessions of white clover (Trifolium repens L.) collected in northern Spain. Czech J. Genet. Plant Breed. 2013, 49, 24–35. [Google Scholar] [CrossRef]
- Bouton, J.H.; Woodfield, D.R.; Hoveland, C.S.; McCann, M.A.; Caradus, J.R. Enhanced survival and animal performance from ecotype derived white clover cultivars. Crop Sci. 2005, 45, 1596–1602. [Google Scholar] [CrossRef]
- Bhandari, H.S.; Pierce, C.A.; Murray, L.W.; Ray, I.M. Combining abilities and heterosis for forage yield among high-yielding accessions of the lucerne core collection. Crop Sci. 2007, 47, 665–673. [Google Scholar] [CrossRef]
- Kontsiotou, E.K. Lucerne Cultivation and Use; Agrotypos SA Publications: Athens, Greece, 2005. (In Greek) [Google Scholar]
- Katić, S.; Mihailović, V.; Milić, D.; Karagić, Đ.; Mikić, A. Divergence of lucerne cultivars depending on geographic origin. Nat. Montenegrina 2004, 3, 197–202. [Google Scholar]
- McKenzie, J.S.; Paquin, R.; Duke, S.H. Cold and heat tolerance. In Lucerne and Lucerne Improvement; Hanson, A.A., Barnes, D.K., Hill, R.R., Eds.; American Society of Agronomy Inc.; Crop Science Society of America Inc.; Soil Science Society of America Inc.: Madison, WI, USA, 1988; pp. 259–302. [Google Scholar] [CrossRef]
- Annicchiarico, P.; Pecetti, L.; Abdelguerf, A.; Bouizgaren, A.; Carroni, A.M.; Hayek, T.; M’Hammadi Bouzina, M.; Mezni, M. Adaptation of landrace and variety germplasm and selection strategies for lucerne in the Mediterranean basin. Field Crops Res. 2011, 120, 283–291. [Google Scholar] [CrossRef]
- Achir, C.; Annicchiarico, P.; Pecetti, L.; Khelifi, H.E.; M’Hammedi-Bouzina, M.; Abdelguerfi, A.; Laouar, M. Adaptation patterns of sixteen lucerne (Medicago sativa L.) cultivars across contrasting environments of Algeria and implications for the crop improvement. Ital. J. Agron. 2020, 15, 57–62. [Google Scholar] [CrossRef]
- Rotili, P.; Gnocchi, G.; Scotti, C. Lucerne breeding for dehydration: Allometric growth and quality. In Proceedings of the 21st Eucarpia Fodder Crops and Amenity Grasses Meeting, Breeding for a Multifunctional Agriculture, Kartause Ittingen, Switzerland, 9–12 September 1997; Boller, B., Stadelmann, F.J., Eds.; FAL: Zürich, Switzerland, 1998; pp. 20–23. [Google Scholar]
- Annicchiarico, P.; Scotti, C.; Carelli, M.; Pecetti, L. Questions and avenues for lucerne improvement. Czech J. Genet. Plant Breed. 2010, 46, 1–13. [Google Scholar] [CrossRef]
- Undersander, D. The New Relative Forage Quality Index-Concept and Use; World’s Forage Superbowl Contest, UWEX: Madison, WI, USA, 2003. [Google Scholar]
- Veronesi, F.; Huyghe, G.; Delgado, I. Lucerne breeding in Europe: Results and research strategies for future developments. Pastos 2006, 36, 143–158. [Google Scholar]
Disclaimer/Publisher’s Note: The statements, opinions and data contained in all publications are solely those of the individual author(s) and contributor(s) and not of MDPI and/or the editor(s). MDPI and/or the editor(s) disclaim responsibility for any injury to people or property resulting from any ideas, methods, instructions or products referred to in the content. |
© 2024 by the author. Licensee MDPI, Basel, Switzerland. This article is an open access article distributed under the terms and conditions of the Creative Commons Attribution (CC BY) license (https://creativecommons.org/licenses/by/4.0/).