Article

Transformation of Discarded Pumpkin into High-Value Powder: A Drying Process Model for Functional Food Ingredients

by
Iside Mut
1,†,
Daniela Zalazar-García
1,†,
María Celia Román
1,
Yanina Baldán
1,
Anabel Fernandez
1,
María Paula Fabani
1,2,
Alberto P. Blasetti
3,
Germán Mazza
4 and
Rosa Rodriguez
1,*
1
Instituto de Ingeniería Química, Facultad de Ingeniería, Grupo Vinculado al PROBIEN (Universidad Nacional de San Juan, CONICET, Universidad Nacional del Comahue), San Juan P.C. J5400, Argentina
2
Instituto de Biotecnología—Facultad de Ingeniería, Universidad Nacional de San Juan, San Juan P.C. J5400, Argentina
3
Departamento de Ingeniería Química, Facultad de Ingeniería, Universidad Nacional de la Patagonia San Juan Bosco, Chubut P.C. U9000, Argentina
4
Instituto de Investigación y Desarrollo en Ingeniería de Procesos, Biotecnología y Energías Alternativas, PROBIEN (CONICET, Universidad Nacional del Comahue), Neuquén P.C. N8300, Argentina
*
Author to whom correspondence should be addressed.
These authors contributed equally to this work.
Agronomy 2024, 14(7), 1424; https://doi.org/10.3390/agronomy14071424
Submission received: 24 May 2024 / Revised: 26 June 2024 / Accepted: 28 June 2024 / Published: 30 June 2024

Abstract

:
Large quantities of pumpkins, rich in valuable nutrients, are lost due to superficial imperfections or size variations. This study explores a solution: transforming this unused resource into a highly functional food ingredient-pumpkin powder obtained from dehydration. This study emphasizes the importance of a detailed particle-level mathematical model in dehydrator design and operation, particularly for drying conditions using air at temperatures between 333 K and 353 K. The model investigates the effect of sample geometry on the moisture reduction rate and the product quality. Here, a model considers mass and energy transport, including the shrinkage ratio of the samples. The results effectively demonstrate the deformation, moisture content, and temperature evolution within the samples throughout the drying process. The findings reveal that both the drying temperature and initial sample geometry significantly influence the moisture loss rate, the final product texture, and the powder’s absorption capacity. Notably, the nutritional composition (except for lipids) remains largely unaffected by the drying process. Additionally, the bulk and compacted densities of the powders decrease with increasing temperature. These insights not only illuminate the performance of the drying process but also provide valuable knowledge regarding the dehydrated product’s technological behavior and potential functionalities within various food applications.

1. Introduction

The agricultural sector generates significant volumes of underutilized or discarded produce due to imperfect size, blemishes, and spoilage after harvest. Despite their potential nutritional value, these discarded pumpkins often fail to enter commercial markets, leading to economic losses and food waste.
Pumpkins, Cucurbita moschata, have a wealth of dietary fiber, carotenoids, and vitamins [1,2]. They have an important beta-carotene content, which converts into vitamin A in humans and lends their vibrant yellow or orange color [3,4]. Studies suggest beta-carotene consumption may lower the risk of eye problems, cancer, and skin diseases [4,5].
On the other hand, the deterioration of fresh products, including fruits and vegetables, is a microbiological process that gradually alters the food’s color, texture, flavor, nutritional qualities, and edibility. The consumption of spoiled food can lead to illnesses and, in severe cases, even death [6]. Drying, particularly convective drying, is a powerful ally in safeguarding food quality, especially those containing high moisture. This technique effectively hinders the enzymatic activity and microbial growth, ensuring the shelf life of food [7,8,9]. Dehydration unlocks the potential of these vegetables, transforming them into versatile flours. Research has convincingly shown that these flours significantly elevate the nutritional value of processed foods [10,11], opening a new avenue for fortifying bakery products, a cornerstone food in child nutrition programs, elderly care facilities, and low-income communities. During pumpkin processing, peels are often discarded as waste. However, these peels contain valuable nutrients like protein and fiber, making them a potential food source. To address this issue, Román et al. [12] investigated dehydrating pumpkin peels using a fluidized bed contactor. Their study found that, while higher drying temperatures decrease the drying time and exergy efficiency, they also lead to a greater environmental impact. Considering this trade-off, the authors recommend drying at 70 °C. This temperature offers a favorable balance between faster drying times due to the increased diffusion and mass transfer, and a minimal impact on nutrient content.
Fruits and vegetables pose unique challenges in dehydration. Their intricate cellular structure, characterized by varying pore sizes and cell orientations, presents a remarkable obstacle to understanding the drying process [13]. This structural complexity encompasses cellular tissues, intercellular spaces, and cell walls, each harboring distinct water behaviors. Understanding the intricate interplay between these diverse components during drying remains a scientific frontier.
Vegetable drying involves heat and mass transfer, leading to vegetable shrinkage (size and shape changes) [14]. Water exiting the pores creates pressure that pulls on the solid structure, causing shrinkage [15,16]. This contraction slows moisture removal due to less surface area being available for evaporation [17]. Consequently, shrinkage can worsen porosity, alter microstructure [18], hinder mass transfer rate [19], and affect rehydration patterns [20,21,22].
Chandramohan [23] reported that 29% of academic papers on food drying use empirical, semi-empirical, or analytical approaches, often solving equations to model Fick’s second law. However, these models fail to explain heat and mass transfer mechanisms. Numerical models, which predict temperature and moisture distributions, are better at identifying changes like color and nutrient degradation. Katekawa and Silva [24] noted that most studies overlook the coupling between transport phenomena and shrinkage. Sandoval-Torres et al. [9] developed a 1D model for potato slice drying, accurately reflecting experimental data but not addressing other food geometries. Agrawal and Methekar [25] created a model for pumpkin particles, showing qualitative agreement with the literature but not accounting for shrinkage.
Numerical models excel at predicting the evolving temperature and moisture distributions within food during drying, allowing us to identify undesirable temperature-related changes like color and nutrient degradation [25,26].
On the other hand, the conversion of residual waste into value-added biochar is relevant. In this sense, several authors have studied this approach, such as Nan et al. [27], who investigated the preparation of ball-milled biochar for activating peroxydisulfate (PDS) to degrade tetracycline hydrochloride (TCH). They found that ball-milling enhances biochar’s electron transport capabilities, thereby improving PDS activation for TCH degradation, and they detailed the degradation pathways and mineralization of TCH. Zalazar-García et al. [28] evaluated the pyrolysis of 12 types of bio-waste using the Cape Open to Cape Open Simulator (COCO) software. The study predicted the yields of biochar, bio-oil, and gas, and calculated the energy, water consumption, and CO2 emissions for each type of bio-waste. Significant variations in resource consumption and environmental impact were identified based on the type of bio-waste and pyrolysis conditions. Fernandez et al. [29] examined the co-pyrogasification kinetics of municipal solid waste (MSW). Their findings reveal that MSW is a solid matrix that is more easily treated on thermochemical platforms, with kinetic and thermodynamic parameters favoring its processing.
Previous research has highlighted the significance of temperature and sample geometry on the drying kinetics of various food materials [30,31,32,33]. It is well documented that higher drying temperatures generally lead to faster moisture removal and shorter drying times. However, the magnitude of this effect can vary significantly based on the geometry of the sample. For instance, samples with larger surface areas exposed to hot air, such as pumpkin cubes, tend to exhibit more rapid moisture loss compared to samples with smaller surface areas, such as pumpkin puree slices.
This highlights the necessity of including comprehensive modeling to support or refute findings, providing a clear context for the results. Thus, this study shows that particle-level modeling, which incorporates the effects of shrinkage, successfully addresses the limitations of empirical models. By accurately predicting the behavior of different geometries and capturing the complex phenomena occurring during drying, this approach offers a more robust and reliable method for optimizing the drying processes. Consequently, particle-level modeling allows for better control and efficiency in the drying process, ultimately leading to higher-quality final products.
Thus, the current literature presents limited studies [25,34] on the effect of sample geometry and air temperature on techno-functional and physicochemical properties. Several research gaps demand further development in these areas. These findings highlight the importance of a particle-level mathematical model for effectively designing and operating dehydrators. Therefore, this work aimed to develop a drying model that involves transport phenomena in its equations. The coupled balances of mass and thermal energy with the contraction model were solved using the finite element method. The geometries considered in this study for the pumpkin samples were the pumpkin cube (PC) and the pumpkin puree slice (PP). These equations were incorporated into COMSOL Multiphysics 5.6 software to simulate air convection drying at 333, 343, and 353 K. This software allows the inclusion of the geometry to be modeled and the system of partial differential equations without the need for programming. The obtained results were validated with the respective convective drying experiments. Finally, the techno-functional and physicochemical properties of the obtained pumpkin cube powder (PPC) and pumpkin puree powder (PPP) were measured. Figure 1 shows a logical diagram of this research.

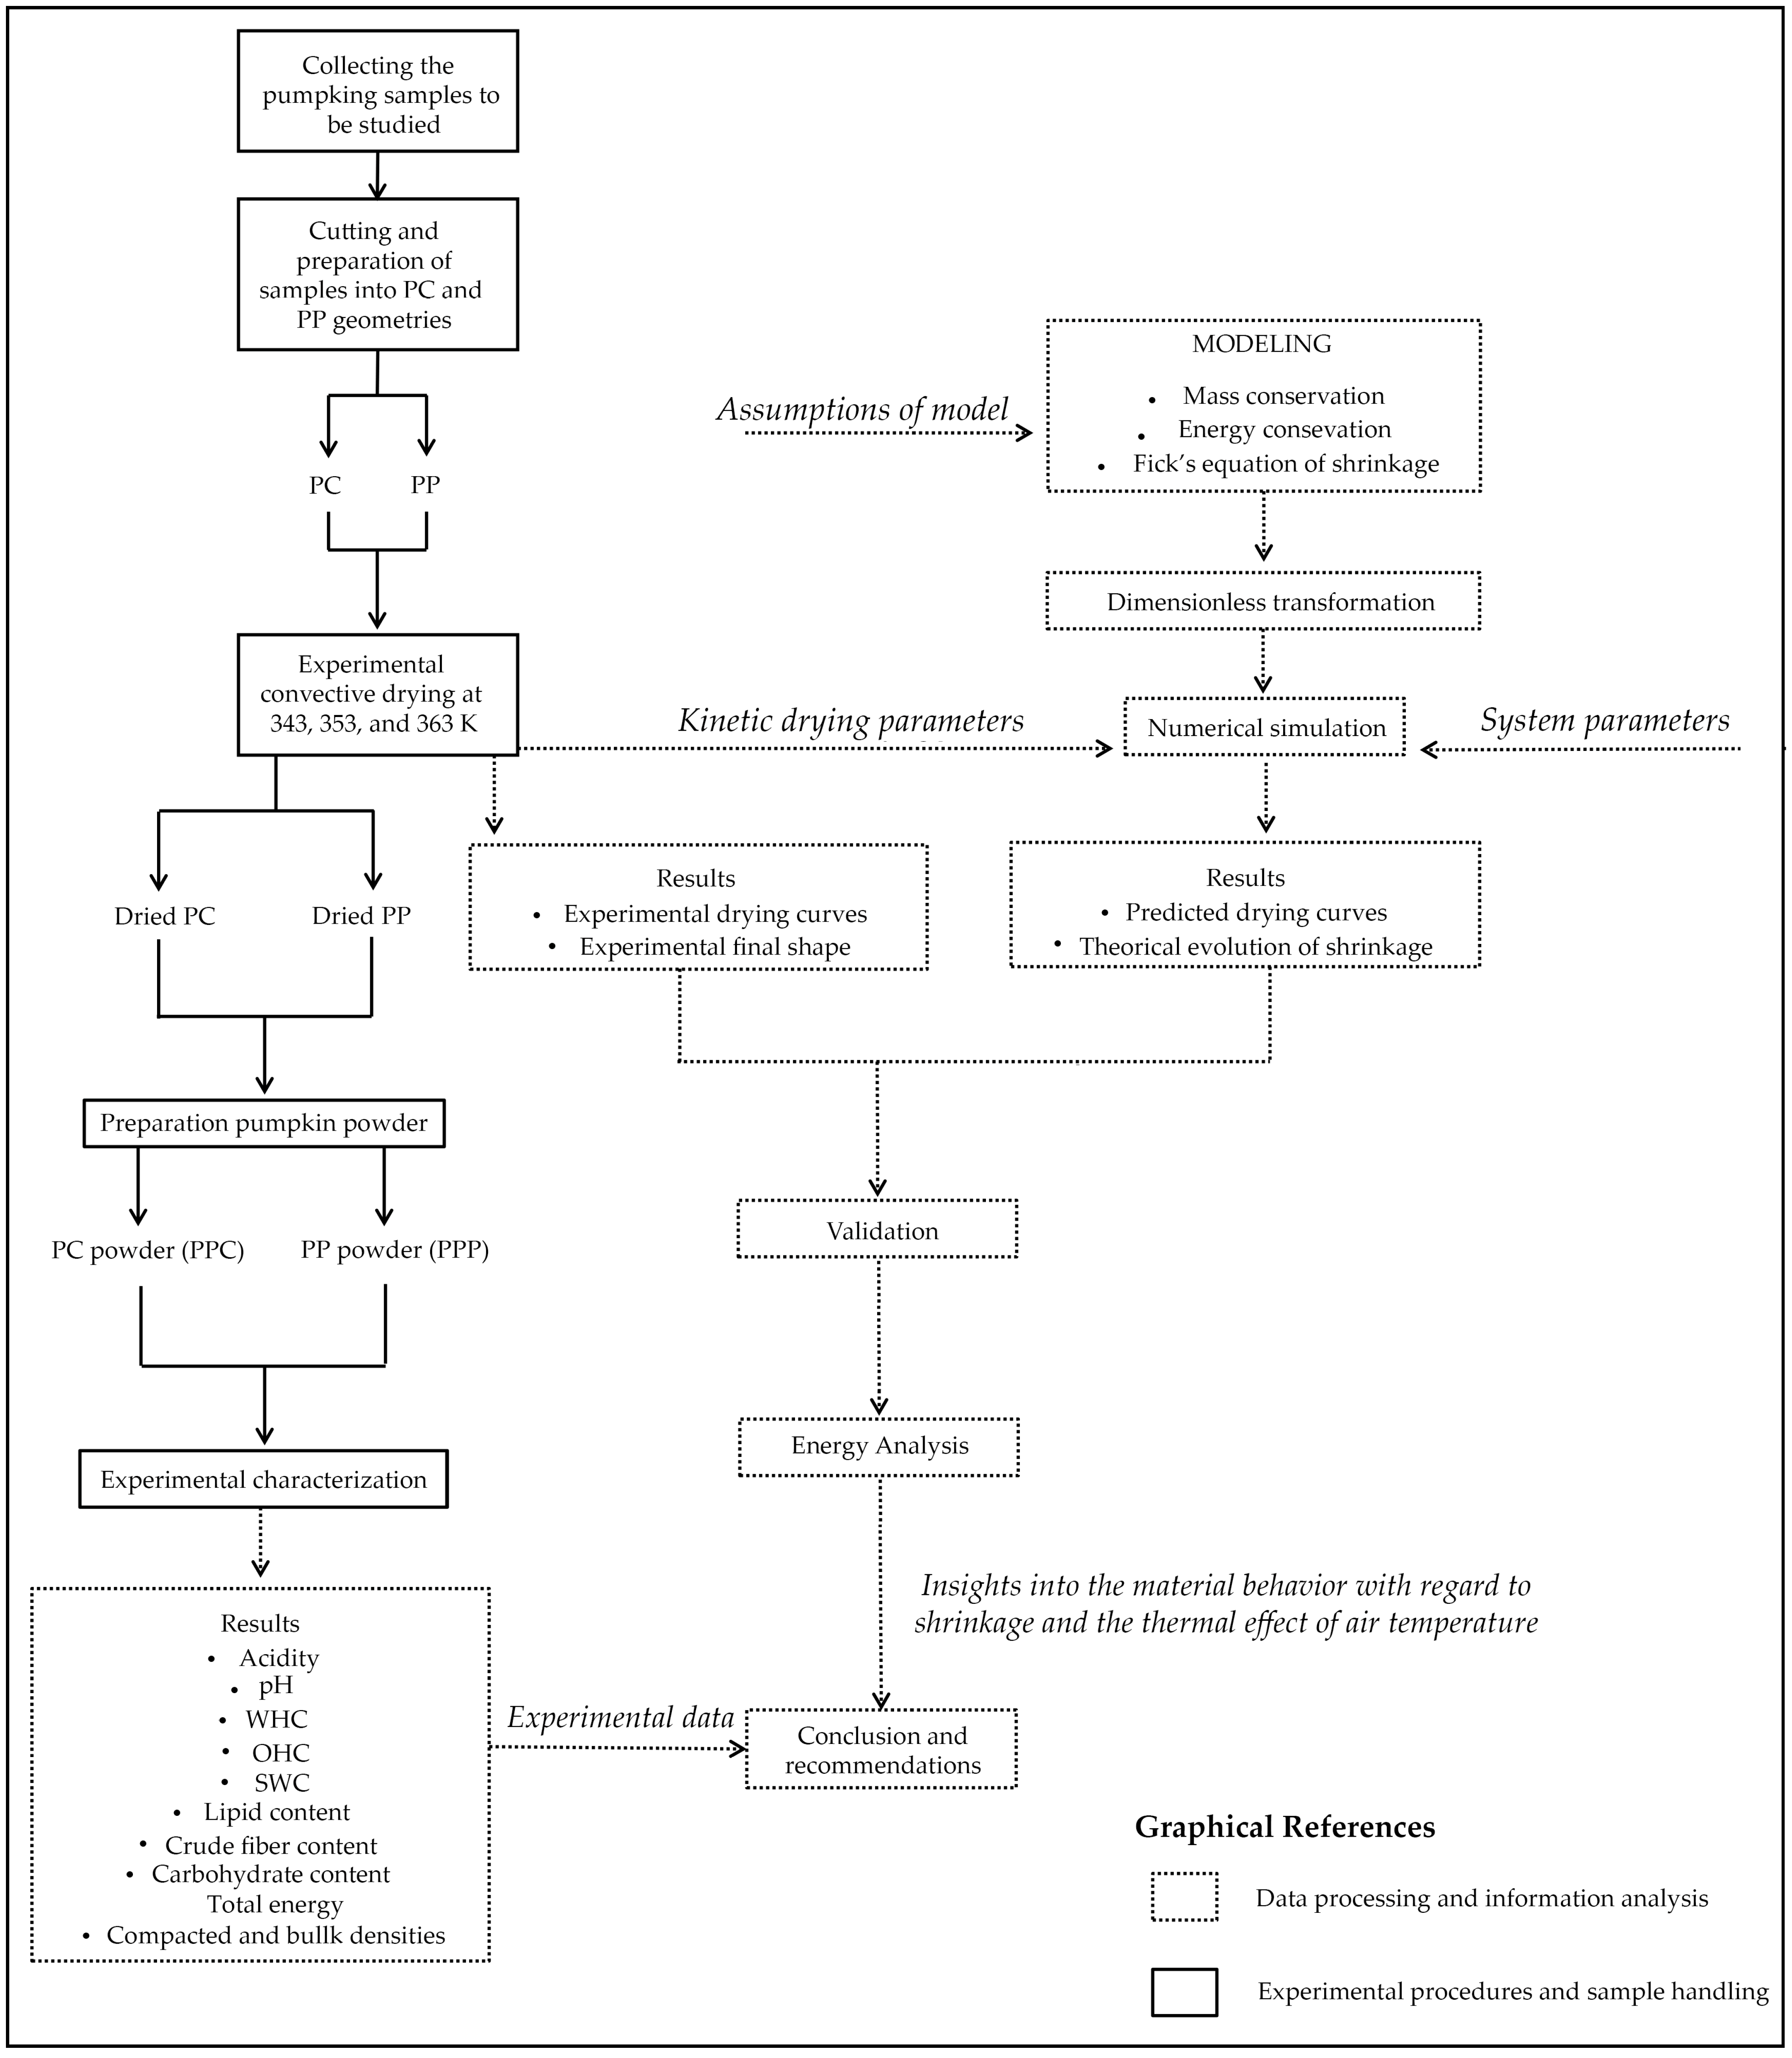
2. Materials and Methods

2.1. Sample Preparation

Samples of pumpkins, Cucurbita moschata, were collected from the Iglesia Department, located in the Province of San Juan, Argentina. This variety has an intense orange rind and pulp and an exquisite sweet flavor due to its high sugar content. Fresh pumpkins were washed and peeled. The pulp was cut in two different geometries: (A) PC (1.5 cm3) and (B) PP, the pulp was crushed in a stainless steel mill until form a pumpkin paste (TecnoDalvo, model TDMC, Santa Fe de la Vera Cruz, Argentina). Subsequently, the samples were kept refrigerated at 277 K until undergoing further drying, within 24 h.

2.2. Drying Procedure

The drying experiments of pumpkin pulp were carried out in a convective drying oven at three temperatures (333, 343, and 353 K). The drying temperature of 333 K is a vastly referenced value in the food technology literature for drying processes [8,35]. In addition, a higher temperature (353 K) was used in the present study to reduce the drying process times and to evaluate whether this temperature influences the nutritional and techno-functional characteristics of the powder obtained.
Mass loss (moisture loss) was recorded every 30 min until a moisture content of less than 15% was achieved by CODEX Standard [36] and the tests were carried out using the experimental device described by Roman et al. [37]. The tests were performed in triplicate and the average weight loss was reported. The initial moisture (AOAC Method 925.40/00) was determined by an infrared moisture analyzer (Radwag PMR50, Miami, FL, USA) with a halogen energy source at a temperature of 378 K [38].

2.3. Determination of Kinetic Parameters

The kinetic parameters of the pumpkin pulp drying process were determined using the Dincer and Dost model (Equation (1)) [39,40], which was applied by Riveros-Gomez et al. [8]. These parameters are needed for incorporation into the phenomenological model in the following section.
MR = G   exp   Sdr   t
Effective diffusivity (Deff) is an important parameter considering moisture transfer in drying. A simple diffusion model based on Fick’s second law was used to obtain this coefficient, as described in Riveros-Gómez et al. [8].
The activation energy (Ea) during pumpkin drying in a convective dryer was calculated by determining the slope of the linearized Arrhenius equation (Equation 2) as described by Onwude et al. [41]:
D eff = D 0   exp E a RT

2.4. Mathematical Model

The main assumption for the model is given in Appendix A.1.
During convective drying, heat is transferred from the air entering the food, while moisture moves from the interior of the solid matrix to the surface by diffusion. This moisture then evaporates from the surface to the drying air. Fick’s law describes mass transport in a medium initially lacking chemical equilibrium. Table 1 presents the mass and energy balances for CP and PP geometries, while Table 2 details the boundary condition equations. Moisture loss during drying, governed by Fick’s law, models its spatial and temporal distribution within the pumpkin sample (Equations (3)–(8)). Shrinkage terms are included in the second and fourth terms of Equation (3) and the second term of Equation (6). The mathematical development of these shrinkage terms is detailed in Appendix A. Temporal length variable L is defined in Equations (4) and (7).
For energy conservation, Fourier’s equations (Equations (9) and (10)) model heat transport by conduction, the primary mechanism in food drying, incorporating terms for the thermal effect on material shrinkage. The dimensionless transformation of mass conservation, energy conservation, and shrinkage equations is detailed in Appendix A.2. Previous studies have applied non-dimensional transformations [9,42,43,44,45]. Using non-dimensional variables allows a differential equation system integrating mass, energy, and shrinkage conservation equations. This approach is vital for numerical simulations, ensuring scale-independent results, and simplifying the application of initial or boundary conditions in COMSOL Multiphysics, leading to an efficient numerical solution process.
Figure 2a shows the symmetry along the vertical and horizontal lines through the cube center, with water flow directed outward from the surface, as indicated by blue arrows. Shrinkage occurs in opposition to the moisture flow due to pressure on the cube walls. Initial conditions for solving the system of equations (Equations (11)–(13)) represent moisture and heat mass flow in the x and y directions, respectively. Equations (14) and (15) represent moisture and heat mass flow along the radial direction.

2.5. Numerical Simulation in COMSOL Multiphysics: Equations, Method, and Parameters

To enter the dimensionless mass and energy conservation equations, as well as Fick’s equation of shrinkage (as a system of partial differential equations) into COMSOL Multiphysics, the partial differential equation (PDE) domain interface was used to define the domain addressed here. The ordinary differential equation (ODE) interface was used for Fick’s equation of shrinkage. The mass and energy flow source equations (Equations (14) and (15)) were also transformed into dimensionless form. The equations entered in COMSOL Multiphysics are presented in Table 3.
Auxiliary nodes were also employed, which allow for the addition of equations and constraints to the mathematical model. In this regard, the initial conditions of the dimensionless variables in Equation (11) were used. To introduce these conditions, COMSOL Multiphysics allows adding flow equations [46].
  • Zero-flux boundary condition is represented by the following equation:
n J = 0
b.
The flux/source boundary condition in COMSOL is represented by the following equation:
n J = g qu
For condition (a), the flux is zero when the dimensionless variable x′ is equal to zero. As established in the assumptions, the flux is zero at the center of the sample. This is valid for the two studied geometries.
For (b), the flux/source boundary condition (in this case, qu is equal to zero) represents a boundary condition for a drying problem, where n is the normal vector to the surface of the sample, J is the mass flux, and g is the rate of moisture extraction from the sample. The q coefficient simplifies the implementation of a Robin boundary condition by including a term on the form qu, where u is the dependent variable. This boundary condition indicates that the amount of mass leaving the sample through its surface is equal to the rate of mass extraction. The negative sign indicates that mass is leaving the sample and therefore the mass flux J must be in the opposite direction to the normal vector n . In the case of heat transfer, the flux boundary condition represents the boundary condition, where n is the normal vector to the surface of the sample, J is here the heat flux (instead of the mass flux), and g is the rate of heat input rate from the sample. Sandoval-Torres et al. [9] found mathematical expressions for flux constraint (Equations (21)–(23)). Table 4 shows the constrain equations.

2.6. Numerical Solution Methodology and Parameters

To define the terms of the differential equations shown in the previous sections, it is necessary to introduce parameters related to the solid matrix (pumpkin) and the conditions established in the drying system. Table 5 shows the parameters used in the model.
The MUMPS solver in COMSOL was used to solve the systems of partial differential equations. The time step used was 60 s, and we set the relative tolerance to 0.01 to control the unknowns. This scalar parameter was used to obtain accurate and efficient numerical solutions.

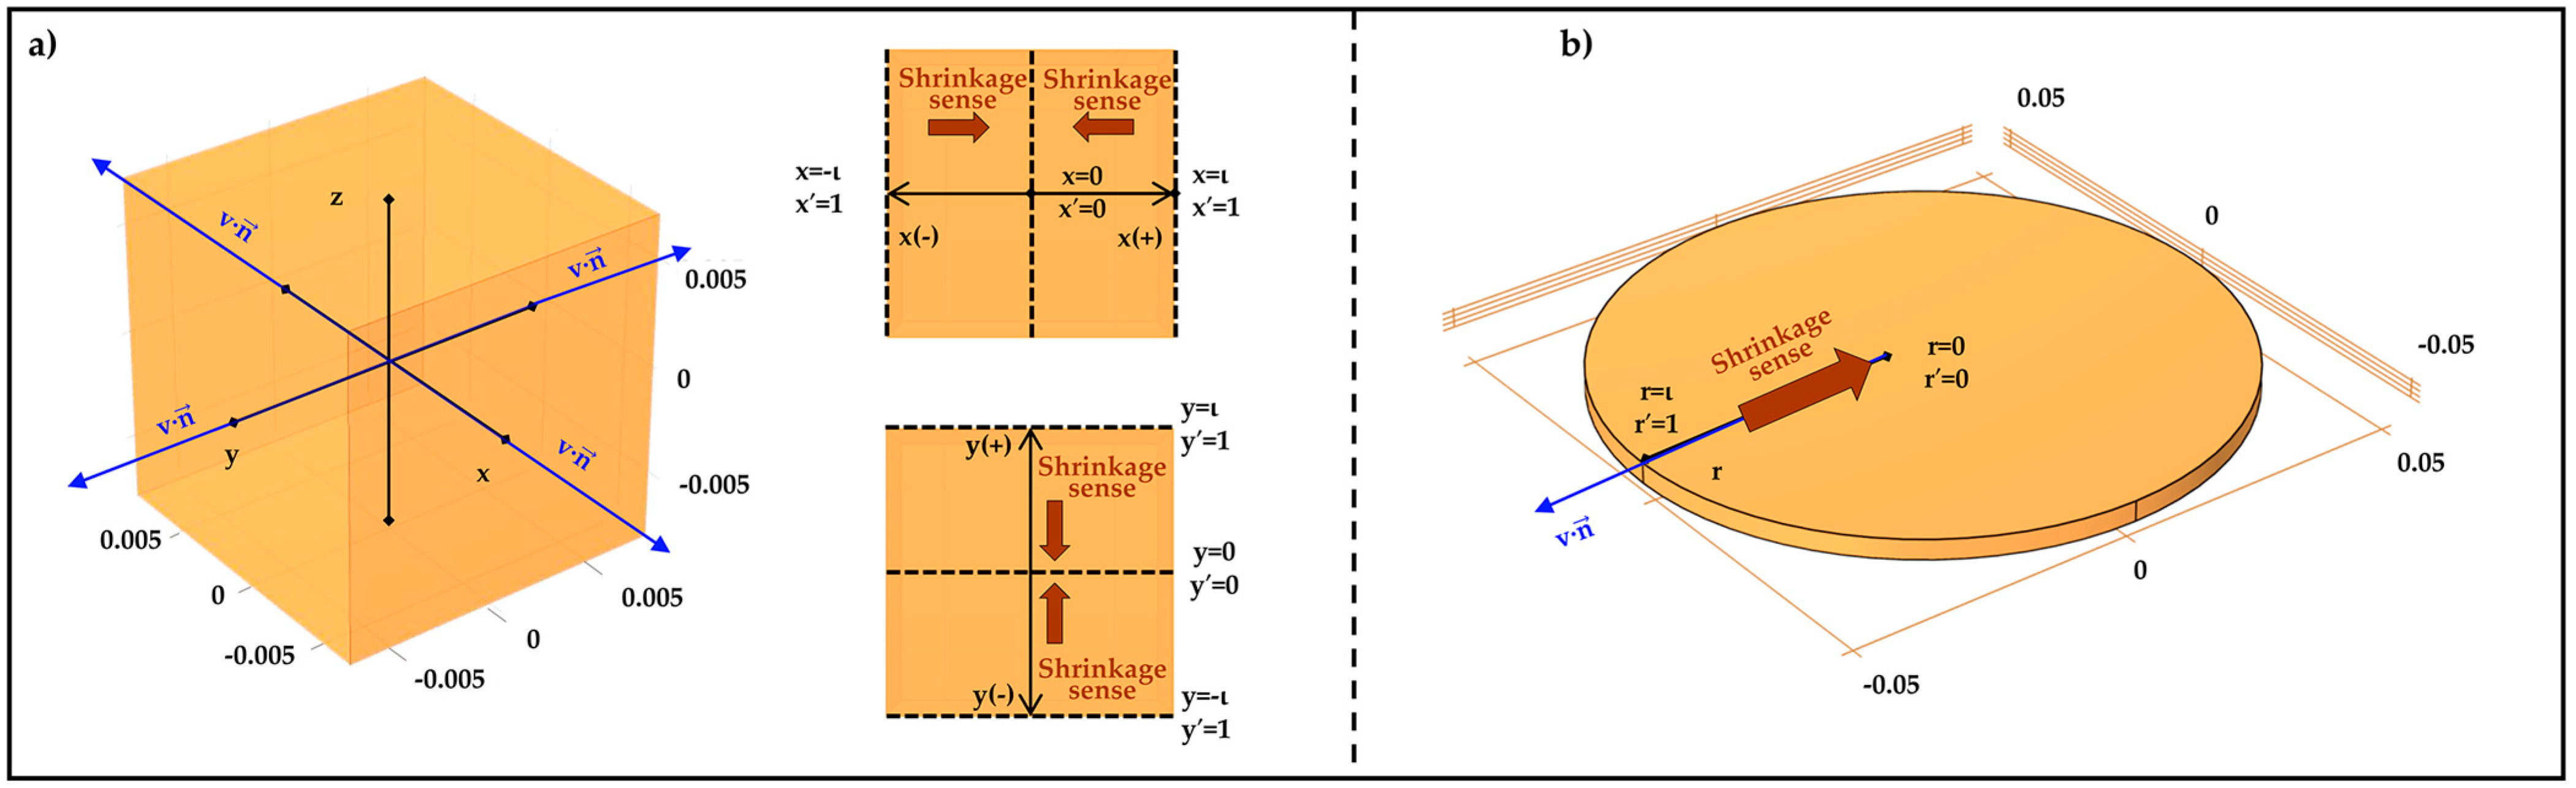
2.7. Graphical Representation of the Sample Shrinkage

A method was proposed to visualize the deformation of the PC sample concerning its axes of symmetry. This was achieved by plotting the variation in the sample’s characteristic length over time, as provided by the COMSOL simulation. This approach allows the observation of how the material deformed over time, as well as the distribution of stresses and strains within. However, the final shape of the puree pumpkin slice could not be predicted by the COMSOL model due to the formation of cracks and voids.
To validate the simulation results, the predicted values of S of the circular slices using the characteristic lengths at t = 7 h (time in which equilibrium moisture is reached at 353 K), for consistency across different temperatures, were calculated and compared from the experimental areas obtained from image processing (via area calculation using ImageJ software version 1.8.0) of the puree pumpkin samples.
All images were taken at the initial time and at 7 h, which corresponds to the time when the PP samples reached their final equilibrium moisture content after drying.

2.8. Preparation and Characterization of Pumpkin Powder

A simple random sample of three samples of pumpkin peel and dried pumpkin pulp was taken, (×2 geometries × 3 temperatures × 500 g/sample) and used for analyses. To obtain PPC and PPP, the dry samples at different temperatures were ground separately in a stainless—steel knife mill (TecnoDalvo, model TDMC). Subsequently, the powders were sieved to obtain a grain size of 0.10–0.20 mm. The samples were stored in the dark in sealed plastic bags at room temperature until analysis, within 2 months.
Each powder sample (2.0 g) was weighed into a 100 mL beaker and 40 mL of distilled water was added and stirred for 30 min. The mixture was then filtered and the pH of the filtrate was measured (AOAC Method 10.041/84) [38]. The total titratable acidity of the powder sample was determined in the filtrate by titration with NaOH (0.1 N), using five drops of phenolphthalein indicator until the mixture turned pink. The total titratable acidity of the pumpkin powder sample was informed as grams of citric acid/100 g sample (acid factor used: 0.064) (AOAC Method 942.15/90) [38]. The techno-functional properties, the water holding capacity (WHC) and oil holding capacity (OHC), were determined in the dry pumpkin samples, following the techniques described by Capossio et al. [54]. For the determination of WHC, pumpkin powder samples (0.5 g) were hydrated with excess water in 15 mL Falcon tubes for 24 h and then centrifuged at 2000× g for 30 min. The supernatant was removed and water retention was expressed as grams of water retained per gram of pumpkin powder sample on a dry weight basis (dwb; g water/g sample dwb). The OHC analyses were performed by mixing 0.5 g of the sample with sunflower oil (10 mL) in 15 mL Falcon tubes. After 24 h, tubes were centrifuged at 2000× g for 30 min, the supernatant was eliminated and oil retention was reported as grams of oil held per gram of pumpkin powder sample on a dry weight basis (g oil/g sample dwb. The swelling capacity (SWC) was calculated according to the method reported by Robertson et al. [55]. The pumpkin powder sample (100 mg dry weight) was hydrated in distilled water (10 mL) during 18 h, then the bed volume was documented and expressed as volume per gram of pumpkin powder sample on a dry weight basis (mL/g sample dwb).
The moisture of the dry samples was determined as described in the previous section for fresh samples. The ash content was analyzed by AOAC Method 923.03/90 [38]. The lipid content was determined via Soxhlet extraction (AOAC Method 920.39/90) and protein via the Kjeldahl method (AOAC Method 960.52/90) [38]. Moreover, the crude fiber content (ASTM Method D1104–56) was determined [56]. Subsequently, carbohydrates were calculated by the difference method reported by Campuzano et al. [57]. In addition, total energy was estimated using Atwater conversion factors, considering 4 kcal/g for carbohydrate, 4 kcal/g for protein, and 9 kcal/g for lipids, as described by Baldán et al. [58]. In addition, bulk density was measured by pouring approximately 20 mL of powder into a 50 mL graduated cylinder without tapping. The mass and volume of the powder were recorded and calculated as the relation between the weight of the pumpkin powder, and the volume of the powder without tapping, while compacted density was considered the weight of the pumpkin powder, and the volume of the powder after tapping. Then, the Hausner ratio was calculated as the ratio between the compact density and the bulk density [59].

2.9. Energy Analysis

The energy required to dry 1 kg of pumpkin pulp is estimated by calculating the specific energy consumption (SEC) using Equation (34) [60]:
SEC = ( C pa + C pv h v ) q air t ( T in T am ) m v V h
A power plant supplies electricity for the experiments.

2.10. Emissions of CO2

CO2 emissions were estimated following the guidelines of Climate Transparency [61]. For Argentina, the CO2 emission factor for electricity is 0.3583 kg CO2/kWh. Therefore, the CO2 emissions associated with drying 1 kg of pumpkin pulp are equal to [35]:
CO 2 emissions = 0.3583 × kg C O 2 kWh

2.11. Statistical Analysis

All analyses were performed in triplicate and data were reported as mean ± standard deviation (SD). The results were analyzed by unidirectional ANOVA and the significant differences between the mean values were determined by the Tuckey test (p < 0.05) using the InfoStat software [8]. Pearson’s correlation analysis was used to determine statistical significance.
The statistical coefficients to evaluate the fit of the mathematical model with the experimental data were Chi-square (χ2), the sum of squared errors (SSE), and the square root of squared errors (RMSE), those with the lowest values of χ2, SSE and RMSE [62] represent the best fit. In turn, to find the kinetic constants, the values of the constants were iterated using the Microsoft Excel 2019 Solver complementary program, until finding those that make the statistical parameters are minimal.

3. Results and Discussion

The drying kinetics of two sample geometries were evaluated at different drying air temperatures. A phenomenological mathematical model was used to simulate the drying kinetics, and the results obtained by simulation were compared with experimental data.

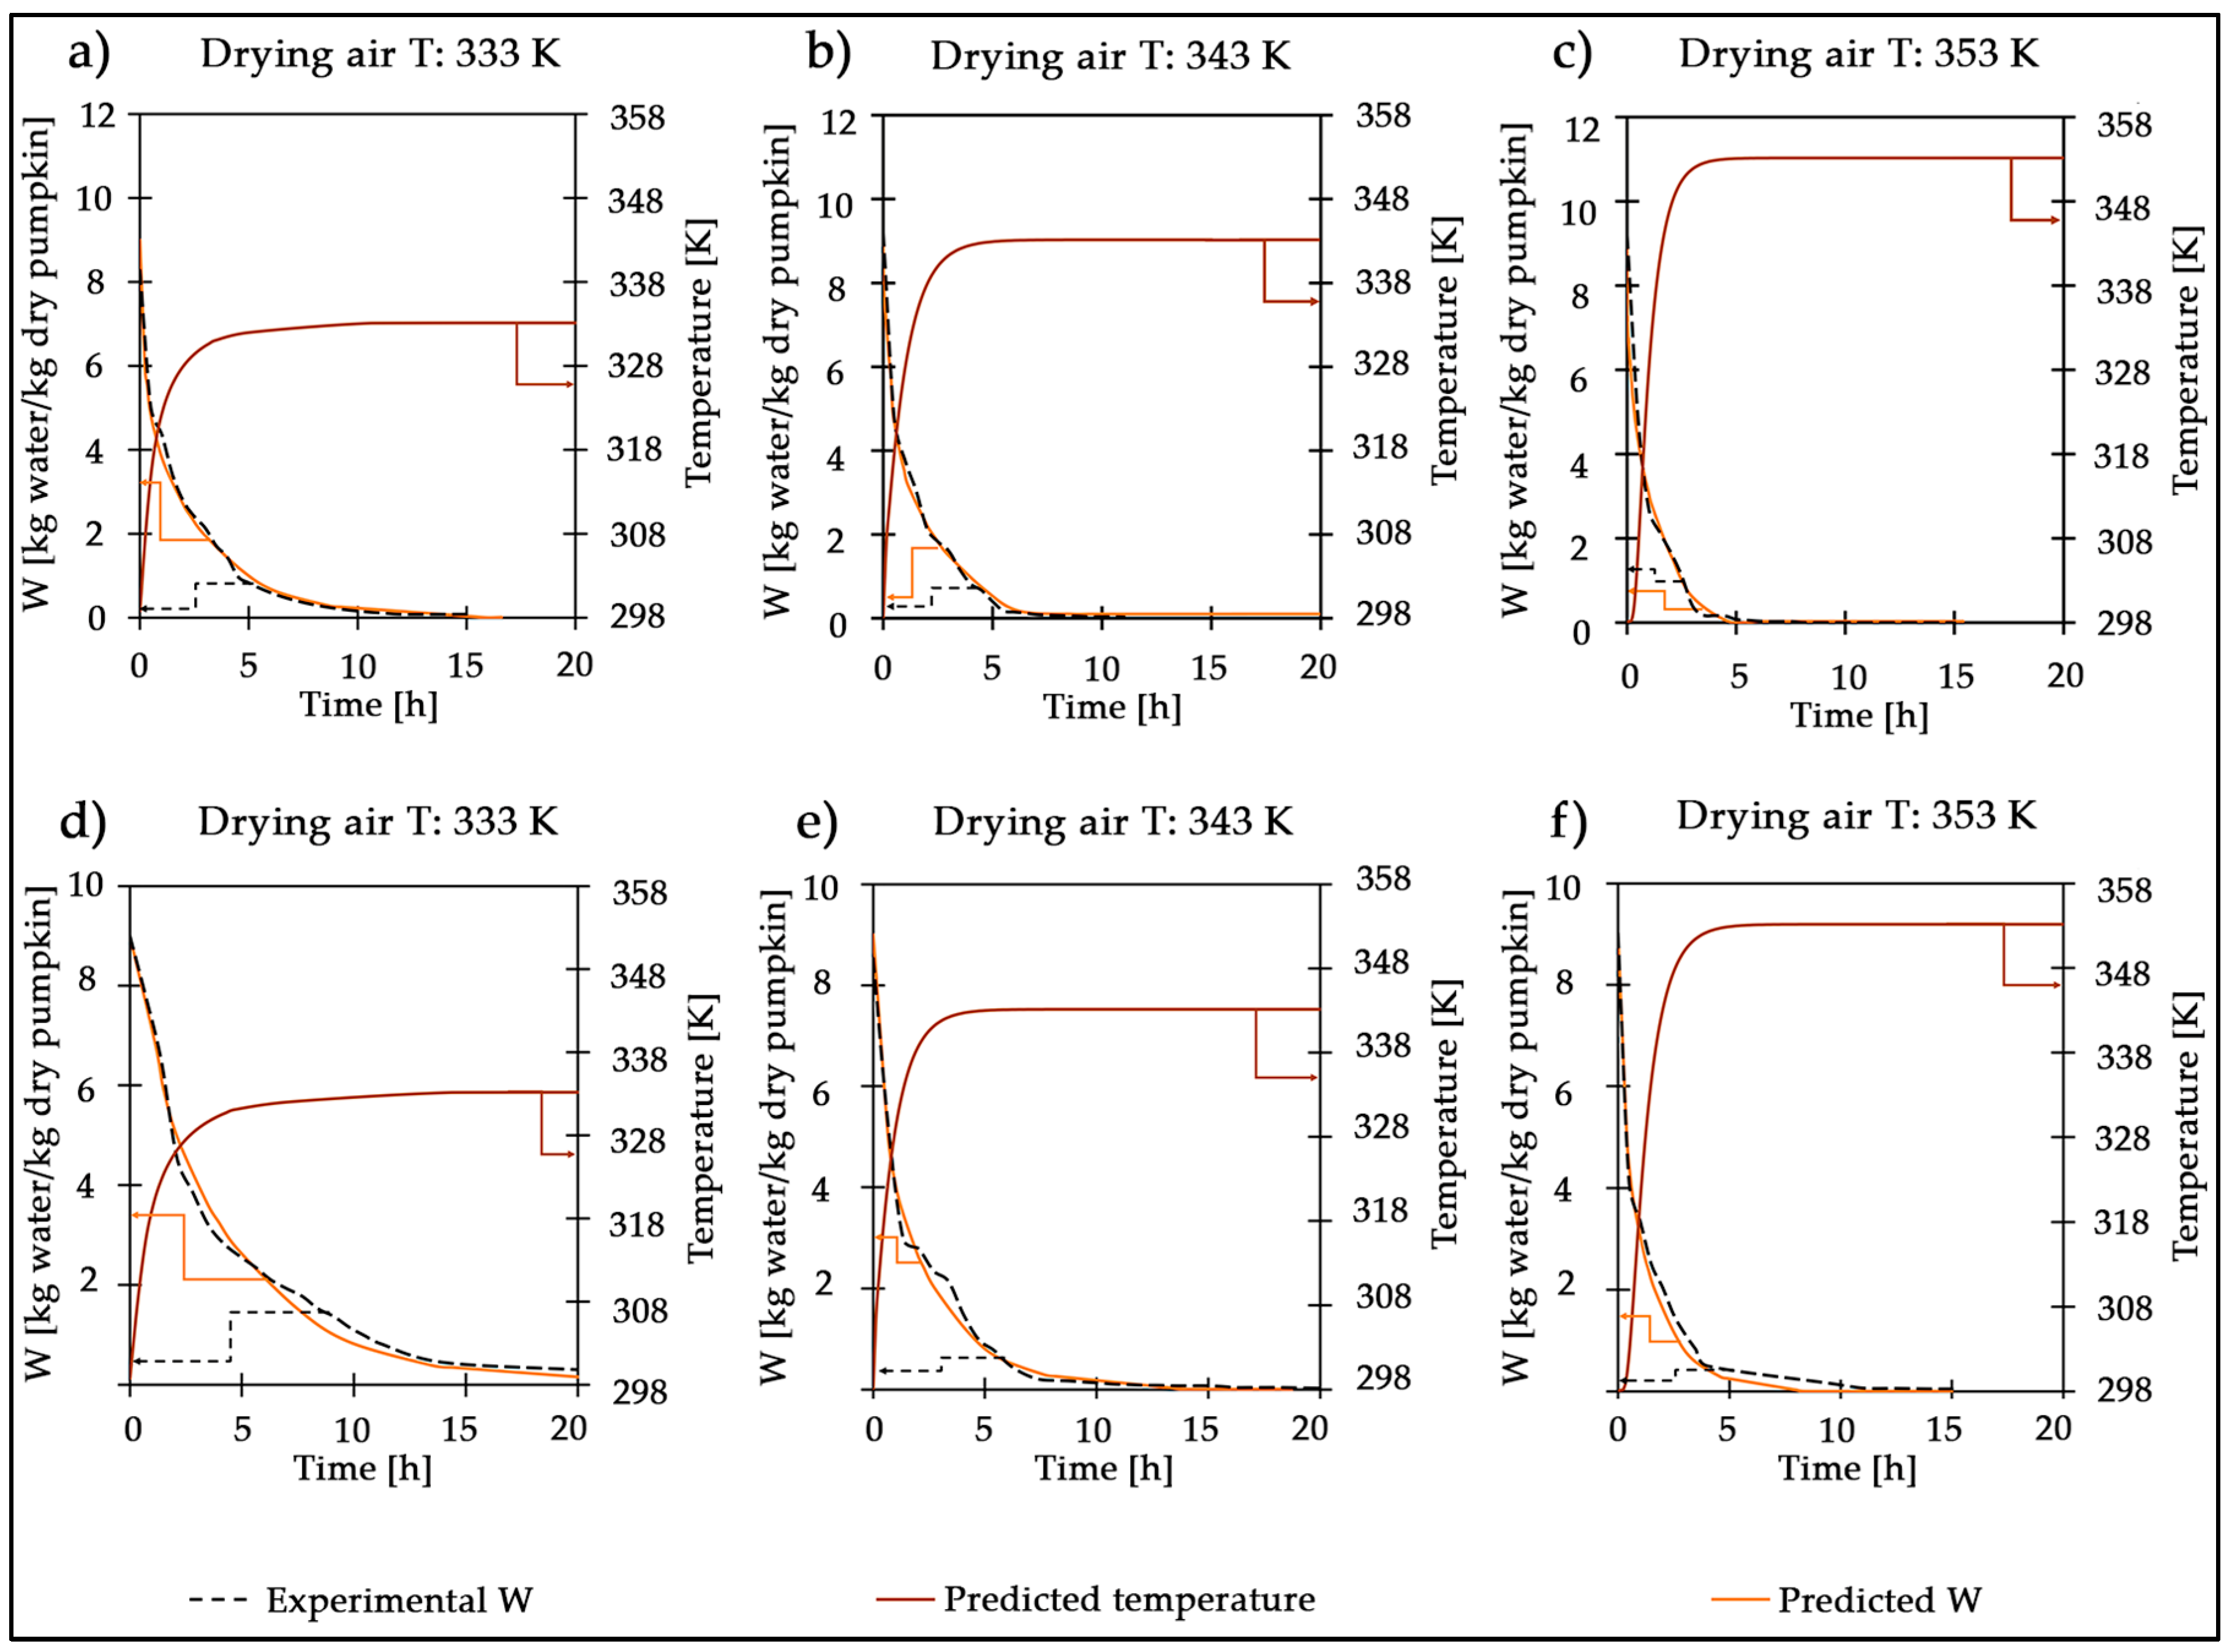
3.1. Mathematical Model: Drying Curves for PC and CC Geometries

The drying curves (Figure 3) showed that as the air temperature increases, the moisture reduction rate becomes sharper for both forms of pumpkin.
This behavior is consistent with previous findings reported by various authors [9,16,25]. Nevertheless, PC geometry had a more pronounced trend than PP geometry puree slices.
For PC geometry, as air temperature increases, the predicted moisture reduction curve shows a progressively steeper slope, indicating that the reduction in moisture increases more rapidly because PC geometry samples have a larger surface area exposed to hot air, which facilitates the transfer of water from the interior of the solid to the surface. As a result, as the temperature increases, the moisture transfer rate also increases. Figure 3a–c compare the actual moisture content measured in experiments (experimental) with the values predicted by numerical simulation (predicted) under studied drying conditions. The model accurately reflects the drying behavior (kinetics) for all the experiments conducted. These figures clearly show that air temperature has a significant impact on drying speed. As expected, higher drying temperatures lead to faster moisture removal and shorter drying times. This is because the temperature difference between the fresh sample (PC) and the surrounding air is greater at higher temperatures.
In the later stages of drying, the rate of moisture removal slows down (falling rate period). This is because the moisture inside the PC needs to travel to the surface before it can evaporate. The speed of this moisture movement is controlled by the rate of diffusion (movement) through the product itself. Finally, as the drying process nears completion, the moisture profile flattens out, and the moisture content gradually reaches the equilibrium level for the pumpkin sample.
In the case of PP geometry, the tendency for the moisture reduction rate to increase with temperature is less pronounced than in the case of PC geometry because the puree slices have a smaller surface area exposed to hot air, which hinders the transfer of moisture to the surface. Therefore, as the temperature increases, the moisture transfer rate does not increase as rapidly as in the case of PC geometry. Similar findings were reported by Balzarini et al. [63], who studied the drying treatment on the quality attributes of chicory root cubes.
In addition, due to the significant shrinkage that occurs during the drying process, the PP geometry samples tend to crack, resulting in the formation of voids in the transfer zone. This effect reduces the mass and heat transfer area, affecting the overall performance of the drying process. Although cracks or gaps formed in the pumpkin puree slices may increase the effective moisture transfer surface area, they also decrease the thickness of the material in the voids, which reduces the heat transfer area. In addition, at the onset of drying, the gradient of available free moisture concentration was higher, leading to a greater drying rate. In addition, when there is a high initial moisture content, the initial drying rate is consistently higher because of the vapor pressure gradient, which diminishes as the drying process continues. This initial increase in the drying rate can also be attributed to the opening of the physical structure, allowing for faster evaporation and water transport. Similarly, Yuan et al. [64], Wang et al. [65], and Das Purkayastha et al. [66] observed comparable alterations in the drying rate curves during the thin-layer drying of apple pomace. A constant drying rate phase was not detected (Figure 3d–f). Therefore, it can be inferred that the drying process in this study was entirely within the falling rate period. This observation aligns with the findings of Cano-Chauca et al. [67] and Das Purkayastha et al. [66]. The falling rate period suggests greater resistance to heat and mass transfer through the internal cells, as well as an increase in the thickness of the wrinkled and shrunken skin [66].
Previous studies have documented how the geometry of food material, including its shapes and sizes, affects drying rates [30,31,32,33]. For instance, Garau et al. [30] and Panyawong and Devahastin [31] developed linear contraction models for different food materials, but it is important to note that these materials also exhibit elastic, hyper elastic, elastoplastic, or viscoelastic properties, implying that food contraction models are predominantly nonlinear. Moreover, complex phenomenology during drying affect food geometry in ways that empirical models cannot fully capture [68].
This highlights the necessity of including comprehensive modeling to support or refute findings, providing a clear context for the results. Thus, this study shows that particle-level modeling, which incorporates the effects of shrinkage, successfully addresses the limitations of empirical models. By accurately predicting the behavior of different geometries and capturing the complex phenomena occurring during drying, this approach offers a more robust and reliable method for optimizing drying processes. Consequently, particle-level modeling allows for the better control and efficiency in the drying process, ultimately leading to higher-quality final products.
It is necessary to consider both the advantages and disadvantages of each sample geometry (cube or slice) before deciding which geometry is optimal for a given drying process. The use of PC geometry may be preferable due to their more compact structure and lower susceptibility to void formation, which may provide better mass and thermal transfer efficiency. Furthermore, shrinkage during the drying process is a critical factor to consider as it can affect both the efficiency of mass and heat transfer as well as the quality of the final product. Therefore, achieving these goals requires the careful control of the temperature and velocity of the hot air flux, as well as carefully selecting the geometry of the material to be dried.
Ultimately, the choice of geometry will depend on the process-specific needs and the desired characteristics of the final product.
In terms of specific requirements, this study aims to evaluate how these drying characteristics affected the techno-functional properties of the powders obtained from PC and PP geometries. Therefore, the following sections will address the analysis of the techno-functional properties of the powders.

3.2. Graphical Representation of the Sample Shrinkage

The results obtained from the graphical representation of the sample shrinkage provide valuable insights into the behavior of the material during the drying process. As shown in Figure 4a, the simulation accurately captured the experimental observations of the PC sample’s shape change over time, as evidenced by the close match between the theoretical and experimental geometries. The plot of the characteristic length variation with time allowed us to observe the sample’s deformation over time, as well as the distribution of stresses and strains within the material. It is worth noting that the simulation was able to predict the final shape of the PC sample, which provides confidence in the accuracy of the simulation results.
In Figure 4b, the simulation results for the circular slice sample are presented. The simulation performed well in predicting the time-evolving characteristic length values, but it failed to capture the final shape of the puree pumpkin slice due to the formation of cracks and voids. This limitation is likely a consequence of the model not accounting for the mechanical stresses that develop during drying. As Aguilera and Stanley [69] pointed out, vegetable contraction during drying induces a stiffening phenomenon. This occurs because the surface dries faster than the interior, leading to internal tension and the formation of cracks and voids. The inability of the current model to predict this phenomenon explains the discrepancy between the predicted and observed final shapes.
The results of the length calculations from images indicated that the contraction increases as the temperature increases, which is consistent with the formation of voids and the reduction in the cross-sectional area of the sample. The relative percentage errors were calculated as 5.32%, 3.05%, and 6.64% for 333, 343, and 353 K temperatures, respectively. Despite the limitation (the inability of the current model to predict cracks and voids), the simulation results could still be validated by comparing the predicted and experimental values of S of the circular slices after drying. The close agreement between the theoretical and experimental areas provides strong evidence that the simulation accurately captured the overall drying process, excluding the effects of mechanical stress and crack formation.
Furthermore, the comparison between the experimental and predicted values of S using the characteristic length values provided insights into the material behavior during the drying process. In this sense, as depicted in Figure 4a for PC samples, shrinkage is evident through the change in sample volume. The developed model effectively reproduces the shrinkage deformation experienced during drying. In line with these observations, the model demonstrates that, during the initial drying stages (for W values between 6 and 3 kg water/kg dry pumpkin and t values between 0.5 and 2 h, as exemplified in Figure 3a, small size variations are observed in the cube samples, corresponding to the lowest rate period. During this period, the primary process is the evaporation of surface water. However, during the falling rate period (with W less than 2.5 kg water/kg dry pumpkin), significant volume variations are observed in all experimental trials, attributed to the molecular movement of water during the diffusion process.
Similarly to observations in apple slices [64], the simulations captured a larger initial deformation during drying due to rapid moisture loss (Figure 4). The observed increase in contraction with increasing temperature (mentioned earlier) aligns with findings for apple slices and Figure 3 results, where higher drying temperatures resulted in greater stresses and shrinkage [64].

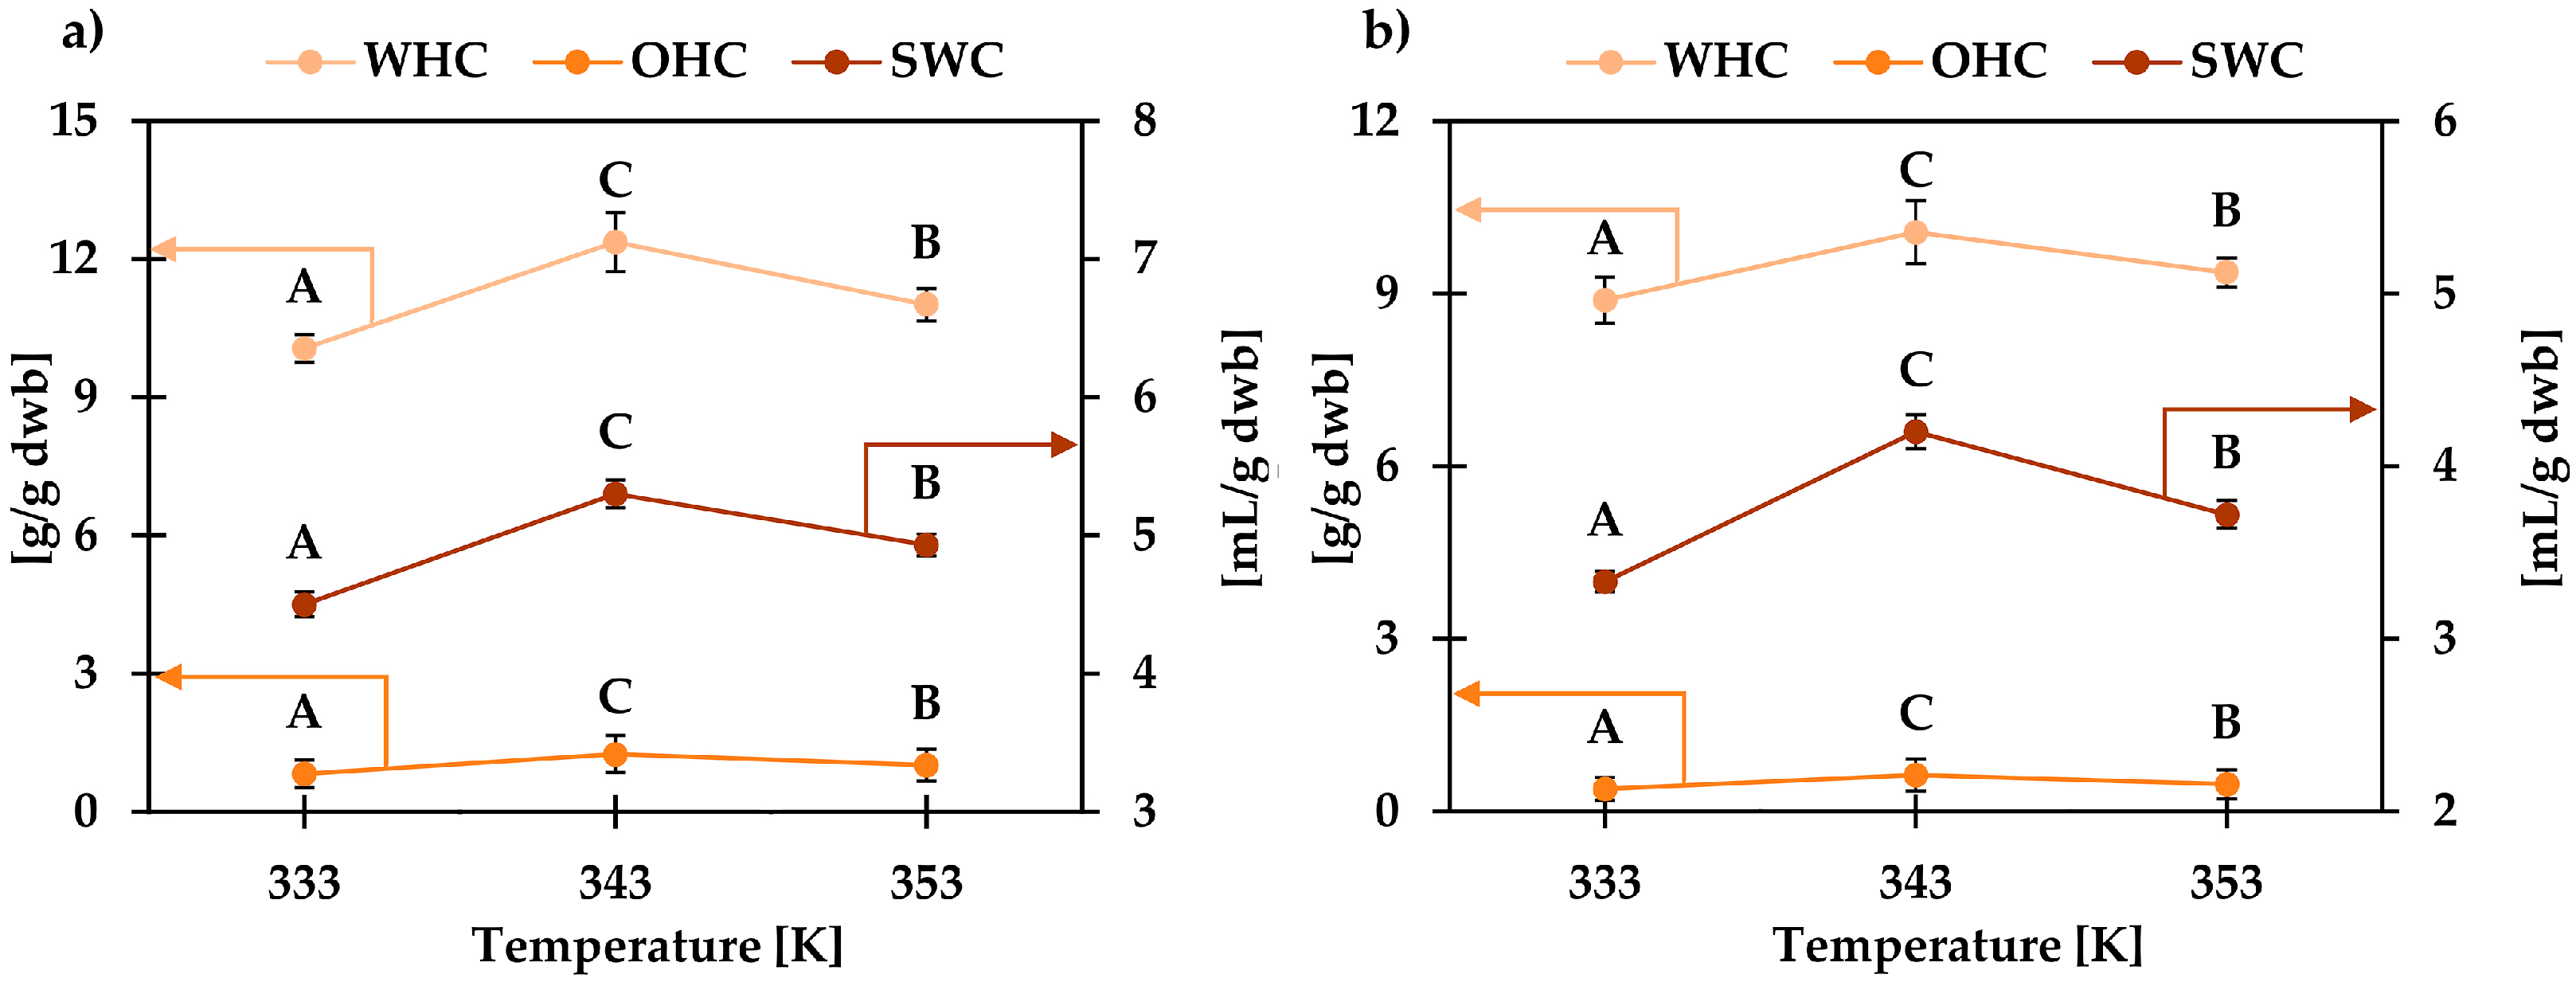
3.3. Obtaining Dried Pumpkin Powder and Corresponding Characterization

The average weight of the fruits was 1181.67 ± 140.12 g and they were 20.08 ± 1.26 cm high, with a diameter between 8.48 ± 1.02 and 8.39 ± 1.04 cm in the upper part and between 11.25 ± 0.82 and 11.26 ± 0.84 cm in the area of the seminal cavity. The fruits were examined to verify their good condition, washed, and then shaped into puree and cubes.
The composition of the pumpkin is given by 69% of pulp, 27% of peel, and the remaining 4% by the seeds. The yields obtained show that the pulp represents a considerable percentage of the pumpkin that does not meet sales standards but does meet consumption standards, since it is a source of important compounds and is usually discarded.
In the temperature range studied, between 333 and 353 K, the acidity values for PPP and PPC showed a significant increase when the temperature rose, from 1.03 to 1.57 and from 1.30 to 1.57 g citric acid/100 g dwb, respectively. On the other hand, pH values decreased significantly from 6.70 to 6.55 for PPP and from 6.63 to 6.17 for PPC with the increasing drying temperature showing an inversely proportional correlation between acidity and pH results. Similar trends were reported by Zzaman et al. [70] during the drying of untreated pineapple at 323, 328, and 333 K and by Capposio et al. [54] during the drying of watermelon peel for the temperature range coincident with this study. The increase in acidity and decrease in pH may be attributed to the organic compound decomposition by heat effect, which caused the release of organic acids into the vegetal matrix [71]. In addition, the evaporation of water during drying concentrates these acids, increasing the effect of pH decrease and acidity increase. The obtained values WHC, OHC, and SWC for PPC and PPP are shown in Figure 5.
Analyzing the initial geometry of the samples, it can be seen that the PPC presents significantly higher values than those corresponding to PPP for WHC, OHC, and SWC. In this sense, WHC, OHC, and SWC values had a dramatic increase from 333 to 343 K, and a gradual decrease was detected from 343 to 353 K, showing significant differences for the three temperatures analyzed. The maximum values were obtained at 343 K for PPC, being 12.37 ± 0.64 g water/g dwb, 1.25 ± 0.03 g oil/g dwb, and 5.30 ± 0.20 mL/g dwb for WHC, OHC, and SWC, respectively. Capposio et al. [54] dried the watermelon peel between 333 and 373 K and Garau et al. [72] dehydrated the orange between 303 and 363 K, both studies also reported the maximum values of absorption capacities (WHC, OHC, and SWC) at intermediate temperatures of the studied ranges.
The results obtained above were considered to select the powders to continue with the evaluation of the physicochemical properties of the dehydrated products.
Comparing the drying times at 333, 343, and 353 K required to achieve a moisture content below 15% (equivalent to 0.18 kg of water/kg of dry solid), it was found that the time was significantly longer (more than 40%) at the lower temperature. In this sense, when considering the process performance, longer drying times lead to higher energy consumption, higher operating costs, the possible deterioration of product quality (changes in nutrients, texture, flavor, and color, as well as the formation of undesirable compounds, and lower production capacity) [73,74,75]. For this reason, the characterization studies were performed in the PPC and PPP samples at 343 and 353 K.
Regarding the shrinkage effect, it is important to note that it can affect both mass and heat transfer efficiency as well as the quality of the final product. Shrinkage during the drying process can cause cracks and voids in the sample, which affects the quality of the final product by altering its texture. The increase in WHC, OHC, and SWC from 333 to 343 K in the first instance could be because an increase in the drying air temperature can affect the structure and physical properties of the pumpkin samples, including their ability to retain water and oil. As the temperature increases, the pores and fibers of the materials open up, increasing their capacity for the absorption and retention of liquids. However, temperatures above 343 K can cause structure breakage (greater shrinkage than at lower temperatures), and under these conditions, the dried material cannot hold any water or oil.
The physicochemical properties of PPC at 343 and 353 K are shown in Table 6. From the results obtained, it can be seen that some components are not influenced by drying temperature (moisture, ash, protein, carbohydrates, and total energy), while others are significantly influenced by this parameter (lipids and crude fiber).
The crude fiber content represents 20–50% of the total dietary fiber [76]. The crude fiber content obtained in this study was augmented by more than 90% on average, with an increasing drying temperature from 343 to 353 K. Similar values were reported by Guiné et al. [77], 7.85 ± 0.09 and 9.69 ± 0.01 (expressed as a percentage of dry mass), in pumpkin (Cucurbita maxima) pulp samples dried at 303 and 343 K, respectively.
The crude fiber content is a complex mixture of components, including cellulose, hemicellulose, and lignin, among others, and its increase during drying can be attributed to the effect of heat on cellulose (one of its main components) could cause changes in its crystalline structure and intramolecular bonds [78], making the crude fiber more accessible and susceptible to extraction and quantification using the ASTM Method D1104—56 used in this study.
On the other hand, although the variation in lipid content was significant, this product is very poor in this component. When comparing these results with those obtained by Guiné et al. [77] and López Mejía et al. [79] for pumpkin (Cucurbita maxima), it is possible to observe that, in the case of this work, the dehydrated samples presented slightly lower lipid content.
The lipids content decreased with temperature, showing significant differences for the pumpkin powder obtained at 343 (0.47 ± 0.02 g/100 g dwb) and 353 K (0.33 ± 0.01 g/100 g dwb), respectively. In this sense, the increasing drying temperatures can lead to the degradation or oxidation of the lipid content, resulting in its reduction.
Bulk density is an important property when considering the package; it depends on the size and distribution of the particle and is closely related to other physicochemical properties [80]. The values determined in this study for the bulk density of pumpkin powder produced at 343 and 353 K were 0.658 ± 0.005 and 0.616 ± 0.009 g/mL, respectively. Similar values were found in the bibliography for powders of different vegetable origins. Chinma et al. [81] reported a bulk density of 0.69 ± 0.03 g/mL for ungerminated moringa seed powder. Miquilena et al. [82] obtained bulk densities in a range of 0.626–0.631 g/mL for powders of Quinchoncho and three different varieties of beans. The values determined in this study for the compacted density were 0.809 ± 0.004 and 0.758 ± 0.016 g/mL for the pumpkin powder produced at 343 and 353 K, respectively. It could be seen that the bulk and compacted density decreased significantly (p ≤ 0.05) with increasing drying temperature. In contrast, the values obtained for the Hausner ratio were coincident for both, 343 and 353 K (1.23 ± 0.01). The pumpkin powders analyzed could be classified as medium-flowing powder taking into account the Hausner ratio value between 1.1 and 1.25 [59].
The results suggest that the operating conditions in convective drying can influence particle size and distribution, which in turn affects the bulk density of the powder. The reduction in bulk density observed with the increasing drying temperature suggests that convective drying leads to a more porous structure (easier to break or grind). This fact may have implications for packaging efficiency, as a lower bulk density allows for the more efficient utilization of packaging space. Moreover, the compacted density of the powder, which is also influenced by convective drying, affects its flow properties. The decrease in compacted density with an increasing drying temperature indicates better powder flowability. This fact is crucial for powder handling and processing processes, as good flowability facilitates the uniform mixing, filling, and conveying of the powder. However, higher temperatures cause a decrease in WHC, OHC, and SWC properties, so it will be desirable to consider these changes during the convective drying process to ensure the preservation of the functional characteristics and quality of the resulting pumpkin powder.

3.4. SEC and CO2 Emissions

Energy consumption can be reduced by shortening the blanching time, as the energy requirements for this process are significant [7]. At different temperatures (333 K, 343 K, and 353 K), the specific energy consumption (SEC) values were 3911.44 kW/kg, 3592.85 kW/kg, and 3502.97 kW/kg, respectively (Table 7). The decrease in SEC with the increase in temperature indicates that less energy is required as the drying process temperature rises, which also results in shorter drying times. This increase in temperature and the corresponding reduction in drying time led to lower CO2 emissions. The CO2 emissions associated with these energy consumptions were 1401.47 kg CO2/kW, 1287.32 kg CO2/kW, and 1255.11 kg CO2/kW, respectively, demonstrating a clear relationship between improved energy efficiency and reduced environmental impact [35].

3.5. Innovative Contributions and Originality of This Research

To provide a comprehensive overview of the key findings and their alignment with the existing literature, Table 8 summarizes the impact of temperature, the falling rate period, geometry and surface area, shrinkage effects, and particle-level modeling in this study compared to those in previous studies. This comparison highlights both the similarities and differences, offering valuable context for the observed drying kinetics and shrinkage behavior of pumpkin samples.

4. Conclusions

This study on the drying kinetics of pumpkin cubes and purees by convective drying using air at different temperatures (333, 343, and 353 K) found that controlling temperature and sample geometry is necessary for achieving efficient mass and heat transfer conditions, and a high-quality final product. The model developed here accurately predicted the moisture reduction rate of pumpkin samples during drying. The sample geometry and the air temperature affected the moisture reduction rate and the formation of voids. Shrinkage during the drying process can cause cracks and voids in the sample, affecting the quality of the final product by altering its texture. The increase in drying air temperature can affect the structure and physical properties of the pumpkin samples, including their ability to retain water and oil. Increasing drying air temperature affects pumpkin sample structure and properties like water and oil retention. Lower SEC with higher temperatures suggests better energy efficiency without compromising product quality. Optimizing drying temperature for lower SEC can shorten the drying times and reduce CO2 emissions, preserving the pumpkin’s technological and functional qualities. Temperatures above 343 K can cause greater shrinkage, resulting in a dried material that cannot hold any water or oil. In summary, this study highlights the relevance of considering the shape of pumpkin samples during the processing of dehydrated powders. The results showed significant changes in liquid absorption properties and transport characteristics, suggesting that the sample geometry and the air temperature influence the techno-functional properties of the final product. These findings open new perspectives for the performance enhancement of processing pumpkin powders and their use as food additives for vulnerable populations. On the other hand, particle-level modeling allows for a detailed analysis of how heat and moisture are distributed and transported within each particle during the drying. In this context, all considerations and empirical correlations can vary significantly with the behavior of the vegetable or plant material. Consequently, there could be potential limitations in the applicability of the model. As discussed earlier, the geometric shape of the sample significantly influences its behavior during drying. Therefore, the application of the model, the availability of technology, and the consistency in maintaining the shape, among other factors, need to be evaluated. For future work, it is proposed to utilize the information obtained in this study from particle-level modeling to scale the drying process from the laboratory to the industrial scale. This will involve designing equipment and processes, evaluating efficiency and product quality on a larger scale, and conducting sensitivity analyses and process simulations.

Author Contributions

I.M.: Conceptualization, Methodology, Investigation, Writing—original draft, Software. D.Z.-G.: Conceptualization, Methodology, Investigation, Writing—original draft, Software. Y.B.: Methodology, Formal analysis. M.C.R.: Conceptualization, Methodology, Formal analysis, Investigation. A.F.: Conceptualization, Formal analysis, Funding acquisition. M.P.F.: Conceptualization, Investigation, Formal analysis, Writing—original draft. A.P.B.: Formal analysis, Software. G.M.: Conceptualization, Resources, Formal analysis, Writing—review and editing, Supervision, Project administration, Funding acquisition. R.R.: Conceptualization, Resources, writing—review and editing, Supervision, Project administration, Funding acquisition. All authors have read and agreed to the published version of the manuscript.

Funding

This research was funded by the following Argentine institutions: University of San Juan (PDTS I1471 y E1245 Res.1499/23); the University of Comahue (PIN 2022-04/I260); CONICET-National Scientific and Technical Research Council (PIP 2021–2023-11220200100950CO); ANPCYT-FONCYT (PICT 2019-01810); FONCYT-PICTA RESOL-2022-87 Project Number 20 (2022). Iside Mut and Yanina Baldán have doctoral fellowships from CONICET, Argentina. Daniela Zalazar-García and María Celia Román have post-doctoral fellowships from CONICET, Argentina. María Paula Fabani, Rosa Rodriguez and Germán Mazza are Research Members of CONICET, Argentina.

Institutional Review Board Statement

Ethics approval was not required for the present investigation. It does not involve human participants and/or animals.

Data Availability Statement

The datasheets generated during and/or analyzed during the current study are available from the corresponding author upon reasonable request. The characteristics of used materials are also available on request.

Conflicts of Interest

The authors declare no conflicts of interest.

Abbreviation

dwbDry weight basis
OHCOil holding capacity
PCPumpkin cubes
PPCPumpkin powders from cubes
PPPumpkin puree
PPPPumpkin powders from puree
RMSESquared root squared errors
SSESum of squared errors
SWCSwelling capacity
WHCWater holding capacity

Nomenclature

Symbols
A Surface vector (m2)
BiTThermal Biot number (dimensionless)
BmMass Biot number (dimensionless)
CaConcentration of water vapor in the air (kg/m3)
CpSolid (pumpkin) specific heat (kJ/(kg K))
CsConcentration of water vapor at the surface of the sample (kg/m3)
D0Arrhenius pre-exponential factor (m2/s)
DeffEffective diffusion coefficient (m2/s)
EaActivation energy (kJ/mol)
GLag factor (dimensionless)
gHeat input rate (flux/source boundary condition) (dimensionless)
hmConvective mass transfer coefficient (m/s)
hcHeat transfer coefficient (W/m2 K)
J Gradient term of flux/source boundary condition (dimensionless)
kThermal conductivity (W/m K)
LLength change with respect to time (m)
LeLewis number (dimensionless)
MRMoisture ratio, dimensionless
n Unit vector normal to the transfer area (dimensionless)
NuNusselt dimensionless number (dimensionless)
P v s a t Saturated water vapor pressure (dimensionless)
PrPrandtl dimensionless number (dimensionless)
qCoefficient of a Robin boundary condition of COMSOL (dimensionless)
rR-coordinate (m)
RUniversal gas constant (kJ/mol K)
ReReynolds number (dimensionless)
SdrDrying rate constant (1/s)
SShrinkage ratio (dimensionless)
ScSchmidt dimensionless number (dimensionless)
ShSherwood dimensionless number (dimensionless)
tTime (s)
TSurface temperature (K)
UTerm of the dependent variable of boundary condition (the units of U in the boundary condition depend on the considered variable)
VVelocity module (m/s)
VsVolume of the food sample (m3)
xX coordinate (m)
yY coordinate (m)
zZ coordinate (m)
WSpecific moisture content (kg water/kg dry matter)
Δ H v a p Water vaporization latent heat of (kJ/kg)
Greek letters
α Thermal diffusivity of the material (m2/s)
ι Pumpkin sample thickness length (m)
ρ s Solid (pumpkin) density on a dry basis (kg/m3)
ρ w Water density (kg/m3)
χ2Chi-squared (dimensionless)
τFourier number (dimensionless time), (dimensionless)
Superscripts and subscripts
Prime symbol indicates the dimensionless version of the variable or parameter
0Initial condition
aRelative to the air
eEquilibrium condition
rRelative to the r coordinate direction
satRelative to the saturated vapor
xRelative to the x coordinate direction
yRelative to the y coordinate direction
zRelative to the z coordinate direction

Appendix A

Appendix A.1. Fick’s Equation of Shrinkage

The following assumptions were adopted during the development of the drying model:
  • The equations representing the transport mechanisms had domains in the x and y variables for PC (2D) and in the r variable for PP (1D-axisymmetric).
  • Shrinkage occurs on the x and y axes for PC, and the r axis for PP.
  • The moisture content is homogeneously distributed throughout the volume of the cube or area of puree and slices, respectively, at the initial time.
  • The effective diffusion coefficient is a function of two variables, namely moisture content and temperature.
  • Shrinkage occurs at the interface between the solid and air.
  • Water transport occurs only by diffusive phenomena.
  • Air flux is uniform throughout the convective dryer and drying occurs at isothermal conditions.
  • To model the deformation of PC, the lengths of the x and y axes, which form the structure, were shortened in length ι (see Figure 2a). Thus, the cube walls attached to these axes contract causing the volume reduction.
  • Similarly, for PP samples, the radius to be shortening was considered (see Figure 2b). Although the PP samples do not symmetrically contract (because the tissue structures were broken and decreased in size) were modeled considering the equivalent transfer area calculated from r.
Considering the volume of the food sample, it can be expressed as:
V s = A ι
Since ι decreases as time progresses due to the outgoing water flow through the walls of the food sample (Figure 2), a variation in volume V s (decrease) will occur, causing contraction.
The variation in volume with respect to time can then be expressed as follows:
d dt d V s = d V s dt = d ( A ι ) dt = A d ι dt
where the last term considers that the transfer area remains constant.
On the other hand, Reynolds’s transport theorem states that dV dt can be expressed as the dot product between v n and d S [9]. Here, n is the unit vector perpendicular to the area, defining the direction and velocity module v with which water diffuses through the walls of the sample, and d A represents the differential surface vector (Figure 2). d A and v n have the same direction.
d dt V s = dV dt = v n · d A = v n A
If Fick’s law is expressed in terms of the amount of water (i.e., in the x direction) that diffuses through the sample, Equation (A4) is obtained:
J = ρ s D eff W x
Expressing J in terms of v n and ρ s , Equation (A5), and solve for v n , Equation (A6) is obtained. Equation (A5) represents the kilograms of water per kilogram of dry food or solid that passes through a section of one square meter per second.
v n ρ w = ρ s D eff W x
v n = ρ s ρ w D eff W x
Substituting the value of v n from Equation (A6) and the value of dV dt from Equation (A2) into Equation (A3):
A d ι dt = ρ s ρ w D eff W x A
Simplifying the area A , Equation (A8) results:
d ι dt = ρ s ρ w D eff W x
Equation (A8) represents the contraction term as a function of the moisture content. The variable ι represents the characteristic length. The term d ι dt reflects the change over time. If the sample shrinks or expands during drying, ι also changes. The term x ι represents the relationship between the current position x′ and the characteristic length ι of the sample.
The term d ι dt represents the rate at which the characteristic length ι of the sample changes over time. In mass conservation expression, this term is multiplied by the partial derivative of water concentration in the direction of mass transfer W x to obtain the total contribution of the change in sample length to mass transfer.

Appendix A.2. Dimensionless Transformation of Equation

The equations governing the transport phenomena in drying processes are typically so complex that exact solutions are often impossible. As a result, empirical relationships must be established between variables, rather than relying on analytical solutions. When dealing with more than two variables, such as in this case, involving moisture content, temperature, and shrinkage, the resulting correlations can become complex. However, by logically grouping variables, correlations can be considerably simplified.
In this study, the variables are made dimensionless using the quantities of time, represented by the Fourier number τ , moisture content denoted as W , temperature T , and shrinkage S, which is the solid–air interface position (Equation (A9)). Equation (A10) represents the mass conservation and Equation (A11) represents Equation (A10) in terms of dimensionless variables.
τ = D 0 t ι 0 2 ; W = W W e W 0 W e ; T = T T 0 T a T 0 ; τ = ι ι 0 2

Appendix A.2.1. Mass Conservation

  • For 2D (PC geometry):
W x t = 1 ι 2 x D eff W x + x ι d ι dt W x W y t = 1 ι 2 y D eff W y + y ι d ι dt W y
For 1D (PP geometry):
W t = 1 ι 2 r D eff W r + r ι d ι dt W r
To obtain the dimensionless transformation, it is necessary to express W t in terms of the dimensionless variables defined in (A9), it yields in Equation (A11)
W t = W W 0 W e + W e τ ι 0 2 D 0 W t = W W 0 W e + W e ι 0 2 D 0 τ = D 0 W W 0 W e + W e ι 0 2 τ = D 0 ι 0 2 W W 0 W e τ + W e τ = D 0 ι 0 2 W 0 W e W τ W t ι 0 2 D 0 ( W 0 W e ) = W τ
Analyzing Equation (A11), in order to find the dimensionless expression of the mass variation with respect to the Fourier number, W τ Equation (A10) must be multiplied on both sides by the factor ι 0 2 D 0 ( W 0 W e ) .
The solution of multiplying both terms on the right-hand side of Equations (A10) and (A11) by the factor ι 0 2 D 0 ( W 0 W e ) is shown in Equations (A13)–(A30). The mathematical development was carried out for the x′ dimensionless direction of the pumpkin cube (PC) geometry. The direction along the y′ axis for PC geometry and in the radial direction for pumpkin puree (PP) geometry are obtained analogously by operating similarly.
The first term on the right-hand side of Equations (A10) and (A11) in terms of the dimensionless variables for 2D (PC geometry):
1 ι 2 x D eff W x = 1 S ι 0 2 x D eff D 0 W W 0 W e + W e x 1 ι 2 y D eff W y = 1 S ι 0 2 y D eff D 0 W W 0 W e + W e y
For 1D (PP geometry):
1 ι 2 r D eff W r = 1 S ι 0 2 r D eff D 0 W W 0 W e + W e r
The mathematical development (dimensionless first term) for the x′ direction of the PC geometry:
1 S ι 0 2 x D eff D 0 W W 0 W e + W e x ι 0 2 D 0 ( W 0 W e )
Applying the distributive property of partial derivative, it yields:
1 S ι 0 2 x D eff D 0 W W 0 W e + W e x ι 0 2 D 0 ( W 0 W e )
where W e x = 0
1 S 2 ι 0 2 x D eff D 0 W W 0 W e x ι 0 2 D 0 W 0 W e = 1 S 2 ι 0 2 x D eff D 0 ( W 0 W e ) W x ι 0 2 D 0 W 0 W e
Simplifying the factor W 0 W e , D 0 , and ι 0 2 and rearranging the equation, knowing that diffusivity is isotropic (does not vary with x′), yields:
1 S 2 x D eff W x = D eff S 2 x W x = D eff S 2 2 W x 2
The first dimensionless term of the right-hand side of Equation (A10) for PC geometry:
D eff S 2 x W x = D eff S 2 2 W x 2 D eff S 2 y W y = D eff S 2 2 W y 2
For 1D (PP geometry, Equation (A11)):
D eff S 2 r W r
The second term on the right-hand side of Equation (A10) in terms of the dimensionless variables for 2D (PC geometry):
x ι ι t W x = ι x t W x ι = S ι 0 x τ ι 0 2 D 0 W W 0 W e + W e x S ι 0 y ι ι t W y = ι y t W y ι = S ι 0 y τ ι 0 2 D 0 W W 0 W e + W e y S ι 0
For 1D (PP geometry, Equation (A11)):
r ι ι t W r = ι r t W r ι = S ι 0 r τ ι 0 2 D 0 W W 0 W e + W e r S ι 0
The mathematical development (dimensionless second term) for the x′ direction of the PC geometry:
x ι ι t W x ι 0 2 D 0 ( W 0 W e ) = ι x t W x ι ι 0 2 D 0 ( W 0 W e ) = S ι 0 x τ ι 0 2 D 0 W W 0 W e + W e x S ι 0 ι 0 2 D 0 ( W 0 W e )
Applying the distributive property of the partial derivative yields:
( S ι 0 ) x τ ι 0 2 D 0 W W 0 W e x S ι 0 + W e x S ι 0 ι 0 2 D 0 ( W 0 W e )
where W e x = 0
( S ι 0 ) x τ ι 0 2 D 0 1 S ι 0 W 0 W e W x ι 0 2 D 0 ( W 0 W e ) = ι 0 S x ι 0 2 D 0 τ 1 S ι 0 W 0 W e W x ι 0 2 D 0 ( W 0 W e ) = D 0 ι 0 S ι 0 2 x τ 1 S ι 0 W 0 W e W x ι 0 2 D 0 ( W 0 W e )
Simplifying the factor W 0 W e , D 0 , and ι 0 2 and rearranging the above equation yields:
D 0 ι 0 S ι 0 2 S ι 0 W 0 W e x τ W x ι 0 2 D 0 ( W 0 W e ) = S S x τ W x = x S S τ W x
The second dimensionless term of the right-hand side of Equation (A10) for PC geometry:
x S S τ W x y S S τ W y
For PP geometry (Equation (A11)):
r S S τ W r
Finally, the equation is assembled with all its dimensionless terms to express the mass conservation (Equations (A29) and (A30)):
For PC geometry:
W X τ = D eff S 2 x W x + x S S τ W x W y τ = D eff S 2 y W y + y S S τ W y
For PP geometry:
W r τ = D eff S 2 r W r + x S S τ W r

Appendix A.2.2. Energy Conservation

Similarly, to obtain the dimensionless transformation of the energy conservation Equations (A31) and (A32), it is necessary to express that, in terms of the dimensionless variables defined in (A9), which yields Equation (A36).
Por PC geometry:
T t = 1 ι 2 x α T x + x ι d ι dt T x T t = 1 ι 2 y α T y + y ι d ι dt T y
For PP geometry:
T t = 1 ι 2 r α T r + r ι d ι dt T r
where α is the thermal diffusivity of pumpkin. Substituting the main variables (Equation (A9)) to apply the dimensionless transformation:
T T a T 0 + T 0 τ ι 0 2 D 0 = α ( S ι 0 2 ) 2 T T a T 0 + T 0 x 2 + x S ι 0 d S ι 0 d τ ι 0 2 D 0 T T a T 0 + T 0 x
Similarly, to the procedure used for the dimensionless transformation of the mass conservation equation, the energy equation will be multiplied by the factor ι 0 2 D 0 T a T 0 on both sides to isolate T τ and it yields:
T t = T T a T 0 + T 0 τ ι 0 2 D 0 = D 0 ι 0 2 T T a T 0 τ + T 0 τ
T 0 τ = 0
T t = D 0 ι 0 2 T T a T 0 τ = T a T 0 D 0 ι 0 2 T τ
Rearranging the above equation yields:
T τ = T t ι 0 2 D 0 T a T 0
Analyzing the above equation, to find the dimensionless expression of the energy conservation with respect to the Fourier number, T τ , Equation (A14) must be multiplied on both sides by the factor ι 0 2 D 0 T a T 0 .
Similarly, the mathematical development was carried out for the x′ dimensionless direction of the PC geometry. The direction along the y′ axis for PC geometry and in the radial direction for PP geometry are obtained analogously by operating similarly.
The first term on the right-hand side of Equation (A14) in terms of the dimensionless variables for 2D (PC geometry):
1 ι 2 x α T x = α [ S ι 0 2 ] 2 T T a T 0 + T 0 x 2 1 ι 2 y α T y = α [ S ι 0 2 ] 2 T T a T 0 + T 0 y 2
For 1D (PP geometry):
1 ι 2 r α T r = α [ S ι 0 2 ] 2 T T a T 0 + T 0 r 2
The mathematical development (dimensionless first term) for the x′ dimensionless direction of the PC geometry:
α ( S ι 0 2 ) 2 T T a T 0 + T 0 x 2 ι 0 2 D 0 T a T 0 = α ( S ι 0 2 ) 2 T T a T 0 x 2 + 2 T 0 x 2 ι 0 2 D 0 T a T 0
where 2 T 0 x 2 = 0 .
α ( S ι 0 2 ) T a T 0 2 T x 2 ι 0 2 D 0 T a T 0 = α D 0 S 2 T x 2
where α D 0 = Le .
In the convective drying of food, the Lewis number (Le) characterizes the relationship between the rate of vapor diffusion in the material and the rate of heat.
α D 0 S 2 T x 2 = Le S 2 T x 2
The first dimensionless term of the right-hand side of Equation (A31) for PC geometry:
Le S 2 T x 2 Le S 2 T y 2
For PP geometry:
Le S 2 T r 2
The second term on the right-hand side of Equation (A13) in terms of the dimensionless variables for 2D (PC geometry):
x ι ι t T x = ι x t T x ι = x S ι 0 d S ι 0 d τ ι 0 2 D 0 T T a T 0 + T 0 x y ι ι t T y = ι y t T y ι = y S ι 0 d S ι 0 d τ ι 0 2 D 0 T T a T 0 + T 0 y
For 1D (PP geometry):
r ι ι t T r = ι r t T r ι = r S ι 0 d S ι 0 d τ ι 0 2 D 0 T T a T 0 + T 0 r
The mathematical development (dimensionless first term) for the x′ direction of the PC geometry:
x S ι 0 d S ι 0 d τ ι 0 2 D 0 T T a T 0 + T 0 x ι 0 2 D 0 T a T 0 = x S ι 0 ι 0 D 0 ι 0 2 dS d τ T T a T 0 + T 0 x ι 0 2 D 0 T a T 0 = x S D 0 ι 0 2 d S d τ T a T 0 T x + T 0 x ι 0 2 D 0 T a T 0
where T 0 x = 0 .
Simplifying the factor T a T 0 , D 0 , and ι 0 2 and rearranging the above equation yields:
x S dS d τ T x
The second dimensionless term of the right-hand side of Equation (A31) for PC geometry:
x S dS d τ T x y S dS d τ T y
For PP geometry (Equation (A32)):
T r τ = Le S 2 T r 2 + r S dS d τ T r

Appendix A.2.3. Fick’s Equation of Shrinkage

To obtain the dimensionless transformation of Equation (A8), it is necessary to express that in terms of the dimensionless variables defined in Equation (A9), which yields Equation (A40) for the x′ dimensionless direction of the PC geometry:
dS ι 0 d τ ι 0 2 D 0 = ρ s ρ w D eff D 0 S ι 0 W W 0 W e + W e x = D 0 ι 0 2 ι 0 dS d τ = ρ s ρ w D eff D 0 S ι 0 [ ( W 0 W e ) W x + W e x ] = D 0 ι 0 dS d τ = ρ s ρ w D D 0 S ι 0 W 0 W e W x
Solving dS d τ for Equation (A40) results in:
dS d τ = ρ s ρ w D eff S W 0 W e W x
For PC geometry:
d S x d τ = ρ s ρ w D eff S W 0 W e W x d S y d τ = ρ s ρ w D eff S W 0 W e W y
For PP geometry:
d S r d τ = ρ s ρ w D eff S W 0 W e W r

Appendix A.2.4. General Formulation for Modeling in COMSOL

In general terms, in the COMSOL modeling of processes, partial differential equations are used. The software has a well-defined structure of partial differential equations (PDE) that contains accumulation terms, diffusion terms, and source terms, among others [47]. To enter the equations described in this work, a structure was arranged according to Sandoval et al. [9]:
U t + J x = q   0 x 1
where U is the accumulation term concerning the dimensionless Fourier number; J is the gradient term; q is the variation of moisture content or temperature as a function of contraction.

References

  1. Enneb, S.; Drine, S.; Bagues, M.; Triki, T.; Boussora, F.; Guasmi, F.; Nagaz, K.; Ferchichi, A. Phytochemical Profiles and Nutritional Composition of Squash (Cucurbita moschata D.) from Tunisia. S. Afr. J. Bot. 2020, 130, 165–171. [Google Scholar] [CrossRef]
  2. Bemfeito, C.M.; Carneiro, J.d.D.S.; Carvalho, E.E.N.; Coli, P.C.; Pereira, R.C.; Vilas Boas, E.V.d.B. Nutritional and Functional Potential of Pumpkin (Cucurbita moschata) Pulp and Pequi (Caryocar brasiliense Camb.) Peel Flours. J. Food Sci. Technol. 2020, 57, 3920–3925. [Google Scholar] [CrossRef]
  3. Sathiya Mala, K.; Aathira, P.; Anjali, E.K.; Srinivasulu, K.; Sulochanamma, G. Effect of Pumpkin Powder Incorporation on the Physico-Chemical, Sensory and Nutritional Characteristics of Wheat Flour Muffins. Int. Food Res. J. 2018, 25, 1081–1087. [Google Scholar]
  4. Melese, A.D.; Keyata, E.O. Effects of Blending Ratios and Baking Temperature on Physicochemical Properties and Sensory Acceptability of Biscuits Prepared from Pumpkin, Common Bean, and Wheat Composite Flour. Heliyon 2022, 8, e10848. [Google Scholar] [CrossRef]
  5. Gul, K.; Tak, A.; Singh, A.K.; Singh, P.; Yousuf, B.; Wani, A.A. Chemistry, Encapsulation, and Health Benefits of β-Carotene—A Review. Cogent Food Agric. 2015, 1, 1018696. [Google Scholar] [CrossRef]
  6. Nasrollahzadeh, A.; Mokhtari, S.; Khomeiri, M.; Saris, P.E.J. Antifungal Preservation of Food by Lactic Acid Bacteria. Foods 2022, 11, 395. [Google Scholar] [CrossRef]
  7. Zalazar-Garcia, D.; Román, M.C.; Fernandez, A.; Asensio, D.; Zhang, X.; Fabani, M.P.; Rodriguez, R.; Mazza, G. Exergy, Energy, and Sustainability Assessments Applied to RSM Optimization of Integrated Convective Air-Drying with Pretreatments to Improve the Nutritional Quality of Pumpkin Seeds. Sustain. Energy Technol. Assess. 2022, 49, 101763. [Google Scholar] [CrossRef]
  8. Riveros-Gomez, M.; Baldán, Y.; Román, M.C.; Fabani, M.P.; Mazza, G.; Rodríguez, R. Drying and Rehydration Kinetics of Peeled and Unpeeled Green Apple Slices (Granny Smith Cv). J. Environ. Sci. Health Part B 2022, 57, 835–847. [Google Scholar] [CrossRef]
  9. Sandoval-Torres, S.; Tovilla-Morales, A.S.; Hernández-Bautista, E. Dimensionless Modeling for Convective Drying of Tuberous Crop (Solanum tuberosum) by Considering Shrinkage. J. Food Eng. 2017, 214, 147–157. [Google Scholar] [CrossRef]
  10. Ferreira, M.S.L.; Santos, M.C.P.; Moro, T.M.A.; Basto, G.J.; Andrade, R.M.S.; Gonçalves, É.C.B.A. Formulation and Characterization of Functional Foods Based on Fruit and Vegetable Residue Flour. J. Food Sci. Technol. 2015, 52, 822–830. [Google Scholar] [CrossRef] [PubMed]
  11. Mitiku, D.H.; Bereka, T.Y. Effects of Pumpkin (Cucurbita moschata)/Soybean (Glycine max) Flour Blends on Functional, Physic-Chemical Properties and Sensory Attributes of Breads Produced from Whole Wheat (Triticum aestivum L.). Carpathian J. Food Sci. Technol. 2021, 13, 134–144. [Google Scholar]
  12. Román, M.C.; Mut, I.; Echegaray, M.; Fabani, M.P.; Mazza, G.; Rodríguez, R. Pumpkin Peel Dehydration Using a Fluidized Bed Contactor: A Technical and Environmental Study. Biomass Convers. Biorefinery 2024. [Google Scholar] [CrossRef]
  13. Rahman, M.M.; Joardder, M.U.H.; Khan, M.I.H.; Pham, N.D.; Karim, M.A. Multi-Scale Model of Food Drying: Current Status and Challenges. Crit. Rev. Food Sci. Nutr. 2018, 58, 858–876. [Google Scholar] [CrossRef]
  14. Buvaneswaran, M.; Natarajan, V.; Sunil, C.K.; Rawson, A. Effect of Pretreatments and Drying on Shrinkage and Rehydration Kinetics of Ginger (Zingiber officinale). J. Food Process Eng. 2022, 45, e13972. [Google Scholar] [CrossRef]
  15. Srikiatden, J.; Roberts, J.S. Predicting Moisture Profiles in Potato and Carrot during Convective Hot Air Drying Using Isothermally Measured Effective Diffusivity. J. Food Eng. 2008, 84, 516–525. [Google Scholar] [CrossRef]
  16. Zheng, Z.; Wei, S.; Xie, W.; Ren, L.; Fan, B.; Fu, H.; Yang, D. Determination and Comparison of Effective Moisture Diffusivity of Carrot (Core and Cortex) during Hot Air Drying. J. Food Process Eng. 2022, 46, e14236. [Google Scholar] [CrossRef]
  17. Singh, P.; Talukdar, P. Determination of Shrinkage Characteristics of Cylindrical Potato during Convective Drying Using Novel Image Processing Technique. Heat Mass Transf. Stoffuebertragung 2020, 56, 1223–1235. [Google Scholar] [CrossRef]
  18. Dadmohammadi, Y.; Datta, A.K. Food as Porous Media: A Review of the Dynamics of Porous Properties during Processing. Food Rev. Int. 2022, 38, 953–985. [Google Scholar] [CrossRef]
  19. Marques, B.; Perré, P.; Casalinho, J.; Tadini, C.C.; Plana-Fattori, A.; Almeida, G. Evidence of Iso-Volume Deformation during Convective Drying of Yacón: An Extended van Meel Model Adapted to Large Volume Reduction. J. Food Eng. 2023, 341, 111311. [Google Scholar] [CrossRef]
  20. Maskan, M. Drying, Shrinkage and Rehydration Characteristics of Kiwifruits during Hot Air and Microwave Drying. J. Food Eng. 2001, 48, 177–182. [Google Scholar] [CrossRef]
  21. Seremet, L.; Botez, E.; Nistor, O.V.; Andronoiu, D.G.; Mocanu, G.D. Effect of Different Drying Methods on Moisture Ratio and Rehydration of Pumpkin Slices. Food Chem. 2016, 195, 104–109. [Google Scholar] [CrossRef] [PubMed]
  22. Chikpah, S.K.; Korese, J.K.; Sturm, B.; Hensel, O. Colour Change Kinetics of Pumpkin (Cucurbita moschata) Slices during Convective Air Drying and Bioactive Compounds of the Dried Products. J. Agric. Food Res. 2022, 10, 100409. [Google Scholar] [CrossRef]
  23. Chandramohan, V.P. Convective Drying of Food Materials: An Overview with Fundamental Aspect, Recent Developments, and Summary. Heat Transf.-Asian Res. 2020, 49, 1281–1313. [Google Scholar] [CrossRef]
  24. Katekawa, M.E.; Silva, M.A. A Review of Drying Models Including Shrinkage Effects. Dry. Technol. 2006, 24, 5–20. [Google Scholar] [CrossRef]
  25. Agrawal, S.G.; Methekar, R.N. Mathematical Model for Heat and Mass Transfer during Convective Drying of Pumpkin. Food Bioprod. Process. 2017, 101, 68–73. [Google Scholar] [CrossRef]
  26. Jin, X.; van der Sman, R.G.M.; van Boxtel, A.J.B. Evaluation of the Free Volume Theory to Predict Moisture Transport and Quality Changes During Broccoli Drying. Dry. Technol. 2011, 29, 1963–1971. [Google Scholar] [CrossRef]
  27. Nan, H.; Huang, R.; Zhang, X.; Wang, C. How Does Ball-Milling Elevate Biochar as a Value-Added Peroxydisulfate Activator for Antibiotics Removal? Ind. Crops Prod. 2024, 214, 118569. [Google Scholar] [CrossRef]
  28. Zalazar-Garcia, D.; Fernandez, A.; Rodriguez-Ortiz, L.; Rodriguez, R.; Mazza, G. Sustainable Slow-Pyrolysis Simulation of 12 Lignocellulosic Bio-Wastes: CO2 Emission, Energy, and Water Consumption. IOP Conf. Ser. Earth Environ. Sci. 2022, 952, 012008. [Google Scholar] [CrossRef]
  29. Fernandez, A.; Zalazar-García, D.; Lorenzo-Doncel, C.; Yepes Maya, D.M.; Silva Lora, E.E.; Rodriguez, R.; Mazza, G. Kinetic Modeling of Co-Pyrogasification in Municipal Solid Waste (MSW) Management: Towards Sustainable Resource Recovery and Energy Generation. Sustainability 2024, 16, 4056. [Google Scholar] [CrossRef]
  30. Garau, M.C.; Simal, S.; Femenia, A.; Rosselló, C. Drying of Orange Skin: Drying Kinetics Modelling and Functional Properties. J. Food Eng. 2006, 75, 288–295. [Google Scholar] [CrossRef]
  31. Panyawong, S.; Devahastin, S. Determination of Deformation of a Food Product Undergoing Different Drying Methods and Conditions via Evolution of a Shape Factor. J. Food Eng. 2007, 78, 151–161. [Google Scholar] [CrossRef]
  32. De Michelis, A.; Márquez, C.A.; Mabellini, A.; Ohaco, E.; Giner, S.A. Effect of Structural Modifications on the Drying Kinetics of Foods: Changes in Volume, Surface Area and Product Shape. Int. J. Food Stud. 2013, 2, 188–211. [Google Scholar] [CrossRef]
  33. Márquez, C.A.; de Michelis, A. Comparison of Drying Kinetics for Small Fruits with and without Particle Shrinkage Considerations. Food Bioprocess Technol. 2011, 4, 1212–1218. [Google Scholar] [CrossRef]
  34. Pineda-Vargas, A.J.; Mejía-Doria, C.M.; Duque-Cifuentes, A.L. Evaluation of the Drying Effect on Some Properties of Chayote Flour Sechium edule (Jacq.) Sw. DYNA 2020, 87, 191–195. [Google Scholar] [CrossRef]
  35. Fabani, M.P.; Román, M.C.; Rodriguez, R.; Mazza, G. Minimization of the Adverse Environmental Effects of Discarded Onions by Avoiding Disposal through Dehydration and Food-Use. J. Environ. Manag. 2020, 271, 110947. [Google Scholar] [CrossRef] [PubMed]
  36. FAO. Codex Alimentarius Codex Standard for Wheat Flour. In International Food Standards; FAO: Rome, Italy, 1985; p. 152. [Google Scholar]
  37. Roman, M.C.; Fabani, M.P.; Luna, L.C.; Feresin, G.E.; Mazza, G.; Rodriguez, R. Convective Drying of Yellow Discarded Onion (Angaco INTA): Modelling of Moisture Loss Kinetics and Effect on Phenolic Compounds. Inf. Process. Agric. 2020, 7, 333–341. [Google Scholar] [CrossRef]
  38. AOAC. Official Method of Analysis: Association of Analytical Chemists; AOAC INTERNATIONAL, Ed.; AOAC: Gaithersburg, MD, USA, 2010. [Google Scholar]
  39. Dincer, I.; Dost, S. An Analytical Model for Moisture Diffusion in Solid Objects during Drying. Dry. Technol. 1995, 13, 425–435. [Google Scholar] [CrossRef]
  40. Dincer, I.; Dost, S. A Modelling Study for Moisture Diffusivities and Moisture Transfer Coefficients in Drying of Solid Objects. Int. J. Energy Res. 1996, 20, 531–539. [Google Scholar] [CrossRef]
  41. Onwude, D.I.; Hashim, N.; Janius, R.B.; Nawi, N.; Abdan, K. Modelling Effective Moisture Diffusivity of Pumpkin (Cucurbita moschata) Slices under Convective Hot Air Drying Condition. Int. J. Food Eng. 2016, 12, 481–489. [Google Scholar] [CrossRef]
  42. Brodkey, R.S.; Hershey, H.C. Transport Phenomena: A Unified Approach; McGraw-Hill Series in Marketing; McGraw-Hill: New York, NY, USA, 1988; ISBN 9780070079632. [Google Scholar]
  43. Crank, J. The Mathematics of Diffusion, 2nd ed.; Oxford University Press: London, UK, 1975. [Google Scholar]
  44. Dwivedi, P.N.; Upadhyay, S.N. Particle-Fluid Mass Transfer in Fixed and Fluidized Beds. Ind. Eng. Chem. Process Des. Dev. 1977, 16, 157–165. [Google Scholar] [CrossRef]
  45. Marques, B.C.; Plana-Fattori, A.; Flick, D.; Tadini, C.C. Convective Drying of Yacón (Smallanthus sonchifolius) Slices: A Simple Physical Model Including Shrinkage. LWT 2022, 159, 113151. [Google Scholar] [CrossRef]
  46. COMSOL Multiphysics Comsol Multiphysics Reference Manual: Version 5.6. Manual; 2014; Available online: https://doc.comsol.com/5.5/doc/com.comsol.help.comsol/COMSOL_ReferenceManual.pdf (accessed on 26 June 2024).
  47. Afaghi, N.; Motlagh, A.M.; Seiedlou, S.S.; Hasanpour, A. Simulation Shrinkage and Stress Generated during Convective Drying of Carrot Slices. Int. J. Adv. Biol. Biomed. Res. 2013, 1, 1660–1668. [Google Scholar]
  48. Turner, I.W. A Two-Dimensional Orthotropic Model for Simulating Wood Drying Processes. Appl. Math. Model. 1996, 20, 60–81. [Google Scholar] [CrossRef]
  49. Wang, N.; Brennan, J.G. A Mathematical Model of Simultaneous Heat and Moisture Transfer during Drying of Potato. J. Food Eng. 1995, 24, 47–60. [Google Scholar] [CrossRef]
  50. Sweat, V.E.; Lafayette, W. Experimental values of thermal conductivity of selected fruits and vegetables. J. Food Sci. 1974, 39, 1080–1083. [Google Scholar] [CrossRef]
  51. Rao, M.A.; Rizvi, S.S.; Datta, A.K.; Ahmed. Engineering Properties of Foods; Springer: Singapore, 2014. [Google Scholar]
  52. Mayor, L.; Moreira, R.; Sereno, A.M. Shrinkage, Density, Porosity and Shape Changes during Dehydration of Pumpkin (Cucurbita pepo L.) Fruits. J. Food Eng. 2011, 103, 29–37. [Google Scholar] [CrossRef]
  53. Yang, H.; Sakai, N.; Watanabe, M. Drying Model with Non-Isotropic Shrinkage Deformation Undergoing Simultaneous Heat and Mass Transfer. Dry. Technol. 2001, 19, 1441–1460. [Google Scholar] [CrossRef]
  54. Capossio, J.P.; Fabani, M.P.; Román, M.C.; Zhang, X.; Baeyens, J.; Rodriguez, R.; Mazza, G. Zero-Waste Watermelon Production through Nontraditional Rind Flour: Multiobjective Optimization of the Fabrication Process. Processes 2022, 10, 1984. [Google Scholar] [CrossRef]
  55. Robertson, J.A.; de Monredon, F.D.; Dysseler, P.; Guillon, F.; Amado, R.; Thibault, J.-F. Hydration Properties of Dietary Fibre and Resistant Starch: A European Collaborative Study. LWT—Food Sci. Technol. 2000, 33, 72–79. [Google Scholar] [CrossRef]
  56. ASTM. Annual Book of ASTM Standards; American Society for Testing and Materials Staff: West Conshohocken, PA, USA, 1985; ISBN 9780803106628. [Google Scholar]
  57. Campuzano, A.; Rosell, C.M.; Cornejo, F. Physicochemical and Nutritional Characteristics of Banana Flour during Ripening. Food Chem. 2018, 256, 11–17. [Google Scholar] [CrossRef]
  58. Baldán, Y.; Riveros, M.; Fabani, M.P.; Rodriguez, R. Grape Pomace Powder Valorization: A Novel Ingredient to Improve the Nutritional Quality of Gluten-Free Muffins. Biomass Convers. Biorefinery 2021, 13, 9997–10009. [Google Scholar] [CrossRef]
  59. Yusof, Y.A.; Mohd Salleh, F.S.; Chin, N.L.; Talib, R.A. The Drying and Tabletting of Pitaya Powder. J. Food Process Eng. 2012, 35, 763–771. [Google Scholar] [CrossRef]
  60. Kaveh, M.; Amiri Chayjan, R. Modeling Thin-Layer Drying of Turnip Slices Under Semi-Industrial Continuous Band Dryer. J. Food Process. Preserv. 2017, 41, e12778. [Google Scholar] [CrossRef]
  61. Climate Transparency Comparing G20 Climate Action and Responses to the COVID-19 Crisis. 2020, pp. 1–20. Available online: https://www.climate-transparency.org/wp-content/uploads/2020/11/Climate-Transparency-Report-2020.pdf (accessed on 26 June 2024).
  62. Vega-Gálvez, A.; Di Scala, K.; Rodríguez, K.; Lemus-Mondaca, R.; Miranda, M.; López, J.; Perez-Won, M. Effect of Air-Drying Temperature on Physico-Chemical Properties, Antioxidant Capacity, Colour and Total Phenolic Content of Red Pepper (Capsicum annuum, L. Var. Hungarian). Food Chem. 2009, 117, 647–653. [Google Scholar] [CrossRef]
  63. Balzarini, M.F.; Reinheimer, M.A.; Ciappini, M.C.; Scenna, N.J. Mathematical Model, Validation and Analysis of the Drying Treatment on Quality Attributes of Chicory Root Cubes Considering Variable Properties and Shrinkage. Food Bioprod. Process. 2018, 111, 114–128. [Google Scholar] [CrossRef]
  64. Yuan, Y.; Tan, L.; Xu, Y.; Yuan, Y.; Dong, J. Numerical and Experimental Study on Drying Shrinkage-Deformation of Apple Slices during Process of Heat-Mass Transfer. Int. J. Therm. Sci. 2019, 136, 539–548. [Google Scholar] [CrossRef]
  65. Wang, Z.; Sun, J.; Liao, X.; Chen, F.; Zhao, G.; Wu, J.; Hu, X. Mathematical Modeling on Hot Air Drying of Thin Layer Apple Pomace. Food Res. Int. 2007, 40, 39–46. [Google Scholar] [CrossRef]
  66. Das Purkayastha, M.; Nath, A.; Deka, B.C.; Mahanta, C.L. Thin Layer Drying of Tomato Slices. J. Food Sci. Technol. 2013, 50, 642–653. [Google Scholar] [CrossRef] [PubMed]
  67. Cano-Chauca, M.; Ramos, A.M.; Stringheta, P.; Pereira, J.A.M. Drying Curves and Water Activity Evaluation of Dried Banana. In Proceedings of the Drying 2004—Proceedings of the 14th International Drying Symposium (IDS 2004), São Paulo, Brazil, 22–25 August 2004; Volume C, pp. 2013–2020. [Google Scholar]
  68. Mutuli, G.P.; Gitau, A.N.; Mbuge, D.O. Convective Drying Modeling Approaches: A Review for Herbs, Vegetables, and Fruits. J. Biosyst. Eng. 2020, 45, 197–212. [Google Scholar] [CrossRef]
  69. Aguilera, J.M.; Stanley, D.W. Microstructural Principles of Food Processing and Engineering; Springer Science & Business Media: Berlin, Germany, 1999; ISBN 0834212560. [Google Scholar]
  70. Zzaman, W.; Biswas, R.; Hossain, M.A. Application of Immersion Pre-Treatments and Drying Temperatures to Improve the Comprehensive Quality of Pineapple (Ananas comosus) Slices. Heliyon 2021, 7, e05882. [Google Scholar] [CrossRef]
  71. Rodríguez, Ó.; Gomes, W.; Rodrigues, S.; Fernandes, F.A.N. Effect of Acoustically Assisted Treatments on Vitamins, Antioxidant Activity, Organic Acids and Drying Kinetics of Pineapple. Ultrason. Sonochem. 2017, 35, 92–102. [Google Scholar] [CrossRef] [PubMed]
  72. Garau, M.C.; Simal, S.; Rosselló, C.; Femenia, A. Effect of Air-Drying Temperature on Physico-Chemical Properties of Dietary Fibre and Antioxidant Capacity of Orange (Citrus aurantium v. Canoneta) by-Products. Food Chem. 2007, 104, 1014–1024. [Google Scholar] [CrossRef]
  73. Salehi, F.; Hosseini Ghaboos, S.H. Modeling of Peach Drying Process Using Infrared Dryer by Genetic Algorithm Method. J. Food Technol. Nutr. 2019, 16, 17–26. [Google Scholar]
  74. Brandão, S.C.R.; da Silva, E.M.; de Arruda, G.M.P.; de Souza Netto, J.M.; de Medeiros, R.A.B.; Honorato, F.A.; Azoubel, P.M. Ethanol Pretreatment and Infrared Drying of Melon: Kinetics, Quality Parameters, and NIR Spectra. J. Food Process Eng. 2023, 46, e14269. [Google Scholar] [CrossRef]
  75. Wang, W.; Yan, Z.; Yao, H.; Li, P.; Peng, W.; Su, W.; Wang, Y. Extraction and Purification of Pedunculoside from the Dried Barks of Ilex Rotunda Using Crystallization Combined with Polyamide Column Chromatography. Sep. Sci. Technol. 2021, 56, 1710–1720. [Google Scholar] [CrossRef]
  76. Praznik, W.; Loeppert, R.; Viernstein, H.; Haslberger, A.G.; Unger, F.M. Dietary Fiber and Prebiotics BT. In Polysaccharides: Bioactivity and Biotechnology; Ramawat, K.G., Mérillon, J.-M., Eds.; Springer International Publishing: Cham, Switzerland, 2015; pp. 891–925. ISBN 978-3-319-16298-0. [Google Scholar]
  77. Guiné, R.P.F.; Henrriques, F.; João Barroca, M. Mass Transfer Coefficients for the Drying of Pumpkin (Cucurbita moschata) and Dried Product Quality. Food Bioprocess Technol. 2012, 5, 176–183. [Google Scholar] [CrossRef]
  78. Lewin, M.; Basch, A. Structure, Pyrolysis, and Flammability of Cellulose. Flame-Retard. Polym. Mater. 1978, 2, 1–41. [Google Scholar] [CrossRef]
  79. López Mejía, N.; Morales Posada, N.B.; Lobatón García, H.F. Convective Drying Kinetics of Squash Epicarp of Cucurbita maxima and Its Uses in Developing Gluten-Free Bread. Rev. Mutis 2022, 12, 1–17. [Google Scholar] [CrossRef]
  80. Benítez, V.; Cantera, S.; Aguilera, Y.; Mollá, E.; Esteban, R.M.; Díaz, M.F.; Martín-Cabrejas, M.A. Impact of Germination on Starch, Dietary Fiber and Physicochemical Properties in Non-Conventional Legumes. Food Res. Int. 2013, 50, 64–69. [Google Scholar] [CrossRef]
  81. Chinma, C.E.; Lata, L.J.; Chukwu, T.M.; Azeez, S.O.; Ogunsina, B.S.; Ohuoba, E.U.; Yakubu, C.M. Effect of Germination Time on the Proximate Composition and Functional Properties of Moringa Seed Flour. Afr. J. Agric. Technol. Environ. 2017, 6, 117–133. [Google Scholar]
  82. Miquilena, E.; Higuera, A.M.; Rodríguez, B. Evaluation of Functional Properties of Four Flours from Edible Legume Seeds Cultivated in Venezuela. Rev. Fac. Agron. 2016, 33, 58–75. [Google Scholar]
Figure 1. Logic diagram of the present work.
Agronomy 14 01424 g001
Figure 2. Boundary conditions established in modeling for (a) PC and (b) PP.
Agronomy 14 01424 g002
Figure 3. Model predicted and measured values of W and the model predicted values of T vs. time for PC and PP geometry at 333, 343, and 353 K of drying air temperature.
Agronomy 14 01424 g003
Figure 4. Theoretical and experimental shrinkage evolution over time for (a) PC and (b) PP geometry.
Agronomy 14 01424 g004
Figure 5. WHC, OHC, and SWC of (a) PPC and (b) PPP dried at 333, 343, and 353 K.
Agronomy 14 01424 g005
Table 1. Conservation and shrinkage equations.
Mass Conservation
Applied to the PC geometry:
ρ s W t = x D eff   ρ s W x + ρ s L x W x ρ s W t = y D eff   ρ s W y + ρ s L y W y Equation of mass balance for 2D (PC geometry)(3)
L x = x t ,   L y = y t (4)
x = x ι t ;   0   < x < 1 y = y ι ( t ) ;   0   < y < 1 Dimensionless   variables   for   2 D   ( PC   geometry ) (5)
Applied to the PP geometry:
ρ s W t = r D eff   ρ s W r + ρ s L r W r (6)
L r = r t (7)
r = r ι t ; 0 < r < 1   Dimensionless   variables   for   1 D   ( PP   geometry ) (8)
Energy conservation
Applied to the PC geometry:
ρ s C p T t = x k T x + ρ s C p L x T x ρ s C p T t = y k T y + ρ s C p L y T y Equation of energy balance for 2D (PC geometry)(9)
Applied to the PP geometry:
ρ s C p T t = r k T r + ρ s C p L r T r (10)
Table 2. Boundary condition equations.
Initial conditions
W = W 0
T = T 0
ι = ι 0
(11)
Symmetry considerations
Applied to the PC geometry:
n D eff ρ s W x = h m C S C a n D eff ρ s W y = h m C S C a   Mass   flux   for   2 D (12)
n k T x = h c T a T H vap D eff ρ s W x n k T y = h c T a T H vap D eff ρ s W y Heat   flux     for   2 D (13)
Applied to the PP geometry:
n D eff ρ s W r = h m C S C a Mass   flux   (14)
n k T r = h c T a T H vap D eff ρ s W r Heat   flux   (15)
Table 3. Domain equations.
DomainMathematical Dimensionless ExpressionUnknowns
Mass conservationPC geometry(18)W′
W X τ = D eff S 2 x W x + x S S τ W x W y τ = D eff S 2 y W y + y S S τ W y
PP geometry:
W r τ = D eff S 2 r W r + x S S τ W r
Energy conservationPC geometry(19)T′
T x τ = Le S 2 T x 2 + x S dS d τ T x T y τ = Le S 2 T y 2 + x S dS d τ T y
PP geometry:
T r τ = Le S 2 T r 2 + r S dS d τ T r
Fick’s equation of shrinkageFor PC geometry:(20)S′
d S x d τ = ρ s ρ w D eff S W 0 W e W x d S y d τ = ρ s ρ w D eff S W 0 W e W y
For PP geometry:
d S r d τ = ρ s ρ w D eff S W 0 W e W r
Table 4. Constraint equations.
Flux ConstraintMathematical Dimensionless ExpressionIndependent Variable Value for Specified Boundary Condition
Zero-flux mass D eff S 2 W x x = 0 D eff S 2 W y y = 0 (21) x = 0 y = 0
r = 0
For PP geometry:
D eff S 2 W r r = 0
Flux/source massFor PC geometry:(22) x = 1 y = 1
r = 1
D eff S 2 W x   x = S Bi m ρ s C a W 0 W e C S C a 1 D eff S 2 W y y = S Bi m ρ s C a W 0 W e C S C a 1
For PP geometry:
D eff S 2 W r r = S B m ρ s C a W 0 W e C S C a 1
Zero-flux energy D eff Le 2 T x x = 0 D eff Le 2 T y y = 0 (23) x = 0 y = 0
r = 0
For PP geometry:
D eff Le 2 T r r = 0
Flux/source Energy D eff Le 2 T x x = 1 T S Bi T Δ H vap D eff Le ρ w ρ s W x D eff Le 2 T y y = ( 1 T ) S Bi T Δ H vap D eff Le ρ w ρ s W y (24) x = 1 y = 1
r = 1
For PP geometry:
D eff Le 2 T r r = ( 1 T ) S Bi T Δ H vap D eff Le ρ w ρ s W r
Table 5. Model input parameters.
ParameterExpressionReference
Arrhenius pre-exponential factor
D 0 (m2/s)
Calculated for temperature range (333–353 K)
PC geometry D 0 = 10 5 Calculated from experimental data
PP geometry D 0 = 5 4 Calculated from experimental data
Activation   energy   E a (kJ/mol)Calculated for temperature range (333–353 K)
PC geometry E a = 26.19 Calculated from experimental data
PP geometry E a = 37.17 Calculated from experimental data
Mass Biot number, dimensionless Bi m = h m   ι 0 D eff (25)[8]
Thermal Biot number, dimensionless Bi T = h c   ι 0 k [9]
Latent heat of vaporization (kJ/kg) Δ H vap = 2501.3 2.301 T sat 0.00142 T sat 2 (26)[15]
Heat transfer coefficient (W/m2K)
estimated between (48.8–59.3)
h c = Nu . K air ι 0
Nu = 0.664 Re 1 / 2 Pr 1 / 3   Pr < 1
(27)[47]
Mass transfer coefficient (m/s)
Analogy dimensionless number (forced convection flux and flat plate with laminar flux)
estimated between (0.11–0.124)
h m = Sh   D eff   a ι 0
Sh = 0.664 Re 1 / 2 Sc 1 / 3   0.6 Sc < 50
(28)[25]
Saturated water vapor pressure (Pa) P vsat = 100   exp 20.9006 5204.9 T sat (29)[48]
Water vapor concentration at the surface of the sample (kg/m3) C S = 2.166 × 10 3 P vsat T sat (30)[49]
Thermal conductivity (W/(m K)) k = 0.149 + 0.493 W 1 + W (31)[50]
Specific heat Cp (J/(kg K)) C P = 1.26 + 2.93 W 1 + W (32)[51]
Solid density on a dry basis (kg/m3) ρ s = 1040 (33)[52]
Density liquid water (kg/m3) ρ w = 1000 kg/m3 [53]
Initial moisture content of PC sample
(kg water/kg dry matter)
W 0
8.27 (333 K), 9.20 (343 K) and 9.20 (353 K)
Experimentally determined
Initial moisture content of the PP sample
(kg water/kg dry matter)
W 0
9.00 (333 K), 8.52 (343 K) and 9.00 (353 K)
Experimentally determined
Table 6. Physicochemical properties of pumpkin powder obtained from cubes, dried at 343 and 353 K.
Chemical Property343 K353 K
Moisture content [%]5.0 ± 0.6 a5.4 ± 0.5 a
Ash content [g/100 g dwb]8.26 ± 0.15 a8.01 ± 0.08 a
Lipids [g/100 g dwb]0.47 ± 0.02 b0.33 ± 0.01 a
Protein [g/100 g dwb]10.35 ± 0.30 a10.87 ± 0.72 a
Crude fibers [g/100 g dwb]7.01 ± 0.08 a13.58 ± 0.42 b
Total carbohydrates [g/100 g dwb]76.0 ± 0.2 a75.4 ± 0.8 a
Total energy [kcal/100 g dwb]349 ± 2 a348 ± 3 a
ANOVA. The same letters indicate non-significant differences between pumpkin powder samples (p > 0.05).
Table 7. SEC values and CO2 emissions for PPC samples at different temperatures.
333 K343 K353 K
SEC [kW/kg]3911.443592.853502.97
CO2 emissions [kg CO2/kW]1401.471287.321255.11
Table 8. Innovative contributions of this research.
AspectIn this StudySimilarities and DifferencesReferenced Studies
Impact of
temperature
Higher temperatures accelerate the drying rate, leading to greater moisture removal and shorter drying timesSimilar observationBalzarini et al. [63]; Yuan et al. [64]; Wang et al. [65]; Das Purkayastha et al. [66]
Falling rate periodNo constant rate phase was identified in the drying process; the entire drying process was in the falling rate periodSimilar observationCano-Chauca et al. [67]; Das Purkayastha et al. [66]
Geometry and surface areaDifferences between PC and PP geometries; smaller surface area in PP reduces the moisture transfer rateNo study emphasized the difference in geometry and moisture transfer rate-
Shrinkage effectsSignificant shrinkage and crack formation in PP affect the area of mass and heat transferDrying quality was mentioned but not delved into the effects of shrinkage and crackingBalzarini et al. [63]
Particle-level modelingIncorporates shrinkage effects and captures complex phenomena, surpassing limitations of empirical modelsThere was a focus on linear and empirical contraction models, but they did not fully capture complex phenomenaGarau et al. [30]; Panyawong and Devahastin [31]
Disclaimer/Publisher’s Note: The statements, opinions and data contained in all publications are solely those of the individual author(s) and contributor(s) and not of MDPI and/or the editor(s). MDPI and/or the editor(s) disclaim responsibility for any injury to people or property resulting from any ideas, methods, instructions or products referred to in the content.

