Abstract
Slow-release fertilizer (SRF) improves Kimchi cabbage (KC) productivity in the Highlands of Gangwon Province in South Korea; however, optimum rates for the region are not established. This study investigated the optimum and most economical rate of SRF that maximizes KC yield, nutrient uptake and nitrogen use efficiency (NUE) and enhances soil quality in two experiments at the Highland Agriculture Research Institute. Post-harvest soil N (mg kg−1), P2O5 (mg kg−1), K, Ca and Mg (cmolc kg−1), pH (1:5), electrical conductivity (EC; dSm−1) and organic matter (OM; g kg−1) were measured to assess soil quality. Added net returns (ANR) of treatments were evaluated. Recommended N rate (238 kg ha−1) for KC production was the basis for treatment applications. Treatments included no fertilizer control (‘nf’), full N recommendation SRF (SF1), ½ N recommendation SRF (SF0.5), double N recommendation SRF (SF2) and full N recommendation conventional fast fertilizer (FF). Results showed that SF0.5, SF1 and SF2 influenced the highest KC marketable yield in both experiments (66–74 and 42–66 Mg ha−1, respectively). SRF rates between 0.5 and 1 times the N recommendation produced the highest possible linear increases in marketable yield; and the most economical, with ANR > KRW 83 million ha−1 in the first experiment and > KRW 22 million ha−1 in the second. Crop N, P, K, Ca and Mg uptakes were highest among the three SRF rates in both experiments. SF0.5 influenced the highest (91%) NUE in the first experiment; however, it left 8 mg kg−1 N by the end of this experiment compared to the start-up 27.2 mg kg−1 N. Thus, nutrient mining occurred. Soil N increased between 23 and 135 mg kg−1 by SF 1 and 2 in both experiments. Soil EC spiked to 0.6 dSm−1 from the initial level of 0.2 dSm−1 by SF2 in the first experiment. Soil pH, P2O5, K, Ca and Mg levels post-harvest were comparable among treatments in both experiments. SF0.5, 1 and 2 increased soil OM by 7–16% above pre-experimental levels in the second experiment. In conclusion, SRF rates between 0.5 and 1 for KC produced the maximum corresponding KC yield and were the most economical. SRF rates ≤ 0.5 pose risks of nutrient mining, which could jeopardise native soil fertility. SF1 and 2 improved some soil quality indices (N and OM). However, SF2 potentiates risks of soil salinity and large P losses, and it is less economical. Therefore, for holistic sustainability of the cropping system, the optimum SRF rate should lie between 0.5 and 1 N recommendation.
1. Introduction
Slow-release fertilizer (SRF) releases nutrients slowly and reduces the amount of excess nutrients running off into storm drains or seeping into groundwater [1,2,3]. The slow mode of nutrient release allows time for nutrient mineralization to synchronize with critical crop nutrient demand periods [4]; hence, it could meet the nutrient requirements of crops like vegetables for an entire growing period [5]. Whereas conventional fast fertilizer (CF) releases nutrients fast, leading to rapid nutrient losses through leaching or evaporation at early crop growth stages, which reduces nutrient availability to crops and pollutes the environment [6]. Ni et al. [7] found that, compared to CF, SRF could effectively improve water use efficiency and prolong irrigation cycles in drought-prone areas. SRFs facilitate better N uptake and utilization efficiency by crops [8]. Zareabyaneh et al. [9] confirmed higher N uptake and 25% to 90% increase in N use efficiencies with three different brands of SRFs compared to conventional urea in two years. Li et al. [10] also observed 12.3% increase in nitrogen use efficiency with the supply of 405 kg ha−1 N through SRF compared to the same rate through CF.
One important characteristic of a sustainable soil management strategy is its ability to enhance soil quality and maintain native soil fertility. Many studies have evaluated the effect of SRFs on soil nutrient statuses after harvest with divergent findings. Wang et al. [11] found increases in soil P with SRF application compared with conventional fertilizer, though soil NO3− declined by 35% with the same SRF treatment. In another study, Wang et al. [12] found 42% and 58% decreases in soil N and P, respectively, after crop harvest following SRF application compared with CF. They attributed the decreased soil nutrient statuses to polymer coatings on SRFs which effectively reduce dissolution of nutrients, so that extremely large amounts of nutrients are not released at any point in time. Studies that have found higher soil nutrient statuses with SRF after harvest have attributed it to the low biodegradability of SRF polymer coatings, which allow nutrients a longer residual time in the soil [13,14,15].
Kimchi cabbage is one of the major crops cultivated in the mountainous Highlands of Gangwon Province, with continuous fertilizer application to increase yield and productivity [16]. Considering the documented agronomic and environmental advantages of SRF, it could be a huge benefit to Kimchi cabbage production and the environment in this region, where water runoff with associated soil and nutrient losses is unavoidable. Kim et al. [17] demonstrated that SRF produces a similar Kimchi cabbage yield to CF in the Highlands. In their study, Kim et al. [17] compared the two fertilizers based on the standard NPK rates recommendation by the Rural Development Administration in Korea. Due to the high heterogeneity of soil [10], temporal and spatial variability in soil nutrient requirements and crop yield, the versatility of fertilizer in different environments [18] and the fact that SRFs are still being introduced in the Highland region, it is important to establish whether the SRF recommendation is optimum for the region in terms of Kimchi cabbage productivity. Such site-specific nutrient recommendations have been made in many other parts of the world to encourage precision agriculture and reduce fertilizer inadequacies or wastage [19,20,21].
One downside to the use of SRF is that it can be 10 to 15 times more expensive per kg of N compared to CF [1]. However, many studies have demonstrated that it is more economical in terms of nutrient use efficiency and crop yield compared to its CF counterparts. Thus, SRF gives greater value for money invested than CF. Wang et al. [12] quantified 47% more economic profitability of Allium tuberosum, with the supply of 1369.5 kg ha−1 N through SRF, compared to same rate through CF. Li et al. [10] also observed an 18.1% increase in economic profitability of spring maize with the application of 405 kg ha−1 N through SRF compared to same rate through CF. Since farming in the Highlands is mostly a commercial venture, it is also important to demonstrate to farmers that a reciprocal value in profits will be obtained for the increase in investment they make in fertilizer costs.
In line with the above background literature, the overall objective of the study was to identify the rate of SRF which influences the optimum Kimchi cabbage yield, enhances soil nutrient statuses and is economical to farmers. The objective was achieved in two experiments. We varied the rates of N supplied through SRF in this study to identify the most suitable one for the region, and compared it with conventional fast fertilizer. This is important to meet specific Kimchi cabbage nutrient needs in the Highlands. N mineralization over time, N and other nutrient uptakes and N use efficiency with increasing rates of SRF and CF were also determined. These measures are indices of the efficiencies of the fertilizer rates and types. Higher N efficiencies indicate lower losses and reduced environmental pollution. We quantified soil nutrient statuses post-harvest, to determine the effect of treatments on the sustainability of the cropping system. The economic viability of fertilizer rates was determined using added net returns [22] in partial budgets.
2. Materials and Methods
2.1. Study Site
Two experiments were conducted at the Highland Agriculture Research Institute (37°40′48.01″ N 28°43′51.0″ E) during the Kimchi cabbage growing seasons in the Gangwon Province. One experiment was conducted on a flat terrain from the beginning of June to the end of July 2023, and the other on a sloped (7%) terrain from early August to early October 2023.
2.2. Initial Soil Sampling and Analysis
In both experiments, initial soil analysis was conducted to characterize the soil before treatment imposition. Six soil samples were collected randomly with an auger at 15 cm depth from each field. Plant debris in the top 1 cm of each sample was removed to avoid wrong estimations of the soil parameters. The soil was air-dried, composited, mixed thoroughly and sifted through a 2 mm sieve before the analysis. The soil was analyzed for pH, electrical conductivity (EC), organic matter (OM) content, ammonium nitrogen concentration (NH4+-N), nitrate nitrogen concentration (NO3−-N), available phosphorus pentoxide concentration (P2O5) and exchangeable cations [potassium (K), magnesium (Mg), calcium (Ca)]. All soil parameters were analyzed and rated using the standard analysis methods of the RDA-National Institute of Agricultural Sciences [23,24]. Table 1 shows the soil chemical properties before treatment imposition in both experiments.

Table 1.
Soil characteristics before experiment.
Soil pH was determined with a pH meter at a soil to distilled water ratio of 1:5. Soil C concentrations were determined with an elemental analyzer (Orion Versa Star Thermo, Waltham, MA, USA). They were converted to soil organic matter values by multiplying by a factor of 1.75. Soil nitrates (NO3−-N) and ammonium (NO3−-N) concentrations were measured using the KjelMaster system (K-375-Buchi, Flawil, SG, Switzerland). Soil available P was quantified calorimetrically at 720 nm wavelength with a UV-VIS spectrophotometer (Lambda 365, Perkin Elmer, Waltham, MA, USA). Exchangeable cations (Ca, K and Mg) were extracted with 1N mono-ammonium acetate and measured with inductively coupled plasma. According to the soil ratings [24], soil pH was within the optimum range (6–6.5) before both experiments started. Soil EC was in the optimum range (<2 dSm−1) in both experiments. Soil OM was within the optimum range (25–35 g kg−1) in both experiments. Soil NO3− and NH4+ levels were very poor (below the optimum range of 50–200 mg kg−1) in both experiments. Available P2O5 was slightly below the optimum range (350–450 mg kg−1) in the first experiment and very poor in the second experiment. Soil K concentration was below the optimum range (0.65–0.80 cmolc kg−1) in the first experiment but within range in the second experiment. Soil Ca concentration was below the optimum range (5.0–6.0 cmolc kg−1) in the first experiment and within range in the second experiment. Soil Mg concentration was slightly below the optimum (1.5–2.0 cmolc kg−1) in both experiments.
2.3. Treatment Application and Experimental Design
Only the recommended N rate for Kimchi cabbage was considered for the experiments, though P and K were also supplied through the fertilizers. Boron (U.S. Borax) was applied as a basal fertilizer to all treatments (including the no fertilizer control) at a rate of 10 kg ha−1. The full recommended N rate applied to Kimchi cabbage was 238 kg ha−1 (adopted from [24]). Treatments applied in both experiments included the following: the control (‘nf’), ½ the recommended N rate through SRF (SF0.5), the full N rate supplied through SRF (SF1), double the rate of recommended N supplied through SRF (SF2) and the full rate of N supplied through conventional fast fertilizer (FF). The NPK ratio in the brand of SRF used was 22:10:10. A total of 1082 kg ha−1 of SRF was applied for the full N recommendation, which supplied 238:108:108 kg ha−1 NPK to crops. Half and double the rate were applied in SF0.5 and SF2, respectively. SRF was applied one week before transplanting KC. FF was applied as a mixture of urea, fused phosphates and muriate of potash. Urea, fused phosphate and muriate of potash were split-applied at 83:30:39 kg ha −1 NPK one week before KC transplant; 77.5:15:16 kg ha −1 at one month after transplanting and the same rate six weeks after transplanting in the first experiment. The same split rates were applied in the second experiment at one week before transplant, five weeks after transplant and 7 weeks after transplant. A total of 238:60:71 kg ha−1 NPK was applied through FF. The treatments were replicated three times in both experiments in randomized complete block designs (RCBD). Fertilizers were applied by the broadcasting method.
2.4. Land Preparation, Kimchi Cabbage Planting and Agronomic Practices
Initial soil sampling was undertaken before land preparation. The vegetation on the land was ploughed into the soil together with 1125 kg ha−1 unslaked lime (CaO), one month before KC transplant. One week before transplant, harrowing was carried out with a rotary tiller. Two days after this, fertilizers, insecticide and fungicide were applied. Furrows were made on the same day and the land was mulched with black polythene bags for weed control. One week later, 26-day old KC seedlings were transplanted. Insecticide was applied to the seedlings on this day. The seedlings were planted at adistance of 70 cm by 35 cm. There were 162 seedlings in a plot. Each treatment plot measured 40 m2 in both experiments.
2.5. Rainfall Distribution in the Two Experiments
There were 11 rainfall events in the first experiment. The events were relatively regular and low, compared to the second experiment. Rainfall amounts ranged from 23 to 52 mm, while intensities ranged from 13 to 157 MJ mmha−1h−1. Nine rainfall events were recorded in the second experiment. They were relatively erratic with rainfall amounts ranging from 17 to 146 mm and intensities ranging from 6 to 474 MJ mmha−1h−1. Altogether, a total of 339 and 487 mm of rainfall amounts and average intensities of 58 and 155 MJ mmha−1h−1 were received in the first and second experiments, respectively. Figure S1 shows the rainfall amounts and intensities throughout the KC cultivation periods in both experiments.
2.6. Data Collection
2.6.1. Soil Data
Three soil samples were collected randomly from each treatment plot at 15 cm depth with an auger at 20 days after fertilization (DAF), 40 DAF and 60 DAF for NH4+-N and NO3−-N analyses during each experiment. After the Kimchi cabbage harvest, soil samples were collected and analyzed for pH, EC, OM, NH4+-N, NO3−-N, P2O5, K, Mg and Ca.
2.6.2. Plant Production and Yield Data
Ten cabbage plants were harvested randomly from the middle of a plot, avoiding the borderlines at the edges. They were cut above ground level and data was collected on plant weight. Old necrotic leaves were detached and the heads were weighed per total harvest area, and extrapolated to tons per hectare as marketable yield. Other data collected included head height, head width, leaf length, leaf number and leaf width.
2.7. Partial Budget Analysis
‘Added net returns (ANR)’ was used to analyze the economic viability of applied treatments. ANR was calculated as follows (adapted from [22]):
where added gross returns = [yield (kg) of treated plot − yield (kg) of control] × price/kg; added variable costs = cost of (fertilizer + fertilizer application cost). Other production costs not included in the analysis are constants running through all the treatments.
2.8. Nitrogen, Use Efficiency, Supply and Uptake Calculations
Nitrogen use efficiency (NUE) was calculated with the following formula by [25,26]:
Nitrogen and other nutrient uptake was calculated with the following formula by [27]:
To determine nutrient content, the above-ground KC samples were dried at 70 °C for two days and ground with a high-powered blender into a very fine texture. The elemental analyzer (Vario Max, Hanau, Germany) method was used to determine the N content of 0.28 g of sample. A total of 0.5 g of the ground samples was digested with 10 mL of 60% HNO3 in a microwave (AMDS Ethos 1, Milestone S&T Co., Gallarate, VA, Italy) at 200 °C. P concentrations of the digestate were determined with a spectrophotometer (UV-VIS Lambda 365, Perkin Elmer, Waltham, MA, USA) at a wavelength of 470 nm. Ca, K and Mg concentrations of the same digestate were determined on the Inductively Coupled Plasma (ICP) spectrometry (Avio 550 Max, Perkin Elmer, Waltham, MA, USA).
Nitrogen supplied to crops was calculated with the following formula:
2.9. Statistical Analysis
All collected data were subjected to analysis of variance (ANOVA) using IBM SPSS Statistics 20. Statistically significant treatment means were separated with Fisher’s Least Significant Differences (LSD) at 95% confidence level and 5% probability.
3. Results
3.1. Crop Performance
3.1.1. Plant Growth and Yield Parameters
The three SRF rates (SF0.5, SF1, SF2) influenced the highest (p ≤ 0.05) marketable yield of KC (66–75 Mg ha−1). It was followed by FF (47 Mg ha−1) and then lastly ‘nf’ (24 Mg ha−1) in the first experiment (Table 2). A similar trend was followed for other measured plant parameters including the following: plant weight; head height, weight and width; and leaf length, number and width (Table 2). In the second experiment, marketable yield among treatments followed the following order: SF2 (66 Mg ha−1) > SF1 (55 Mg ha−1) > SF0.5 (43 Mg ha−1) > FF (38 Mg ha−1) > ‘nf’ (19 Mg ha−1) (Table 2). The other measured plant parameters followed a similar trend (Table 2). Generally, KC crops were more productive in the first experiment than the second experiment (Table 2).
Table 2.
Effect of 0.5, 1 and 2× the rate of SRF (SF0.5, SF1, SF2), fast fertilizer (FF) and no amendment control (‘nf’) on the production parameters and marketable yield of KC in the first and second experiments. Standard errors of the means are attached to the fertilizer treatment means after the (±) sign. Lower case letters in superscripts (following the numbers) show differences in the treatment means of each measured parameter.
3.1.2. Kimchi Cabbage Yield Response to SRF
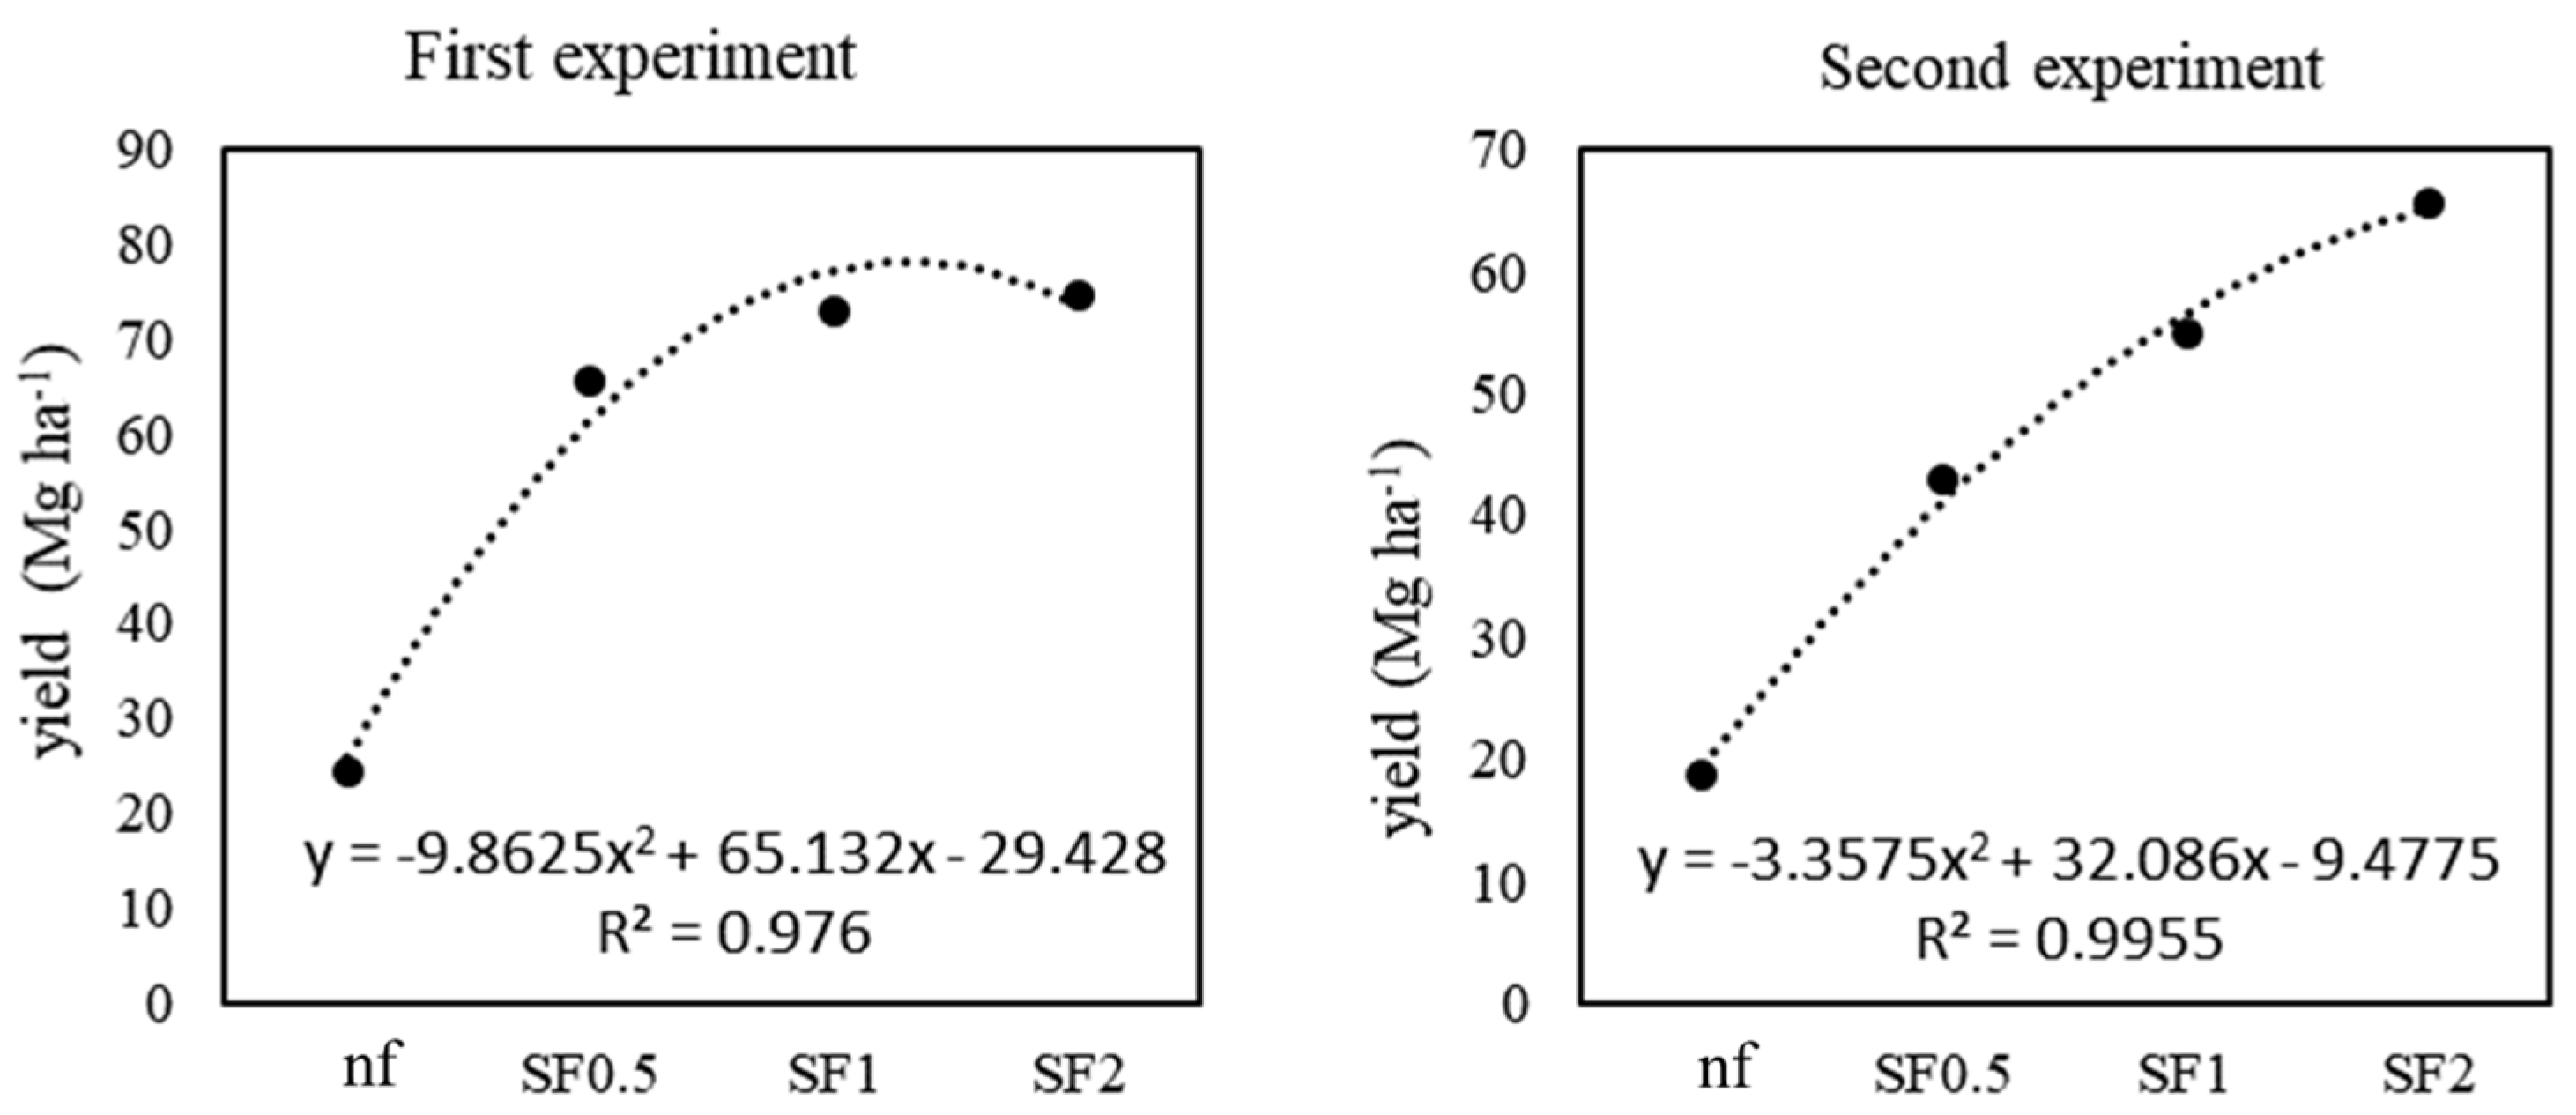
In the first experiment, marketable yield affected by the increasing order of SRF rates followed a polynomial (quadratic) response curve [y = −9.8625x2 + 65.132x − 29.428] (Figure 1). Yields from 0 to the ½ rate of SRF were in the linear range. Yield peaked around 78 Mg ha−1 at about SF1.2, after which yield started to decline. Another quadratic model [y = −3.3575x2 + 32.086x − 9.4775] (Figure 1) was followed for the increasing SRF rates in the second experiment; yield responses were in the linear range up to SF1 in this experiment. A peak point was not observed in this yield response curve.

Figure 1.
Kimchi cabbage yield response to the increasing rates of SRF in the first and second experiments.
3.1.3. Economic Analysis of Fertilizers
Partial budget analysis for the first and second experiments are shown in Table 3. In the first experiment, added gross returns on KC yield ranged from KRW 47,063,873 ha−1 to KRW 103,783,990 ha−1 in the following treatment order: SF2 > SF1 > SF0.5 > FF. Added variable costs (total costs associated with only treatment applications) ranged from KRW 1,393,913 ha−1 to KRW 4,802,213 in the following order: SF2 > SF1 > SF0.5 > FF. Added net returns ranged from KRW 45,249,585 ha−1 to KRW 98,981,777 ha−1 in the same treatment order. Increases in added net returns of an SRF treatment relative to the next highest SRF treatment were as follows: SF0.5 to SF1—KRW 13,905,357 ha−1; SF1 to SF2—KRW 1,400,474 ha−1. Added net returns of SF1 were 54% higher than those of FF (same N amount applied). In the second experiment, added gross returns on KC yield ranged from KRW 18,757,845 ha−1 to KRW 45,930,790 ha−1 in the following order: SF2 > SF1 > SF0.5 > FF. Added variable costs (total costs associated with only treatment applications) ranged from KRW 1,393,913 to 4,802,213 ha−1 in the following treatment order: SF2 > SF1 > SF0.5 > FF. Added net returns ranged from KRW 16,943,557 ha−1 to KRW 41,128,577 ha−1 in the same treatment order. Increases in added net returns of an SRF treatment relative to the next highest SRF treatment were as follows: SF0.5 to SF1—KRW 10,772,245 ha−1; SF1 to SF2—KRW 8,168,395 ha−1. Added net returns of SF1 were 49% higher than those of FF (same N amount applied).
Table 3.
Economic analysis (ANR) of SRF and CF treatments in the first and second experiments.
3.2. Nutrient Mineralization, Uptake and Use Efficiency
3.2.1. Nitrogen
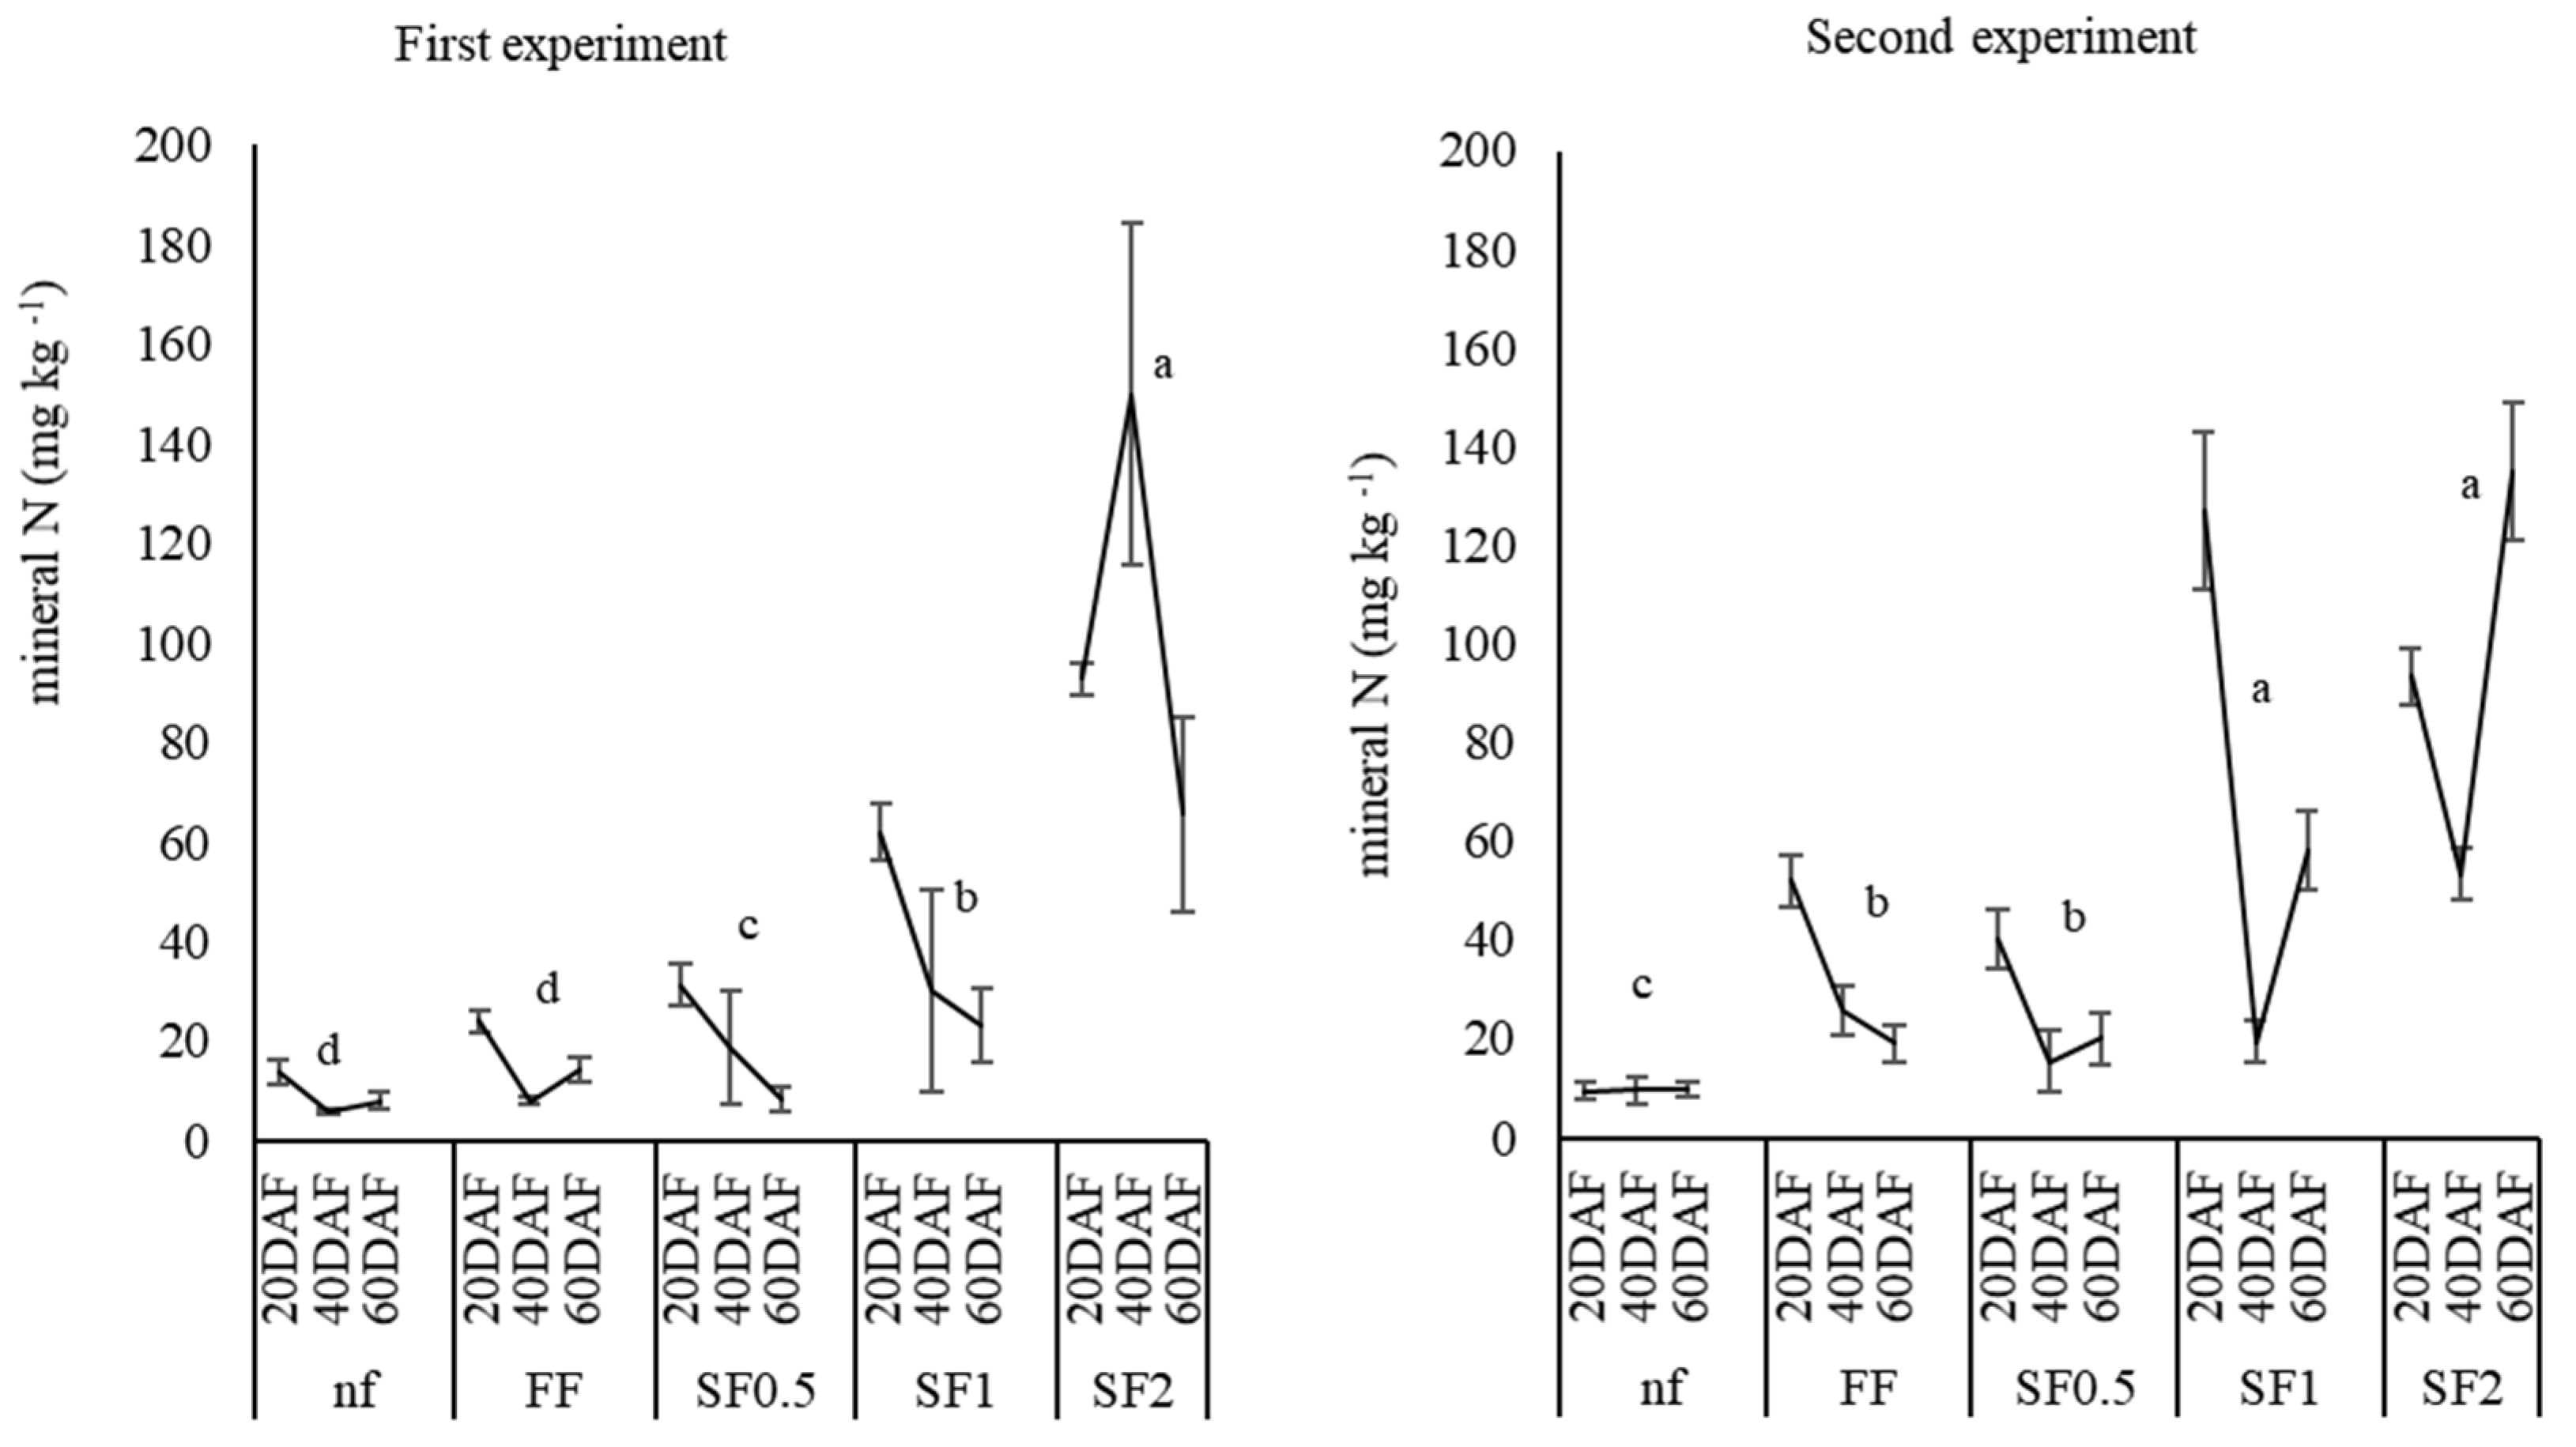
Put together, fertilizer N and inherent soil N supplied 54, 173, 292, 530 and 292 kg ha−1 from ‘nf’, SF0.5, SF1, SF2 and FF, respectively, to crops in the first experiment (Table 4). SF2 retained the most N from 20 DAF to close to the end of the study (60 DAF), while FF and ‘nf’ retained the least (Figure 2) from 20 DAF to close to the end of the study.
Table 4.
Total N supplied, N uptake and N use efficiencies in the first and second experiments, affected by 0.5, 1 and 2× the rate of SRF (SF0.5, SF1, SF2), fast fertilizer (FF) and no amendment control (‘nf’). Lower case letters in subscripts (following the numbers) show differences in the fertilizer treatment means of the N parameters.

Figure 2.
Retained mineralized N (mg kg−1) in the soil from 0.5, 1 and 2× the rate of SRF (SF0.5, SF1, SF2), fast fertilizer (FF) and no amendment control (‘nf’) at 20, 40 and 60 DAF applications (before transplanting KC seedlings), in the first and second experiments. Error bars represent standard errors of the treatment means of all three sampling dates. Lower case letters (on top of each figure) show differences in the fertilizer treatment means at p ≤ 0.05 LSD test.
Though SF1 and FF received similar inputs, SF1 retained more soil N than FF within the monitoring period. From these supplies, SF2 affected the highest (p < 0.05) N uptake (223 kg ha−1), followed by SF1 and SF0.5 (181 and 179 kg ha−1), and then FF (165 kg ha−1) and lastly ‘nf’ (71 kg ha−1) (Table 4). SF0.5 and ‘nf’ influenced more N uptake (179 and 71 kg ha−1, respectively, Table 4) than was supplied to crops (173 and 54 kg ha−1, respectively). SF0.5 was the most N-efficient treatment with N use efficiency of 91% (Table 4), while FF, SF1 and SF2 were the least N-efficient (NUE: 32–46%). Close to the end of the study, SF0.5 soil N level (8 mg kg−1) was lower than the initial level (27.2 mg kg−1) in the first experiment, while SF1 and 2 influenced between 23 and 135 mg N kg−1 in this experiment.
In the second experiment, N supply to crops was 30 kg ha−1 (’nf’), 149 kg ha−1 (SF0.5), 268 kg ha−1 (SF1), 506 kg ha−1 (SF2) and 268 kg ha−1 (FF) (Table 4). Again, SF2 and SF1 retained the highest soil N across 20, 40 and 60 DAF, followed by FF and SF0.5 and lastly ‘nf’ (Figure 2). From the supplies, N uptake by SF2 was the highest (209 kg ha−1), followed by FF and SF1 (141 and 131 kg ha−1), and then lastly by SF0.5 (93 kg ha−1). NUE ranged from 25 to 32%, and was similar among the fertilizer treatments (Table 4). In general, the treatments were more N-efficient in the first experiment than the second experiment.
3.2.2. Uptake of Other Nutrients
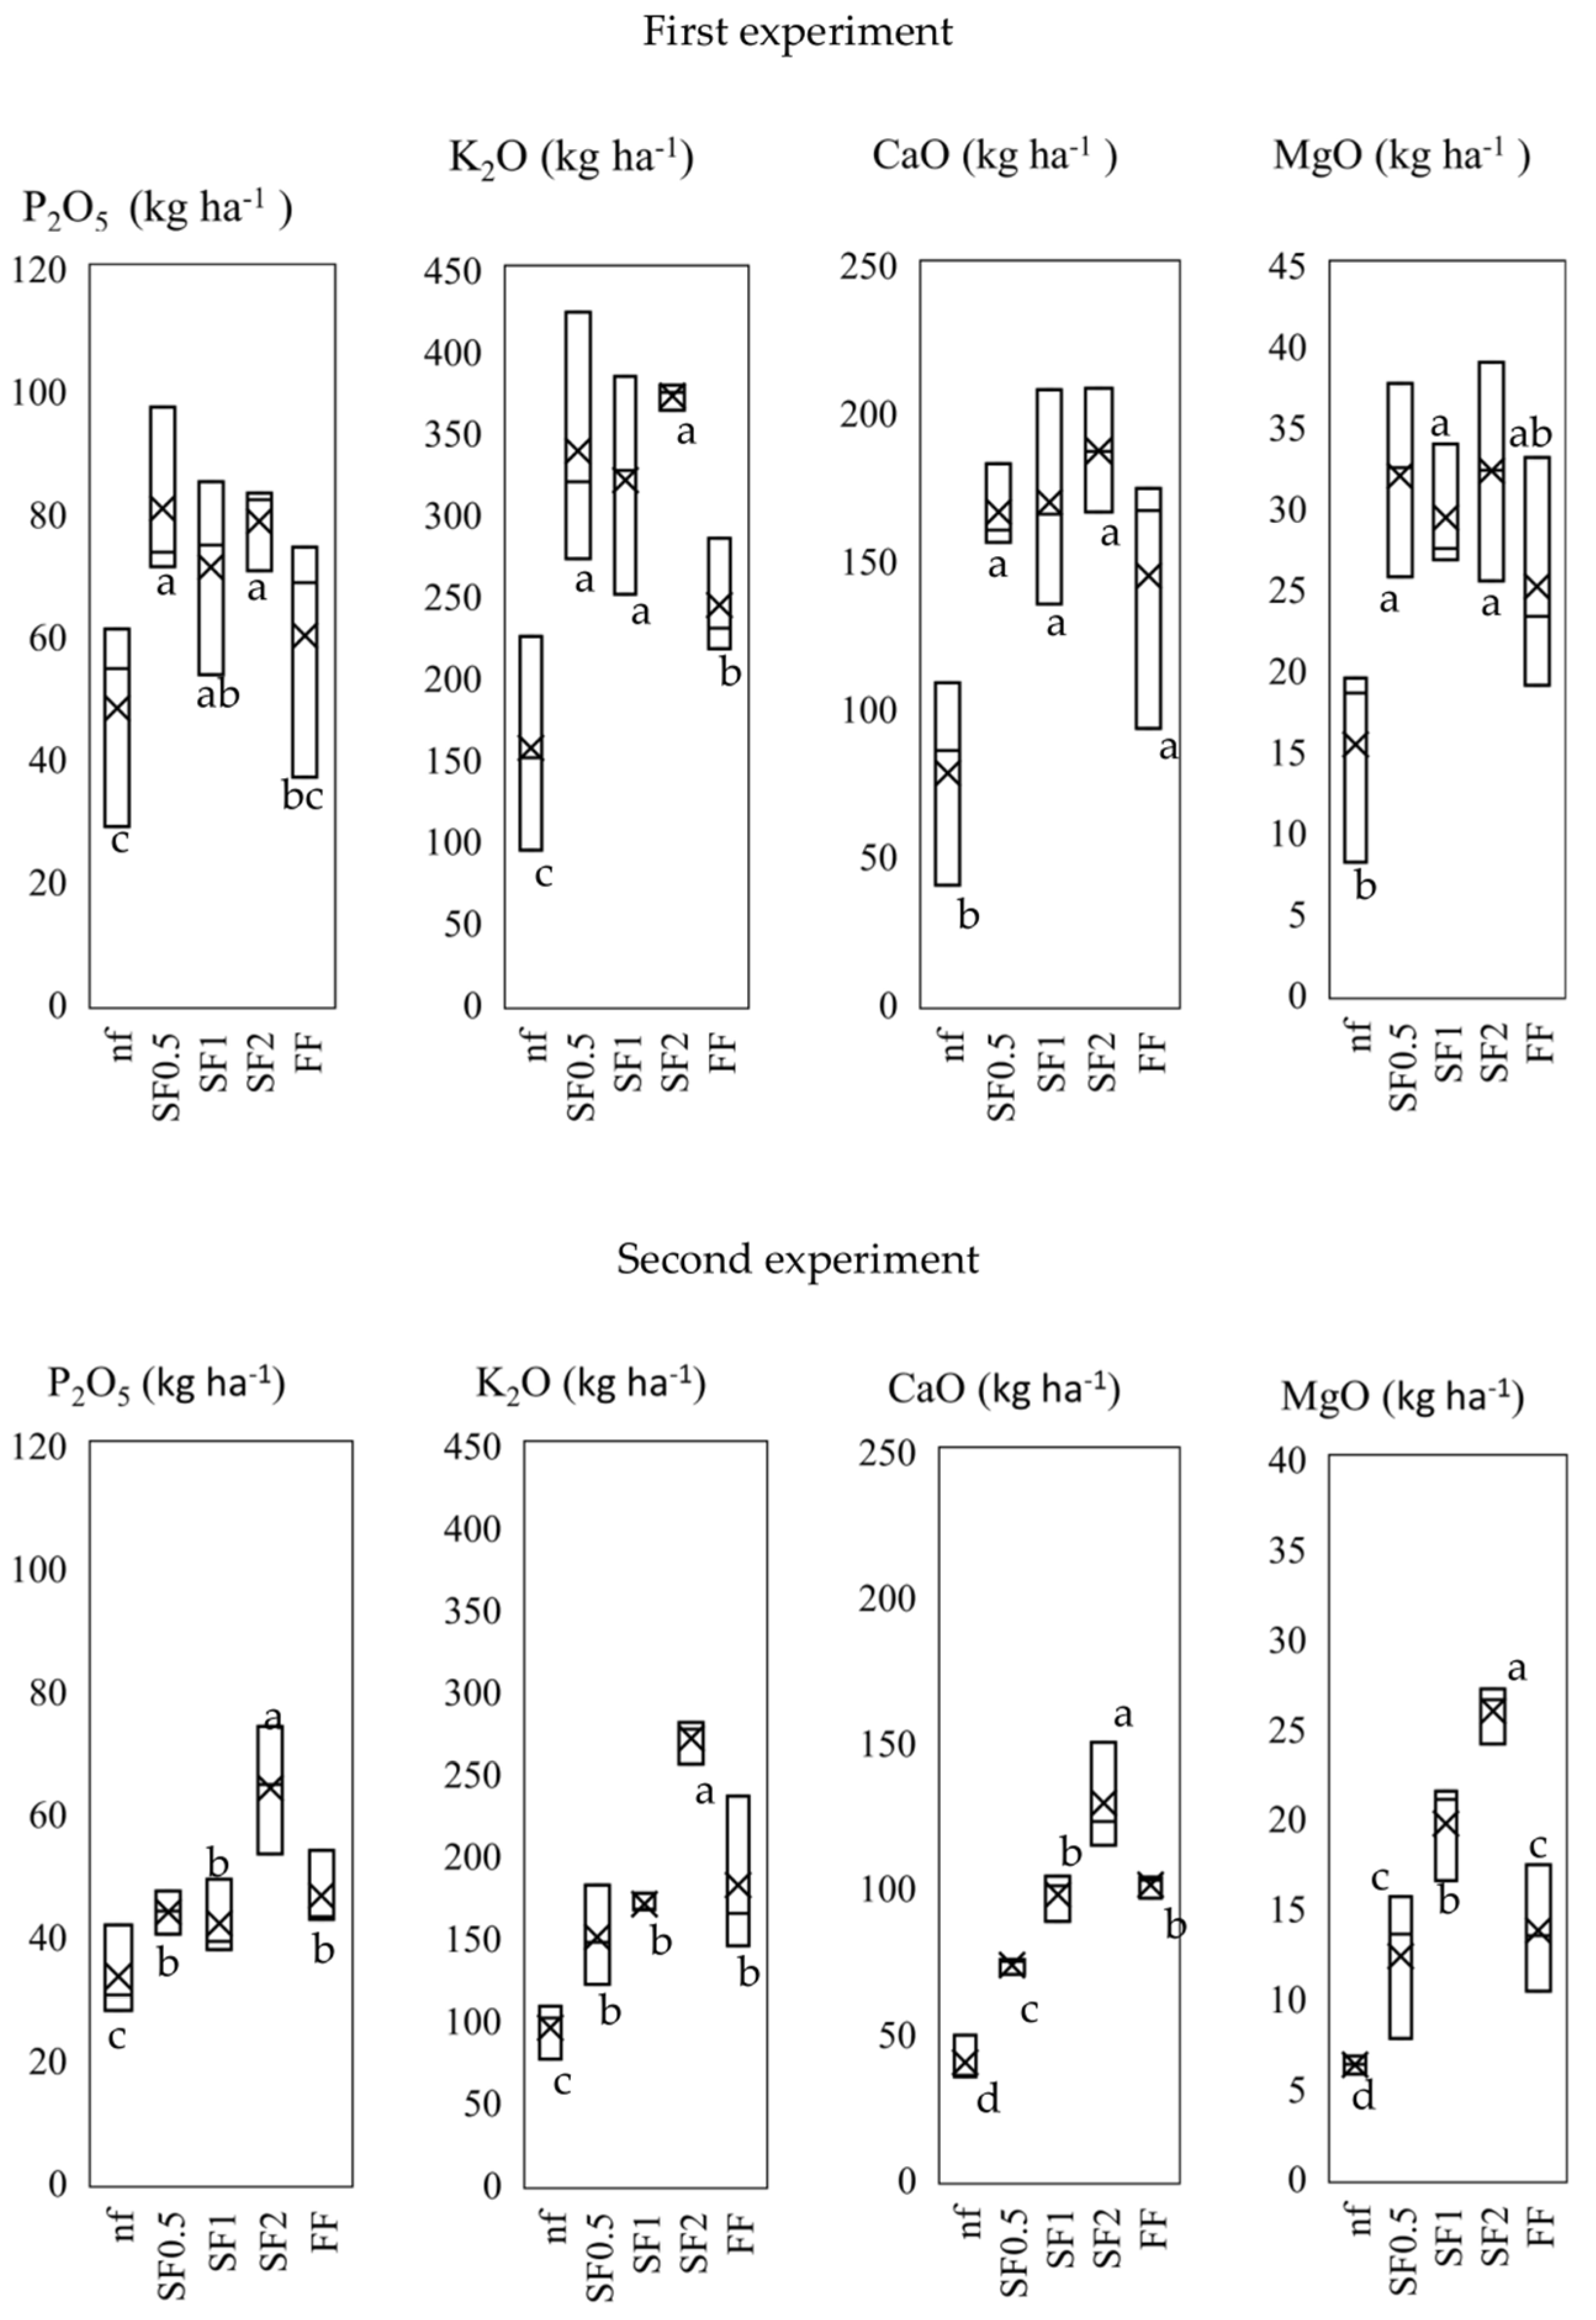
Uptake of P2O5 was highest among the SRF rates, ranging from 71 to 79 kg ha−1 in the first experiment (Figure 3). It was followed by FF (60 kg ha−1) and ‘nf’ (48 kg ha−1). The uptake of K2O was highest (p < 0.05) under all three SF rates (about 320–370 kg ha−1), followed by FF (244 kg ha−1) and lastly ‘nf’ (157 kg ha−1) (Figure 3). CaO uptake by plants was similar for FF, SF0.5, SF1 and SF2, ranging from 145 to 187 kg ha−1, while ‘nf’ affected the least uptake (Figure 3).

Figure 3.
Effect of no amendment control (‘nf’). Totals of 0.5, 1 and 2× the rate of SRF (SF0.5, SF1, SF2) and FF on P2O5, K2O, CaO and MgO uptake by KC heads (above ground) in the first and second experiments. ‘x’ signs mark the treatment means. Lower case letters show differences in the fertilizer treatment means at p ≤ 0.05 LSD test.
Uptake of MgO under SF0.5, SF1 and SF2 was highest (p ≤ 0.05) in this experiment (29–32 kg ha−1), followed by FF and then ‘nf’ (Figure 3). In the second experiment, the following orders were followed in terms of nutrient uptake: P2O5: SF2 > (SF1 = SF0.5 = FF) > ‘nf’; K2O: SF2 > (SF1 = SF0.5 = FF) > ‘nf’; CaO: SF2 > (SF1 = FF) > SF0.5 > ‘nf’; MgO: SF2 > SF1 > (SF0.5 = FF) > ‘nf’ (Figure 3). In general, uptake of P2O5, K2O, CaO and MgO was higher in the first experiment than the second experiment.
3.3. Soil Chemical Properties after Harvest
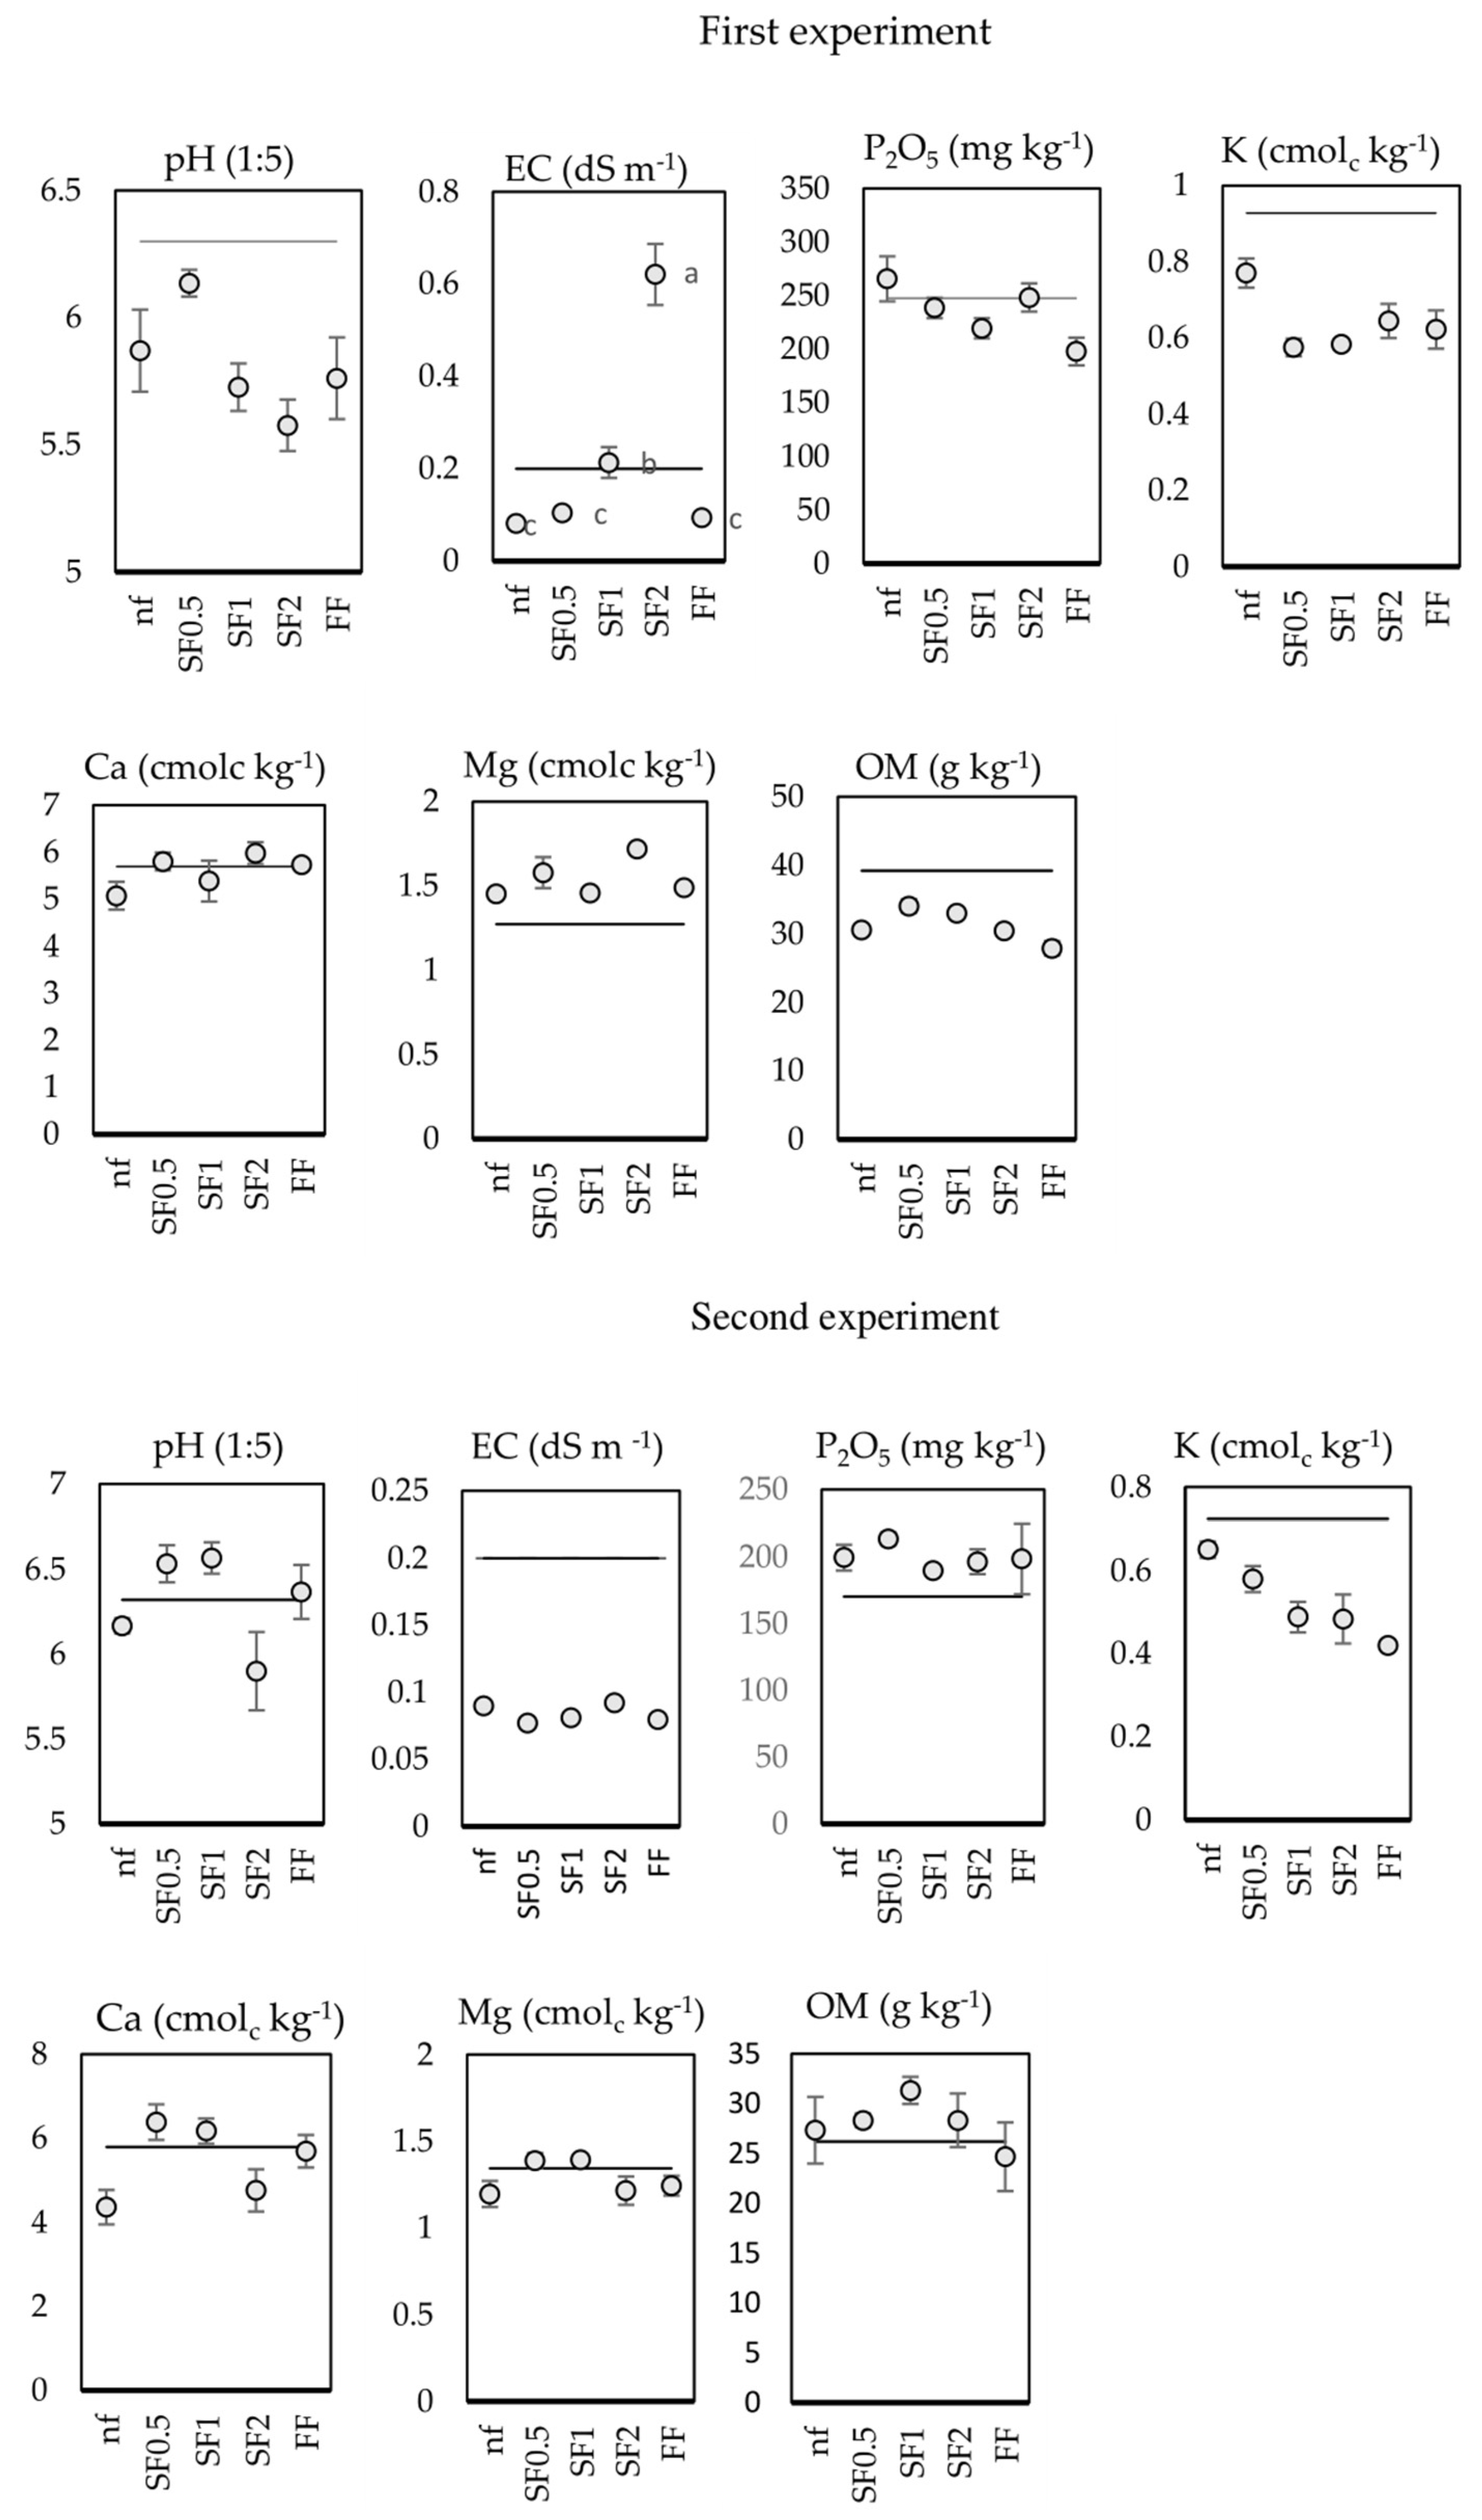
In the first experiment, all measured soil properties (except EC) were similar (p > 0.05) among treatments at the end of the experiment (Figure 4). SF2 affected the highest soil EC (0.6 dS m−1), followed by SF1 (0.2 dS m−1). Soil EC affected by SF2 was about 63% higher than the initial EC; SF1 maintained the initial soil EC while FF, SF0.5 and ‘nf’ reduced it by 50%.

Figure 4.
Soil chemical properties affected by no amendment control (‘nf’), 0.5, 1 and 2× the rate of slow-release fertilizer (SF0.5, SF1, SF2) and fast fertilizer (FF) after KC harvest in the first and second experiments. Straight horizontal line running across the data points represents initial levels of each chemical property before the start of the experiments. Error bars on the data points represent standard errors of the fertilizer treatment means. Lower case letters on the data points in EC (dS m−1) of the first experiment represent significant differences in the fertilizer treatment means at p ≤ 0.05 LSD test.
By the end of the study, soil pH had generally declined between 3 and 11% compared to the initial soil pH. Compared to the initial level, ‘nf’, SF0.5 and SF2 maintained soil P2O5 concentration, while FF and SF1 reduced it by 11 to 20%. Soil K concentration was generally reduced by 22 to 33% compared to the initial concentration. SF0.5, SF1, SF2 and FF maintained the initial soil Ca concentration, while ‘nf’ reduced it slightly. All treatments increased soil Mg concentration by 18 to 23% compared to the initial level. Compared to the initial level, soil organic matter (OM) had generally declined between 13 and 48% by the end of the study.
In the second experiment, the effect of all treatments on any of the measured parameters were comparable (p > 0.05) by the end of the study (Figure 4). However, compared to the initial levels, FF maintained soil pH, SF1 and SF0.5 increased it by 3% while ‘nf’ and SF2 reduced it by 3 and 40%, respectively. There was a general decline in soil EC between 55 and 65% by the end of the study, relative to the initial EC. Compared to the initial concentration, soil P2O5 concentration generally increased by 12 to 25%. The initial K concentration was generally reduced by 7 to 43%, compared to the initial level. While SF0.5, SF1 and FF maintained the initial Ca concentration, ‘nf’ and SF2 reduced it by 25 and 27%, respectively. Generally, soil Mg concentration had been maintained by SF0.5 and SF1 at the initial level by the end of the study. The initial Mg level was reduced by 8% by ‘nf’, SF2 and FF. By the end of the study, SF0.5, SF1 and SF2 had increased soil OM between 7 and 16% above the initial level, while ‘nf’ and FF had maintained the initial soil OM level (Figure 4).
4. Discussion
4.1. Crop Performance and N Use
The results show higher KC growth and yield with SRF rates compared with the conventional fast fertilizer and control in both experiments (Table 2) because more soil nutrients (which improve crop yields) were available with SRF than the CF. There is indication that FF lost most of its nutrients early on in both experiments (before 20 DAF, Figure 2), when crops were still young and did not have much nutrient demand. All the while, SRF rates gradually mineralized and retained more soil nutrients (Figure 2). Other studies have found that the slow nutrient release method of SRF allows it to synchronize nutrient release with higher crop demand phases better than conventional fast fertilizers, leading to higher crop growth and yield with SRF [6,7,28,29]. Though the same amounts of N were supplied through FF and SF1, and lower amounts through SF0.5 (Table 4), all the SRF rates had more mineral N at 20, 40 and 60 DAF compared to FF on those dates (Figure 2). Under the same mineralization conditions (same rainfall and temperature conditions), more N was left under SF1 than FF at the end of studies (60 DAF) because polymer coatings on SRFs cause it to have low biodegradability and longer N retention time in the soil [19,20,21]. Retaining more N under the SRF treatments compared to FF at 60 DAF in both experiments (Figure 2) could mean more N start-up for succeeding growing seasons and less investment in N for farmers in future cropping seasons. However, other production factors should be considered before making any recommendations. Contrary to the findings of Kaplan et al. [30], higher KC growth and yield from the SRFs could not be partly attributed to the higher P and K supplied by SF1 and SF2, because SF0.5, which supplied less N, P and K compared to FF, still had relatively higher yields in both experiments than FF (Table 2). This is further confirmation that the relatively poor performance by FF was the result of its rapid nutrient loss. N uptake among the SRFs was higher than the FF (Table 4) in the first experiment because of the longer N retention time for crops. Among the SRF rates, SF0.5 was the most nitrogen-efficient (NUE: 91%) compared to other treatments in the first experiment (Table 4). However, NUE between 90 and 100% presents a risk of nutrient mining [31]—as the remaining N may not be enough to meet the needs of other crop parts (roots and fallen leaves)—and unavoidable losses that that are not accounted for in the calculation of NUE. Considering that SF0.5 left about 8 mg kg−1 of soil N close to the end of the first experiment (60 DAF; Figure 2) compared to 27.2 mg kg−1 at the beginning of the experiment (Table 1), there is indication that native soil N was mined. There was also indication of N mining with ‘nf’ in both experiments, as N uptake was higher than N supplied to crops from inherent soil N. Nutrient mining refers to negative nutrient balances resulting from agricultural practices that influence greater loss or export of nutrients from soil than nutrient inputs [32]. Thus, continuous use of SF0.5 could cause a decline in native soil fertility and jeopardize future food security [32]. NUE values of 80–89% should be targeted if a balance between nutrient inputs and outputs is the focus [31]. KC was generally more productive in the first experiment than the second because of the differences in the slope gradients of the lands and prevalent rainfall conditions. The first experiment was on a relatively flatter land surface compared to the sloped (7%) land in the second experiment. Moreover, there were relatively fewer intense rainfall events in the first experiment than the second (Figure S1). Thus, the second experiment was more prone to soil nutrient losses due to faster runoff velocities than the first experiment. The generally lower nutrient (N, P2O5, K2O, CaO, MgO) uptake (Table 4, Figure 3) and lower soil nutrient concentrations after harvest (Figure 4) in the second experiment compared to the first are evidence that more nutrient losses occurred in the second experiment on average. Kim et al. [9] have also observed higher runoff velocities on higher slope gradients (7 and 15% slope) compared to a 2% slope in the Highland region. Our findings support the report of Wang et al. [33], which found strong positive correlations between slope gradients and rainfall intensity and runoff velocities and N losses. It is for this same reason that, generally, no differences were found in NUE among treatments in the second experiment, compared to the first.
Inferences from the quadratic yield response curves in the two experiments (Figure 1) indicate that optimum SRF rates for maximum KC productivity in the Highland region range from ½ the recommended N rate (119 kg ha−1) to about the full recommended N rate (238 kg ha−1), within which yield increases could be linear. The land would be under-utilized below the range, and more resources would be wasted above the range (Figure 1). Yields corresponding to SRF rates after SF1 were declining in the first experiment, indicating a Mitscherlich’s diminishing returns phenomenon [34]. As explained above, the general rapid loss of nutrients in the second experimental site may have contributed to the inability to reach a peak SRF rate in the yield curve of that experiment, as lower than required nutrients were available across the period due to higher losses. Observations from the two experiments suggest that, with proper measures to prevent soil nutrient losses, higher yields could be realized with even lower fertilizer doses.
Added net returns in the partial budgets (Table 3) indicate that the SRFs were more profitable than FF in both experiments, and the returns depended largely on marketable yield and labor costs for the number of fertilizer application splits. Considering the associated increases in added returns from adding on SRF rates from 0.5 to 1 to 2, investing more resources to double the rates from 0.5 to 1 always guaranteed added returns higher than the extra money invested in fertilizer (in both experiments). However, increasing SRF rate from SF1 to SF2 had inconsistent results. Extra monetary returns from the fertilizer increase were lower than the added cost invested in additional fertilizer in the first experiment, while the reverse was true for the second experiment. Therefore, ideal application rates may be found between these ranges: 0.5 < x ≤ 1, where x is the rate of SRF application. Such rates may maximize yield and profit, avoid soil N mining and maintain native soil fertility, given the right growing conditions. Relatively poorer yields from FF in both experiments and the extra labor cost incurred to apply FF in splits caused its lower added returns compared to SF1, which supplied the same N, in both experiments.
4.2. Uptake of Other Nutrients and Soil Quality after Harvest
Slow nutrient release from the SRFs over a prolonged time compared to the conventional fertilizer [2] caused higher P2O5, K2O, CaO and MgO uptake in all the rates of SRF compared to FF in the first experiment (Figure 3). Our findings confirm the results of Robles-Agular et al., Kaplan et al. and Bahar et al. [3,30,35], who attributed their observations to the lower solubility of SRFs due to their polymer coatings, which allow longer nutrient retention periods for longer plant absorption. SF2 affected the highest P2O5 and K2O uptake (Figure 3) among the treatments in the second experiment because it contained more P and K from the onset. Though Ca and Mg were not supplied through the fertilizers, SF2 increased Ca and Mg uptake above other treatments in this experiment because uptake of these micronutrients depends largely on the availability of P [36,37]. P is a major part of energy-bearing Adenosine Triphosphates (ATPs) generated in plants that facilitate plant activities such as nutrient uptake [38].
None of the treatments improved any soil chemical property (pH, P2O5, K, Ca, Mg) above another after harvest. Since SF1 and SF2 had more P and K than the rest of the treatments from the onset of the experiments, but affected similar P and K uptakes to SF0.5 and similar post-harvest soil levels to any other treatment, it could be inferred that SF1 and SF2 lost more P and K to the environment. The losses could have occurred through surface runoff, leaching or sub-surface flow [39]. Continuous P losses from these rates present potential environmental risks such as eutrophication and scale formation [40,41]. It may be necessary to quantify P losses from SRF and find measures to reduce it in future research in the Highland regions. No specific environmental issues have arisen from K losses, but it still presents potential economic loss to farmers [42]. Hence, SRFs with more judicious NPK ratios should be targeted for KC in future studies in the Highland region. Soil EC (salinity) was increased by SF2 in the first experiment (Figure 4) because the double rate added too high a level of fertilizer salts for the soil to buffer by the end of the study. High levels of fertilizer salts are a major factor causing soil salinity [43]. Increases in soil salinity with extremely high levels of fertilizer have been observed by Wang et al. and Hassin et al. [44,45]. Though SF2 did not push soil EC to saline levels (>2 dSm−1) [46], the soil may become prone to salinity with its continuous application. A similar effect of SF2 was not observed in the second experiment (Figure 4) because a lot of the salts may have been washed off site by the larger amounts of more intensive rainfall (Figure S1) received in the second experiment. It is important to note that soil OM under all the SRF rates increased by 7–16% compared to the initial level by the end of the second experiment (Figure 4). Our result was inconsistent with the reports of Ullah et al. [47]. However, Nemera et al. [48] also found post-experimental increases in soil OM with chemical fertilizer, and attributed it to post-experimental increases in soil N by the chemical fertilizer. In our study, soil N affected by SF2 close to the end of the study (60 DAF) in the second experiment (134.9 kg ha−1, extrapolated to about 67 mg kg−1 N; Figure 4) was above the initial mineral N level of 27.2 mg kg−1 N (sum NO3−-N and NH4+-N; Table 1). Increase in soil OM due to increased soil N could be due to related increases in microbial biomass, or increases in new carbon inputs from belowground crop growth and activity [49,50].
5. Conclusions
In this study, we determined the optimum and most economical rate of SRF that promotes maximum KC production and yield, higher crop nutrient uptake and efficient nitrogen use and improves soil nutrient status in two experiments. It was determined that SRF rates between 0.5 and 1 times the N recommended rate provided the potential to maximize marketable yield and production parameters of Kimchi cabbage. This range was also more profitable than conventional fertilizer. Doubling SRF rates above the full N recommended rate (SF1) was uneconomical, as it did not warrant corresponding increases in yield and monetary returns. SF0.5 had the highest NUE in the first experiment, but it posed a risk of nutrient mining as N left in the soil after harvest was lower than the initial level. NUE was negatively affected by large nutrient losses in the second experiment due to increased runoff velocities. SF2 application was found to be too high and not advisable as it has the potential to increase soil salinity and cause large P and K losses. Future studies may vary rates between SF0.5 and SF1 at various locations to confirm the best specific SRF rate for the productivity of KC cropping systems in the Highland region.
Supplementary Materials
The following supporting information can be downloaded at https://www.mdpi.com/article/10.3390/agronomy14071428/s1. Figure S1: Rainfall amounts and intensities received during various rainfall events in the Kimchi cabbage cultivation periods in the first and second experiments.
Author Contributions
Conceptualization: J.-T.L.; Methodology: M.B.B., Y.X.K., G.-R.B. and J.-T.L.; Validation: M.B.B. and Y.X.K.; Formal analysis: M.B.B.; Investigation: M.B.B., Y.X.K., G.-R.B. and J.-T.L.; Resources: Y.X.K., G.-R.B. and J.-T.L.; Data Curation: M.B.B. and Y.X.K.; Writing—original draft preparation: M.B.B.; Writing—review and editing: M.B.B., Y.X.K. and J.-T.L.; Visualization: M.B.B. and Y.X.K.; Supervision: Y.X.K. and J.-T.L.; Project Administration: Y.X.K.; Funding Acquisition: Y.X.K. All authors have read and agreed to the published version of the manuscript.
Funding
This work was carried out with funding support from the Cooperative Research Program for Agriculture Science and Technology Development (Project No. PJ016014012024) and the 2024 RDA Fellowship Program of Rural Development Administration, Republic of Korea.
Data Availability Statement
The original contributions presented in the study are included in the article and Supplementary Material; further inquiries can be directed to the corresponding author.
Acknowledgments
The authors acknowledge the technical support of the technicians in the Eco-friendly Agriculture Lab of the Highland Agriculture Research Institute.
Conflicts of Interest
The authors declare no conflict of interest.
References
- Mckenzie-Mohr and Associates. Reducing Fertilizer Use and Increasing the Use of Slow-Release Fertilizer. Southwest Florida Water Mgt District. 2005. Available online: https://www.swfwmd.state.fl.us/sites/default/files/medias/documents/Fertilizer_Final_Report.pdf (accessed on 22 March 2024).
- Bahar, F.A.; Lone, A.A.; Makhdoomi, M.; Dar, E.A.; Ahmad, M.; Akhone, M.M.; Hussain, N.; Mushtaq, T.; Bhat, F.N.; Aziz, M.A. Slow release nitrogen fertilizers—An ideal approach for reducing nitrogen losses and improving crop yields. Chem. Sci. Rev. Lett. 2019, 8, 159–172. [Google Scholar]
- Wesolowska, M.; Rymarczyk, J.; Gora, R.; Baranowski, P.; Slawiriski, C.; Klimczyk, M.; Schimmelpfening, G. New slow-release fertilizers-economic, legal and practical aspects: A review. Int. Agrophys. 2021, 35, 11–24. [Google Scholar] [CrossRef] [PubMed]
- Geng, J.; Ma, Q.; Zhang, M.; Li, C.; Liu, Z.; Lyu, X.; Zheng, W. Synchronized relationships between nitrogen release of controlled release nitrogen fertilizers and nitrogen requirements of cotton. Field Crops Res. 2015, 184, 9–16. [Google Scholar] [CrossRef]
- Chen, X.; Xu, W.; Wang, C.; Chen, Y.; Chi, S.; Xiong, S.; Xie, W.; Chen, R.; Zhang, J.; Xiong, Z. Slow release fertilizer containing urease and nitrification inhibitors on nitrogen release characteristics and uptake and utilization of nitrogen, phosphorus and potassium in tomato. Trans. Chin. Soc. Agric. Eng. 2015, 31, 168–176. [Google Scholar] [CrossRef]
- Colipano, J.M.; Cagasan, U.A. A review on the impact of organic, conventional and nano-fertilizer application in crop production. Eurasian J. Agric. Res. 2022, 6, 101–109. [Google Scholar]
- Ni, B.; Liu, M.; Lu, S.; Xie, L. Environmentally friendly slow release nitrogen fertilizer. J. Agric. Food Chem. 2011, 59, 10169–10175. [Google Scholar] [CrossRef] [PubMed]
- Nardi, P.; Neri, U.; Di Matteo, G.; Trinchera, A.; Napoli, R.; Farina, R.; Subbarao, G.; Benedetti, A. Nitrogen release from slow release fertilizers in soils with different microbial activities. Pedosphere 2018, 28, 332–340. [Google Scholar] [CrossRef]
- Zareabyaneh, H.; Bayatvarkeshi, M. Effects of slow release fertilizers on nitrate leaching, its distribution in soil profile, N use efficiency, and yield in potato crop. Environ. Earth Sci. 2015, 74, 3385–3393. [Google Scholar] [CrossRef]
- Li, G.; Wang, M.; Ma, C.; Tao, R. Effects of soil heterogeneity and species on plant interactions. Front. Ecol. Evol. 2021, 9, 756344. [Google Scholar] [CrossRef]
- Wang, C.; Lv, J.; Xie, J.; Yu, J.; Li, J.; Zhang, J.; Tang, C.; Niu, T.; Bakpa, E.P. Effect of slow-release fertilizer on soil fertility and growth and quality of wintering Chinese chives (Allium tuberum Rottler ex Spreng.) in greenhouses. Sci. Rep. 2021, 11, 8070. [Google Scholar] [CrossRef]
- Wang, C.; Lv, J.; Coulter, J.A.; Xie, J.; Yu, J.; Li, J.; Zhang, J.; Tang, C.; Niu, T.; Gan, Y. Slow release fertilizer improves the growth, quality and nutrient utilization of wintering Chinese chives (Allium tuberosum Rottler ex Spreng). Agronomy 2020, 10, 381. [Google Scholar] [CrossRef]
- Xu, Z.; Guo, Y. Preparation and performance of degradable slow release fertilizer coating material by a new iconic cross-linked hydrogel material. J. Environ. Chem. Eng. 2023, 11, 110785. [Google Scholar] [CrossRef]
- Xiao, X.; Yu, L.; Xie, F.; Bao, X.; Liu, H.; Ji, Z.; Chen, L. One-step method to prepare starch-based superabsorbent polymer for slow release fertilizer. Chem. Eng. J. 2017, 309, 607–616. [Google Scholar] [CrossRef]
- Trenkel, M.E. Slow and Controlled Release Stabilized Fertilizers: An Option for Enhancing Nutrient Efficiency in Agriculture, 2nd ed.; IFA: Paris, France, 2010; ISBN 978-2-9523139-7-1. Available online: https://www.scirp.org/reference/ReferencesPapers?ReferenceID=1846413 (accessed on 22 March 2024).
- Li, G.-H.; Cheng, G.-G.; Lu, W.-P.; Lu, D.-L. Differences of yield and nitrogen use efficiency under different applications of slow release fertilizer in spring maize. J. Integr. Agric. 2021, 20, 554–564. [Google Scholar] [CrossRef]
- Kim, Y.-M.; Brempong, M.B.; Bak, G.-R.; Lee, J.-T. Yield of KCand Soil Chemical Properties Following Slow Release Fertilizer Use in the Highlands of Gangwon. Korean J. Soil. Sci. Fert. 2023, 56, 499–512. [Google Scholar] [CrossRef]
- Eagle, A.J.; Olander, L.P.; Locklier, K.L.; Heifferman, J.B.; Bernhardt, E.S. Fertilizer management and environmental factors drive N2O and NO3 losses in corn: Meta-analysis. Soil Sci. Soc. Am. J. 2017, 81, 1191. [Google Scholar] [CrossRef]
- Rurinda, J.; Zingore, S.; Jibrin, J.M.; Balemi, T.; Masuki, K.; Anderson, J.A.; Pampolino, M.F.; Mohammed, I.; Mutegi, J.; Kamara, A.Y.; et al. Science-based decision support for formulating crop fertilizer recommendations in sub-Saharana Africa. Agric. Syst. 2020, 180, 102790. [Google Scholar] [CrossRef]
- Cereal Systems Initiative for South Asia (CSISA). Smart Tools for Farmers in South. Asia to Help Increase Yield. 2017. Available online: https://csisa.org/tag/precision-agriculture (accessed on 2 April 2024).
- Agyeman, K.; Brempong, M.B.; Ofosu, A.; Danquah, O.E.; Keteku, A.K.; Marno, P.; Atta Poku, P.S.; Quaye, M.O.; Berchie, J.N. Yield potential of improved maize achieved from optimal rates of YARA crop nutrition fertilizers for sustainable maize production in the Semi- Deciduous Forest Agro-Ecological Zone of Ghana. Pelagia Research Library. Asian J. Plant Sci. 2023, 13, 311. [Google Scholar]
- Colla, G.; Cadarelli, M.; Bonini, P.; Rouphael, Y. Foliar applications of protein hydrolysate, plant and seaweed extracts increase yield but differentially modulate fruit quality of greenhouse tomato. Hortscience 2017, 52, 1214–1220. [Google Scholar] [CrossRef]
- NAAS. Soil and Plant Analyses; National Academy of Agricultural Science, RDA: Suwon, Republic of Korea, 2011. [Google Scholar]
- NIAS. Fertilizer Recommendation for Crop Production, 5th ed.; National Institute of Agricultural Sciences, RDA: Wanju, Republic of Korea, 2022. [Google Scholar]
- Augarten, A.; Radatz, A.; Ruark, M.; Olson, E. Nitrogen Use Efficiency: State-Wide NUE Benchmarking for Corn grAIN and Silage; Extension, University of Wisconsin-Madison: Madison, WI, USA, 2019; Available online: https://www.uwdiscoveryfarms.org/wp-content/uploads/sites/1255/2020/08/DiscoveryFarms-NUE-ForOnline.pdf (accessed on 2 April 2024).
- Fernanadez-Escobar, R.; Antonaya-Baena, F.; Almeida-Lavado, S. Nitrogen uptake efficiency of olive cultivars. Horticulturae 2021, 7, 136. [Google Scholar] [CrossRef]
- Godebo, T.; Laekemariam, F.; Loha, G. Nutrient uptake, use efficiency and productivity of bread wheat (Triticum aestivum L.) as affected by nitrogen and potassium fertilizer in Keddida Gamela Woreda, Southern Ethiopia. Environ. Syst. Res. 2021, 10, 12. [Google Scholar] [CrossRef]
- Salem, E.H.; Ali, H. Effect of slow release fertilizers on growth and fruiting of Khalas date palm. SVU—Int. J. Agric. Sci. 2020, 2, 30–44. [Google Scholar] [CrossRef]
- Abu-Zied, S.T.; Abd El-Lateef, E.M.; Hanem, A.S.; Hozayn, M.M.; Soad, M.E.; Amel, L.; Abd, E.; Essa, R.E. Effects of different slow release nitrogen fertilizer forms on yield and chemical constituents of maize and soybean. Middle East. J. Agric. Res. 2014, 3, 645–652. [Google Scholar]
- Kaplan, I.; Tlustos, P.; Szakova, J.; Najmanova, J. The influence of slow release fertilizers on potted chrysanthemum growth and nutrient composition. Plant Soil. Environ. 2013, 59, 385–391. Available online: https://www.agriculturejournals.cz/pdfs/pse/2013/09/01.pdf (accessed on 16 March 2024). [CrossRef]
- Brentrup, F.; Palliere, C. Nitrogen use efficiency as an agro-environmental indicator. In Proceedings of the OECD Workshop on Agri-Environmental Indicators, Leysin, Switzerland, 23–26 March 2010; Available online: https://www.researchgate.net/publication/312595805_Nitrogen_Use_Efficiency_as_an_Agro-_Environmental_Indicator (accessed on 15 March 2024).
- Mamathashree, C.M.; Shilpha, S.M.; Pradeep. Nutrient mining by selected cereal crops and strategies to sustain soil productivity. Int. J. Curr. Microbiol. Appl. Sci. 2017, 6, 2932–2941. [Google Scholar] [CrossRef]
- Wang, L.; Li, Y.; Wu, J.; An, Z.; Suo, L.; Ding, J.; Li, S.; Wei, D.; Jin, L. Effects of the rainfall intensity and slope gradient on soil erosion and nitrogen loss on the sloping field of Myun Reservoir. Plants 2023, 12, 423. [Google Scholar] [CrossRef]
- Ferreira, I.E.P.; Zocchi, S.S.; Baron, D. Reconciling the Mitscherlich’s law of diminishing returns with Liebig’s law of the minimum. Some results on crop modelling. Math. Biosci. 2017, 293, 29–37. [Google Scholar] [CrossRef]
- Robles-Aguilar, A.A.; Schrey, S.D.; Postma, J.A.; Temperton, V.M.; Jablonowski, N.D. Phosphorus uptake from struvite is modulated by the nitrogen form applied. J. Plant Nutr. Soil. Sci. 2020, 183, 80–90. [Google Scholar] [CrossRef]
- Li, L.; Tang, C.; Rengel, Z.; Zhang, F.S. Calcium, magnesium and microelemet uptake as affected by phosphorus sources and interspecific root interactions between wheat and chickpea. Plant Soil. 2004, 261, 29–37. [Google Scholar] [CrossRef]
- Ding, W.; Clode, P.L.; Clements, J.C.; Lambers, H. Effects of Calcium and Its Interaction with Phosphorus on the Nutrient Status and Growth of Three Lupinus Species. Master’s Dissertation, School of Biological Sciences, University of Western Australia, Crawley, Australia, 2018. Available online: https://api.research-repository.uwa.edu.au/ws/portalfiles/portal/33839982/Ding_et_al_2018_Effects_of_calcium_and.pdf (accessed on 3 April 2024).
- International Plant Nutrition Institute (IPNI). Functions of phosphorus in plants. Better Crops 1999, 83, 6–7. [Google Scholar]
- Chakraborty, D.; Prasad, R.; Brantley, E. Phosphorus Basics: Understanding Pathways of Soil Phosphorus Loss. Alabama Cooperative Extension System. 2020. Available online: https://www.aces.edu/wp-content/uploads/2020/05/ANR-2662-Phosphorus-Basics-Pathways-of-Soil-Phosphorus-Loss_052020L-G.pdf (accessed on 4 March 2024).
- Azam, H.M.; Alam, S.T.; Hasan, M.; Yameogo, D.D.S.; Kannan, A.D.; Rahman, A.; Kwon, M.J. Phosphorus in the environment: Characteristics with distribution an effects, removal mechanisms, treatment technologies, and factors affecting recovery as minerals in natural and engineered systems. Environ. Sci. Pollut. Res. Int. 2019, 26, 20183–20207. [Google Scholar] [CrossRef] [PubMed]
- Guan, X.; Liu, C.; Li, Y.; Wang, X.; Liu, Y.; Zou, C.; Chen, X.; Zhang, W. Reducing the environmental risks related to phosphorus surplus resulting from greenhouse cucumber production in China. J. Cleaner Prod. 2022, 332, 130076. [Google Scholar] [CrossRef]
- Goulding, K.; Mirrell, T.S.; Mikkelsen, R.L.; Rosolem, C.; Johnson, J.; Wang, H.; Alfaro, M.A. Outputs: Potassium losses from agricultural systems. In Improving Potassium Recommendations for Agricultural Crops; Murrell, T.S., Mikkelsen, R.L., Sulewski, G., Norton, R., Thompson, M.L., Eds.; Springer: Cham, Switzerland, 2021. [Google Scholar] [CrossRef]
- Soil Electrical Conductivity. Soil. Health-Guide for Educators. 2014. Available online: https://cropwatch.unl.edu/documents/USDA_NRCS_EC_guide.pdf (accessed on 21 March 2024).
- Wang, X.; Wang, X.; Sheng, H.; Wang, X.; Wang, X.; Zhao, H.; Feng, K. Excessive nitrogen fertilizer application causes rapid degradation of greenhouse soil in China. Polish J. Environ. Stud. 2022, 31, 1527–1534. [Google Scholar] [CrossRef]
- Hassin, A.M.; Mohammed, H.A.E.; Ahmed, G.L.; Emhammed, M.A. Integrated effect of fertilizers on soil pH, EC and organic matter content. J. Pure Appl. Sci. 2022, 21. [Google Scholar] [CrossRef]
- USDA-NRCS. Soil Quality Indicators. 2011. Available online: https://www.nrcs.usda.gov/sites/default/files/2022-10/Soil%20Electrical%20Conductivity.pdf (accessed on 21 March 2024).
- Ullah, M.S.; Islam, M.S.; Islam, M.A.; Haque, T. Effects of organic manures and chemical fertilizers on the yield of brinjal and soil properties. J. Bangladesh Agric. Univ. 2008, 6, 271–276. [Google Scholar] [CrossRef]
- Nemera, F.; Zewdu, T.; Ebro, A. Effect to organic and inorganic fertilizers applications on the Highlands Grasslands of the acidic soil physical and chemical properties: The case of meta- Robi District. J. Biol. Agric. Healthc. 2018, 8. Available online: https://core.ac.uk/download/pdf/234662511.pdf (accessed on 28 March 2024).
- Rocci, K.S.; Lavallee, J.M.; Stewart, C.E.; Cotrufo, M.F. Soil organic carbon response to global environmental change depends on its distribution between mineral-associated and particulate organic matter: A meta-analysis. Sci. Total Environ. 2021, 793, 148567. [Google Scholar] [CrossRef]
- Wade, J.; McGuire, A. Nitrogen Fertilizer and Soil Organic Matter: What Does the Evidence Say? Perspectives on Sustainability; Center for Sustaining Agriculture and Natural Resources: Wenatchee, WA, USA, 2023; Available online: https://csanr.wsu.edu/nitrogen-fertilizer-and-soil-organic-matter-what-does-the-evidence-say/ (accessed on 16 March 2024).
Disclaimer/Publisher’s Note: The statements, opinions and data contained in all publications are solely those of the individual author(s) and contributor(s) and not of MDPI and/or the editor(s). MDPI and/or the editor(s) disclaim responsibility for any injury to people or property resulting from any ideas, methods, instructions or products referred to in the content. |
© 2024 by the authors. Licensee MDPI, Basel, Switzerland. This article is an open access article distributed under the terms and conditions of the Creative Commons Attribution (CC BY) license (https://creativecommons.org/licenses/by/4.0/).