Abstract
Phosphorus is one of the major constraints to karst grassland productivity. Understanding the effects of different fertilization practices on soil phosphorus dynamics is essential for enhancing phosphorus bioavailability and rational management of soil phosphorus in karst grasslands. Here, we investigated the effects of fertilizers and manures on soil bioavailability of phosphorus fractions and explored the relationship between soil properties and soil phosphorus fractions. The four fertilizer application designs were as follows: control (CK; no fertilizer or manure); fertilization (F); manure application (M); fertilization and manure application (FM). The results showed that total phosphorus (TP) concentration was elevated by 23%, 1%, and 42% in F, M, and FM treatments, respectively, compared with CK. F and FM treatments enhanced the total inorganic phosphorus (Pi) concentration by 65% and 66%, respectively, while M and FM treatments enhanced the total organo-phosphorus (Po) concentration by 21% and 35%, respectively. FM treatment elevated bioavailable P, active Po, secondary mineral P, primary mineral P, and occluded P by 69%, 39%, 50%, 31%, and 41%, respectively. Fertilizers inhibited soil acid phosphatase activity, whereas alkaline phosphatase did not respond significantly to fertilizer management in low-latitude karst regions. SOM, TN, AP, and MBP are the key factors affecting the bioavailability of phosphorus fractions. The combined application of fertilizer and manure is the most beneficial measure for enhancing soil phosphorus bioavailability. This research helps deepen our understanding of soil phosphorus dynamics in the karst areas and provides a basis for further enhancement of nutrient availability and vegetation productivity of grassland ecosystems.
1. Introduction
Phosphorus (P) is an essential macro-nutrient for plant growth and is involved in many important nutritional and physiological processes in plants, as well as many key microbial and biochemical functions of soil ecosystems [1,2]. Thus, phosphorus limitation often constrains the maintenance of plant productivity and soil microbial structure and community health. Soil phosphorus is always limiting as it is highly susceptible to immobilization by reactive metal ions or microorganisms, and phosphate is readily adsorbed on positively charged soil minerals. The phosphorus concentration of the soil solution is also controlled by a continuous process of adsorption, precipitation, desorption, and dissolution [3]. The uptake and utilization of soil phosphorus fractions by plants and microorganisms often depend on their solubility and bioavailability [4]. The chemical fractionation method proposed by Hedley et al. [5]. provides researchers with an efficient way to separate and characterize different forms of phosphorus, which play different roles in soil phosphorus transformations. Tiessen et al. [6]. developed an empirical pathway model for inferring whether one soil phosphorus fraction can be converted to another. Hou et al. [7]. optimized and validated this model based on previous work to make it more accurate for assessing the importance of different soil phosphorus fractions or phosphorus pools in determining soil phosphorus availability. Redefining the bioavailability phosphorus fractionation methods based on this model may open new pathways for soil phosphorus availability studies in the future [8].
Fertilization is widely used by humans to enhance the productivity of agricultural systems, which typically involves using organic matter or inorganic fertilizers to enhance the amount of plant-available phosphorus in the soil [9,10,11]. With the rapid increase in food demand by the global population, the consumption of phosphorus fertilizer has also increased significantly [12]. Soil phosphorus management is of greater importance in low-latitude areas, where phosphorus limitation is more prominent. This is particularly true for the karst areas featuring precipitation abundance, severe water runoff, and shallow soil profile [13,14]. The chemical form of phosphorus in a fertilizer or manure is one of the key factors determining its potential bioavailability. After the fertilizer enters the soil, part of the phosphate directly affects the soil’s inorganic phosphorus content, and part of it may stimulate the decomposition of organic matter or be associated with changing the soil Pi content by improving soil properties [15]. Manure enters the soil and stimulates organic phosphorus mineralization or affects the turnover of soil phosphorus fractions [16,17]. Understanding the chemical form of phosphorus in the soil after fertilizer application is critical to understanding soil phosphorus dynamics. Although the beneficial effects of the combined application of manure and mineral fertilizers on the maintenance of soil phosphorus fertility have been tentatively demonstrated in parts of the subtropics [16], similar information in the Karst areas is extremely limited. For example, a previous study has shown that fertilization is beneficial in increasing total phosphorus in grassland soils [18] and promoting inter-root phosphorus turnover in legumes [19]. However, information is still lacking regarding the bioavailability of phosphorus and the effects of fertilizer practices on soil phosphorus dynamics within pasture ecosystems in subtropical karst regions.
Therefore, this study was designed based on a three-year field experiment to investigate the effects of fertilizer and manure application on soil phosphorus dynamics in karst grassland. We aimed to evaluate (i) the effect of mineral fertilizers and manure on the soil bioavailability of phosphorus fractions and (ii) the relationship between soil properties and soil bioavailability of phosphorus fractions. We hypothesized that mineral fertilizers and manure would enhance soil phosphorus bioavailability, and bioavailable phosphorus fractions are closely related to phosphatase and microbial biomass phosphorus.
2. Materials and Method
2.1. Site Description
The study was carried out in the research base of grassland ecology at the Oil fir River pasture (27°23′ N, 105°52′ E), in Bijie City, Guizhou province. During the experimental period (2012–2015), the average annual temperature was 11.3 °C, and the average annual precipitation was 1014 mm. Locally, fertilization and grazing are the main factors. The pasture was originally established as a natural grassland dominated by shrubs and warm-season grasses in the fall of 2012. The whole research area was enclosed by cattle fences. The initial establishment of forages included red clover (Trifolium pratense), white clover (Trifolium repens), duck grass (Dactylis glomerata), and perennial ryegrass (Lolium perenne), at a seeding rate of 4.5, 7.5, 9.0, and 18.0 kg ha−1, respectively. Within the whole pasture area, 0.05 ha was fenced out and selected as the test area. Plots were set up starting at 5 m from the fence with 2 m between plots. Each plot was set up as 40 m2 (5 8 m). The experiment was set up as a randomized, complete block design with three blocks with repeated measures. This area is protected from livestock grazing and other human disturbance by fencing systems. Soil phosphorus fractions prior to implementation of management are shown in Table 1.

Table 1.
The mean of soil total P (TP), bioavailable P, active Po, secondary mineral P, primary mineral P, and occluded P at different layers in the unused land (UL), abandoned grazing pastureland (APL), grazing pastureland (GPL), and fertilized grazing pastureland (FGPL) treatments in 2012.
2.2. Study Design
The experiment consisted of four different types of treatment: (i) control (CK): no fertilizer or manure inputs; (ii) fertilization (F): use of NPK fertilization; (iii) manure application (M): using a mixture of cattle manure and urine; (iv) fertilization and manure application (FM): application of the mixture of manure, urine, and NPK fertilizer. Grazing was simulated using mechanical mowing based on typical grazing management practices from local livestock producers in all treatments. Specifically speaking, once the average canopy height reaches 20 cm, the entire area is mowed using machinery, leaving a stubble height of 5 cm. The herd species grazed on the ranch are Angus and Simmental cattle. According to the digestive and excretory characteristics of the two types of cattle [20], under the stocking rate of 1.5 head ha−1, the amount of manure applied was maintained at 5400 kg ha−1 of feces–urine mixture [21]. Manures with an average phosphorus content of 0.36% were applied each month to the plots corresponding to the treatments. Fertilizers were applied in accordance with a total amount of 300 kg ha−1 per year, of which 15% each of N, P2O5, and K2O elements. Fertilizer is applied during the annual pasture return season (March), the summer season, when the pasture is actively growing (June), and the compensatory growing season after fall utilization (September). The FM treatment application consisted of 2730 kg of manure and 150 kg of compound fertilizer was also applied at the same time as described above.
2.3. Soil Sample and Analysis
In August of 2012 and 2015, soil sampling was carried out using a 5 cm corer and “S-sampling” method. The sampling depths include both the 0–10 (topsoil) cm and 10–30 (subsoil) cm layers. The samples from the same plot with the same soil layer were mixed to form a composite sample, and stones and roots were removed before any laboratory analysis.
Soil total P (TP) and available P (AP) were measured using the Mo-Sb colorimetric method [22]. Microbial biomass P (MBP) was determined by chloroform fumigation method [23]. Soil P fractions were analyzed according to the Hedley sequential extraction procedure [5,24]. Briefly, P fractions were extracted using the following solvents: deionized water, 0.5 M NaHCO3, 0.1 M NaOH, 1M HCl, concentrated HCl, and concentrated H2SO4. The organic P (Po) concentration of the different extracts was calculated by total P and inorganic P (Pi). Residue P was calculated by TP and the sum of the P fractions above. Total Pi was calculated as the sum of the different Pi fractions above, and total Po was calculated as the sum of the different Po fractions. Phosphorus fractions were classified into five types according to their bioavailability based on the model developed by Hou et al. [7]. Bioavailability P included resin-P and NaHCO3-Pi. Active Po included NaHCO3-Po and NaOH-Po. NaOH-Pi was defined as secondary mineral P. Primary mineral P includes 1M HCl-Pi, conc. HCl-Pi, and total conc. HCl-P. Residual P was defined as occluded P [8].
Soil pH was determined by a pH meter (Mettler-Toledo Seven Compact S210, Switzerland) with a soil–water ratio of 1:5 (w/v) [25]. Bulk density (BD) was measured using the metal ring [26]. Total nitrogen (TN) was determined by the Kjeldahl method (Hanon-K1100, Hyene Future Technology Group Co., Ltd., Jinan, Shandong, China) [27]. Soil organic matter (SOM) was calculated by soil organic carbon (SOC), and SOC was determined via the SKALAR carbon analyzer (Primacs ATC 100-IC-E, Skalar Analytical B.V., Breda, Netherlands) [28]. The soil alkaline phosphatase (AKP) and acid phosphatase (ACP) activity was analyzed using the methods described by Acosta-Martínez and Ali Tabatabai [29].
2.4. Statistical Analysis
We used univariate analysis of variance (ANOVA, p < 0.05) to test the effects of different treatments, soil depth on soil P fractions, and soil enzyme activities. Duncan’s multiple range test was used for mean separation. Two-way ANOVA was used to compare the effect of fertilizers and manures and their interaction at p < 0.05 level. Principal component analysis (PCA) was used to identify the relationship between environmental factors and different soil bioavailability of phosphorus fractions (R software, version 4.3.2). Structural equation modeling was performed using the “plspm” package.
3. Results
3.1. Soil Total Phosphorus
In the topsoil, the TP and total Pi concentration of FM treatment were greater than CK and M treatments (Figure 1; p < 0.05). The TP of the F treatment was greater than the CK treatment (p < 0.05). The total Pi of the F treatment was greater than that of the CK and M treatments. The total Po of the FM treatment was greater than that of the CK and F treatments. Compared with CK treatment, the total Po concentration of F treatment was increased by 9.62%. The total Po concentration of M treatment was increased by 21.84%, and the total Po concentration of FM treatment was increased by 35.06%. In the subsoil, there were no significant differences between the four treatments in TP, total Pi, and total Po. Both F and M had a significant effect on TP.
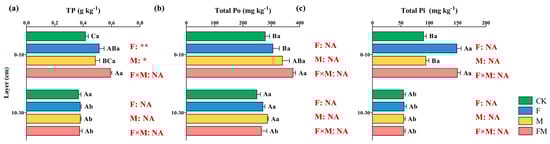
Figure 1.
The concentration of (a) total P (TP), (b) total organic P (TPo), and (c) total inorganic P (TPi) at 0–10 and 10–30 cm in the control (CK), mow and fertilize (F), mow and manure (M), and mow fertilize and manure (FM) treatments in 2015. Mean ± standard error of three blocks. Different capital letters indicate significant differences between different treatments in the same soil layer, and different lowercase letters indicate significant differences between different soil layers in the same treatment. Two-way ANOVA results are shown in red. ** p ≤ 0.01, and * p ≤ 0.05. NA indicates no significant effect. F is for fertilizers, M is for manures, and F M is for the interaction of fertilizers and manures.
3.2. Soil Bioavailability of Phosphorus Fractions
In the topsoil, the bioavailable P concentration of FM treatment was greater than other treatments (Figure 2; p < 0.05), and the bioavailable P concentration of F treatment was greater than that of CK and M treatments (p < 0.05). The active Po concentration of FM and F treatments was greater than the CK treatment. The secondary mineral P concentration of FM treatment was greater than other treatments. The secondary mineral P concentration of the M treatment was greater than the CK treatment. The primary mineral P concentration of the FM treatment was greater than that of the CK and F treatments. The occluded P concentration of FM treatment was greater than other treatments. In the subsoil, there were no significant differences between the four treatments in bioavailable P, active Po, secondary mineral P, primary mineral P, and occluded P. Both F and M had a significant effect on bioavailable P. F has a significant effect on active Po; significant interaction effects of F and M on secondary mineral P. Both F and M had a significant effect on secondary mineral P. M has a significant effect on primary mineral P. Both F and M had a significant effect on occluded P.
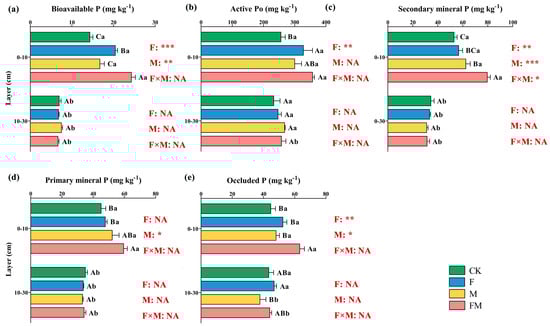
Figure 2.
The concentration of (a) bioavailable P, (b) active Po, (c) secondary mineral P, (d) primary mineral P, and (e) occluded P at 0–10 and 10–30 cm in the control (CK), mow and fertilize (F), mow and manure (M), and mow fertilize and manure (FM) treatments in 2015. Mean ± standard error of three blocks. Different capital letters indicate significant differences between different treatments in the same soil layer, and different lowercase letters indicate significant differences between different soil layers in the same treatment. Two-way ANOVA results are shown in red. *** p ≤ 0.001, ** p ≤ 0.01, and * p ≤ 0.05. NA indicates no significant effect. F is for fertilizers, M is for manures, and F M is for the interaction of fertilizers and manures.
Active Po dominates the TP with about 61.16–64.70% in topsoil (Figure 3). The percentage of bioavailable P in TP was 3.47–4.16%. The percentage of secondary mineral P in TP was 11.27–13.64%. The percentage of primary mineral P in TP was 9.53–10.91%. The percentage of occluded P in TP was 10.05–10.83%. In the subsoil, active Po dominates the TP with about 64.21–71.57%. The percentage of bioavailable P in TP was 1.79–2.00%. The percentage of secondary mineral P in TP was 8.33–9.57%. The percentage of primary mineral P in TP was 8.87–9.72%. The percentage of occluded P in TP was 9.20–14.56%.
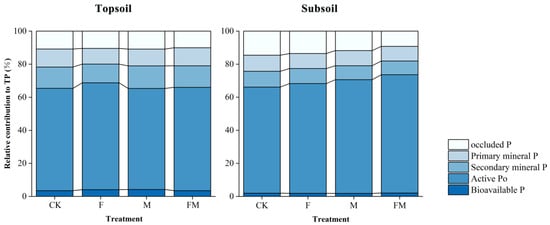
Figure 3.
The proportion of bioavailable P, active Po, secondary mineral P, primary mineral P, and occluded P at 0–10 (topsoil) and 10–30 (subsoil) cm in the control (CK), mow and fertilize (F), mow and manure (M), and mow fertilize and manure (FM) treatments in 2015.
3.3. Soil Biological Activity
In the topsoil, the ACP activity of the F treatment was lower than the CK and M treatments, and the ACP activity of the FM treatment was lower than the CK treatment (Figure 4; p < 0.05). The concentrations of MBP in the FM treatment were greater than in other treatments, and those in the CK treatment were lower than in other treatments.
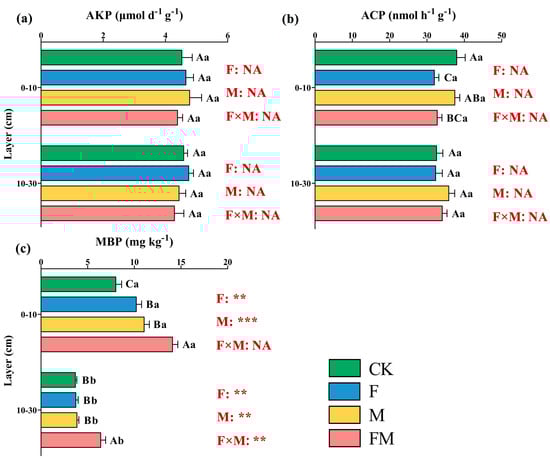
Figure 4.
The concentration of (a) the activity of alkaline phosphatase (AKP), (b) acid phosphatase (ACP) and (c) microbial biomass phosphorus (MBP) treatments in 2015. Mean ± standard error of three blocks. Different capital letters indicate significant differences between different treatments in the same soil layer, and different lowercase letters indicate significant differences between different soil layers in the same treatment. Two-way ANOVA results are shown in red. *** p ≤ 0.001, ** p ≤ 0.01. NA indicates no significant effect. F is for fertilizers, M is for manures, and F M is for the interaction of fertilizers and manures.
In the subsoil, the concentration of MBP in the FM treatment was greater than other treatments. There was no significant difference between the four treatments in AKP and ACP activity. Both in the topsoil and subsoil, there were no significant differences between the four treatments in AKP activity.
3.4. The Relationship of Environmental Factors and Soil Bioavailability of Phosphorus Fractions
At the 0–10 cm layer, the pH values of M and FM were greater than F and CK (Table 2). The SOM of FM was greater than other treatments. The SOM of F was greater than CK. At the 0–10 cm and 10–30 cm layers, the TN of FM was greater than CK and M.
Table 2.
Mean of the soil properties in different treatments.
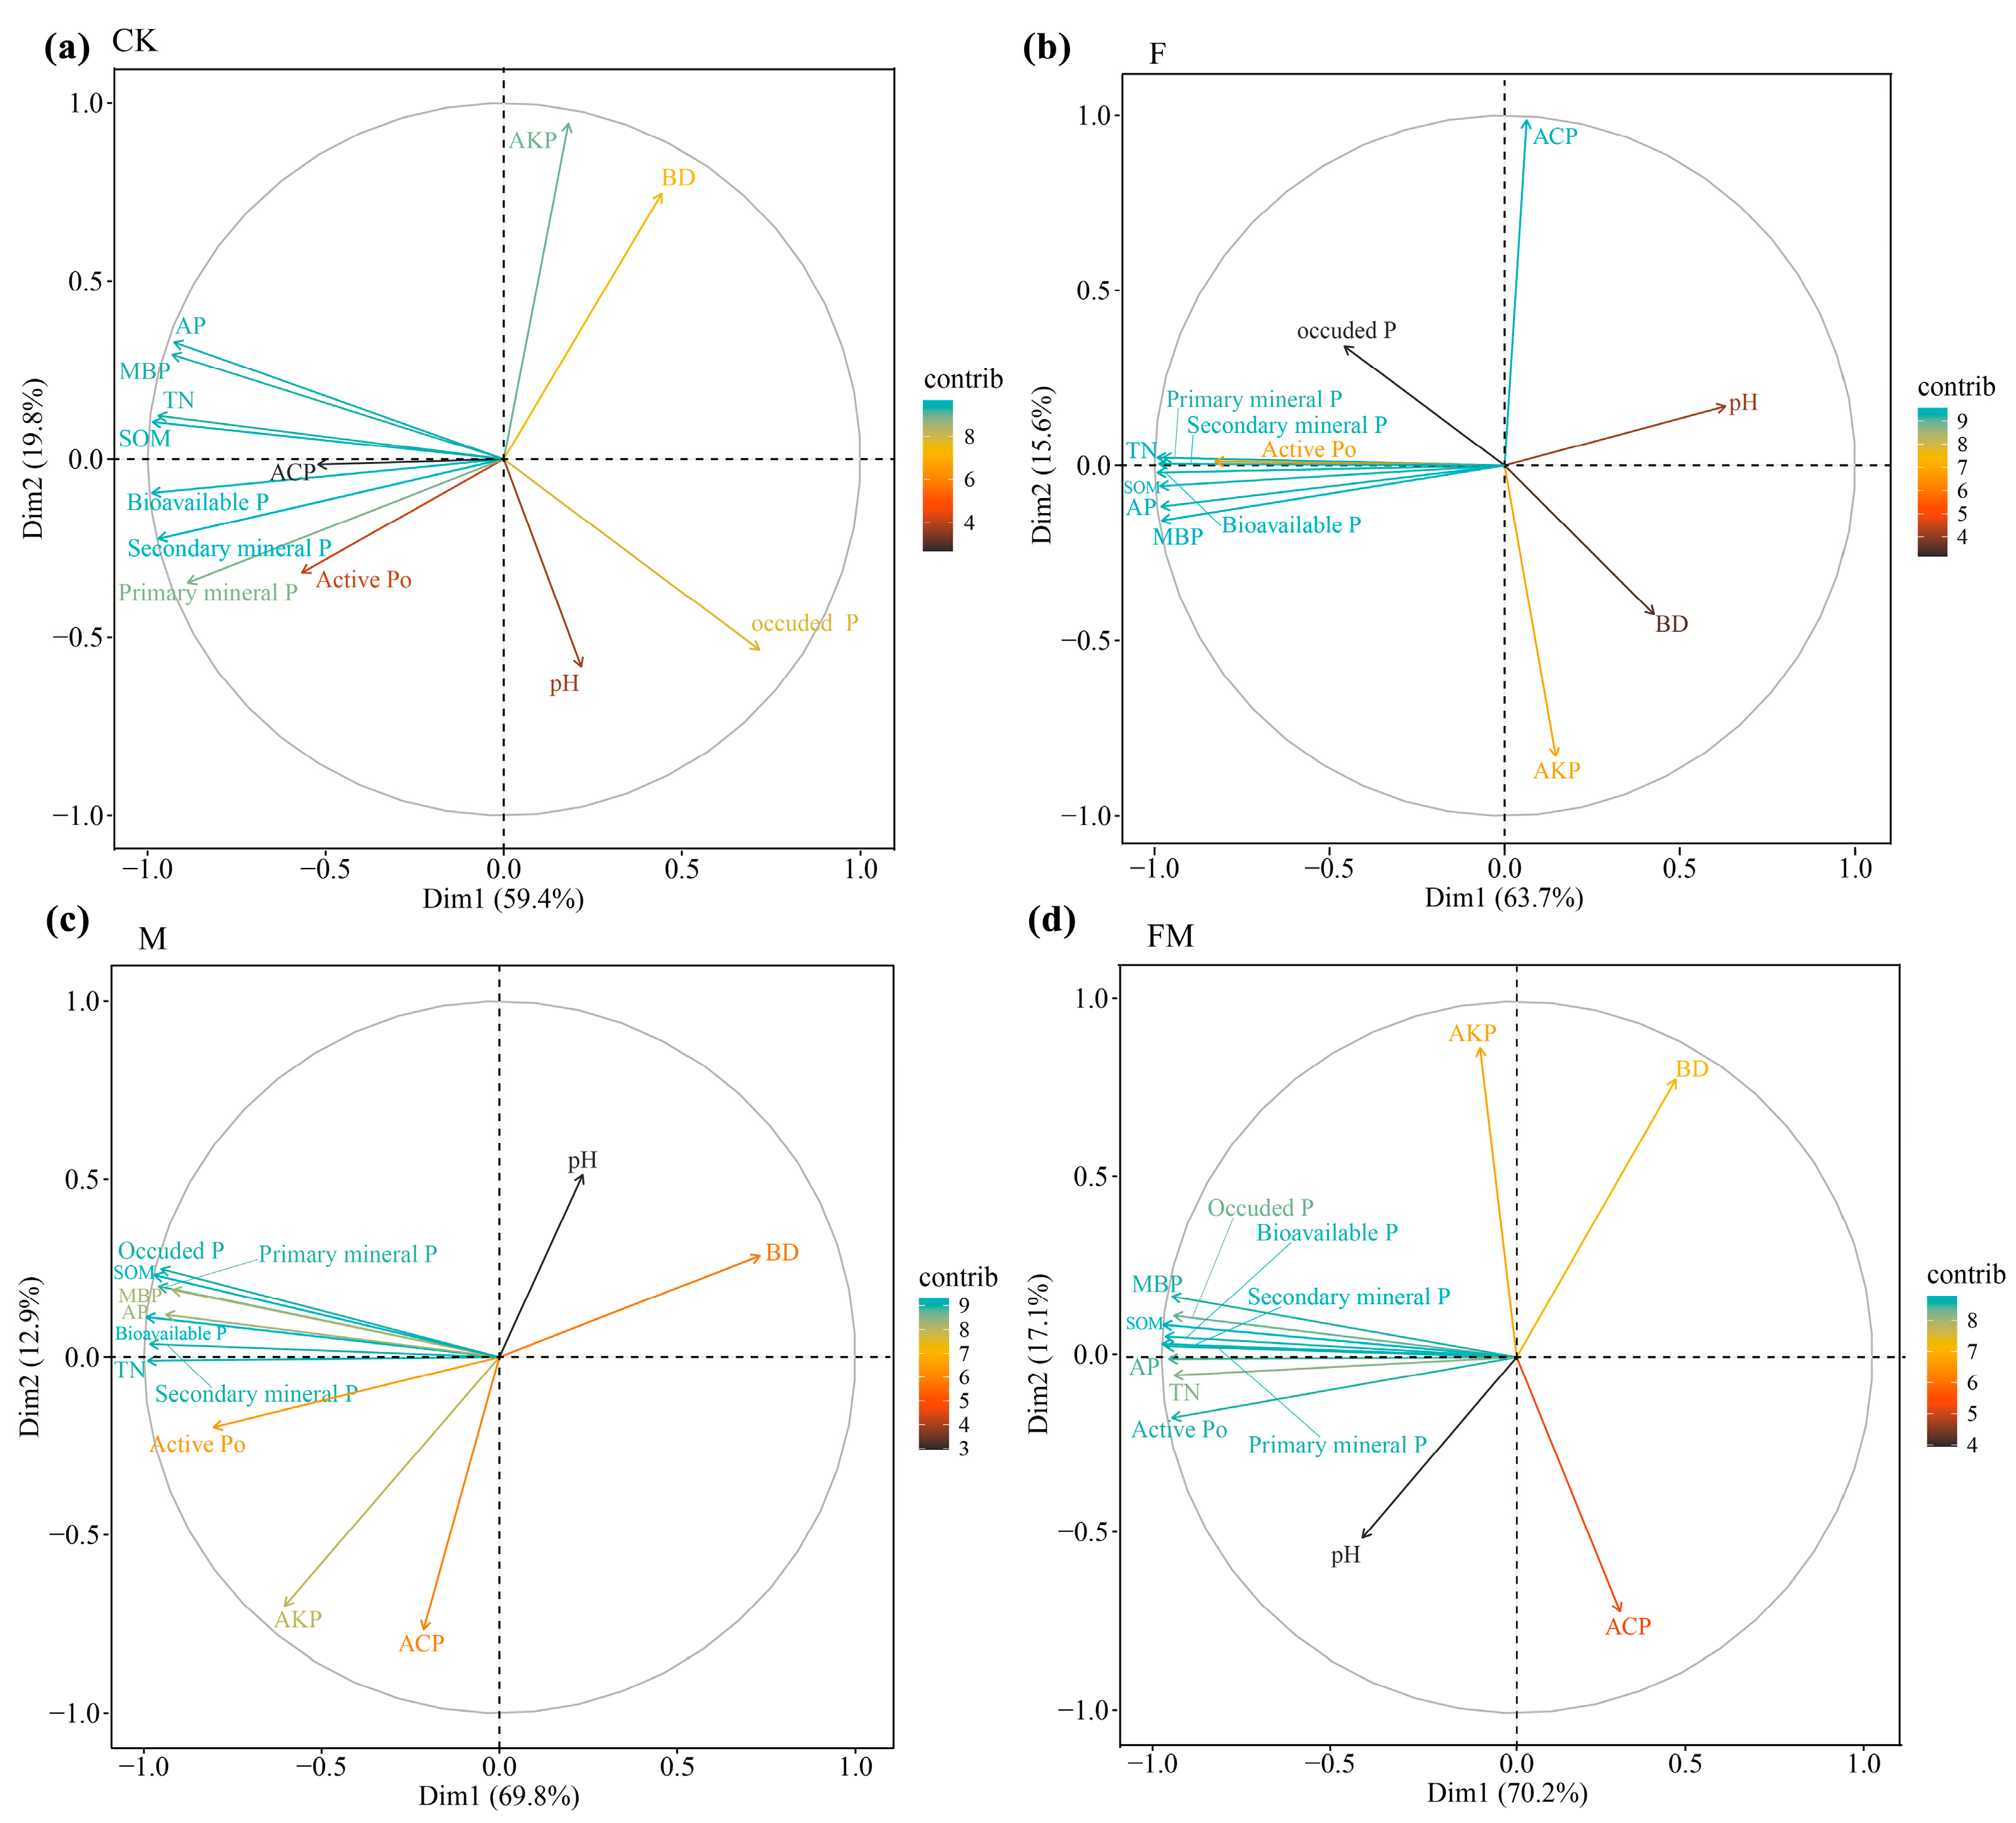
In the CK treatment (Figure 5), principal component 1 (PC1) explained 59.4% of the total variation, and principal component 2 (PC2) explained 19.8% of the total variation. SOM, TN, MBP, and AP are the key factors influencing the variation in bioavailable P, active Po, secondary mineral P, and primary mineral P. In the F treatment, PC1 explained 63.7% of the total variation and PC2 explained 15.6% of the total variation. SOM, TN, MBP, AP, and MBP are the key factors influencing the variation in soil phosphorus fractions. In the M treatment, PC1 explained 69.8% of the total variation, and PC2 explained 12.9% of the total variation. SOM, TN, MBP, AP, AKP, and ACP had a strong correlation with soil phosphorus fractions. In the FM treatment, PC1 explained 69.8% of the total variation and PC2 explained 12.9% of the total variation. SOM, TN, MBP, AP, and pH had a strong correlation with soil phosphorus fractions. On PC2, pH and BD are critical factors for AKP and ACP.
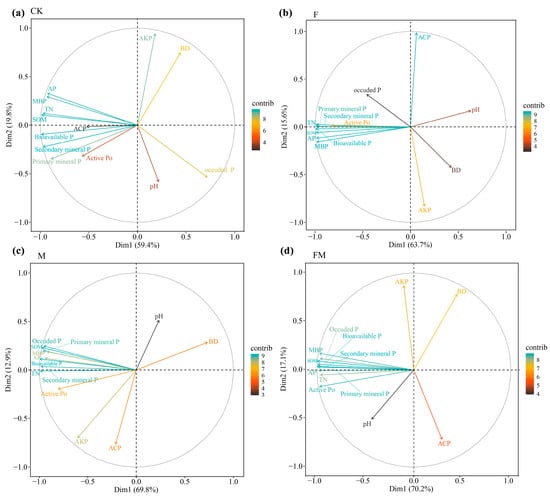
Figure 5.
The PCA between environmental factors and soil bioavailability of phosphorus fractions in (a) the control (CK), (b) mow and fertilize (F), (c) mow and manure (M), and (d) mow fertilize and manure (FM) treatments different treatments.
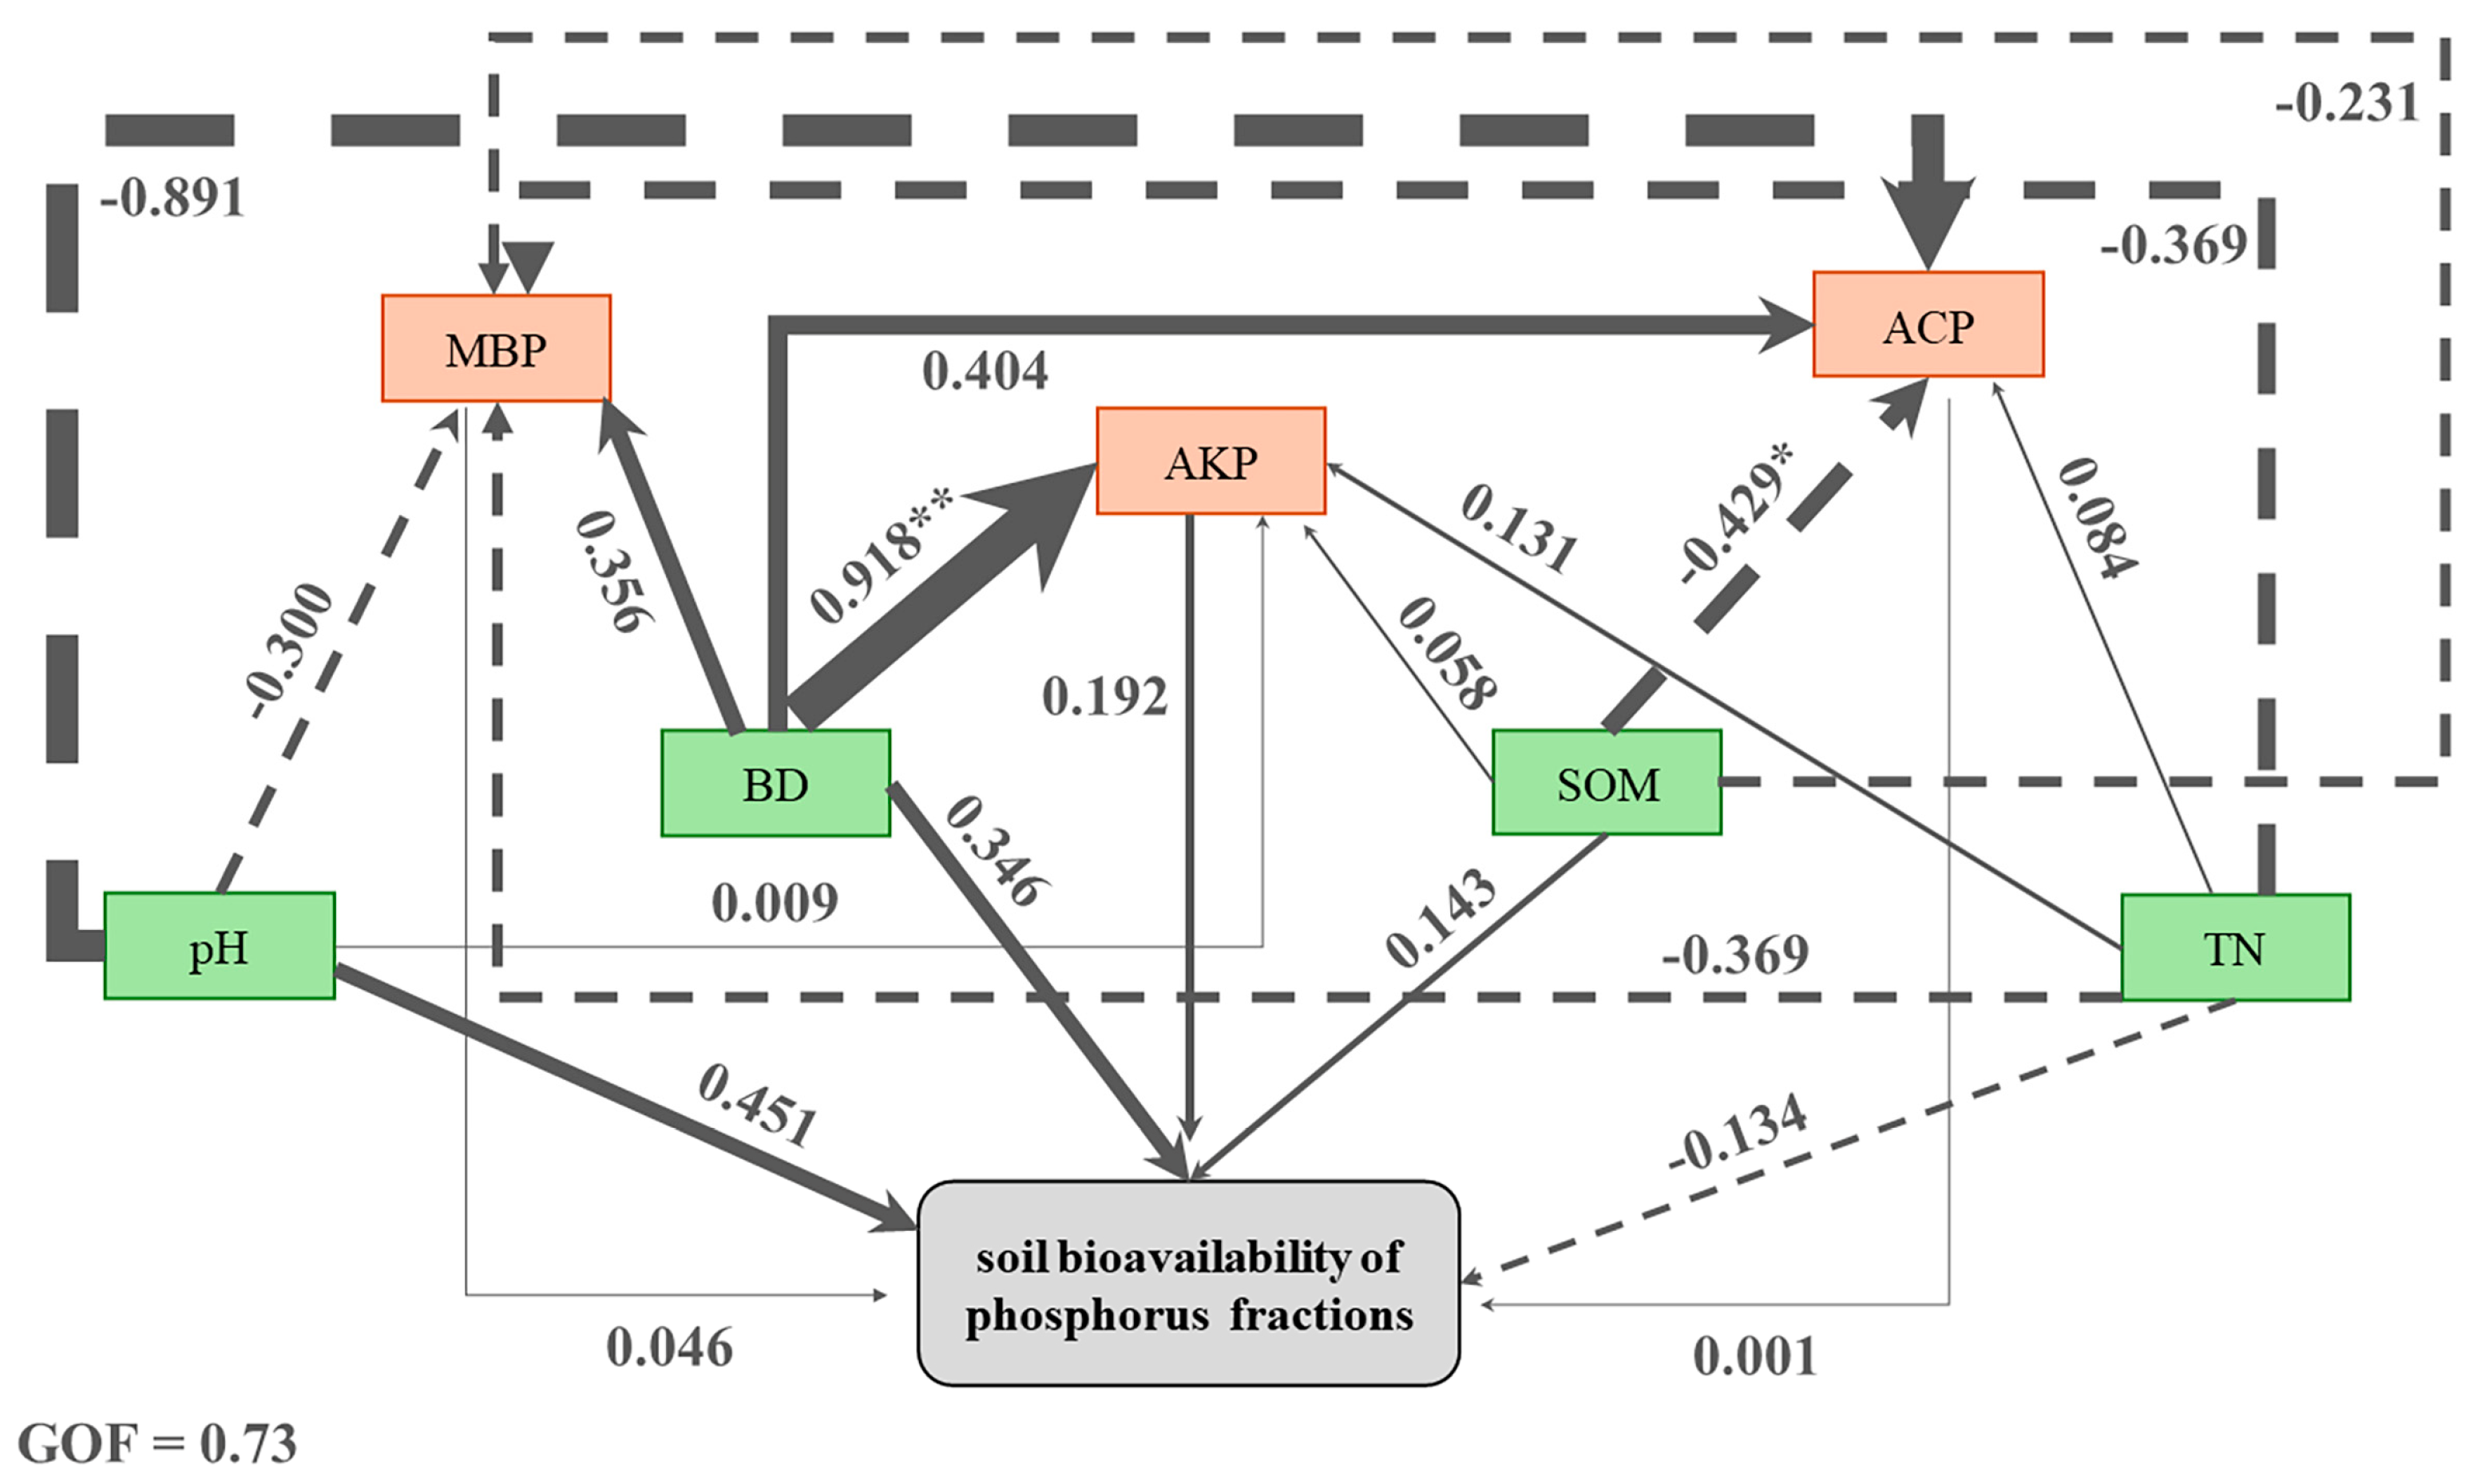
BD had a significant positive effect on AKP (Figure 6). SOM had a significant negative effect on ACP. pH has a strong negative effect on ACP. TN has a strong negative effect on MBP. pH and BD each had strong positive effects on the soil bioavailability of phosphorus fractions. BD had a strong positive effect on MBP and ACP.
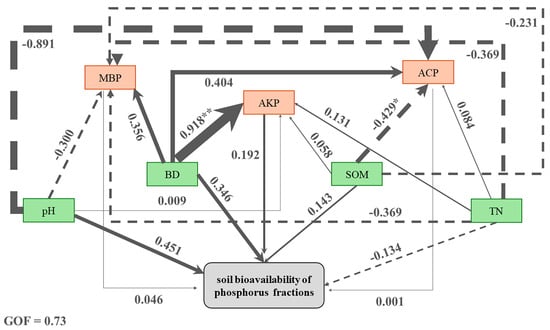
Figure 6.
Conceptual model depicting the hypothesized relationship between environmental factors and soil bioavailability of phosphorus fractions. The numbers represent the path coefficient. Solid and dash arrows indicate positive and negative effects, respectively. Goodness of fit (GOF) is used to assess the overall fit of the model. Significance levels of each symbol are ** p ≤ 0.01, and * p ≤ 0.05.
4. Discussion
4.1. Effect of Different Fertilizers on Soil Total Phosphorus
Compared to CK, the application of manure alone did not significantly elevate TP, but it showed an increasing trend in total Po. The fecal composition of animals varies greatly due to genetics, food sources, and nutritional requirements [30]. The manure in this study was obtained from cattle excreta, and its high organic phosphorus content resulted in an upward trend in soil organic phosphorus [31]. Application of mineral fertilizers alone significantly increased soil TP as well as total Pi, which is consistent with the results reported by Wang et al. [32] in the Loess Plateau. It is noteworthy that the application of manure and mineral fertilizers significantly increased the TP, total Pi, and total Po content of the soil, which is consistent with the results reported by Anthonio et al. [33] and Wang et al. [17]. Agricultural soils can receive phosphorus through resource inputs from both organic and inorganic sources [34]. However, information relating to the comparison between inorganic and organic sources on soil phosphorus status, particularly under the equal P amount level, remains scanty. As indicated in our study and previous research work, manure and mineral fertilizers applied in combination can significantly enhance phosphorus recovery [35]. It is also possible that the incorporation of manure reduces the precipitation rate of Ca2+, etc. when combined with the phosphate from fertilizers [36]. We therefore concluded that mineral fertilizers combined with manure had the highest capacity for phosphorus nutrient enrichment.
At the same time, we need to be concerned that solely increases in a single aspect of soil inorganic or organic phosphorus fraction may lead to alterations/interferences in the soil phosphorus cycle or phosphorus turnover. These changes are more likely to result from changes in microbial communities, such as elevating the abundance of bacteria with the potential for organophosphorus mineralization or altering the composition of bacterial communities with the potential for phosphate solubilization [37]. In contrast, FM treatment increased soil phosphorus in both inorganic and organic forms in a balanced manner, thereby promoting healthy maintenance of soil microbial activity (MBP) and community structure [16]. The interaction of fertilizer and manure was significant in elevating secondary mineralized phosphorus. This is beneficial for the long-term supply of bioavailable phosphorus and also benefits from the rapid turnover of phosphorus under strong microbial activity [7].
4.2. Effect of Different Fertilizers on the Soil Bioavailability of Phosphorus Fractions
The results of this study showed that the combination of mineral fertilizers and manure significantly enhanced soil bioavailable P compared to CK. Additionally, the application of mineral fertilizers alone also significantly enhanced soil bioavailable P, but the application of manure alone did not. This suggests that the rapid release of fast-acting nutrients from mineral fertilizers dominates in increasing soil-effective phosphorus during short-term fertilizer management [15]. Although not evaluated in this study, other nutrient/microbial beneficial impacts caused by manure should not be ignored. We also found significantly higher bioavailable P concentrations in FM than in F. This may be due to the fact that manure reduces the fixation of phosphorus by soil particles and promotes the conversion of low bioavailable phosphorus fractions to high bioavailable phosphorus fractions [17]. Compared to mineral fertilizers, animal manure has a more complex composition, containing organic substances such as organic acids, humus, and lignin, which can improve soil phosphorus bioavailability by increasing the decomposition of organic matter [38]. This is also reflected in the significantly higher MBP concentrations in FM. Similarly, the present study found that mineral fertilizers in combination with manure application significantly enhanced active Po. This is in agreement with the results reported by Khan et al. [15], stating that fertilizer management can significantly enhance the soil’s active phosphorus pools including NaOH-Po and NaHCO3-Po. These reactive organic phosphorus are also the components with the highest percentage in TP. This is consistent with the average percentage of organic phosphorus in most soils [39]. It has been shown that fertilizer application alters soil phosphorus dynamics in karst regions [19]. In our environment, the higher protonation of minerals at lower pH might increase the ability of iron or aluminum ions to adsorb phosphorus, represented in the form of more active Po and secondary mineral P [3]. This fraction of phosphorus, although not as directly and rapidly available as bioavailable phosphorus to provide nutrients to plants and microorganisms, can still be activated and utilized by plants or microorganisms through certain access strategies [40].
In this study, manure alone did not significantly increase soil primary mineral P and occluded P, but both phosphorus fractions increased significantly when applied in combination with mineral fertilizers. After mineral fertilizers are added, a portion of the orthophosphate is rapidly converted to recalcitrant phosphorus in the soil solution [41]. Khan et al. [15] suggested that under conditions of sufficient effective phosphorus, newly added phosphorus may increase binding to colloidal or organic compounds in the soil, which promotes the transport of phosphorus in the soil. Although this fraction of phosphorus is not active enough relative to the bioavailable P and active Po fractions, it may also become available under conditions of long-term active root activity [42]. The present study also found that AKP was generally unresponsive to treatment, which may be due to the fact that alkaline phosphatase does not play a dominant role in areas of lower pH [43]. Whereas, compared to manure, mineral fertilizers containing phosphorus significantly inhibited the activity of ACP, which is consistent with the results of Touhami et al. [44]. Another possible explanation is that the increase in acid phosphatase activity is induced when phosphorus limitation is exacerbated, and there is an increase in organophosphorus substrates [45].
In addition, the combination of mineral fertilizers and manure in this study can additionally provide effective nutrients to support phosphorus uptake by plants or microorganisms. For example, an increase in soil SOM, MBP, and TN concentrations through favorable environmental conditions can play a dominant role in the mineralization of soil organic phosphorus [15]. The results of PCA analysis in this study showed that soil properties (SOM, TN, AP, and MBP) were the key factors influencing the individual bioavailable phosphorus fractions. Meanwhile, the conceptual modeling results indicated that pH and BD not only have direct positive effects on phosphorus fractions but also indirectly affect phosphorus fractions by influencing ACP, AKP, and MBP. This was also reported in the findings of Bhupenchandra et al. [46]. Fertilizer application may also affect the effectiveness of soil phosphorus nutrients, soil solution flow, and storage by improving soil physical properties, such as the formation and stability of soil macroaggregates [47]. This study investigated the effects of mineral fertilizers and manure on phosphorus fractions from the perspective of bioavailability and emphasized the enhancement effect of soil phosphorus nutrient enrichment capacity and bioavailability by the application of mineral fertilizers in conjunction with manure. Further research is warranted to better delineate the linkage between soil phosphorous status and microbial community structure and/or enrichment of functional genes, such as phoD, phn, and phoU [48].
5. Conclusions
This study revealed that mineral fertilizers combined with manure had the highest capacity for phosphorus nutrient enrichment. Rapid release of mineral fertilizer nutrients played a dominant role in enhancing soil bioavailable phosphorus. In contrast, manure also enhances soil bioavailable phosphorus in terms of both reduced phosphorus fixation and increased organic matter decomposition. The combination of the two directly enhances the individual bioavailable phosphorus fractions of soil and supports better plant or microbial phosphorus uptake by providing favorable environmental conditions or additional effective nutrients (SOM, TN, etc.). The application of mineral fertilizers alone inhibits soil acid-phosphatase activity. To our knowledge, there is very little prior research considering the effects of chemical fertilizers, manure, and the mixture of the two on soil phosphorus fractions from the perspective of bioavailability in the karst areas. Thus, the findings from this study could provide foundational knowledge for future research directions.
Author Contributions
Conceptualization, S.H. and Z.L.; data curation, J.P. and Z.L.; formal analysis, J.P. and Z.L.; funding acquisition, Z.L.; investigation, S.H.; methodology, F.Y. and Z.L.; project administration, M.Z.; resources, F.Y., W.Y. and M.Z.; supervision, F.Y. and Z.L.; validation, W.Y. and Z.L.; writing—original draft, J.P.; writing—review and editing, J.P. and Z.L. All authors have read and agreed to the published version of the manuscript.
Funding
This research was financed by the National Natural Science Foundation of China (32160337), the Guizhou Provincial Science and Technology Projects (Qian Ke He Zhi Cheng [2022] Yi Ban 106; Qian Ke He Zhi Cheng [2023] Yi Ban 473; QKHPTRC-CXTD [2022]011).
Data Availability Statement
The data presented in this study are available on request from the corresponding author.
Conflicts of Interest
The authors declare no conflicts of interest.
References
- Elser, J.J.; Bracken, M.E.S.; Cleland, E.E.; Gruner, D.S.; Harpole, W.S.; Hillebrand, H.; Ngai, J.T.; Seabloom, E.W.; Shurin, J.B.; Smith, J.E. Global analysis of nitrogen and phosphorus limitation of primary producers in freshwater, marine and terrestrial ecosystems. Ecol. Lett. 2007, 10, 1135–1142. [Google Scholar] [CrossRef]
- Fu, D.; Wu, X.; Duan, C.; Zhao, L.; Li, B. Different life-form plants exert different rhizosphere effects on phosphorus biogeochemistry in subtropical mountainous soils with low and high phosphorus content. Soil Tillage Res. 2020, 199, 104516. [Google Scholar] [CrossRef]
- Hinsinger, P. Bioavailability of soil inorganic P in the rhizosphere as affected by root-induced chemical changes: A review. Plant Soil 2001, 237, 173–195. [Google Scholar] [CrossRef]
- Cross, A.F.; Schlesinger, W.H. A literature review and evaluation of the. Hedley fractionation: Applications to the biogeochemical cycle of soil phosphorus in natural ecosystems. Geoderma 1995, 64, 197–214. [Google Scholar] [CrossRef]
- Hedley, M.J.; Stewart, J.W.B.; Chauhan, B.S. Changes in Inorganic and Organic Soil Phosphorus Fractions Induced by Cultivation Practices and by Laboratory Incubations. Soil Sci. Soc. Am. J. 1982, 46, 970–976. [Google Scholar] [CrossRef]
- Tiessen, H.; Stewart, J.W.B.; Cole, C.V. Pathways of Phosphorus Transformations in Soils of Differing Pedogenesis. Soil Sci. Soc. Am. J. 1984, 48, 853–858. [Google Scholar] [CrossRef]
- Hou, E.; Chen, C.; Kuang, Y.; Zhang, Y.; Heenan, M.; Wen, D. A structural equation model analysis of phosphorus transformations in global unfertilized and uncultivated soils. Glob. Biogeochem. Cycles 2016, 30, 1300–1309. [Google Scholar] [CrossRef]
- Tian, X.; Bing, H.; Wu, Y.; Zhu, H.; Zhao, W.; He, Q.; Xiong, D. Farmland abandonment decreases soil bioavailable phosphorus but increases organic phosphorus in the mid-hills of Nepal. Catena 2022, 211, 106000. [Google Scholar] [CrossRef]
- MacDonald, G.K.; Bennett, E.M.; Potter, P.A.; Ramankutty, N. Agronomic phosphorus imbalances across the world’s croplands. Proc. Natl. Acad. Sci. USA 2011, 108, 3086–3091. [Google Scholar] [CrossRef]
- Li, Z.; Cui, S.; Zhang, Q.; Xu, G.; Feng, Q.; Chen, C.; Li, Y. Optimizing Wheat Yield, Water, and Nitrogen Use Efficiency with Water and Nitrogen Inputs in China: A Synthesis and Life Cycle Assessment. Front. Plant Sci. 2022, 13, 930484. [Google Scholar] [CrossRef]
- Li, Y.; Li, Y.; Zhang, Q.; Xu, G.; Liang, G.; Kim, D.-G.; Carmona, C.R.; Yang, M.; Xue, J.; Xiang, Y.; et al. Enhancing soil carbon and nitrogen through grassland conversion from degraded croplands in China: Assessing magnitudes and identifying key drivers of phosphorus reduction. Soil Tillage Res. 2024, 236, 105943. [Google Scholar] [CrossRef]
- Tian, X.; Engel, B.A.; Qian, H.; Hua, E.; Sun, S.; Wang, Y. Will reaching the maximum achievable yield potential meet future global food demand? J. Clean. Prod. 2021, 294, 126285. [Google Scholar] [CrossRef]
- Ford, D.; Williams, P. Introduction to Karst. In Karst Hydrogeology and Geomorphology; Ford, D., Williams, P., Eds.; Wiley: Hoboken, NJ, USA, 2007; pp. 1–8. [Google Scholar] [CrossRef]
- Du, E.; Terrer, C.; Pellegrini, A.F.A.; Ahlström, A.; van Lissa, C.J.; Zhao, X.; Xia, N.; Wu, X.; Jackson, R.B. Global patterns of terrestrial nitrogen and phosphorus limitation. Nat. Geosci. 2020, 13, 221–226. [Google Scholar] [CrossRef]
- Khan, A.; Zhang, G.; Li, T.; He, B. Fertilization and cultivation management promotes soil phosphorus availability by enhancing soil P-cycling enzymes and the phosphatase encoding genes in bulk and rhizosphere soil of a maize crop in sloping cropland. Ecotoxicol. Environ. Saf. 2023, 264, 115441. [Google Scholar] [CrossRef]
- Qaswar, M.; Ahmed, W.; Huang, J.; Liu, K.-L.; Zhang, L.; Han, T.-F.; DU, J.-X.; Ali, S.; Ur-Rahim, H.; Huang, Q.-H.; et al. Interaction of soil microbial communities and phosphorus fractions under long-term fertilization in paddy soil. J. Integr. Agric. 2022, 21, 2134–2144. [Google Scholar] [CrossRef]
- Wang, Q.; Qin, Z.-H.; Zhang, W.-W.; Chen, Y.-H.; Zhu, P.; Peng, C.; Wang, L.; Zhang, S.-X.; Colinet, G. Effect of long-term fertilization on phosphorus fractions in different soil layers and their quantitative relationships with soil properties. J. Integr. Agric. 2022, 21, 2720–2733. [Google Scholar] [CrossRef]
- Qin, W.; Zhao, X.; Yang, F.; Chen, J.; Mo, Q.; Cui, S.; Chen, C.; He, S.; Li, Z. Impact of fertilization and grazing on soil N and enzyme activities in a karst pasture ecosystem. Geoderma 2023, 437, 116578. [Google Scholar] [CrossRef]
- Tian, J.; Lu, X.; Chen, Q.; Kuang, X.; Liang, C.; Deng, L.; Lin, D.; Cai, K.; Tian, J. Phosphorus fertilization affects soybean rhizosphere phosphorus dynamics and the bacterial community in karst soils. Plant Soil 2022, 475, 137–152. [Google Scholar] [CrossRef]
- Gooneratne, S.; Laarveld, B.; Pathirana, K.; Christensen, D. Effects of dietary Cu, Mo and S on urinary Cu and Zn excretion in Simmental and Angus cattle. Res. Veter Sci. 2011, 91, e116–e120. [Google Scholar] [CrossRef]
- Salim, H.; Wood, K.M.; Abo-Ismail, M.K.; McEwen, P.L.; Mandell, I.B.; Miller, S.P.; Cant, J.P.; Swanson, K.C. Influence of feeding increasing levels of dry corn distillers grains plus solubles in whole corn grain-based finishing diets on total tract digestion, nutrient balance, and excretion in beef steers1,2. J. Anim. Sci. 2012, 90, 4441–4448. [Google Scholar] [CrossRef]
- Kuo, S. Phosphorus. In Methods of Soil Analysis: Part 3 Chemical Methods, 5.3; Sparks, D.L., Page, A.L., Helmke, P.A., Loeppert, R.H., Soltanpour, P.N., Tabatabai, M.A., Johnston, C.T., Sumner, M.E., Eds.; Wiley: Hoboken, NJ, USA, 1996; pp. 869–919. [Google Scholar] [CrossRef]
- Brookes, P.C.; Powlson, D.S.; Jenkinson, D.S. Measurement of microbial biomass phosphorus in soil. Soil Biol. Biochem. 1982, 14, 319–329. [Google Scholar] [CrossRef]
- Tiessen, H.; Moir, J.O. Characterization of Available P by Sequential Extraction. In Soil Sampling and Methods of Analysis; Carter, M.R., Ed.; Lewis Publishers: Boca Raton, FL, USA, 1993; pp. 75–86. [Google Scholar]
- Thomas, G.W. Soil pH and Soil Acidity. In Methods of Soil Analysis: Part 3 Chemical Methods, 5.3; Sparks, D.L., Page, A.L., Helmke, P.A., Loeppert, R.H., Soltanpour, P.N., Tabatabai, M.A., Johnston, C.T., Sumner, M.E., Eds.; Wiley: Hoboken, NJ, USA, 1996; pp. 475–490. [Google Scholar] [CrossRef]
- Blake, G.R.; Hartge, K.H. Bulk Density. In Methods of Soil Analysis; Klute, A., Ed.; Wiley: Hoboken, NJ, USA, 1986; pp. 363–375. [Google Scholar] [CrossRef]
- Bremner, J.M.; Tabatabai, M.A. Use of an ammonia electrode for determination of ammonium in Kjeldahl analysis of soils. Commun. Soil Sci. Plant Anal. 1972, 3, 159–165. [Google Scholar] [CrossRef]
- Brady, N.; Weil, R. The Nature and Properties of Soils, 7th ed.; Prentice Hall: Upper Saddle River, NJ, USA, 1996. [Google Scholar]
- Acosta-Martínez, V.; Ali Tabatabai, M. Phosphorus Cycle Enzymes. In Methods of Soil Enzymology; Dick, R.P., Ed.; Wiley: Hoboken, NJ, USA, 2011; pp. 161–183. [Google Scholar] [CrossRef]
- Shafqat, M.N.; Pierzynski, G.M.; Xia, K. Phosphorus Source Effects on Soil Organic Phosphorus: A31P NMR Study. Commun. Soil Sci. Plant Anal. 2009, 40, 1722–1746. [Google Scholar] [CrossRef]
- Chen, G.; Yuan, J.; Chen, H.; Zhao, X.; Wang, S.; Zhu, Y.; Wang, Y. Animal manures promoted soil phosphorus transformation via affecting soil microbial community in paddy soil. Sci. Total. Environ. 2022, 831, 154917. [Google Scholar] [CrossRef] [PubMed]
- Wang, J.; Liu, W.-Z.; Mu, H.-F.; Dang, T.-H. Inorganic Phosphorus Fractions and Phosphorus Availability in a Calcareous Soil Receiving 21-Year Superphosphate Application. Pedosphere 2010, 20, 304–310. [Google Scholar] [CrossRef]
- Anthonio, C.K.; Jing, H.; Jin, C.; Khan, M.N.; Jiangxue, D.; Garba, H.N.; Dongchu, L.; Guangrong, L.; Shujun, L.; Lisheng, L.; et al. Impact of long-term fertilization on phosphorus fractions and manganese oxide with their interactions in paddy soil aggregates. J. Environ. Manag. 2023, 333, 117440. [Google Scholar] [CrossRef] [PubMed]
- Bhat, N.A.; Riar, A.; Ramesh, A.; Iqbal, S.; Sharma, M.P.; Sharma, S.K.; Bhullar, G.S. Soil Biological Activity Contributing to Phosphorus Availability in Vertisols under Long-Term Organic and Conventional Agricultural Management. Front. Plant Sci. 2017, 8, 1523. [Google Scholar] [CrossRef] [PubMed]
- Halajnia, A.; Haghnia, G.; Fotovat, A.; Khorasani, R. Phosphorus fractions in calcareous soils amended with P fertilizer and cattle manure. Geoderma 2009, 150, 209–213. [Google Scholar] [CrossRef]
- Delgado, A.; Madrid, A.; Kassem, S.; Andreu, L.; del Carmen del Campillo, M. Phosphorus fertilizer recovery from calcareous soils amended with humic and fulvic acids. Plant Soil 2002, 245, 277–286. [Google Scholar] [CrossRef]
- Bi, Q.-F.; Li, K.-J.; Zheng, B.-X.; Liu, X.-P.; Li, H.-Z.; Jin, B.-J.; Ding, K.; Yang, X.-R.; Lin, X.-Y.; Zhu, Y.-G. Partial replacement of inorganic phosphorus (P) by organic manure reshapes phosphate mobilizing bacterial community and promotes P bioavailability in a paddy soil. Sci. Total. Environ. 2020, 703, 134977. [Google Scholar] [CrossRef]
- Chen, G.-L.; Xiao, L.; Xia, Q.-L.; Wang, Y.; Yuan, J.-H.; Chen, H.; Wang, S.-Q.; Zhu, Y.-Y. Characterization of Different Phosphorus Forms in Flooded and Upland Paddy Soils Incubated with Various Manures. ACS Omega 2021, 6, 3259–3266. [Google Scholar] [CrossRef] [PubMed]
- Condron, L.M.; Turner, B.L.; Cade-Menun, B.J. Chemistry and Dynamics of Soil Organic Phosphorus. In Phosphorus: Agriculture and the Environment; Sims, T., Sharpley, A.N., Eds.; Wiley: Hoboken, NJ, USA, 2005; pp. 87–121. [Google Scholar] [CrossRef]
- Guan, Z.-H.; Cao, Z.; Li, X.G.; Kühn, P.; Hu, G.; Scholten, T.; Zhu, J.; He, J.-S. Effects of winter grazing and N addition on soil phosphorus fractions in an alpine grassland on the Qinghai-Tibet Plateau. Agric. Ecosyst. Environ. 2023, 357, 108700. [Google Scholar] [CrossRef]
- Chtouki, M.; Naciri, R.; Garré, S.; Nguyen, F.; Zeroual, Y.; Oukarroum, A. Phosphorus fertilizer form and application frequency affect soil P availability, chickpea yield, and P use efficiency under drip fertigation. J. Plant Nutr. Soil Sci. 2022, 185, 603–611. [Google Scholar] [CrossRef]
- Gu, Y.; Ros, G.H.; Zhu, Q.; Zheng, D.; Shen, J.; Cai, Z.; Xu, M.; de Vries, W. Responses of total, reactive and dissolved phosphorus pools and crop yields to long-term fertilization. Agric. Ecosyst. Environ. 2023, 357, 108658. [Google Scholar] [CrossRef]
- Wang, Y.; Luo, D.; Xiong, Z.; Wang, Z.; Gao, M. Changes in rhizosphere phosphorus fractions and phosphate-mineralizing microbial populations in acid soil as influenced by organic acid exudation. Soil Tillage Res. 2023, 225, 105543. [Google Scholar] [CrossRef]
- Touhami, D.; Condron, L.M.; McDowell, R.W.; Moss, R. Effects of long-term phosphorus fertilizer inputs and seasonal conditions on organic soil phosphorus cycling under grazed pasture. Soil Use Manag. 2023, 39, 385–401. [Google Scholar] [CrossRef]
- Peng, S.; Kuang, X.; Cheng, H.; Wei, K.; Cai, K.; Tian, J. Post-agricultural succession affects the accumulation and enzymatic transformation of organic phosphorus in a karst area, southwest China. Plant Soil 2023, 498, 5–20. [Google Scholar] [CrossRef]
- Bhupenchandra, I.; Basumatary, A.; Dutta, S.; Das, A.; Choudhary, A.K.; Lal, R.; Sharma, A.D.; Sen, A.; Prabhabati, Y.; Sahoo, M.R. Repercussions of fertilization with boron and enriched organic manure on soil chemical characteristics, boron and phosphorus fractions, and French bean productivity in an acidic Inceptisol of eastern Himalaya. Sci. Hortic. 2024, 324, 112589. [Google Scholar] [CrossRef]
- Guo, Z.; Zhang, L.; Yang, W.; Hua, L.; Cai, C. Aggregate Stability under Long-Term Fertilization Practices: The Case of Eroded Ultisols of South-Central China. Sustainability 2019, 11, 1169. [Google Scholar] [CrossRef]
- Dai, Z.; Liu, G.; Chen, H.; Chen, C.; Wang, J.; Ai, S.; Wei, D.; Li, D.; Ma, B.; Tang, C.; et al. Long-term nutrient inputs shift soil microbial functional profiles of phosphorus cycling in diverse agroecosystems. ISME J. 2020, 14, 757–770. [Google Scholar] [CrossRef]


Disclaimer/Publisher’s Note: The statements, opinions and data contained in all publications are solely those of the individual author(s) and contributor(s) and not of MDPI and/or the editor(s). MDPI and/or the editor(s) disclaim responsibility for any injury to people or property resulting from any ideas, methods, instructions or products referred to in the content. |
© 2024 by the authors. Licensee MDPI, Basel, Switzerland. This article is an open access article distributed under the terms and conditions of the Creative Commons Attribution (CC BY) license (https://creativecommons.org/licenses/by/4.0/).