Abstract
The evaluation of soil quality in different altitudinal gradients, with vegetative and non-vegetative subareas, is crucial for proper soil functioning and optimal crop growth, thus contributing to the sustainability of agroecosystems. Although the altitudinal gradient significantly influences soil quality, the ability to predict this quality, expressed through an index, in soils with and without vegetative cover, is still insufficiently explored. This study employed the simple additive index (SQI) method to evaluate soil quality in Ecuador’s Jun Jun micro-watershed, Tungurahua region. Three altitude categories (<2800, 2800–2900, >2900 masl) were investigated, with 24 soil samples collected across both vegetated and non-vegetated areas. The indicators used included chemical and biological parameters such as soil organic carbon (OC), earthworm density (WD), earthworm biomass (WB), organic matter (OM), pH, and total nitrogen (TN). The results revealed that in areas with altitudinal gradients below 2800 masl, the soil quality index values were higher compared to other altitudes. In vegetated areas, a decrease in index values was observed as the altitudinal gradient increased, indicating a deterioration in soil quality with increasing altitude. These findings are significant in providing a quantitative assessment of the effects of altitudinal gradient and vegetative cover influence on soil quality.
1. Introduction
As the pressure on agriculture increases to meet growing food demands, understanding the interactions between different crops and the physical, chemical, and biological parameters of the soil becomes imperative. Inappropriate soil use can lead to nutrient depletion and a loss of quality, exacerbating soil contamination [1]. Soil quality plays a crucial role in the functioning of agroecosystems and in maintaining the health of organisms that are dependent on it, whether plants, animals, or microorganisms. Soil health and vitality are fundamental elements to ensure food security and the sustained success of agriculture [2].
In this context, the soil quality index emerges as an essential tool to assess soil capacity and ensure more efficient and sustainable crop management in agroecosystems. Soil’s fertility, its ability to retain water and nutrients, and its physical structure are determining factors in the viability of life and food production [3]. However, soil quality is a complex concept to estimate, which makes it necessary to use many indicators to determine soil characteristics [4]. These physical, chemical, and biological indicators of the soil are measurable parameters that, although they do not directly represent the quality of the soil, offer information about its properties and functions [5]. The variety of parameters and indicators highlights the need to consider multiple dimensions to assess soil quality [6], as each indicator offers unique information about specific aspects of the soil, and their combination provides a more comprehensive assessment [7].
The estimation of the soil quality index is a complex and challenging process, given the numerous factors influencing soil quality, such as texture, organic matter, and biological activity [8]. Although considerable progress has been made in estimating the soil quality index, especially in specific soil contexts and management practices [9], most studies tend to employ a single method, indicating a trend toward simplification and standardization in soil quality assessment [10]. Simplification may not fully capture the complexity of agroecosystem soils, resulting in less accurate assessments [11]. Furthermore, standardization may not be applicable to all contexts, as soil characteristics can vary considerably from one place to another [12]. The difficulty in calculating the soil quality index underscores the importance of developing a credible and user-friendly index [13].
The ongoing degradation of micro-watersheds poses continuous environmental and social problems [14]. Soil degradation contributes to reductions in biological, chemical, and physical properties in extensive areas with agricultural potential, whose vulnerability increases with the intensification of land use in agricultural activities and for other purposes [15]. The evaluation of the soil quality index, through indicators such as earthworm density and biomass, organic matter content, hydrogen potential, total nitrogen, and organic carbon, becomes crucial to promote sustainable agricultural production by addressing the complex interaction between soil characteristics and crop yields [16]. This study adopts a comprehensive approach, analyzing multiple altitudinal gradients of the soil and the influence of vegetation cover on crop yields in the Jun Jun micro-watershed in the Ecuadorian region. By considering variability across different soil layers, the aim is to capture the inherent complexity of soil processes in this specific region.
This study aims to assess soil quality and its implications for sustainable crop management in agroecosystems, driven by the increasing pressure on agriculture to meet growing food demands. We seek to understand the interactions between different crops and soil parameters to address issues such as nutrient depletion, quality loss, and soil contamination, ultimately contributing to food security and the sustained success of agriculture. This research was conducted in the Tungurahua region in Ecuador, and the principles and methodologies employed here can be adapted and applied to other regions facing similar challenges in soil management and agricultural sustainability. The novelty of this research lies in its comprehensive approach, analyzing multiple altitudinal gradients and vegetation cover influences on crop yield, providing insights into the complex dynamics of soil processes in agroecosystems. It emphasizes the importance of considering various soil parameters, including physical, chemical, and biological indicators, to accurately assess soil quality and inform sustainable agricultural practices. Additionally, it addresses the challenges and limitations in estimating the soil quality index, highlighting the need for a credible and user-friendly index that captures the complexities of agroecosystem soils. By focusing on the Jun Jun micro-watershed in Ecuador, we contribute to the understanding of soil degradation issues and promote sustainable agricultural production practices in this specific region.
2. Materials and Methods
2.1. Study Area
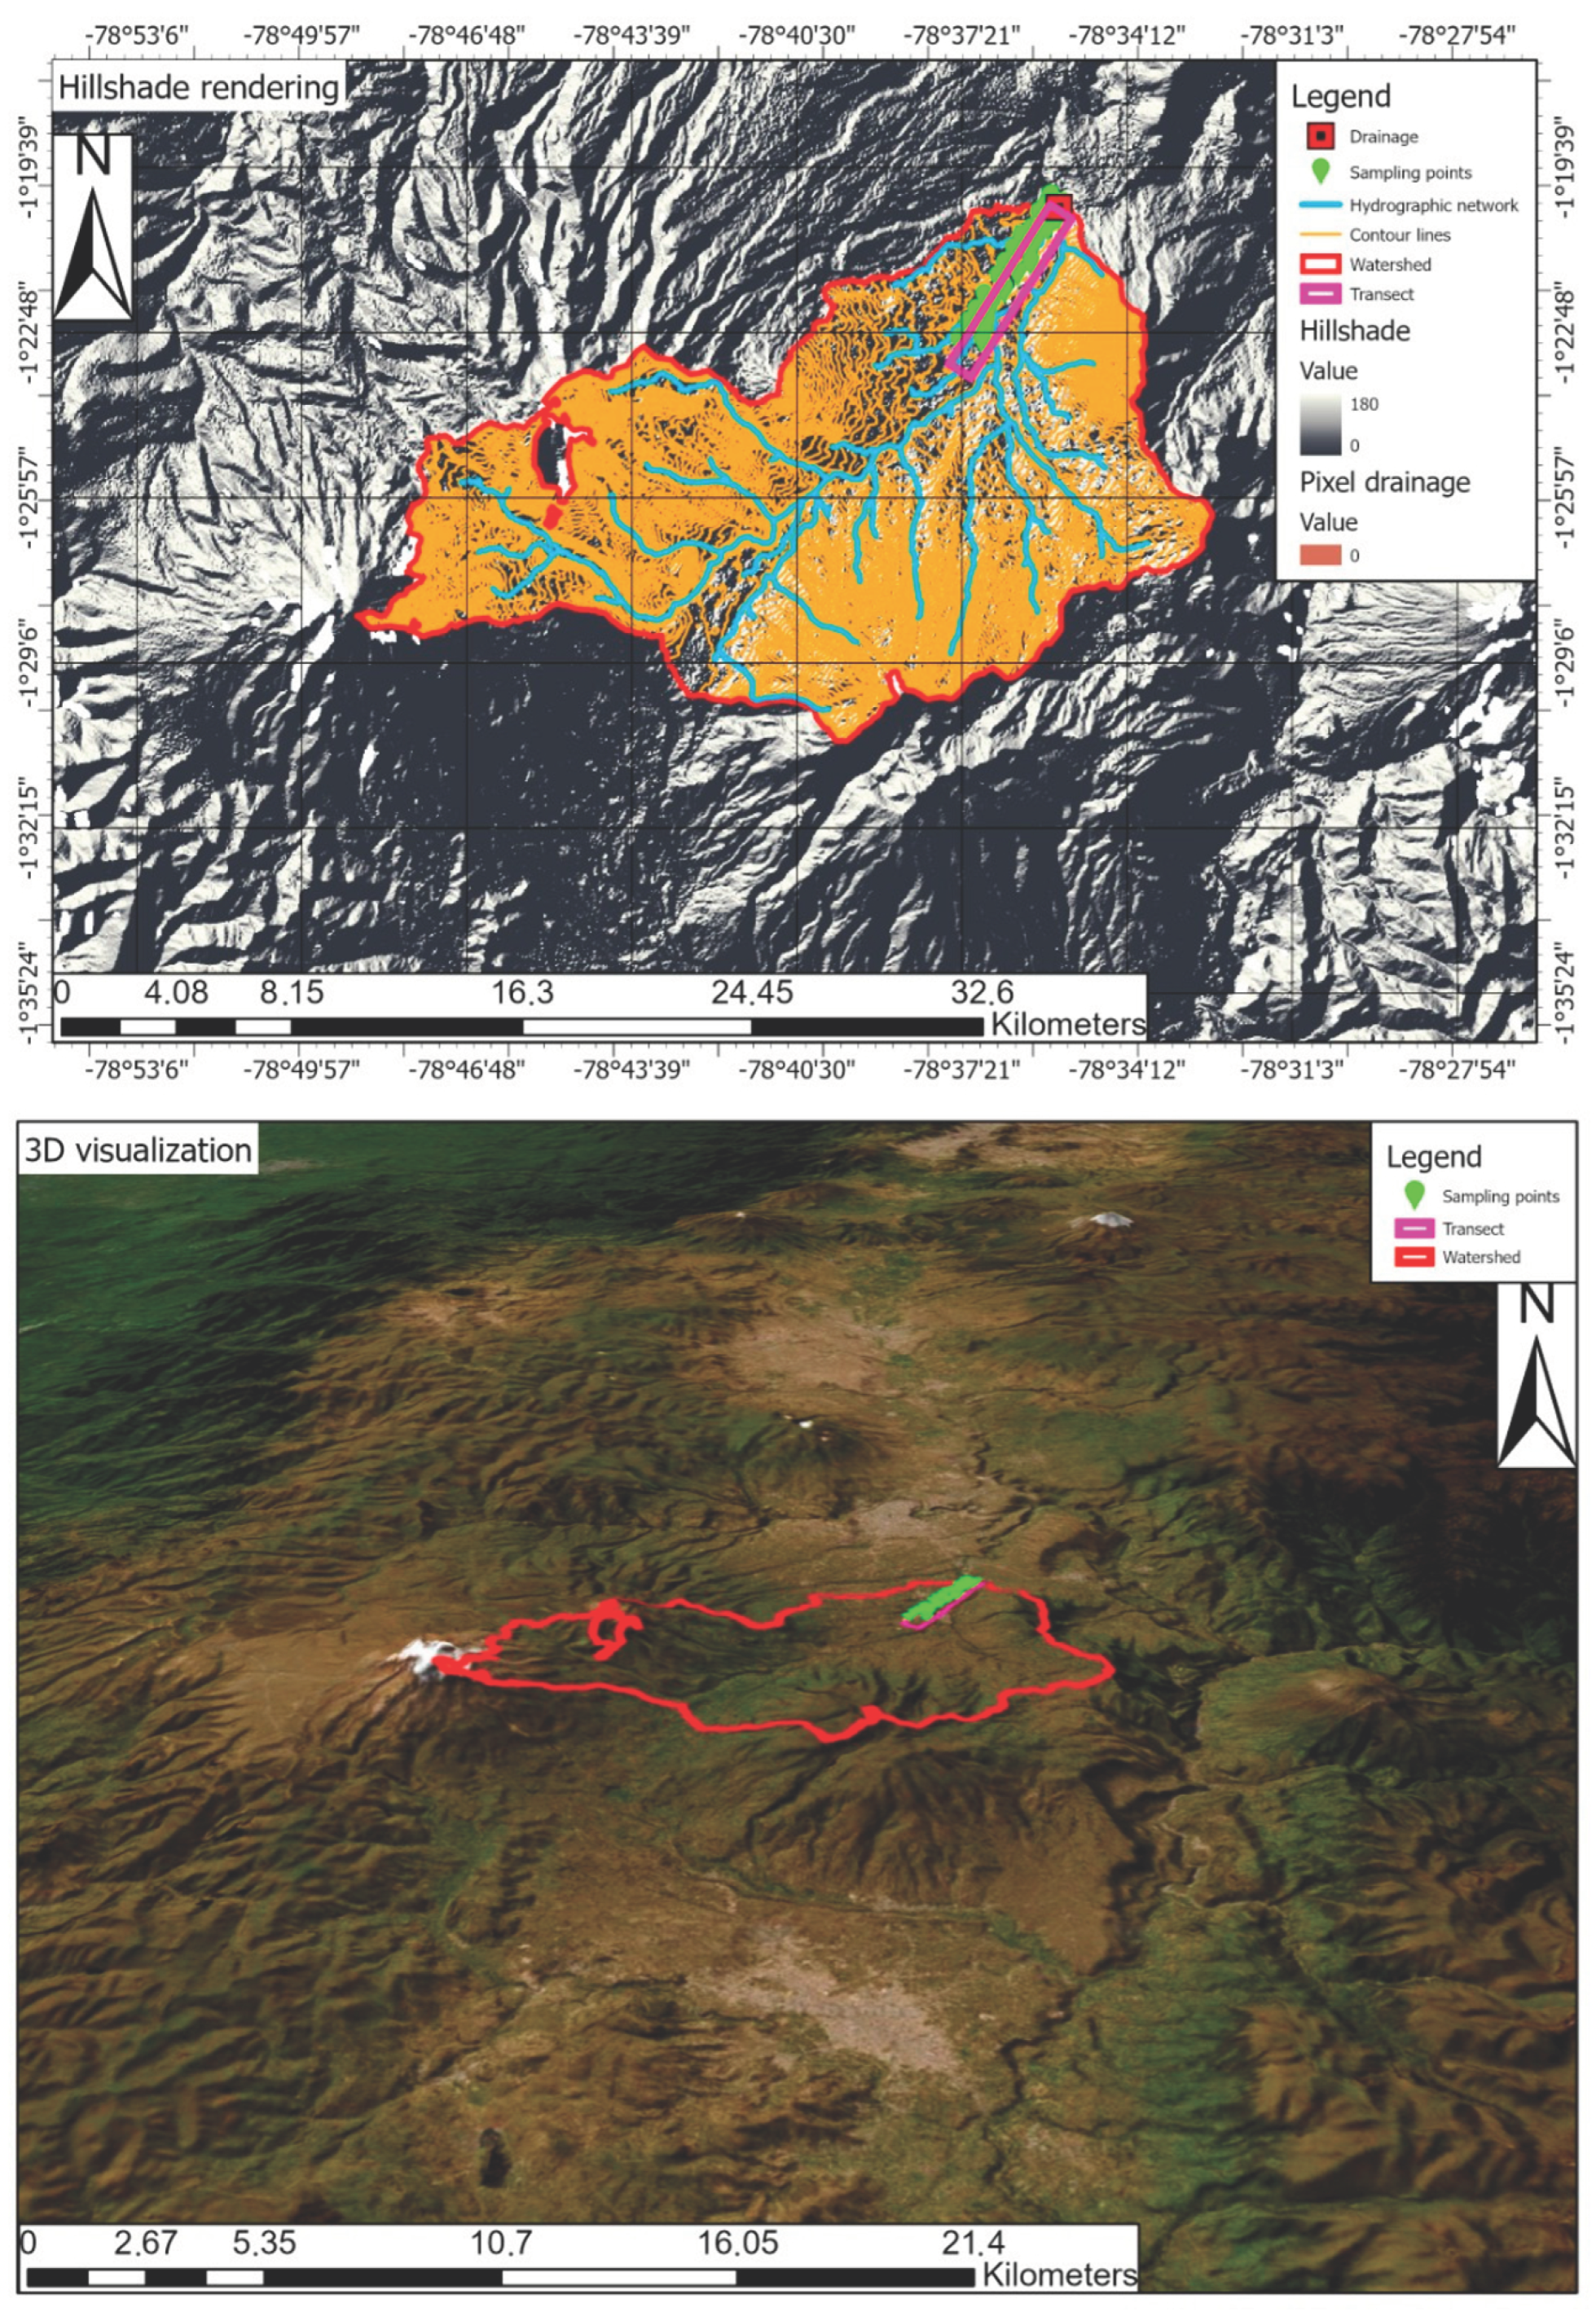
This study was conducted in the Tungurahua region, Ecuador, where the predominant soils have been shaped by volcanic eruptions and ash deposition, resulting in diverse altitudinal gradients and areas with and without vegetative cover. Vegetative cover influences the soil structure, organic matter, and other soil aspects. Comparing soil quality in areas with and without vegetative cover allows for an evaluation of how this influence affects soil’s capacity to sustain plant life and provide ecosystem services. Studying soil quality indices with and without vegetative cover in this area is essential for understanding terrestrial ecosystems’ functioning, and for managing them sustainably for the benefit of both agriculture and the environment. The topography of the area exhibits distinctive features due to the presence of mountains, which exert a significant influence on temperature, precipitation, and wind speed. This influence creates microclimates that foster a wide diversity of ecosystems [17]. The region is characterized by irregular topography, with altitudes ranging from 2700 to 3200 m above sea level, and has annual precipitation of 549.5 mm, with an average annual temperature ranging between 7.6 and 18.7 °C [18]. The period of most significant precipitation extends from February to July, while the months with lower precipitation levels are between August and January. These soils are primarily used for the cultivation of short-cycle plants, herbs, and pastures, as well as the planting of eucalyptus trees and the formation of Andean grasslands [19] (Figure 1).
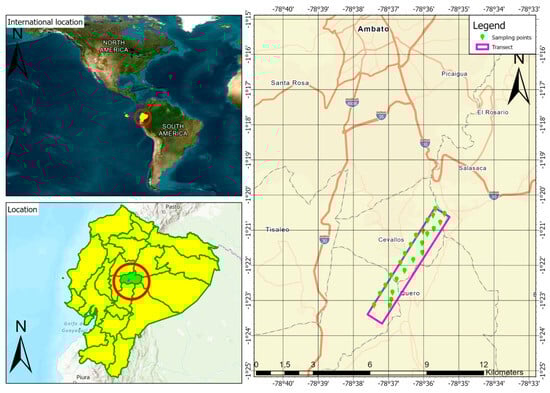
Figure 1.
Location of the study area in the Jun Jun micro-watershed in the Ecuadorian region (adapted from Google. (n.d.)). The red box details the limits of the analyzed basin.
2.2. Soil Quality Index Calculations
To analyze the soil quality index using the simple additive index (SQI) method, a set of 24 soil samples and a series of soil quality indicators were taken as parameters. The 6 parameters used to develop the SQI were earthworm density (WD), earthworm biomass (WB), organic matter (OM), hydrogen potential (pH), total nitrogen (TN), and organic carbon (OC) (Table 1).

Table 1.
Indicators for estimating the SQI in soil collected under two types of vegetation cover across three altitude categories.
The SQI was estimated following the method described by Mukherjee and Lal [20]:
where SQI is the sum of the values of the individual indices included in the estimation of the soil parameters. This SQI is useful for evaluating soil quality, despite its sensitivity to the unit values of the parameters it uses.
2.3. Normalizing Soil Indicators
The normalization (0–1) of the SQI value for each individual soil was calculated using the following equation:
where SQI-1 is the normalized value of the indicator, SQMIN is the minimum SQI value, and SQIMAX is the maximum SQI value of the total dataset. The ranges of the soil parameter values to estimate the SQIMÁX and SQIMIN were determined by assigning threshold values, primarily based on literature review and the expert opinion of the authors (Table 2).
Table 2.
Soil indicators and SQI threshold values.
The values of the indicators were normalized using a scale from 0 to 1. SQIMIN and SQIMAX represent the worst and best conditions from the point of view of quality, respectively. In agricultural and degraded soils, the maximum value of the indicator represents the ideal value to be reached or the best soil quality situation. The minimum value represents the minimum desirable or the minimum acceptable quality.
The normalized indicator value is the indicator score, whose scores represent the contribution of each indicator to soil quality. Quality scores were classified on 5 soil class scales, ranging from 0 to 1 (class 1: very high quality, class 2: high quality, class 3: moderate quality, class 4: low quality, and class 5: very low quality), according to sensitivity to soil quality.
2.4. Sensitivity Index
The sensitivity index (SI) proposed by Sheidai Karkaj et al. [32] was employed to assess the performance of the SQI method through the following equation:
where SQIMAX and SQIMIN are the maximum and minimum values of each SQI, respectively. An indicator with a higher sensitivity value is more susceptible to environmental conditions and management plans.
2.5. Sampling and Determination of Soil Quality Indicators
Samples were collected from the Quebrada Jun Jun Watershed along a transect, with the following coordinates: west longitude 78°59′16.50″; south latitude 01°34′32.31″; west longitude 78°61′83.36″ and south latitude 01°38′57.95″ (Figure 2). In the transect, representative sampling points were selected, considering the altitude and vegetation cover of the area. In terms of altitude, three zones were identified: zone 1 (<2800 masl), zone 2 (2800–2900 masl), and zone 3 (>2900 masl). Additionally, to consider the vegetation cover variable, samples were collected in areas both with and without vegetation cover in the three zones.

Figure 2.
Sampling zone of the Jun Jun stream watershed.
At each sampled point, four soil samples were collected randomly at a depth of 20 cm. Each soil sample was air-dried for two weeks without exposure to sunlight. Soil bioindicators were analyzed in each sample as follows: Soil pH was estimated using a 1:2 soil/water ratio (25 g of dry soil and 50 mL of distilled water), employing a glass electrode and a potentiometer. Organic carbon (OC) and total nitrogen (TN) available in the soil were determined using the dry combustion method [33,34]. The quantification of organic matter (OM) was carried out using the calcination or ignition method mentioned by Eyherabide et al. [33], which directly quantifies the organic matter content and is based on determining the weight loss of the soil sample when subjected to high temperatures. The soil bioindicators in this research, along with worm density (WD) and worm biomass (WB), were estimated using the procedures described by the USDA [35].
2.6. Statistical Analysis
Mean values and standard errors were calculated using descriptive statistical analysis tools in STATISTICA 13.3. The data obtained from the different sampled points were analyzed using two-way ANOVA, with a significance of p < 0.05 for the differences between the samples with vegetation cover and without vegetation cover, on the different indicators of soil quality.
3. Results and Discussion
Below are the results and data from three altitudes of the watershed, along with detailed discussions on the analyzed soil types. The average values and standard deviations of the soil indicators based on altitude, with or without vegetation cover, are listed in Table 1 and Figure 1. The analysis of variance of the data revealed significant differences in the pH, OM, and WD variables for both altitude and trials with and without vegetation cover.
3.1. Organic Carbon (OC)
The OC content is the primary indicator of biological and chemical soil quality, and it strongly influences soil’s physical quality indirectly. The OC in the soils with vegetation cover and without vegetation cover presented significant differences with the altitude variable. The results revealed that soils at altitudes below 2800 m above sea level had the highest OC content, at 1.26%; conversely, samples collected from altitudes greater than 2900 m above sea level had the lowest amount of organic carbon, at 0.58% (Figure 1). The organic carbon storage capacity in the soil of high Andean grasslands is influenced by the altitudinal gradient and soil temperature. As the altitude increases, the soil exhibits a higher capacity for organic carbon storage [36]. Additionally, soil cover (whether with vegetation or plant residues) mitigates water erosion caused by surface runoff, reduces soil compaction, increases organic carbon content, and promotes infiltration rates [37].
3.2. Total Nitrogen (TN)
Similarly, the TN in soils with vegetation cover and without vegetation cover presented significant differences with the altitude variable. The results revealed that soils at altitudes above 2900 m above sea level had the highest TN content, at 0.50%; conversely, treatments at altitudes below 2800 m above sea level had the lowest amount of organic carbon, at 0.16% (Figure 1). This demonstrates that altitude is a determining factor in the properties and processes of ecosystems in mountains [38]. Mountains serve as useful “indicators” of how climate changes can affect non-mountainous terrestrial ecosystems [39]. The nutrient status can differ among ecosystem components and nutrients along altitudinal gradients [40]. Additionally, it was observed that soils without vegetation cover had elevated levels of nitrogen due to fertilization received from legume crops previously in the soil.
3.3. pH Analysis
The pH presented significant differences in terms of the altitude and vegetation cover of the soils. It was shown that the pH decreases with increasing altitude (Figure 1). In general, the results revealed neutral soils with pH values ranging from 6.7 to 7.1. According to the literature, pH values decrease with increasing altitude [41,42]. However, other results show that soil pH values increase with increasing altitude [43]. The increase in pH in these cases may be related to the soil’s parental material. An illustrative example of this phenomenon occurs during soil formation from limestone or calcareous rocks containing high levels of calcium carbonate. Over time, these rocks can gradually dissolve due to the influence of water and chemical reactions in the soil. As a result, the dissolved calcium carbonate contributes to an increase in soil alkalinity, leading to a rise in pH in the surrounding area. In the altitudinal gradient from 871 m to 4550 m, the soil pH decreases at an altitude of 3000 m, while at altitudes higher than 3000 m the pH increases [44].
3.4. Organic Matter (OM)
OM showed no significant differences in terms of altitude and vegetation cover. However, it was evident that the organic matter content increased with altitude (Figure 1). The increase in organic matter content with altitude is associated with the decrease in temperature at altitudes above 3000 masl. For altitudes between 1500 and 2000 masl., it corresponds to increases in precipitation (Figure 1). Similarly, under conditions of extreme acidity and fungal proliferation, it can be associated with a decrease in bacterial activity and a slowdown in the mineralization process, leading to high organic matter contents in the soils [45]. Organic matter, organic carbon, total carbon, total nitrogen, and the soil C/N ratio experience an increase until reaching 3000 m in altitude; however, beyond this altitude, these values show a decrease [46].
3.5. Bioindicators
Regarding bioindicators, the results of WD and WB showed significant differences in terms of altitude and vegetation cover. In this way, the more the elevation of the basin decreases, the greater the number of worms and the grams of biomass obtained. Additionally, the best results for WB and WD were obtained in trials with vegetation cover (Figure 3). Earthworm abundance and species richness decrease with increasing altitude, showing a significant negative correlation [47]. Similarly, the richness and diversity of plant species along altitude gradients generally show a gradual and continuous pattern of species decline from lower- to higher-altitude regions. It was also evident that the only bioindicator present was earthworms (Lumbricus terrestris); other bioindicators were not present, indicating that their communities are affected by anthropogenic activities and abiotic factors in the environment [48]. Finally, biomass can be related to the nutrient availability for earthworms in covered soils, as higher vegetation and relative humidity lead to greater material production, which will then be available (rapid decomposition) for earthworm communities to grow in size [49].
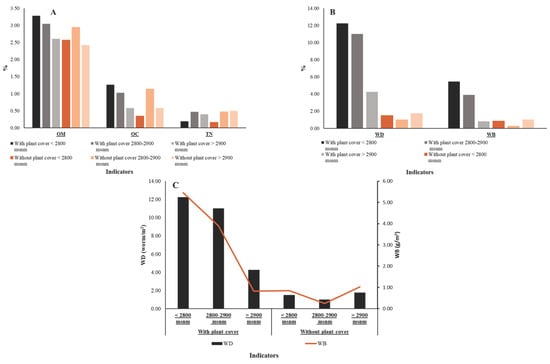
Figure 3.
Indicators to estimate the soil simple additive index (SQI) collected under two types of vegetation cover in three altitude categories: (A) Variation in organic carbon (OC), organic matter (OM), and total nitrogen (TN) with plant cover and altitude. (B) Variation in the percentage of earthworms with plant cover and altitude. (C) Variation in the number of earthworms (WD) and the amount of biomass (WB) of earthworms with vegetation cover and altitude.
3.6. Soil Quality
Within the framework of the SQI, six soil quality indicators were numerically integrated after scoring them, primarily using information from literature reviews (Table 2). However, data scoring for some biological indicators is limited in the literature, making it challenging to establish a sufficiently robust methodology [50]. In this regard, maximum and minimum values were established in different ways for each indicator. For some attributes, especially under optimal conditions, thresholds were considered based on values from reference soils, while for others theoretical criteria were applied.
A soil quality index was developed by averaging the values of all selected indicators. To facilitate its interpretation, a transformation scale that defines five classes of soil quality was applied. The creation of this scale enabled the standardization and integration of the indicators, which, in turn, made possible the quantitative evaluation of soil quality through numerical values, assigning each soil a value within the different quality categories.
Subsequently, the indicators were normalized on a scale from 0 to 1, representing the most unfavorable and optimal conditions from the perspective of soil quality, respectively, regardless of the absolute values measured for each indicator (Table 3).
Table 3.
Soil quality classes for the Jun Jun watershed.
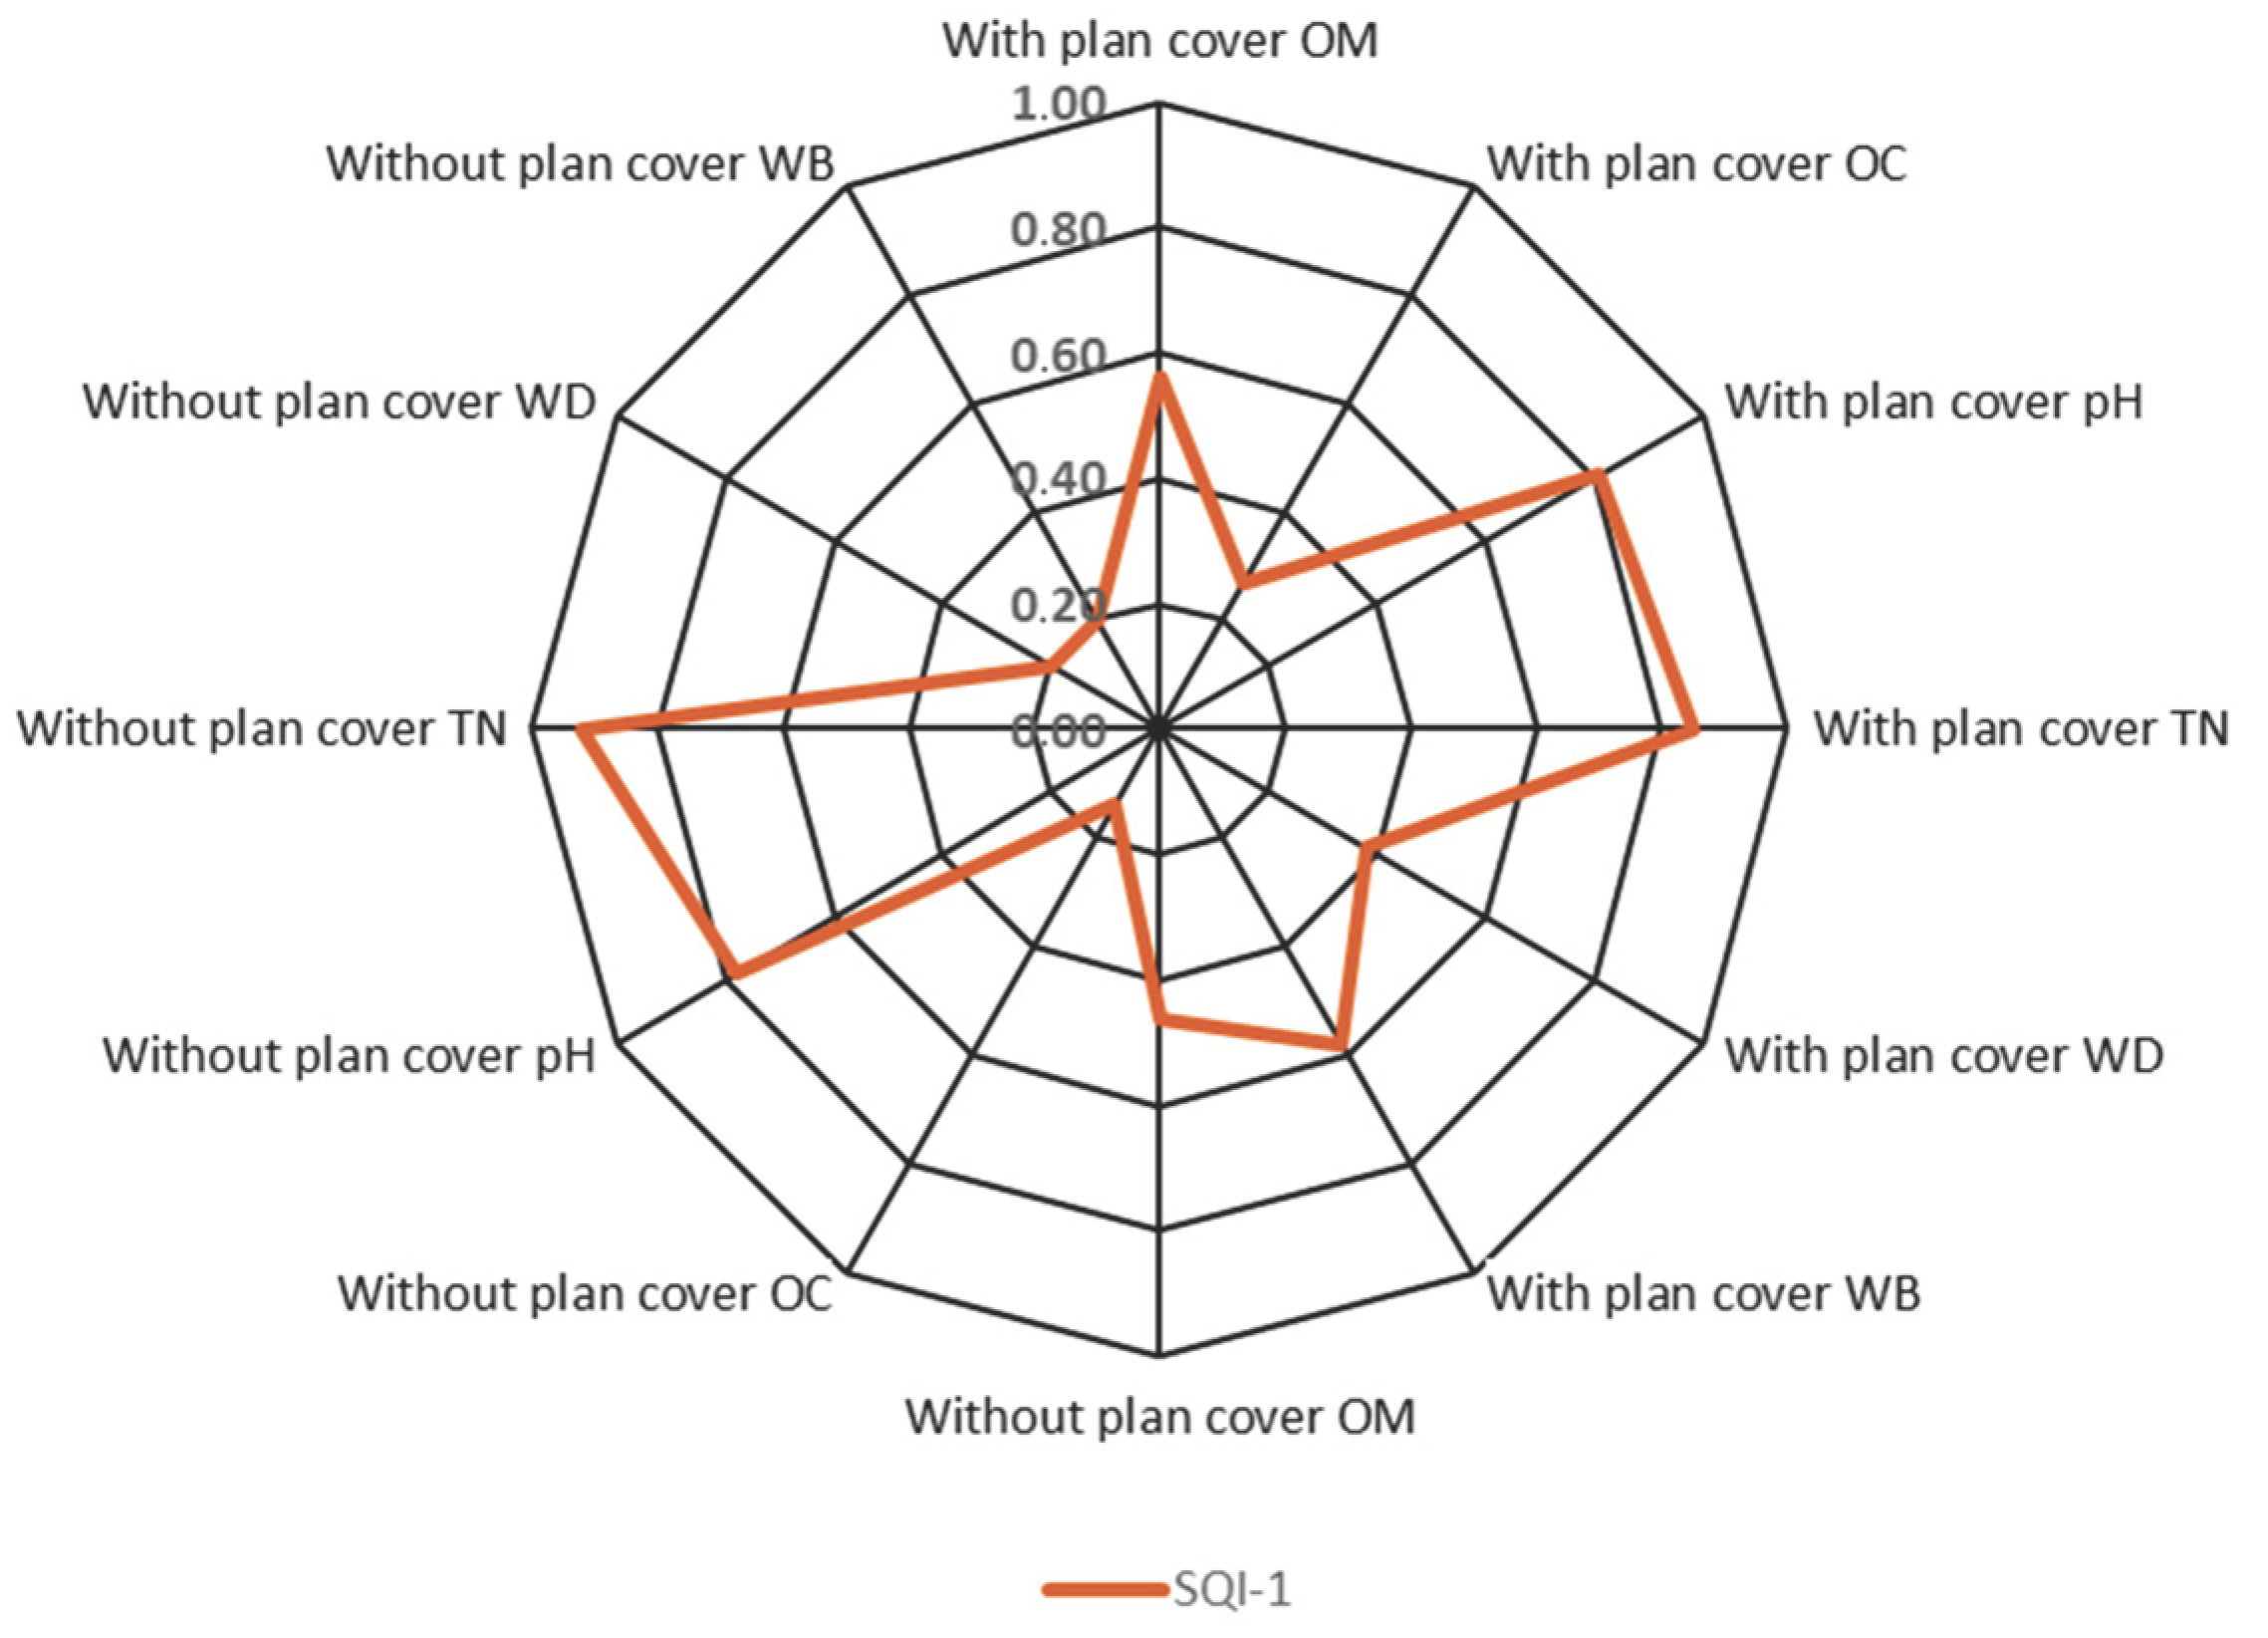
Figure 4 and Figure 5 present the normalized values of the calculated indicators, as well as the resulting soil quality index. It can be observed that soils with vegetation cover, on average, have an index of 0.58, classifying them as moderate quality (class 3). Similarly, soils in the area without vegetation cover had an average index of 0.45, also indicating moderate soil quality (class 3). Soils exhibited moderate variability in the study area, showing a heterogeneous spatial distribution. This variability can be attributed to various factors, such as diversity in land use, variations in soil depth, specific terrain characteristics, and topography, among others [51].
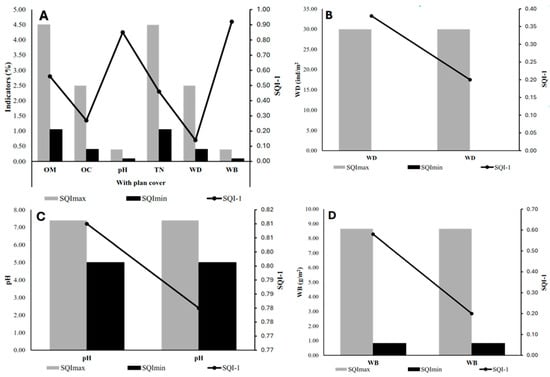
Figure 4.
Indicators for estimating the soil quality index (SQI) collected under two types of vegetation cover across three altitude categories: (A) Soil quality index of organic carbon (OC), organic matter (OM), and total nitrogen (TN) with vegetation cover and altitude. (B) Soil quality index of the number of earthworms (WD) with vegetation cover and altitude. (C) Soil quality index of pH with cover vegetation and altitude. (D) Soil quality index of earthworm biomass (WB) with vegetation cover and altitude.
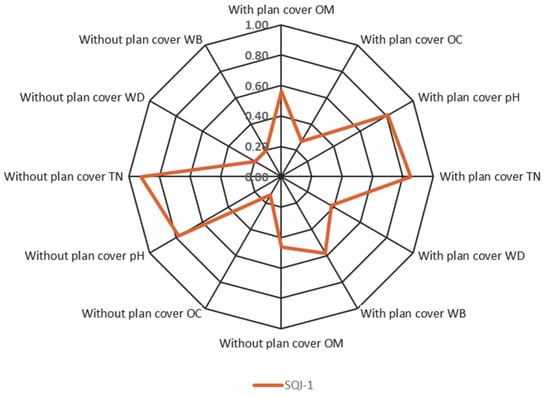
Figure 5.
Soil quality classes in the Jun Jun watershed under the influence of various chemical and biological parameters.
The determination of the soil quality index is influenced by the values obtained for each of the indicators. In this sense, some indicators had higher values than the threshold values in the literature, causing the value of the total index to rise. Thus, the indicator with the lowest value was organic carbon (OC), while the highest corresponded to total nitrogen (TN). The significant reduction in organic carbon in the area could be attributed to practices such as excessive grazing, deforestation, intensive tillage, and the use of burns in agricultural fields [52].
The pH indicator had a quality value close to 7; however, in soils without vegetation cover, a decrease in pH was observed compared to reference soils. This trend has been previously recorded by other researchers [53] and can be attributed to the loss of organic matter, the removal of minerals during crop harvesting, erosion of the surface layer, and the effects of nitrogen and sulfur fertilizers. Despite this, most measured values were still considerably far from the toxicity point established for most crops in the region. The pH indicator value approached the maximum quality, thus significantly reflecting the local soil conditions.
To determine the number of earthworms, density (worm/m2) was used, using the maximum number of earthworms found in the study soil as the maximum value, while the minimum value was set at zero. Other bioindicators, such as ants, arachnids, and centipedes, were not considered in the quality assessment due to their total absence at the sampling points. Earthworms, as bioindicators belonging to the macrofauna group, are closely linked to soil quality. Their presence promotes significant benefits to the soil structure and positively impacts subsequent crops. However, the watershed soil has experienced varying intensities of use, and these organisms show a noticeable sensitivity to changes in their environment, resulting in alterations in their communities. Therefore, the absence of these earthworms clearly indicates a decrease in soil quality [54]. The abundance of earthworms and the species richness decreased monotonically with increasing altitude. The distribution pattern of earthworms can be explained by the fact that, with increasing altitude, habitat conditions become less favorable, establishing a wide range of environmental barriers and leading to a limitation of taxon spread [55].
Soils with vegetation cover have an average quality index of 0.58, while soils without vegetation cover have a quality index of 0.45 (Figure 5). These results show that vegetation and soil have a direct and close relationship, as soil and vegetation mutually influence one another over time [56]. Vegetation contributes to nutrient retention, improves soil structure, and promotes microbial activity—key factors for soil quality [57]. In this sense, vegetation improves soil structure and water retention, promotes microbial activity, and prevents erosion. Plant roots can contribute to the formation of soil aggregates, improving porosity and nutrient retention capacity [58]. The drastic decrease in the soil quality index in areas without vegetation cover could be due to the loss of these associated benefits of vegetation. The absence of plants can lead to soil compaction, loss of organic matter, and a decrease in microbial biodiversity, negatively affecting the soil’s ability to sustain plant life [59]. These findings support the importance of conservation and restoration of vegetation cover as key strategies to improve and maintain soil quality. Additionally, they may have significant implications for land-use management, sustainable agriculture, and mitigating soil degradation. It is crucial to consider these results when designing policies and soil management practices to ensure the long-term health of terrestrial ecosystems.
4. Conclusions
Understanding and characterizing soil quality are fundamental aspects of sustainable soil management. In the study area, the soils exhibited quality indices that varied between 45 and 58 for soils with and without vegetation cover, respectively, indicating that the soils studied have a moderate-to-high quality throughout the basin. The influence of the altitudinal gradient was evident, revealing a significant relationship between altitude and soil quality. The soil quality index values showed a tendency to decrease with increasing altitudinal gradient, suggesting that soil quality tends to deteriorate at higher altitudes. The presence of vegetation cover emerged as a positive factor, as soils with this cover exhibited higher soil quality index values compared to soils without vegetation cover. The spatial distribution of soil quality is heterogeneous in the study area, influenced by factors such as land use, topography, and soil depth. The decrease in organic carbon, especially in soils without vegetation cover, indicated possible degrading practices such as excessive grazing, deforestation, and intensive tillage. In summary, this study highlights the importance of assessing soil quality considering multiple factors, such as altitudinal gradients and the presence of vegetation cover. These findings offer key insights into soil dynamics in the Jun Jun watershed. Furthermore, they underscore the urgent need to adopt sustainable management practices to preserve and improve the soil quality in this region, thereby contributing to the long-term sustainability of local agroecosystems.
Author Contributions
Conceptualization, O.M.Q., W.Y.Y. and J.A.C.; methodology, O.M.Q., W.Y.Y. and J.A.C.; validation, O.M.Q. and W.Y.Y.; formal analysis, O.M.Q., W.Y.Y. and J.A.C.; investigation, O.M.Q. and J.A.C.; resources, O.M.Q., W.Y.Y. and J.A.C.; data curation, O.M.Q., W.Y.Y. and J.A.C.; writing—original draft preparation, O.M.Q., writing—review and editing, O.M.Q., W.Y.Y. and J.A.C.; visualization, O.M.Q.; supervision, O.M.Q. and J.A.C.; project administration, O.M.Q. and J.A.C. All authors have read and agreed to the published version of the manuscript.
Funding
This research received no external funding.
Data Availability Statement
The data presented in this study are available on request from the corresponding author. The data are not publicly available due to privacy.
Acknowledgments
This article was published with the support of the Carchi State Polytechnic University of Ecuador.
Conflicts of Interest
The authors declare no conflicts of interest.
References
- Zhang, Y.; Wang, L.; Jiang, J.; Zhang, J.; Zhang, Z.; Zhang, M. Application of Soil Quality Index to Determine the Effects of Different Vegetation Types on Soil Quality in the Yellow River Delta Wetland. Ecol. Indic. 2022, 141, 109116. [Google Scholar] [CrossRef]
- Bagnall, D.K.; Shanahan, J.F.; Flanders, A.; Morgan, C.L.S.; Honeycutt, C.W. Soil Health Considerations for Global Food Security. Agron. J. 2021, 113, 4581–4589. [Google Scholar] [CrossRef]
- Li, Y.; You, S. Chapter 8-Biochar Soil Application: Soil Improvement and Pollution Remediation. In Biochar in Agriculture for Achieving Sustainable Development Goals; Tsang, D.C.W., Ok, Y.S., Eds.; Academic Press: Cambridge, MA, USA, 2022; pp. 97–102. ISBN 978-0-323-85343-9. [Google Scholar]
- Stocking, M.A. Tropical Soils and Food Security: The next 50 Years. Science 2003, 302, 1356–1359. [Google Scholar] [CrossRef]
- Ozsahin, E.; Eroglu, I.; Pektezel, H. Soil Quality Index (SQI) ANALYSIS of Tekirdag Province Using GIS (Thrace, Turkey). Fresen. Environ. Bull. 2017, 26, 3005–3014. [Google Scholar]
- Fazekašová, D. Evaluation of Soil Quality Parameters Development in Terms of Sustainable Land Use. In Sustainable Development; Curkovic, S., Ed.; IntechOpen: Rijeka, Croatia, 2012; p. Ch. 19. [Google Scholar]
- AbdelRahman, M.A.E.; Shalaby, A.; Mohamed, E.S. Comparison of Two Soil Quality Indices Using Two Methods Based on Geographic Information System. Egypt. J. Remote Sens. Space Sci. 2019, 22, 127–136. [Google Scholar] [CrossRef]
- Bonilla-Bedoya, S.; Valencia, K.; Herrera, M.Á.; López-Ulloa, M.; Donoso, D.A.; Macedo Pezzopane, J.E. Mapping 50 Years of Contribution to the Development of Soil Quality Biological Indicators. Ecol. Indic. 2023, 148, 110091. [Google Scholar] [CrossRef]
- Armenise, E.; Redmile-Gordon, M.A.; Stellacci, A.M.; Ciccarese, A.; Rubino, P. Developing a Soil Quality Index to Compare Soil Fitness for Agricultural Use under Different Managements in the Mediterranean Environment. Soil Tillage Res. 2013, 130, 91–98. [Google Scholar] [CrossRef]
- Maaz, T.M.; Heck, R.H.; Glazer, C.T.; Loo, M.K.; Zayas, J.R.; Krenz, A.; Beckstrom, T.; Crow, S.E.; Deenik, J.L. Measuring the Immeasurable: A Structural Equation Modeling Approach to Assessing Soil Health. Sci. Total Environ. 2023, 870, 161900. [Google Scholar] [CrossRef] [PubMed]
- Bahena-Osorio, Y.; Franco-Hernández, M.O.; Pueyo, J.J.; Vásquez-Murrieta, M.S. Development of a Quality Index to Evaluate the Impact of Abiotic Stress in Saline Soils in the Geothermal Zone of Los Negritos, Michoacán, Mexico. Agronomy 2023, 13, 1650. [Google Scholar] [CrossRef]
- Zuber, S.M.; Veum, K.S.; Myers, R.L.; Kitchen, N.R.; Anderson, S.H. Role of Inherent Soil Characteristics in Assessing Soil Health across Missouri. Agric. Environ. Lett. 2020, 5, e20021. [Google Scholar] [CrossRef]
- Prior, T.; Hagmann, J. Measuring Resilience: Methodological and Political Challenges of a Trend Security Concept. J. Risk Res. 2014, 17, 281–298. [Google Scholar] [CrossRef]
- Hubanks, H.L.; Deenik, J.L.; Crow, S.E. Getting the Dirt on Soil Health and Management. In Reference Module in Earth Systems and Environmental Sciences; Elsevier: Amsterdam, The Netherlands, 2018; ISBN 978-0-12-409548-9. [Google Scholar]
- Magalhães, W.d.A.; Amorim, R.S.S.; Hunter, M.O.; Bocuti, E.D.; Di Loreto Di Raimo, L.A.; da Silva, W.M.; Hoshide, A.K.; de Abreu, D.C. Using the GeoWEPP Model to Predict Water Erosion in Micro-Watersheds in the Brazilian Cerrado. Sustainability 2023, 15, 4711. [Google Scholar] [CrossRef]
- Isong, I.A.; John, K.; Okon, P.B.; Ogban, P.I.; Afu, S.M. Soil Quality Estimation Using Environmental Covariates and Predictive Models: An Example from Tropical Soils of Nigeria. Ecol. Process. 2022, 11, 66. [Google Scholar] [CrossRef]
- Zehetner, F.; Miller, W.P. Erodibility and Runoff-Infiltration Characteristics of Volcanic Ash Soils along an Altitudinal Climosequence in the Ecuadorian Andes. Catena 2006, 65, 201–213. [Google Scholar] [CrossRef]
- Villacís, M.; Vimeux, F.; Taupin, J.D. Analysis of the Climate Controls on the Isotopic Composition of Precipitation (δ18O) at Nuevo Rocafuerte, 74.5°W, 0.9°S, 250 m, Ecuador. Comptes Rendus Geosci. 2008, 340, 1–9. [Google Scholar] [CrossRef]
- Buytaert, W.; Deckers, J.; Wyseure, G. Regional Variability of Volcanic Ash Soils in South Ecuador: The Relation with Parent Material, Climate and Land Use. Catena 2007, 70, 143–154. [Google Scholar] [CrossRef]
- Mukherjee, A.; Lal, R. Comparison of Soil Quality Index Using Three Methods. PLoS ONE 2014, 9, 0105981. [Google Scholar] [CrossRef] [PubMed]
- Estrada-Herrera, I.R.; Hidalgo-Moreno, C.; Guzmán-Plazola, R.; Almaraz Suárez, J.J.; Navarro-Garza, H.; Etchevers-Barra, J.D. Indicadores de Calidad de Suelo Para Evaluar Su Fertilidad. Agrociencia 2017, 51, 813–831. [Google Scholar]
- Desta, K.G. Soil Quality Monitoring: A Practical Guide; Oklahoma Cooperative Extension Service: Norman, OK, USA, 2010. [Google Scholar]
- Akram, Z.; Hussain, S.; Mansoor, M.; Afzal, M.; Waqar, A.; Shabbir, I. Soil Fertility and Salinity Status of Muzaffargarh District, Punjab Pakistan. Univers. J. Agric. Res. 2014, 2, 242–249. [Google Scholar] [CrossRef]
- Amacher, M.C.; O’Neil, K.P.; Perry, C.H. Soil Vital Signs: A New Soil Quality Index (SQI) for Assessing Forest Soil Health; U.S. Department of Agriculture, Forest Service, Rocky Mountain Research Station: Fort Collins, CO, USA, 2007. [Google Scholar]
- Cantú, M.P.; Becker, A.; Bedano, J.C.; Schiavo, H.F. Evaluación de La Calidad de Suelos Mediante El Uso de Indicadores e Índices. Cienc. Del Suelo 2007, 25, 173–178. [Google Scholar]
- Prieto Méndez, J.; Prieto-Garcia, F.; Acevedo, O.; Méndez-Marzo, M. Indicadores e Índices de Calidad de Los Suelos (ICS) Cebaderos Del Sur Del Estado de Hidalgo, México. Agron. Mesoam. 2013, 24, 83–91. [Google Scholar] [CrossRef]
- Cantú, M.; Becker, A.R.; Bedano, J.; Schiavo, H.F.; Parra, B. Evaluation of the Impact of Land Use and Management Change by Means of Soil Quality Indicators, Córdoba, Argentina. Cad. Lab. Xeol. Laxe. Coruna 2009, 34, 203–214. [Google Scholar]
- Feiza, V.; Feiziene, D.; Kadziene, G.; Lazauskas, S.; Deveikyte, I.; Slepetiene, A.; Seibutis, V. Soil State in the 11th Year of Three Tillage Systems Application on a Cambisol. J. Food Agric. Environ. 2011, 9, 1088–1095. [Google Scholar]
- Anup, K.C.; Bhandari, G.; Wagle, S.P.; Banjade, Y. Status of Soil Fertility in a Community Forest of Nepal. Int. J. Environ. 2013, 1, 56–67. [Google Scholar] [CrossRef]
- Demetrio, W.C.; Dionísio, J.A.; Maceda, A. Negative Effects of Earthworms on Soil Nematodes Are Dependent on Earthworm Density, Ecological Category and Experimental Conditions. Pedobiologia 2019, 76, 150568. [Google Scholar] [CrossRef]
- Morel, A.; Acosta, O.O. Calidad Del Suelo En Diferentes Usos y Manejo Por Medio de La Macrofauna Como Indicador Biológico. Braz. J. Anim. Environ. Res. 2022, 5, 996–1006. [Google Scholar] [CrossRef]
- Sheidai Karkaj, E.; Sepehry, A.; Barani, H.; Motamedi, J.; Shahbazi, F. Establishing a Suitable Soil Quality Index for Semi-Arid Rangeland Ecosystems in Northwest of Iran. J. Soil Sci. Plant Nutr. 2019, 19, 648–658. [Google Scholar] [CrossRef]
- Eyherabide, M.; Saínz Rozas, H.; Barbieri, P.; Echeverría, H.E. Ciencia del Suelo; Asociación Argentina de la Ciencia del Suelo: Buenos Aires, Argentina, 2014; Volume 32. [Google Scholar]
- Bellomonte, G.; Costantini, A.; Giammarioli, S. Comparison of Modified Automatic Dumas Method and the Traditional Kjeldahl Method for Nitrogen Determination in Infant Food. J. Assoc. Off. Anal. Chem. 1987, 70, 227–229. [Google Scholar] [CrossRef] [PubMed]
- USDA. Soil Quality Test Kit Guide; Soil Quality Institute, National Resources Conservation Service, United States Department of Agriculture: Washington, DC, USA, 1999. [Google Scholar]
- Beltrán-Dávalos, A.A.; Ayala Izurieta, J.E.; Echeverria Guadalupe, M.M.; Van Wittenberghe, S.; Delegido, J.; Otero Pérez, X.L.; Merino, A. Evaluation of Soil Organic Carbon Storage of Atillo in the Ecuadorian Andean Wetlands. Soil Syst. 2022, 6, 92. [Google Scholar] [CrossRef]
- Pedroza-Parga, E.; Velásquez-Valle, M.A.; Pedroza-Sandoval, A.; Sánchez-Cohen, I.; Yáñez-Chávez, L.G. The Impact of Vegetation Cover on Soil Erosion and Soil Deposition Due to Runoff. Ing. Agrícola Y Biosist. 2022, 144, 17–31. [Google Scholar] [CrossRef]
- He, X.; Hou, E.; Liu, Y.; Wen, D. Altitudinal Patterns and Controls of Plant and Soil Nutrient Concentrations and Stoichiometry in Subtropical China. Sci. Rep. 2016, 6, 24261. [Google Scholar] [CrossRef] [PubMed]
- Beniston, M. Climatic Change in Mountain Regions: A Review of Possible Impacts. In Climate Variability and Change in High Elevation Regions: Past, Present & Future; Diaz, H.F., Ed.; Springer: Dordrecht, The Netherlands, 2003; pp. 5–31. ISBN 978-94-015-1252-7. [Google Scholar]
- Sundqvist, M.K.; Sanders, N.J.; Wardle, D.A. Community and Ecosystem Responses to Elevational Gradients: Processes, Mechanisms, and Insights for Global Change. Annu. Rev. Ecol. Evol. Syst. 2013, 44, 261–280. [Google Scholar] [CrossRef]
- Oliveras, I.; Bentley, L.; Fyllas, N.M.; Gvozdevaite, A.; Shenkin, A.F.; Peprah, T.; Morandi, P.; Peixoto, K.S.; Boakye, M.; Adu-Bredu, S.; et al. The Influence of Taxonomy and Environment on Leaf Trait Variation Along Tropical Abiotic Gradients. Front. For. Glob. Change 2020, 3, 18. [Google Scholar] [CrossRef]
- Llambí, L.D.; Durbecq, A.; Cáceres-Mago, K.; Cáceres, A.; Ramírez, L.; Torres, E.; Méndez, Z. Interactions between Nurse-Plants and an Exotic Invader along a Tropical Alpine Elevation Gradient: Growth-Form Matters. Alp. Bot. 2020, 130, 59–73. [Google Scholar] [CrossRef]
- Li, L.; Vogel, J.; He, Z.; Zou, X.; Ruan, H.; Huang, W.; Wang, J.; Bianchi, T.S. Association of Soil Aggregation with the Distribution and Quality of Organic Carbon in Soil along an Elevation Gradient on Wuyi Mountain in China. PLoS ONE 2016, 11, e0150898. [Google Scholar] [CrossRef]
- Peters, M.K.; Hemp, A.; Appelhans, T.; Becker, J.N.; Behler, C.; Classen, A.; Detsch, F.; Ensslin, A.; Ferger, S.W.; Frederiksen, S.B.; et al. Climate–Land-Use Interactions Shape Tropical Mountain Biodiversity and Ecosystem Functions. Nature 2019, 568, 88–92. [Google Scholar] [CrossRef] [PubMed]
- Hou, Y.; He, K.; Chen, Y.; Zhao, J.; Hu, H.; Zhu, B. Changes of Soil Organic Matter Stability along Altitudinal Gradients in Tibetan Alpine Grassland. Plant Soil 2021, 458, 21–40. [Google Scholar] [CrossRef]
- Zhang, Y.; Ai, J.; Sun, Q.; Li, Z.; Hou, L.; Song, L.; Tang, G.; Li, L.; Shao, G. Soil Organic Carbon and Total Nitrogen Stocks as Affected by Vegetation Types and Altitude across the Mountainous Regions in the Yunnan Province, South-Western China. Catena 2021, 196, 104872. [Google Scholar] [CrossRef]
- Zool, T.; Popovic, F.; Stojanovic, M.; Radosavljević, S.; Trakić, T.; Sekulić, J. Turkish Journal of Zoology Earthworm Community Structure along Altitudinal Gradients on the Western Slopes of Kopaonik Mountain in Serbia. Turk. J. Zool. 2022, 46, 103–114. [Google Scholar] [CrossRef]
- Zhu, X.; Hu, Y.; Wang, W.; Wu, D. Earthworms Promote the Accumulation of Maize Root-Derived Carbon in a Black Soil of Northeast China, Especially in Soil from Long-Term No-Till. Geoderma 2019, 340, 124–132. [Google Scholar] [CrossRef]
- Al-Maliki, S.; Al-Taey, D.K.A.; Al-Mammori, H.Z. Earthworms and Eco-Consequences: Considerations to Soil Biological Indicators and Plant Function: A Review. Acta Ecol. Sin. 2021, 41, 512–523. [Google Scholar] [CrossRef]
- Puig-Girones, R.; Real, J. A Comprehensive but Practical Methodology for Selecting Biological Indicators for Long-Term Monitoring. PLoS ONE 2022, 17, e0265246. [Google Scholar] [CrossRef] [PubMed]
- Fang, X.; Xue, Z.; Li, B.; An, S. Soil Organic Carbon Distribution in Relation to Land Use and Its Storage in a Small Watershed of the Loess Plateau, China. Catena 2012, 88, 6–13. [Google Scholar] [CrossRef]
- Gangopadhyay, S.K.; Bhattacharyya, T.; Mishra, T.K.; Banerjee, S.K. Chapter 7-Organic Carbon Stock in the Forest Soils of Himalayas and Other Areas in India. In Forest Resources Resilience and Conflicts; Kumar Shit, P., Pourghasemi, H.R., Adhikary, P.P., Bhunia, G.S., Sati, V.P., Eds.; Elsevier: Amsterdam, The Netherlands, 2021; pp. 93–116. ISBN 978-0-12-822931-6. [Google Scholar]
- Barrow, N.J.; Hartemink, A.E. The effects of pH on nutrient availability depend on both soils and plants. Plant Soil 2023, 487, 21–37. [Google Scholar] [CrossRef]
- Sofo, A.; Mininni, A.N.; Ricciuti, P. Soil Macrofauna: A Key Factor for Increasing Soil Fertility and Promoting Sustainable Soil Use in Fruit Orchard Agrosystems. Agronomy 2020, 10, 456. [Google Scholar] [CrossRef]
- Singh, J.; Schädler, M.; Demetrio, W.; Brown, G.G.; Eisenhauer, N. Climate Change Effects on Earthworms—A Review. Soil Org. 2019, 91, 114–138. [Google Scholar] [CrossRef]
- Xiang, T.; Qiang, F.; Liu, G.; Liu, C.; Liu, Y.; Ai, N.; Ma, H. Soil Quality Evaluation of Typical Vegetation and Their Response to Precipitation in Loess Hilly and Gully Areas. Forests 2023, 14, 1909. [Google Scholar] [CrossRef]
- Koudahe, K.; Allen, S.C.; Djaman, K. Critical Review of the Impact of Cover Crops on Soil Properties. Int. Soil Water Conserv. Res. 2022, 10, 343–354. [Google Scholar] [CrossRef]
- Sekaran, U.; Sagar, K.L.; Kumar, S. Soil Aggregates, Aggregate-Associated Carbon and Nitrogen, and Water Retention as Influenced by Short and Long-Term No-till Systems. Soil Tillage Res. 2021, 208, 104885. [Google Scholar] [CrossRef]
- Rahman, N.S.N.A.; Hamid, N.W.A.; Nadarajah, K. Effects of Abiotic Stress on Soil Microbiome. Int. J. Mol. Sci. 2021, 22, 9036. [Google Scholar] [CrossRef]


Disclaimer/Publisher’s Note: The statements, opinions and data contained in all publications are solely those of the individual author(s) and contributor(s) and not of MDPI and/or the editor(s). MDPI and/or the editor(s) disclaim responsibility for any injury to people or property resulting from any ideas, methods, instructions or products referred to in the content. |
© 2024 by the authors. Licensee MDPI, Basel, Switzerland. This article is an open access article distributed under the terms and conditions of the Creative Commons Attribution (CC BY) license (https://creativecommons.org/licenses/by/4.0/).