Article

Natural Variation in Chromium Accumulation and the Development of Related EST-SSR Molecular Markers in Miscanthus sinensis

1
College of Grassland Science and Technology, Sichuan Agricultural University, Chengdu 611130, China
2
School of Agriculture and Environment, Massey University, Palmerston North 4442, New Zealand
*
Authors to whom correspondence should be addressed.
These authors contributed equally to this work.
Agronomy 2024, 14(7), 1458; https://doi.org/10.3390/agronomy14071458
Submission received: 23 May 2024 / Revised: 24 June 2024 / Accepted: 1 July 2024 / Published: 5 July 2024

Abstract

:
Soil pollution by heavy metals is a serious environmental concern globally. Hexavalent (VI) chromium (Cr) is one of the main pollutants causing groundwater and soil heavy metal pollution. Miscanthus sinensis is a C4 perennial grass species with a high level of heavy metal tolerance. This species can effectively remove Cr from soils and maintain desirable biomass production under Cr stress. This research aimed to characterize and compare Cr accumulation in 58 genotypes of M. sinensis and to develop Expressed Sequence Tag–Simple Sequence Repeat (EST-SSR) markers associated with Cr tolerance. The results show that the pattern of translocation of Cr in plants differed among the 58 M. sinensis genotypes following treatment of 200 mg/L of Cr6+; however, in most genotypes, the Cr was primarily accumulated in roots. A total of 43,367 EST-SSRs were identified, and 88 EST-SSR primer pairs corresponding to candidate genes involved in Cr accumulation in M. sinensis were selected for validation. Subsequently, 170 polymorphic loci generated from 24 validated EST-SSRs were used for the population structure and marker–trait association analysis. Based on a general linear model (GLM), a total of 46 associations were identified (p < 0.05), with 14 EST-SSRs markers associated with target traits. Among them, four genes related to ABC transporters, wall-associated receptor kinases, as well as two high-affinity sulfate transporters (ST), were identified under Cr stress (p < 0.05). The results of this study help to accelerate the screening across M. sinensis genotypes for desirable traits under Cr stress and provide a platform for M. sinensis genetic improvement and molecular-marker-assisted breeding.

1. Introduction

Heavy metal contamination of the soil has become a big problem because it always results in crop yield declines and has the potential to harm human health [1,2]. Chromium (Cr) is a naturally abundant element in the earth’s crust that exists in multiple oxidation states [3]. Hexavalent (VI) is the most frequent and stable form of Cr, which is 100 times more hazardous than other forms [4]. Cr (VI) is usually associated with oxygen in the form of two oxyanions, namely chromate (CrO42−) or dichromate (Cr2O72−), which are highly mobile in soil [5]. Cr (VI) can be absorbed by roots, but the distribution and translocation of Cr (VI) within plants depend upon the plant species [6], which can lead to detrimental impacts on plant growth [7]. In plants, Cr can damage the cell membrane and internal organelles, negatively affect enzyme activity, and alter gene expression patterns [8]. For instance, Goupil et al. [9] revealed that HSP (heat-shock proteins), MTs (Metallothioneins), and GR (glutathione reductase) isoforms were upregulated in tomato (Lycopersicon esculentum) when subjected to Cr stress. Bah et al. [10] also recorded a significant induction in the expression of adenosine 5′-triphosphate (ATP) synthase, ribulose-1,5-bisphosphate carboxylase/oxygenase (Rubisco) small subunit, and coproporphyrinogen III oxidase in Typha angustifolia subjected to Cr.
Miscanthus sinensis is a rhizomatous C4 perennial grass species widely used as a cellulose source for paper production, an ornamental plant, and a forage and bioenergy crop [11,12,13]. Compared with other C4 grasses like Zea mays and Saccharum officinarum, M. sinensis can produce higher biomass, owing to its relatively highly efficient photosynthesis rate [14]. This grass species also has a greater impact on increasing the soil carbon content [14]. Miscanthus sinensis is commonly planted in marginal lands with limited water supply [15] and can grow as a dominant species in heavy-metal-contaminated mining areas [16]. Previous studies showed that M. sinensis could effectively absorb Cr from soils while maintaining desirable biomass production [17]. Transcriptomic analyses indicated that Cr tolerance of M. sinensis is attributed to the overexpression of genes associated with heavy metal transports, metal ion chelation, photosynthesis, glutathione metabolism, and ABC transporters [13].
Generally, different species and genotypes exhibit varying physiological or photosynthetic responses to Cr stress. Thus, it is necessary to develop efficient tools to identify traits associated with Cr tolerance when screening a wide range of Miscanthus populations. Molecular markers are practical tools for evaluating genetic diversity and selecting parental or breeding lines for marker-assisted breeding [18,19,20,21,22]. Nevertheless, a few molecular markers have been developed to identify Cr tolerance traits in Miscanthus. It was primarily due to a lack of genomic information, which hampered the establishment of efficient molecular markers for this species using traditional methods [13]. However, recent advances in the high-throughput next-generation of sequencing (NGS) have allowed researchers to characterize genes associated with desirable traits and accelerated the development of molecular markers, such as simple sequence repeat (SSR) DNA markers to screen a wide range of breeding material [23,24,25]. In addition, NGS has been demonstrated to be effective in identifying various functional pathways associated with varied abiotic stress tolerance mechanisms and important agronomic traits [21,26,27].
This research aimed to (1) characterize the accumulation characteristics of M. sinensis genotypes after Cr treatment to gain an understanding of the adaptive response of different genotypes of this species to Cr stress and (2) develop EST-SSR markers using the RNA-seq database of Cr-treated M. sinensis [13]. The molecular markers developed in this research will accelerate the screening of a wide range of M. sinensis genotypes for Cr tolerance traits and provide a platform for M. sinensis genetic improvement and molecular-marker-assisted breeding.

2. Material and Methods

2.1. Plant Material and Cr Stress Treatment

A total of 58 M. sinensis genotypes collected from the Sichuan, Chongqing, Guizhou, and Jiangxi provinces of China were used in this study. The geographic information of each genotype is provided in Table S1. The seeds (n = 20) of each genotype were pregerminated following the method outlined by Nie et al. [28]. Subsequently, three seedlings of each genotype were transplanted in three separated 11 cm plastic pots filled with quartz sand. Each pot represented a replicate unit for the corresponding genotype. All Pots were maintained in a plant growth chamber at 28 °C/25 °C with cycles of 12 h light/ 12 h dark. The seedlings were irrigated with 500 mL 1× Hoagland’s nutrient solution (Hope Bio-Technology Co., Ltd., Qingdao, China) every two days. Three months after transplanting, the M. sinensis plants were treated with 200 mg/L of Cr (VI) (K2Cr2O7), which was incorporated with K2Cr2O7 and 1× Hoagland’s nutrient solution. Previous research revealed that M. sinensis plants treated with 200 mg/L of Cr (VI) were severely damaged, suggesting that this concentration of Cr is toxic to this species [29]. All plants were harvested at 7 days after treatment (DAT). The harvested plants were washed with distilled water and then sectioned into roots, stems, and leaves to determine Cr content.

2.2. Determination of Chromium Content in Different Plant Tissues

Harvested leaves, stems, and roots were initially dried in an oven at 105 °C for 30 min followed by 65 °C for 3 days until they reached a constant weight. All dried samples were ground into powder using a high-throughput tissue grinder (Scientz-48, JSCX Technology Co., Ltd., Chengdu, China). Subsequently, 0.2 g of the ground samples were digested using 5 mL of HNO3 and 1 mL of HClO4. All chemicals used for digestion were of an analytical grade. The digestion was performed using a graphite digester at 200 °C. The solution containing digested material was diluted to 50 mL with ultrapure water prior to Cr determination with inductively coupled plasma/optical emission spectroscopy using Optima 7200 ICP-OES (CETAC Technologies®, Omaha, NE, USA). Following the determination of Cr content in different tissues of all genotypes, the translocation factor (TF) and bioconcentration factor (BF) were calculated using the following formula:
TF = Cr content of aboveground part/Cr content of root
BF = Cr content of plant aboveground or underground parts/Cr content of solution.

2.3. Identification of EST-SSRs

MIcroSAtellite (MISA) identification tool http://pgrc.ipk-gatersleben.de/misa/ (accessed on 5 March 2021) [30] was used to identify EST-SSRs containing transcripts in transcriptomic data generated in the previous study on M. sinensis (NCBI accession no. PRJNA656631) [13]. The EST-SSRs search was conducted under the following criteria: mono-, di-, tri-, tetra-, penta-, and hexanucleotide motifs with minimum numbers of ten, six, five, five, five, and five repeats, respectively. Primer 5.0 (Premier Biosoft International, Palo Alto, CA, USA) was used to design primers in the EST-SSRs flanking regions, and the primers were synthesized by YouKang Biotechnology Co., Ltd. (Hangzhou, China).

2.4. DNA Extraction and Validation of EST-SSRs

The genomic DNA (gDNA) of 58 genotypes was extracted using a plant DNA Genomic Extraction Kit (Tiangen Biotech, Beijing, China) following the manufacturer’s instructions. The quantity of the gDNA was determined with a NanoDrop ND-2000 spectrophotometer (NanoDrop, Wilmington, DE, USA), and the quality of the gDNA was assessed using a 2% agarose gel. The gDNA of all samples was normalized to 30 ng/μL before genotyping.
A total of 88 EST-SSR primer pairs corresponding to candidate genes involved in Cr accumulation in M. sinensis were selected and initially tested on six genotypes. Finally, 24 pairs with robust discernible bands were selected (Table S2). For this, the polymerase chain reaction (PCR) was used to amplify the regions of interest using the primer pairs. The PCR amplification reaction (20 μL) contained 2 μL of DNA (30 ng/μL), 10.5 μL of Taq PCR MasterMixⅡ (Tiangen Biotech, China), 0.7 μL of each primer (10 μmol/L), and 6.1 μL of ddH2O. The PCR cycling program was as follows: initial denaturation at 94 °C for 5 min, followed by 35 cycles of denaturation at 94 °C for 1 min, annealing at 55 °C for 30 s and extension for 1 min at 72 °C, and a final extension for 5 min at 72 °C. The PCR products were loaded on an 8% polyacrylamide gel electrophoresis and run for 1.5 h at 350 V. The gels were stained by a 0.1% AgNO3 solution for 15 min, washed three times using ddH2O, and then placed in a solution containing 15 g NaOH, 0.19 g Na2B4O7·10H2O, and 4 mL of formaldehyde for 7 min to develop color. Finally, the primer pairs with clear polymorphic bands were selected for amplification using the same PCR procedure outlined above.

2.5. Data Analysis

The data from the Cr content in plant tissues were subjected to a one-way analysis of variance (ANOVA) with SPSS 27.0 (SPSS Inc., Chicago, IL, USA). The coefficient of variation (CV) of the Cr content in plant tissues was calculated using the following equation: CV = standard deviation (SD)/mean × 100%.
The alleles of EST-SSRs were scored for the presence (1) or absence (0) in all 58 genotypes, with each allele treated as an independent character regardless of its intensity. The genetic diversity and population structure of all genotypes were assessed using a present/absent data matrix. An unweighted pair group method with arithmetic means (UPGMA) dendrograms of 58 genotypes was constructed with NTSYS-pc software Version 2.10 (Applied Biostatistics, Inc., Setauket, NY, USA) using the estimated genetic similarity coefficients (GS). The PIC (polymorphic information content) of different primers was calculated with PowerMarker v3.25 software [31]. The population structure of all M. sinensis genotypes was assessed using STRUCTURE Ver. 2.3.4 software [32] with the admixture model, following the procedure described by Nie et al. [21]. A Q-matrix was obtained from the membership probability of each variety and was used for further association mapping.
The association between the investigated traits (i.e., Cr content in each plant tissue, BF, and TF) and marker alleles was assessed by marker–trait association analysis. For this, a general linear model (GLM) implementing the Q matrix as covariate parameters was used to incorporate genotypes’ data and the associated traits in TASSEL2.1. The coding sequences (CDS) of the genes related to Cr treatment were translated into protein sequences by TBtools software https://github.com/CJ-Chen/TBtools (8 September 2021). Subsequently, the translated sequences were blasted using the Phytozome v13 (Phytozome BLAST Search (https://phytozome-next.jgi.doe.gov/blast-search accessed on 8 September 2021)) to find protein sequences with higher homology to those of the relative species, such as S. bicolor, Zea mays, P. virgatum, and B. distachyon. Subsequently, ClustalW in MEGA v7.0 software was used to align protein sequences. Finally, the neighbor-joining method of MEGA v7.0 software was used to build the phylogenetic tree, with the number of bootstrap replications set to 1000. Boxplot figures were constructed with Origin 2019 software. The relative expression level of candidate genes was obtained from the RNA-seq database deposited in the NCBI database (NCBI accession no. PRJNA656631) [13].

3. Results

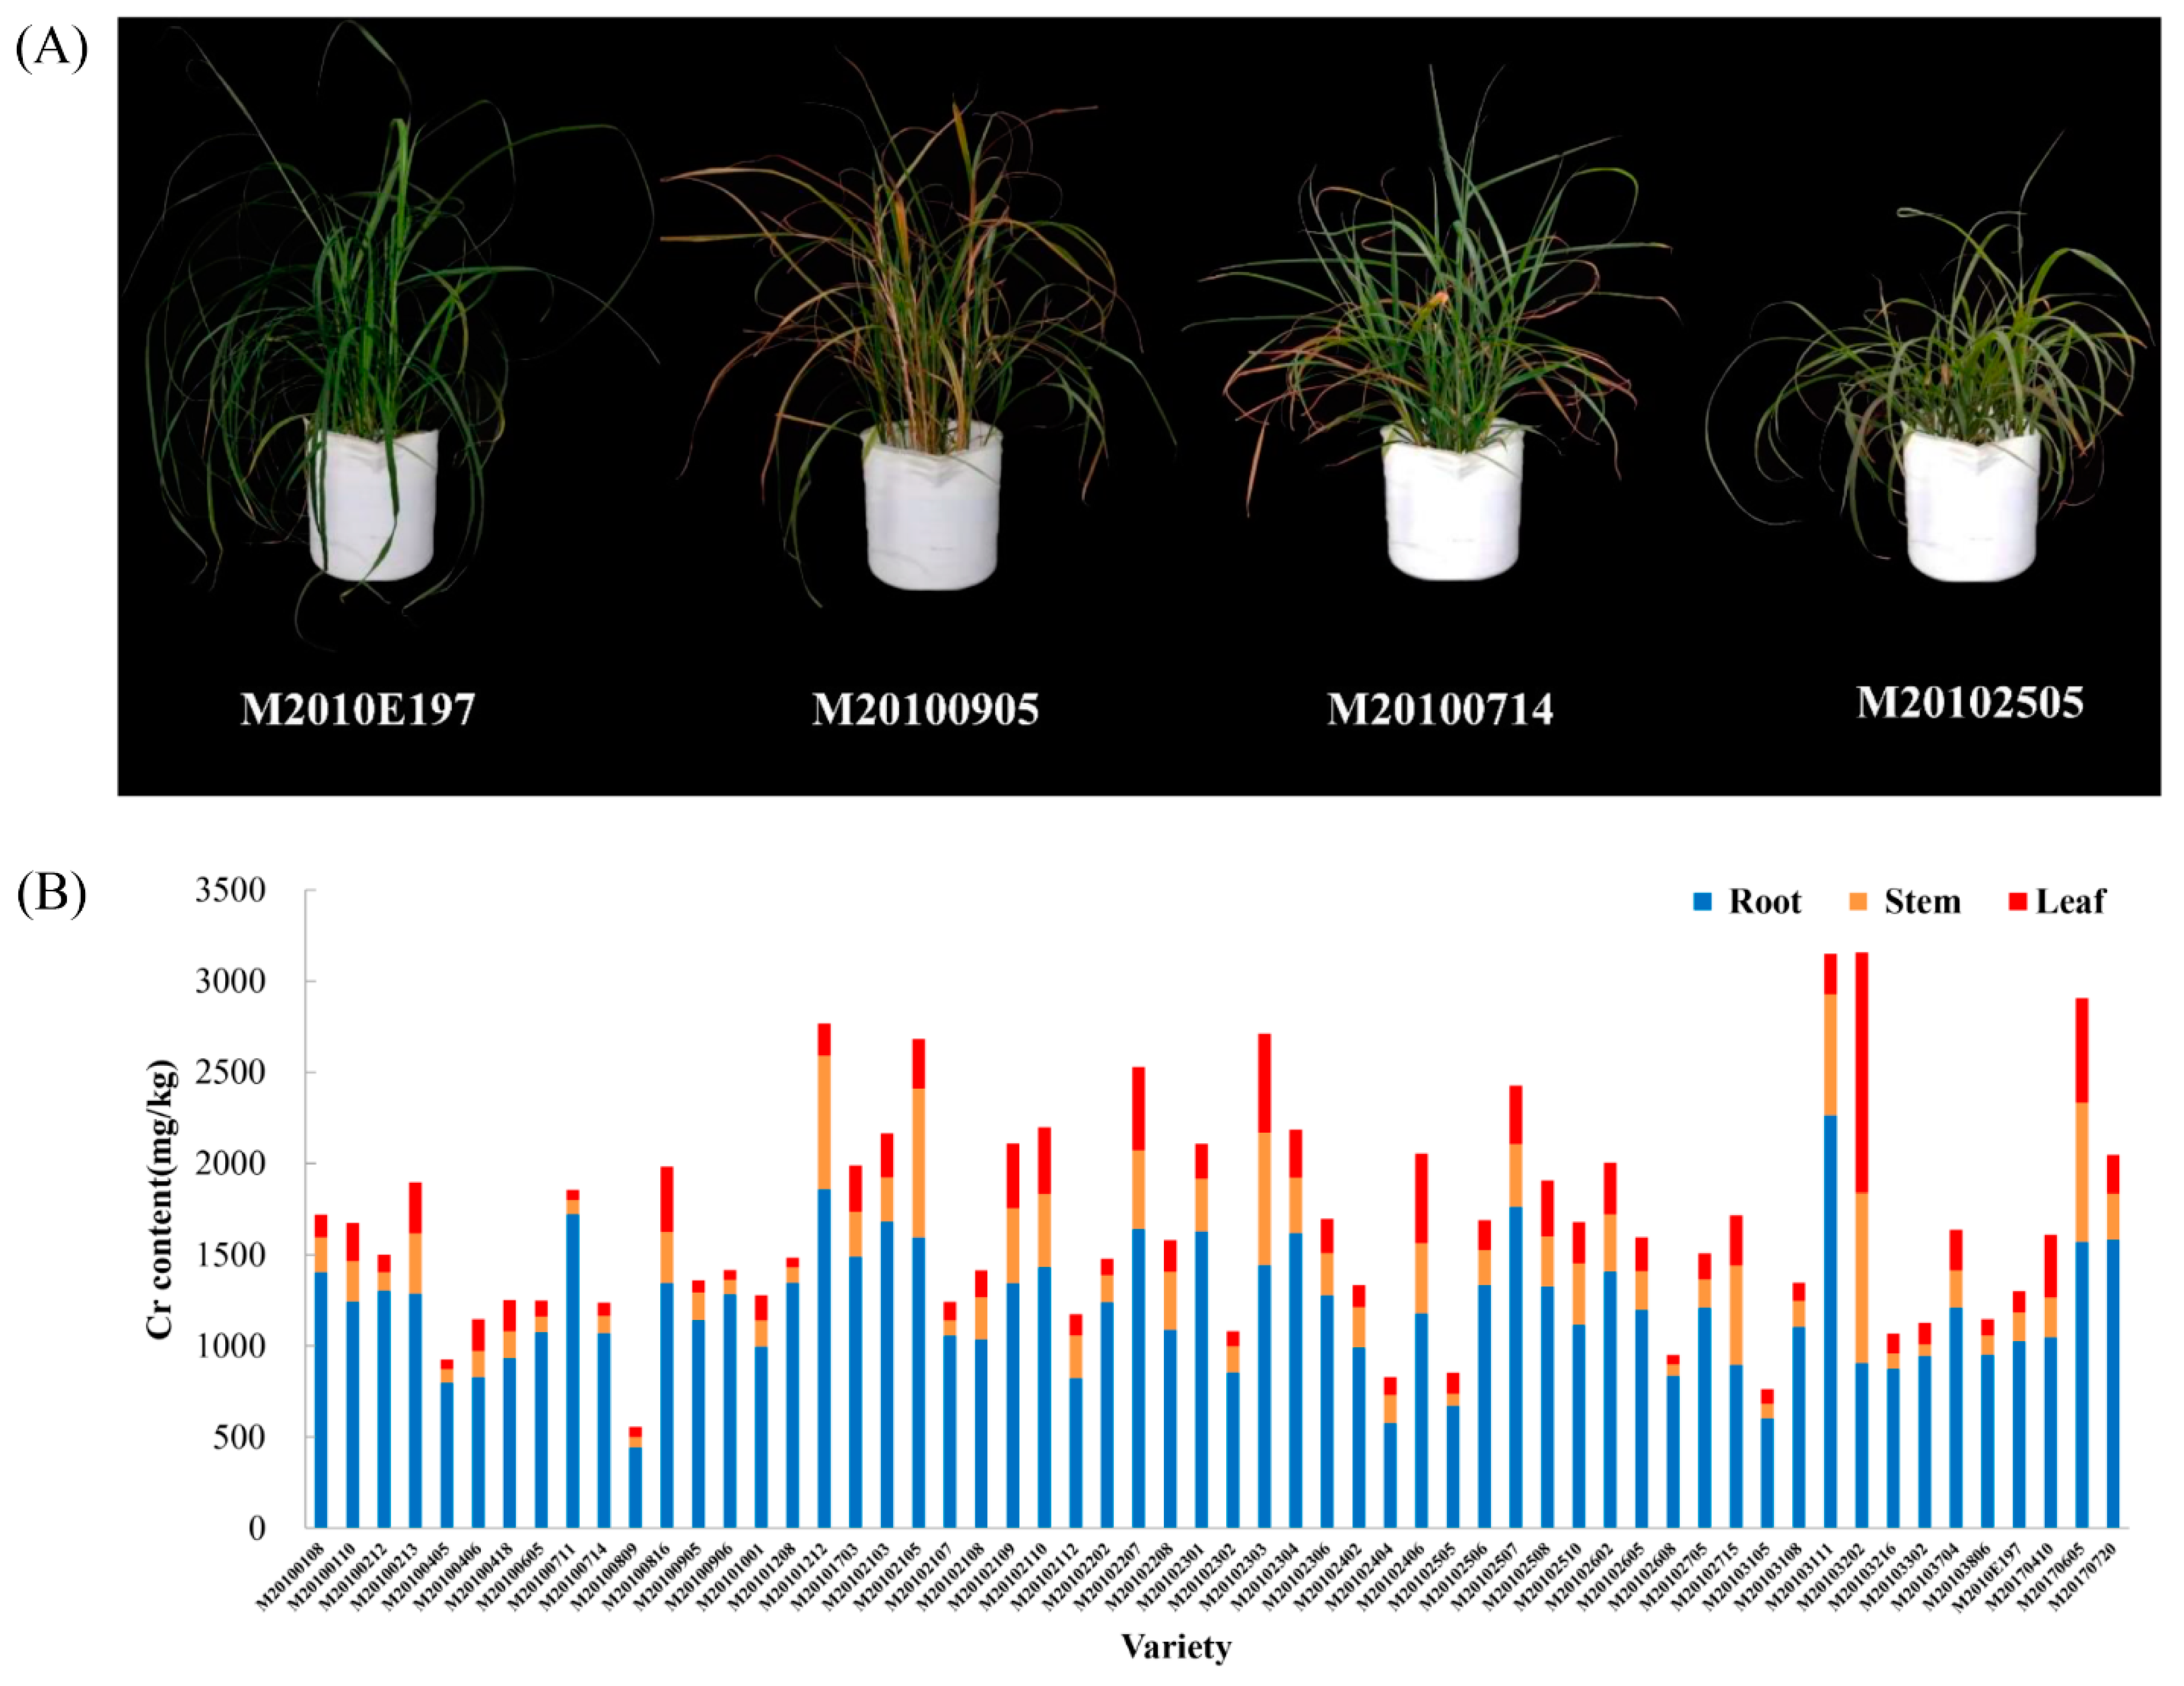
3.1. The Cr Content in Root, Stem, and Leaf Tissues of Various M. sinensis Genotypes

At the harvest time (7 DAT), varied phenotypic changes were recorded among M. sinensis genotypes, with some genotypes being damaged severely (i.e., wilted leaves, collapsed leaves, and discoloration), while others showed almost no apparent symptoms, suggesting varied levels of Cr tolerance existed among the genotypes (Figure 1A). Consistent with these results, significant variations in total Cr content were recorded among the genotypes. Among all the assessed genotypes, the highest and the lowest total Cr content were recorded for the M20103202 (3157.33 mg/kg) and M20100809 (554.85 mg/ kg) genotypes, respectively (Figure 1B). It was also noted that the Cr content in plant tissues followed the order of root > stem > leaf in all M. sinensis genotypes, except for the M20103202 genotype (Table S3), in which the total Cr content was the highest in leaves, followed by the stem.
The variability in Cr uptake and translocation was compared among the genotypes using the coefficient of variation (CV) (Table 1). The results reveal that both root and the bioconcentration (BF) of underground yielded the same CV value (28.46%), indicating a relatively stable Cr uptake ability among all genotypes. However, varied CV values were recorded for the aboveground tissues and the translocation factor (TF). The results show that the CV values for the stems, leaves, and TF were 78.46%, 90.19%, and 85.13%, respectively. This result demonstrates the variability in Cr transport among the M. sinensis genotypes when subjected to Cr treatment. Furthermore, the TF of most genotypes was less than 1 (Table S3), suggesting that M. sinensis is not a hyperaccumulator and could not transport the absorbed Cr to the aboveground tissues rapidly. The mean of BF for the aboveground tissues of M. sinensis was 2.37, which was lower than that for the underground tissue (6.03), indicating that the root system of M. sinensis has a greater ability to accumulate Cr ions.

3.2. Identification and Validation of EST-SSRs

EST-SSRs are valuable markers for assessing genetic variation and marker-assisted selection (MAS). Using the MISA identification tool, a total of 43,367 EST-SSRs were identified from 31,956 EST-SSRs containing sequences, with 7493 unigenes containing more than one EST-SSR locus and 3969 identified as compound microsatellites (Table S4). The most abundant EST-SSRs were trinucleotide repeats (19,398, 44.73%), followed by mononucleotide repeats (16,735, 38.59%) and dinucleotide repeats (6145, 14.17%). In contrast, tetranucleotide repeats (607, 1.40%), hexanucleotide repeats (270, 0.62%), and pentanucleotide repeats (212, 0.49%) were the least abundant types (Table S4).
The distribution characteristics of different EST-SSRs are shown in Figure 2A. The number of the given repeat units of EST-SSRs ranged from 5 to >10, and the frequency of the given EST-SSRs structure dropped progressively as the number of repeat units increased. The EST-SSRs unit number ranged from 5 to 32, and the most common repeats unit of the EST-SSRs were five tandem repeats (Table S5). The distribution characteristics and frequency of different EST-SSR motifs are shown in Figure 2B. Among the dinucleotide repeats, the most common motifs were AG/CT (2845, 46.30%), followed by AC/GT (1811, 29.47%) and AT/TA (1126, 18.32%). AGC/CTG (10,071, 51.92%), CCG/CGG (3297, 16.99%), and AAC/GTT (1293, 6.67%) were the most abundant motifs in the trinucleotide repeats. However, no obvious dominant motifs were noted for the tetra-, penta-, or hexanucleotide repeats (Table S6). A total of 88 EST-SSR primer pairs corresponding to crucial candidate genes involved in Cr accumulation in M. sinensis were selected. At last, 83 (94.32%) EST-SSRs were successfully amplified, whereas 24 (27.27%) EST-SSRs were polymorphic and generated amplification products of several genes, including sulfate transporter (ST), ABC transporters, heavy metal ATPase family, zinc/iron-regulated transporter protein family, wall-associated receptor kinase (WAK), amino acid permease, and nitrate transporter protein (NRT) family (Table S7).
After amplification, 272 clear bands were obtained, and 190 polymorphic loci generated by 24 EST-SSR primer pairs were identified. An average of 7.92 polymorphic bands were found by each pair of primers, and the average percentage of polymorphic loci was 68.16%. The polymorphism information content (PIC) of each EST-SSR locus ranged from 14.84% to 49.76%, with an average of 34.39%, representing a different discriminatory capacity among the primer pairs and a moderate polymorphism level (PIC > 0.25) (Table 2).

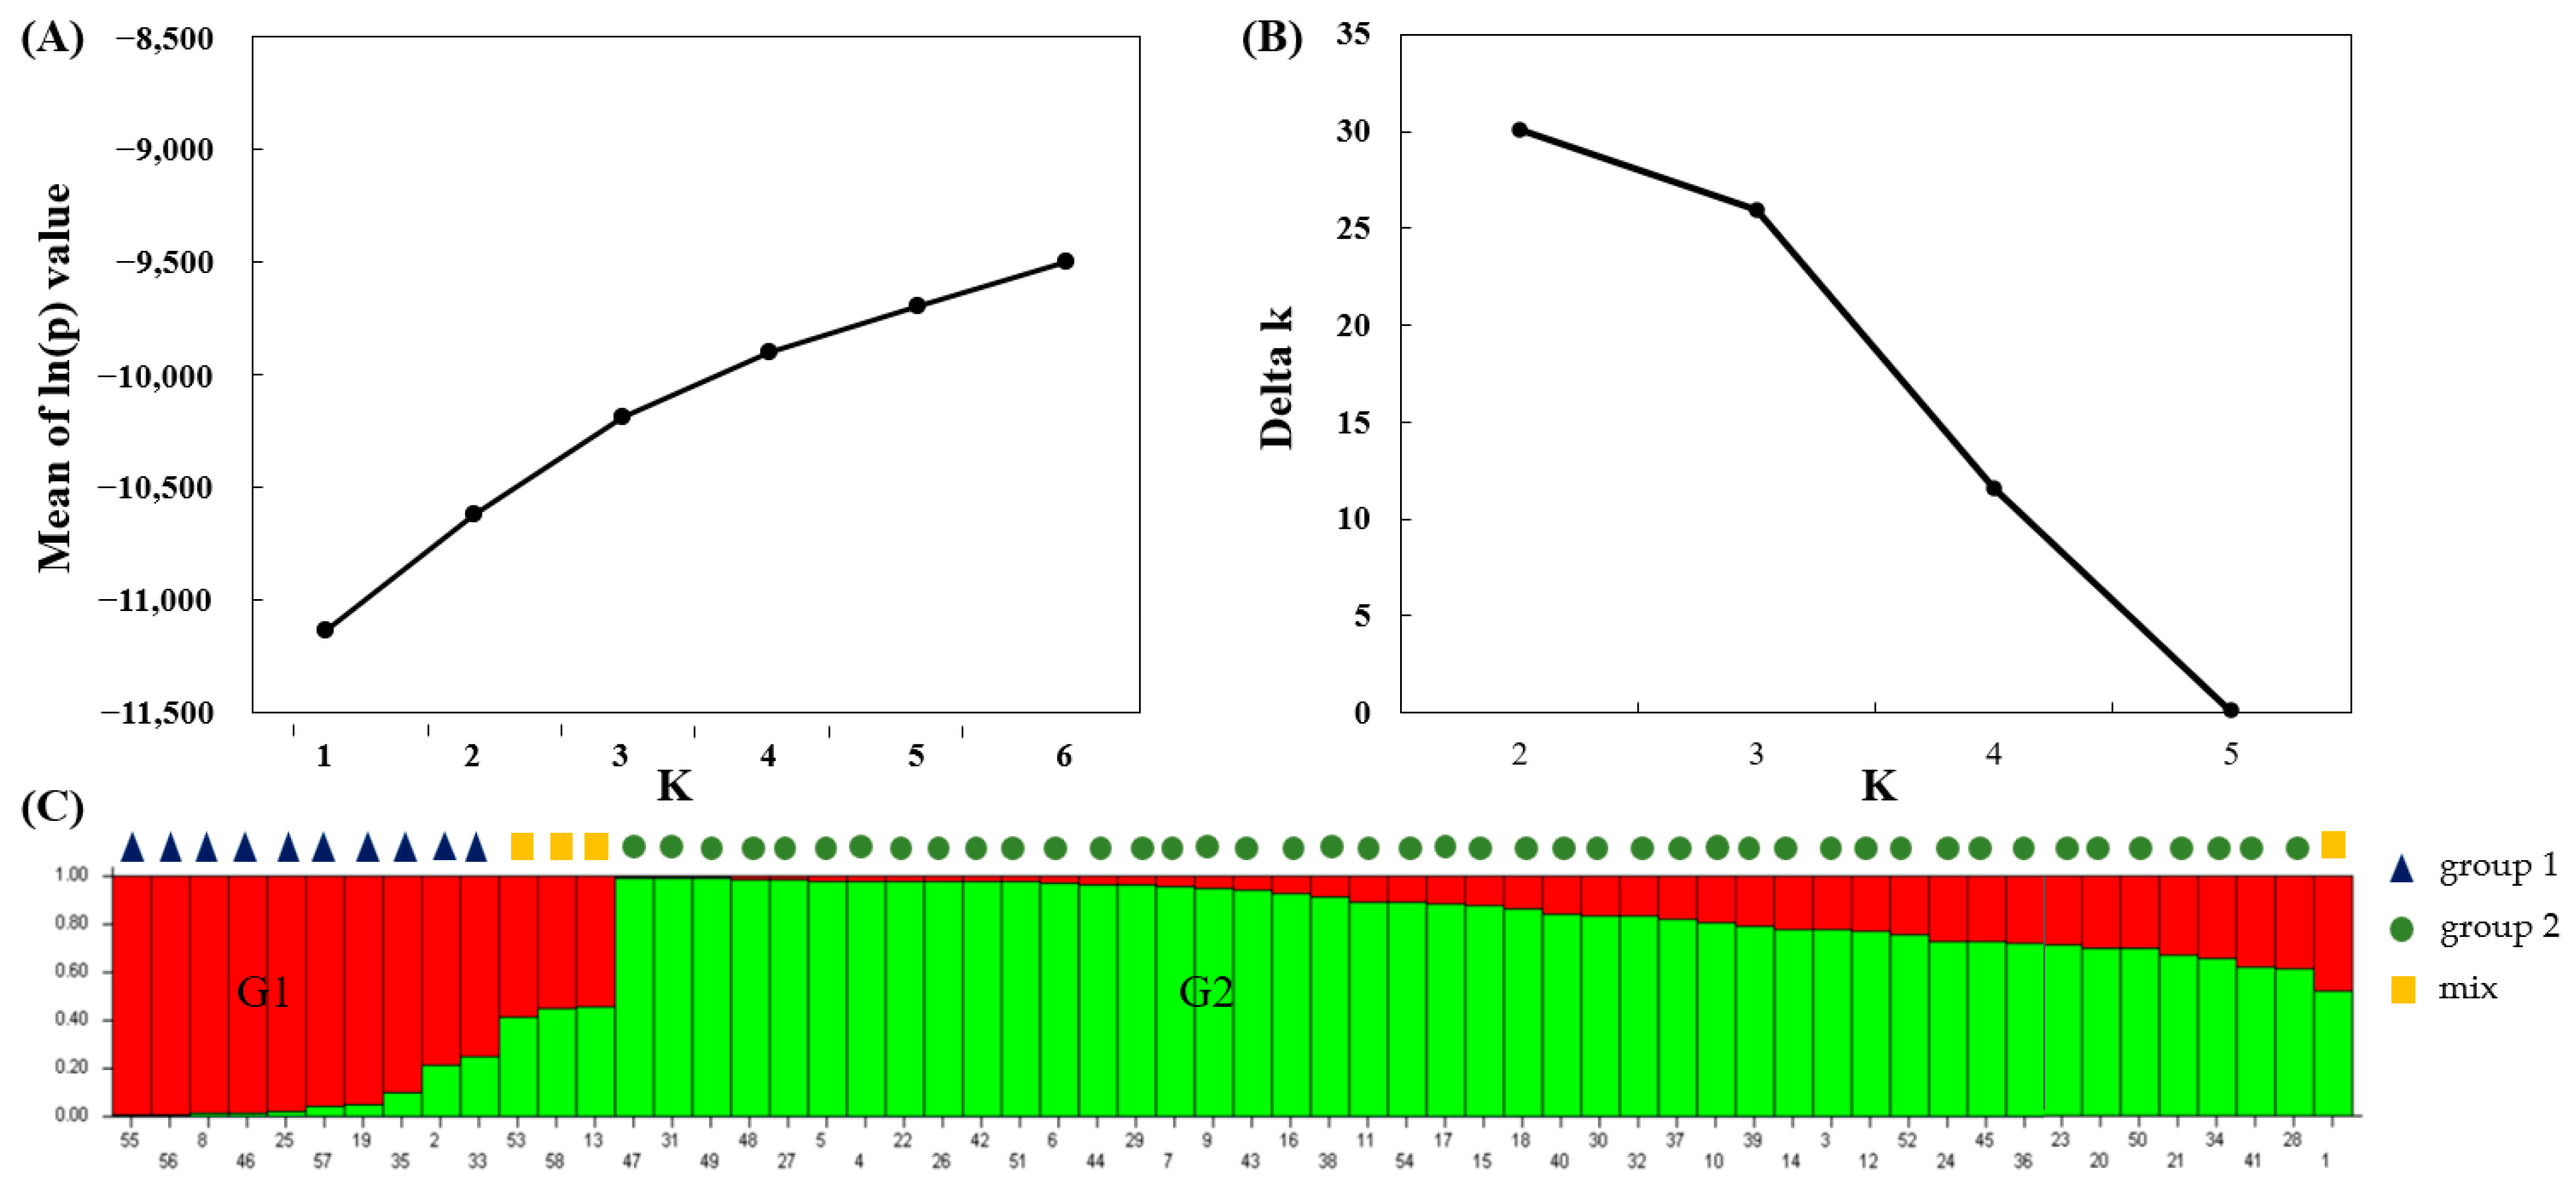
3.3. Clustering Analysis and Population Structure

After discarding the markers with a minor allele frequency of less than 5%, 170 polymorphic loci were retained for a cluster, structure, and association analysis. The results show that the genetic similarity coefficients of 58 genotypes ranged between 0.39 and 0.76 (Table S8), indicating a high level of genetic variation among the genotypes. Genetic similarity (GS) data were used to construct the UPGMA dendrogram of 58 genotypes. The dendrograms demonstrated that two clusters formed when the GS value was 0.58 (Figure S1). These findings imply that the developed EST-SSR markers for M. sinensis have a high polymorphism level, allowing for effective genotype differentiation.
The Hardy–Weinberg Equilibrium was used to estimate the population structure of 58 M. sinensis genotypes using 170 filtered polymorphic loci. Based on the maximum likelihood and delta K (ΔK) values given in Figure 3, the optimal number of subgroups (K) was 2. As a result, 10 and 44 genotypes were allocated to groups 1 and 2, respectively, and four genotypes could not be assigned to a specific group based on a significant membership threshold (Q-value) of 0.60 (Figure 3, Table S9).

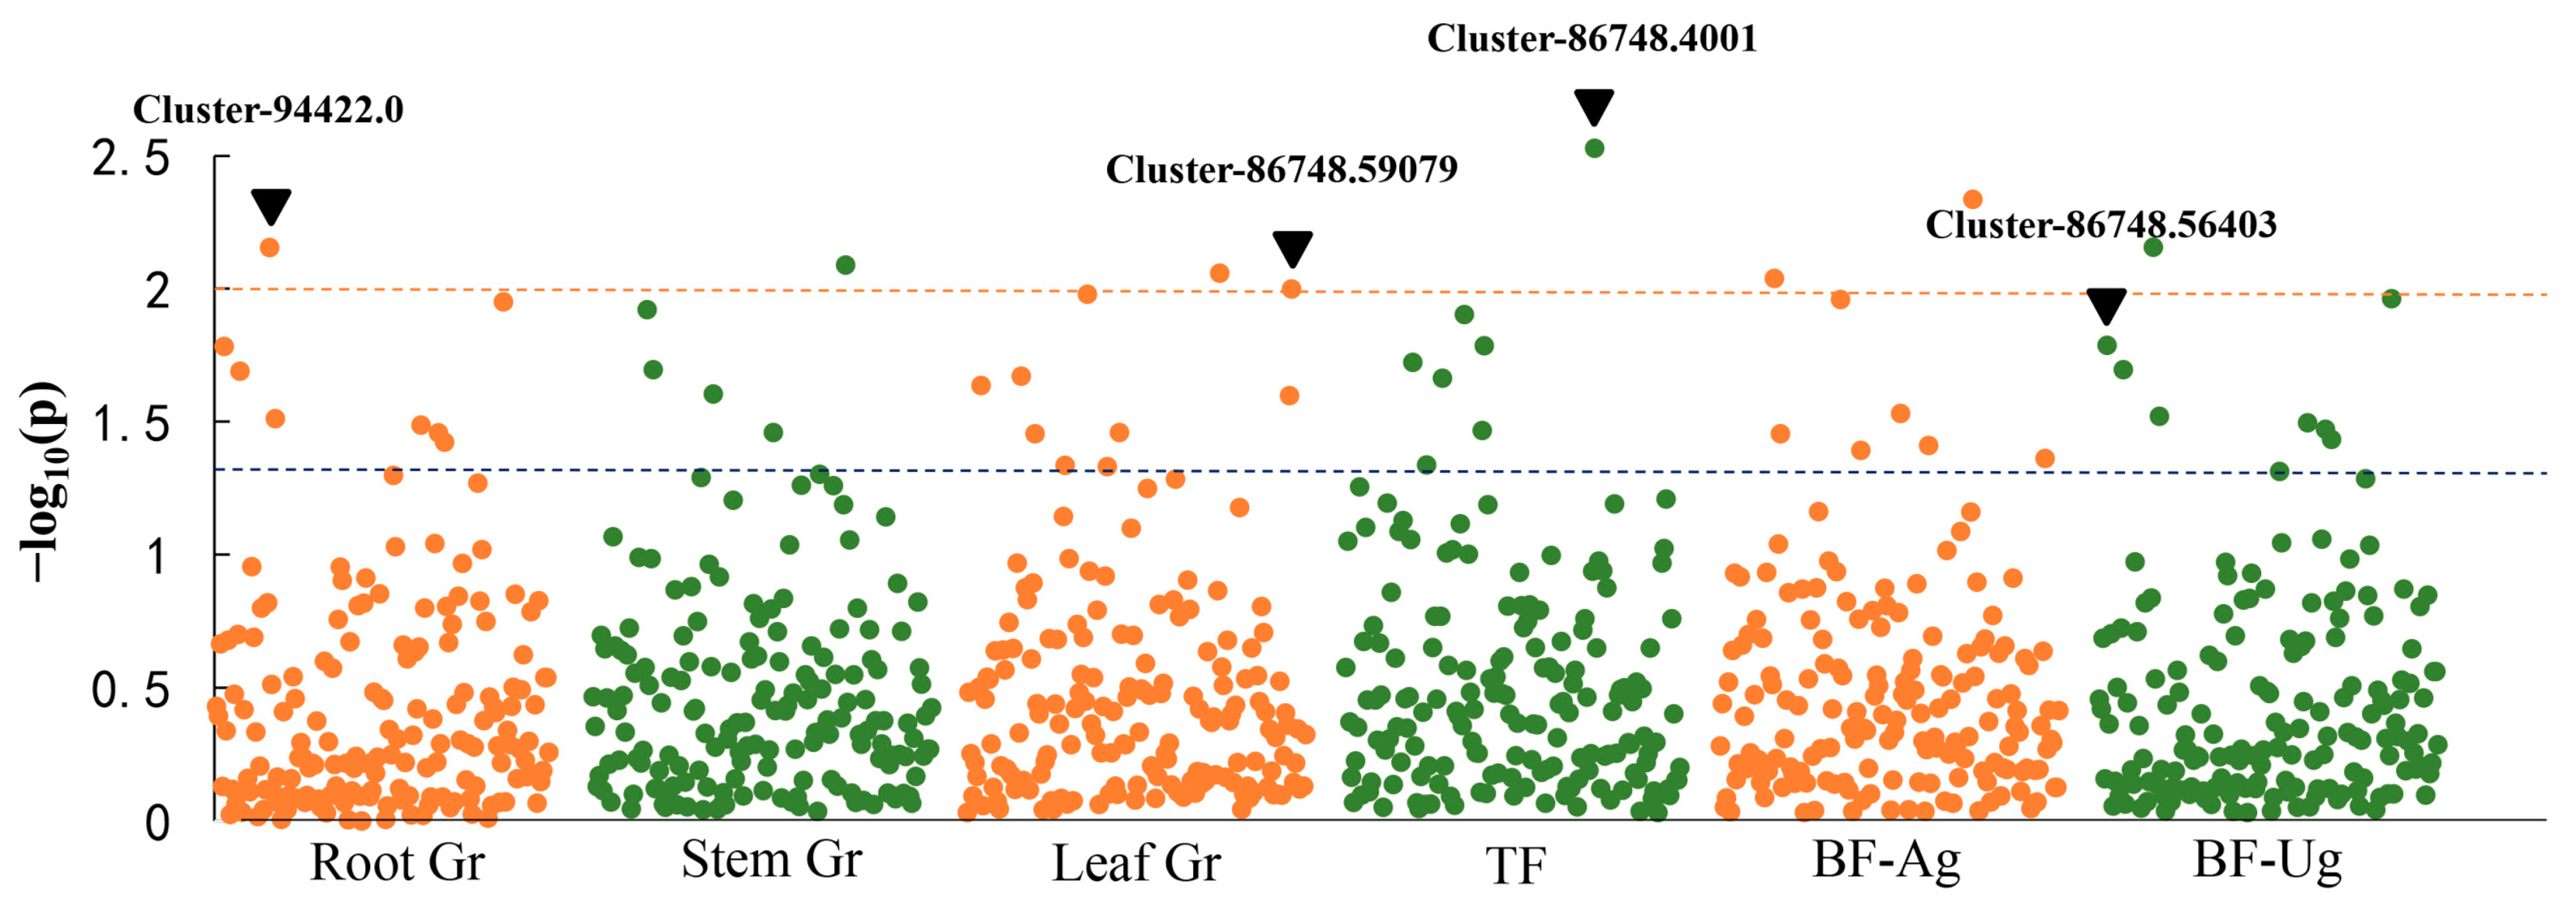
3.4. Marker–Trait Association Analysis for Cr Treatment

A GLM model was used to examine the association between EST-SSR markers and traits under Cr stress. According to the results, there were a total of 46 associations between the markers and traits (p < 0.05), with 14 EST-SSR markers associating with the TF, BF of aboveground (BF-Ag), BF of underground (BF-Ug), and Cr content in various tissues under Cr stress (Figure 4, Table S10). Notably, a significant association was identified between the marker developed from Cluster-86748.4001 and TF, BF-Ag, and Cr content in stems and leaves (p < 0.01), while the marker developed from Cluster-94422.0 was significantly (p < 0.01) associated with root Cr content, BF-Ag, and BF-Ug. These results suggest that a single marker can be associated with numerous traits while multiple loci can be associated with one trait. Functional annotation of unigenes corresponding to the associated markers revealed that Cluster-94422.0 and Cluster-86748.4001 were annotated as an ABC transporter and a wall-associated receptor kinases (WAK), respectively, while Cluster-86748.59079 and Cluster-86748.56403 were related to high-affinity sulfate transporters (ST) (Table 3).

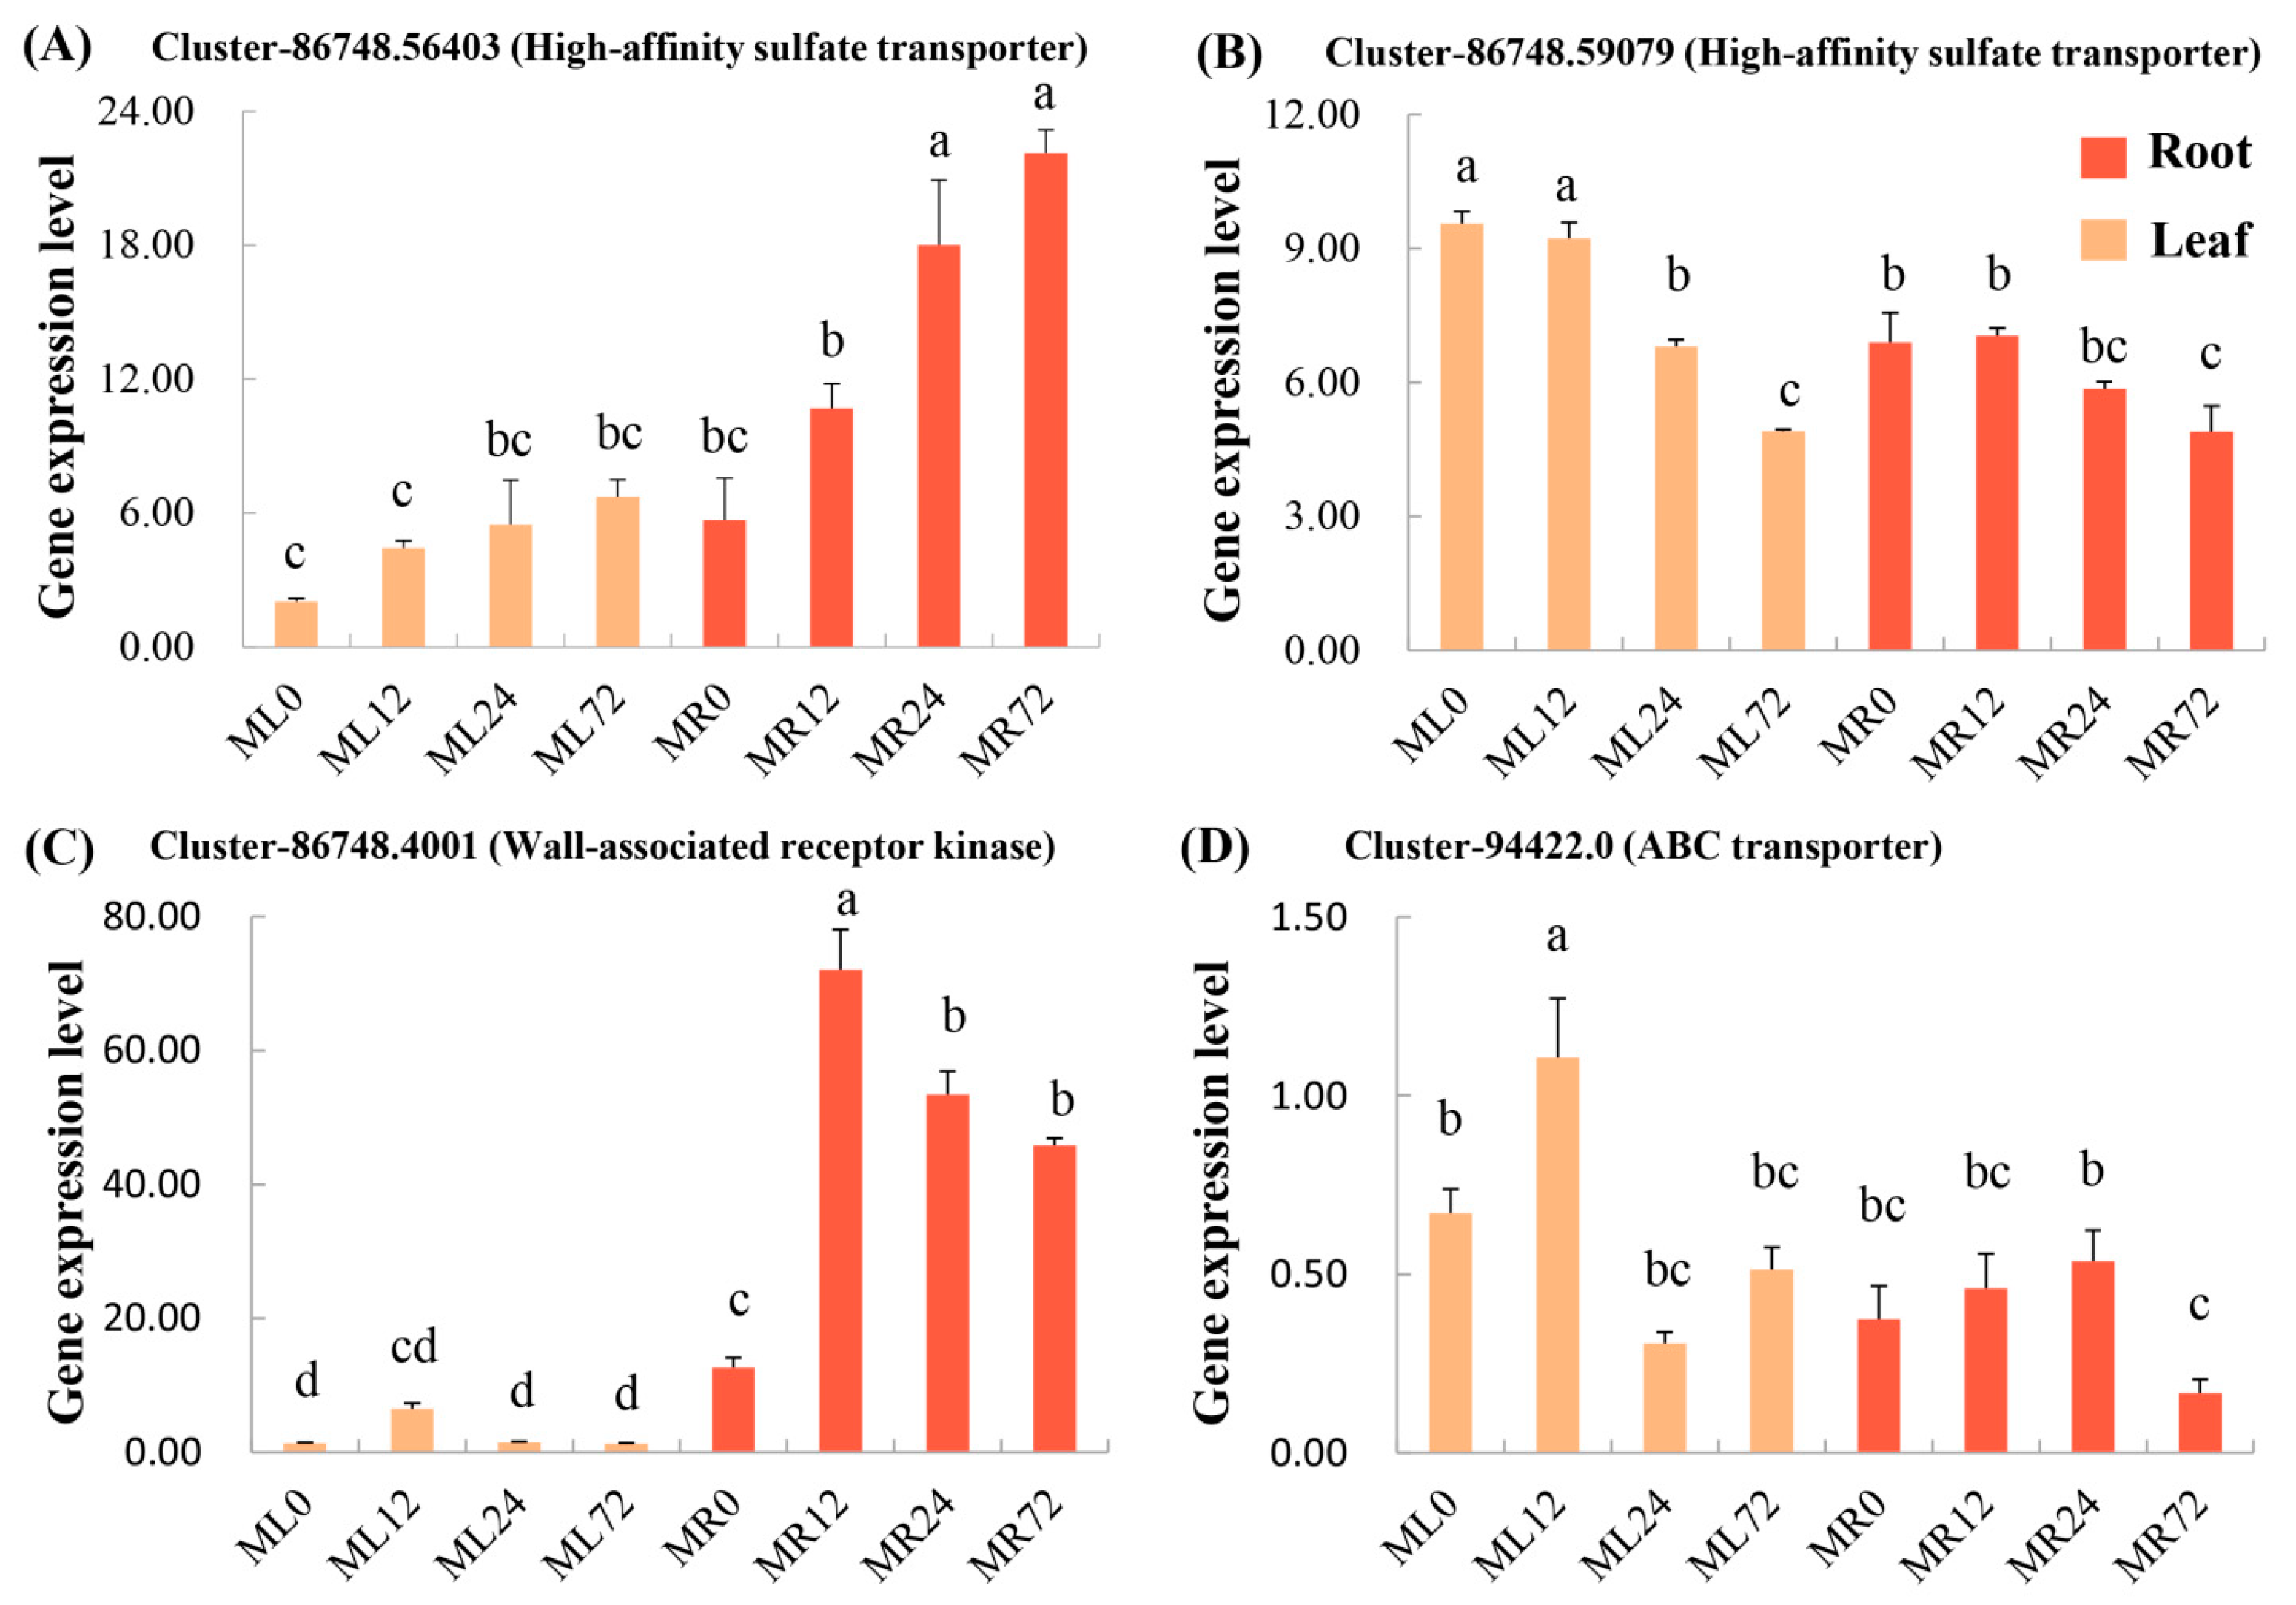
3.5. Expression and Phylogenetic Analysis of Associated Candidate Genes

Four candidate genes for Cr accumulation were identified using the marker–trait association analysis, including two high-affinity sulfate transporter (ST) genes (Cluster-86748.56403 and Cluster-86748.59079), an ABC transporter gene (Cluster-94422.0), and a WAK (Cluster-86748.4001). Both ST genes were expressed in roots and leaves after Cr treatment, though the pattern of expression throughout the study was dissimilar between the two genes, suggesting both genes play different functional roles under Cr stress (Figure 5A,B). The results show that the gene Cluster-86748.56403 had a low expression level in both roots and leaves at the early stage of treatment, but the level of expression of this gene increased with increasing treatment time. In contrast, gene Cluster-86748.59079 had a high expression level at the early stage, but its expression level progressively declined later. We also recorded varied gene expression levels in different tissues for Cluster-86748.4001 and Cluster-94422.0 (Figure 5C,D). According to the results, the expression level of gene Cluster-86748.4001 was consistently greater in the roots than in the leaves, suggesting that the gene likely played a role in Cr root absorption. Gene Cluster-94422.0 had a sharp increase in expression level in the leaves by 12 h after Cr treatment, though its expression level dramatically dropped later. However, the expression level of gene Cluster-94422.0 only showed an increasing trend up to 24 h after Cr treatment. These results suggest that Cluster-94422.0 is likely to have multiple roles, including the absorption and transport of Cr, in different tissues under Cr stress.
An unrooted neighbor-joining tree (with 1000 bootstraps) was constructed using the protein sequences of the candidate genes, along with the sequences of the associated markers and homology genes from relative species, to investigate the evolutionary links of the identified genes (Figure 6A–D). The results show that the gene Cluster-86748.59079, Cluster-86748.4001, and Cluster-86748.56403 of M. sinensis share homology with those in Sorghum bicolor, but gene Cluster-94422.0 displayed a higher level of similarity with those in Panicum virgatum.
Haplotype analysis was performed for significantly associated locus within the candidate genes based on a presence/absence data matrix. The association analysis showed that locus 28 in Cluster-94422.0 and locus 162 in Cluster-86748.59079 were strongly linked with leaf Cr content. The boxplots show that these two loci (locus 28 and locus 162) at EST-SSR areas absent bands (‘0’) had a higher Cr content in leaves than present bands (‘1’) (p = 3.5 × 10⁻² for locus 28 and p = 1.3 × 10⁻² for locus 162), suggesting that EST-SSR markers involving both candidate genes were associated with Cr accumulation in leaves (Figure 6E,F).

4. Discussion

Miscanthus species are highly tolerant of heavy metals [16] and have been used for the remediation of heavy metal-contaminated soils [33]. Previous research showed that M. sinensis could accumulate Cr in roots, where it binds to the cell walls [13]. Similarly, this research showed that the Cr content in roots was much higher than in stems and leaves, though the content of Cr in roots greatly varied among the 58 M. sinensis genotypes (Figure 1B). It has been shown that the content of Cr in roots was greater than other tissues in Z. mays [34], which agrees with this study’s results. Roots play a crucial role in heavy metal tolerance in plants as they act as the first barrier for the entry of heavy metal ions, and in species with a high capacity of immobilizing heavy metal ions in roots, the entry of the ions into plant cells is limited [35]. Upon entry into the roots, heavy metal ions can bind to the functional groups (e.g., hydroxyl and carboxyl groups) of root cell wall components (e.g., cellulose, pectin, and lignin) and become immobilized, precipitated, and inactivated [36].
Association analysis has been widely utilized to detect key quantitative trait loci and genes in a wide range of plant species, since this approach can efficiently identify function-based molecular markers strongly associated with a target trait [37]. For instance, an association mapping for the aluminum (Al) tolerance of rice identified 23 significant (p < 0.05) trait–marker associations [38]. In M. sinensis, 12 molecular markers associated with biomass yield were identified using an association analysis approach, which can be used as an efficient tool for an early selection of genotypes with high biomass production [21]. Furthermore, Nie et al. [15] used an association analysis approach to identify and develop 12 SSR markers associated with drought tolerance traits in Miscanthus. This study identified 43,367 EST-SSRs from 31,956 EST-SSR-containing sequences (Table S4). A total of 88 EST-SSR primer pairs were selected, referring to important candidate genes involved in Cr accumulation in M. sinensis. Finally, 46 associations were identified (p < 0.05), and 14 EST-SSR markers associated with Cr tolerance were validated (Figure 4, Table S10). This result further confirms that an association analysis approach is an efficient method to identify functional molecular markers.
In nature, Cr (VI) usually exists in chromate (CrO42−) and dichromate (Cr2O72−) anionic forms [39], which are nonessential and highly phytotoxic. As there is no specific transporter for Cr (VI) uptake by plants, and due to the chemical property similarities between Cr (VI) and essential elements, this toxic heavy metal can be taken up by root membrane transporters involved in the uptake of essential elements [40,41]. Thus, root membrane transporters are crucial in plant responses to heavy metal stress. It has been suggested that Cr (VI) uptake involves sulfate transporters [42] as chromate (CrO42−) and sulfate (SO42−) can compete for the same transporters [43]. Consistent with this, it has been revealed that the Cr (VI) content in Brassica juncea positively correlated with the overexpression of the SHST1 gene, encoding a sulfate transporter [44]. In addition, In Arabidopsis thaliana, the overexpression of the sulfate transporter gene Sultr1;2 significantly elevated the uptake of Cr (VI), while knocking down this gene significantly reduced Cr (VI) uptake [40]. This study found that markers developed from gene Cluster-86748.56403 related to a high-affinity sulfate transporter were associated with underground BF and Cr levels in roots and leaves (Table 3). In addition, it was noted that the BF of aboveground and Cr content of leaves were associated with the marker developed from gene Cluster-86748.59079, which was also annotated as a high-affinity sulfate transporter that relatively had a higher expression level in leaves than in roots after Cr treatment (Table 3, Figure 5B). These results suggest that high-affinity sulfate transporters play a pivotal role in Cr absorption and translocation in M. sinensis, which agrees with previous studies.
Previously, we showed that ATP-binding cassette (ABC) transporters play an essential role in the detoxification mechanism of Cr in M. sinensis [13]. ABC transporters are involved in a variety of metabolic processes in which they facilitate substrate transport across membranes by hydrolyzing ATP [45,46,47]. ABC transporters in plants play a crucial role in seed germination and lateral root development, regulating cellular osmotic homeostasis, xenobiotic sequestration and translocation, and stomatal movement [48,49]. Dubey et al. [50] showed that ABC transporters play an essential role in Cr detoxification and tolerance in rice. Liu et al. [22] also indicated that ABC transporters were involved in Cr uptake and homeostasis in Raphanus sativus. In the present study, the marker developed from the gene Cluster-94422.0 (annotated as an ABC transporter) was significantly (p < 0.01) associated with the BF of aboveground and underground, and Cr content in various plant tissues (Table 3), indicating that ABC transporters attribute to M. sinensis response to Cr treatment.
Wall-associated receptor kinases (WAKs) can bind to cell wall pectin molecules covalently. It has been shown that WAKs are involved in cell elongation, signal transduction, responses to pathogen infection, and heavy metal stress in plants [51,52,53]. In A. thaliana, overexpression of the WAK1 gene in roots significantly increased Al tolerance [54]. However, there is limited information about the role of WAKs in Cr tolerance on other plant species. In our research, a marker developed from the gene Cluster-86748.4001 (annotated as a WAK) was significantly (p < 0.01) associated with the BF of aboveground, TF, and Cr content of aboveground tissues (Table 3), suggesting that WAKs play a role in absorption and transport of Cr in M. sinensis.

5. Conclusions

Miscanthus sinensis is a C4 perennial grass species with a high tolerance for heavy metals that is able to successfully remove Cr from soils and sustain optimum yields under Cr stress. EST-SSR markers are valuable tools for identifying and selecting traits associated with plant stress tolerance mechanisms. Given the crucial role of M. sinensis as a phytoremediation in lands contaminated with Cr, it is pivotal to identify the genotypes of this species that possess traits enabling them to remove Cr from soils more effectively. In this research, we characterized the response of 58 genotypes of M. sinensis to Cr treatment and developed effective SRR markers to identify candidate genes associated with Cr tolerance in genotypes with a high level of Cr tolerance. For this, we initially examined the patterns of Cr accumulation in 58 genotypes of M. sinensis. We then identified 14 EST-SSR markers associated with Cr tolerance traits, of which four genes were identified as Cr tolerance candidates (i.e., ABC transporters, wall-associated receptor kinases, as well as high-affinity sulfate transporters). The EST-SSR markers related to these candidate genes can be utilized for the molecular breeding of Cr tolerance in M. sinensis. Overall, the findings of this study will expedite the screening of M. sinensis genotypes for desired tolerance traits under Cr stress and provide a foundation for M. sinensis genetic improvement.

Supplementary Materials

The following supporting information can be downloaded at https://www.mdpi.com/article/10.3390/agronomy14071458/s1, Figure S1: Dendrogram of 58 M. sinensis genotypes based on genetic similarity (GS) coefficient; Table S1: Source of the M. sinensis genotypes; Table S2: The EST-SSRs primer pairs that were designed and validated in this study; Table S3: The standard deviation (SD), coefficient of variation (CV) and F-value of Cr content in different tissues, translocation factor (TF), bioconcentration factor (BF) of aboveground and underground between M. sinensis population; Table S4: Summary of EST-SSRs identified from the M. sinensis genotypes; Table S5: The distribution characteristics of different SSR motifs in M. sinensis; Table S6: The distribution frequency of main motif types; Table S7: The annotation of polymorphic SSR; Table S8: The genetic similarity(GS) coefficients of 58 M. sinensis genotypes; Table S9: Significant membership threshold (Q-value); Table S10: Significant marker-trait association information of M. sinensis under Cr stress.

Author Contributions

Data curation, G.N., A.L., H.G., Y.W. and M.T.; funding acquisition, G.N., G.F., L.H. and X.Z.; investigation, A.L. and J.H.; methodology, G.N. and H.G.; project administration, G.F., L.H. and X.Z.; resources, J.H.; software, Y.W.; validation, M.T.; writing—original draft, G.N., A.L., and H.G.; writing—review and editing, G.N., H.G. and A.L. All authors have read and agreed to the published version of the manuscript.

Funding

This research work was supported by the earmarked fund for CARS (CARS-34), the Sichuan Province Breeding Research grant (2021YFYZ0013) and International Cooperation project of Sichuan Science and Technology Department (2022YFH0060).

Data Availability Statement

The original contributions presented in the study are included in the article/Supplementary Material, further inquiries can be directed to the corresponding authors.

Conflicts of Interest

The authors declare no conflicts of interest.

References

  1. Islam, M.K.; Alam, I.; Khanam, S.; Lee, S.Y.; Huh, M.R. Accumulation and tolerance characteristics of chromium in nine jute varieties (Corchorus spp. and Hibiscus spp.). Plant Omics 2014, 7, 392–402. [Google Scholar]
  2. Zhu, W.; Zhang, K.; Xu, D.; Liu, Z.; Gao, J. Statistical analysis on the effect of the utilization of mineral resources on the environmental impact in China. Sustainability 2021, 13, 8462. [Google Scholar] [CrossRef]
  3. Sharma, A.; Kapoor, D.; Wang, J.; Shahzad, B.; Kumar, V.; Bali, A.S.; Jasrotia, S.; Zheng, B.; Yuan, H.; Yan, D. Chromium bioaccumulation and its impacts on plants: An overview. Plants 2020, 9, 100. [Google Scholar] [CrossRef] [PubMed]
  4. Mohan, D.; Pittman, C.U. Activated carbons and low cost adsorbents for remediation of tri- and hexavalent chromium from water. J. Hazard. Mater. 2006, 137, 762–811. [Google Scholar] [CrossRef] [PubMed]
  5. Shanker, A.K.; Cervantes, C.; Loza-Tavera, H.; Avudainayagam, S. Chromium toxicity in plants. Environ. Int. 2005, 31, 739–753. [Google Scholar] [CrossRef] [PubMed]
  6. Ertani, A.; Mietto, A.; Borin, M.; Nardi, S. Chromium in Agricultural Soils and Crops: A Review. Water Air Soil Pollut. 2017, 228, 190. [Google Scholar] [CrossRef]
  7. Akinci, I.E.; Akinci, S. Effect of chromium toxicity on germination and early seedling growth in melon (Cucumis melo L.). Afr. J. Biotechnol. 2010, 9, 4589–4594. [Google Scholar]
  8. Sallah-Ud-Din, R.; Farid, M.; Saeed, R.; Ali, S.; Rizwan, M.; Tauqeer, H.M.; Bukhari, S.A.H. Citric acid enhanced the antioxidant defense system and chromium uptake by Lemna minor L. grown in hydroponics under Cr stress. Environ. Sci. Pollut. Res. 2017, 24, 17669–17678. [Google Scholar] [CrossRef] [PubMed]
  9. Goupil, P.; Souguir, D.; Ferjani, E.; Faure, O.; Hitmi, A.; Ledoigt, G. Expression of stress-related genes in tomato plants exposed to arsenic and chromium in nutrient solution. J. Plant Physiol. 2009, 166, 1446–1452. [Google Scholar] [CrossRef]
  10. Bah, A.M.; Sun, H.; Chen, F.; Zhou, J.; Dai, H.; Zhang, G.; Wu, F. Comparative proteomic analysis of Typha angustifolia leaf under chromium, cadmium and lead stress. J. Hazard. Mater. 2010, 184, 191–203. [Google Scholar] [CrossRef]
  11. Clifton-Brown, J.C.; Lewandowski, I. Screening Miscanthus genotypes in field trials to optimise biomass yield and quality in southern Germany. Eur. J. Agron. 2002, 16, 97–110. [Google Scholar] [CrossRef]
  12. Heaton, E.A.; Long, S.P.; Voigt, T.B.; Jones, M.B.; Clifton-Brown, J. Miscanthus for renewable energy generation: European Union expierence and projections for Illinois. Mitig. Adapt. Strateg. Glob. Chang. 2004, 9, 433–451. [Google Scholar] [CrossRef]
  13. Nie, G.; Zhong, M.; Cai, J.; Yang, X.; Zhang, X. Transcriptome characterization of candidate genes related to chromium uptake, transport and accumulation in Miscanthus sinensis. Ecotoxicol. Environ. Saf. 2021, 221, 112445. [Google Scholar] [CrossRef] [PubMed]
  14. Tubeileh, A.; Rennie, T.J.; Goss, M.J. A review on biomass production from C4 grasses: Yield and quality for end-use. Curr. Opin. Plant Biol. 2016, 31, 172–180. [Google Scholar] [CrossRef] [PubMed]
  15. Nie, G.; Tang, L.; Zhang, Y.J.; Huang, L.K.; Ma, X.; Cao, X.; Pan, L.; Zhang, X.; Zhang, X.Q. Development of SSR markers based on transcriptome sequencing and association analysis with drought tolerance in perennial grass Miscanthus from China. Front. Plant Sci. 2017, 8, 801. [Google Scholar] [CrossRef] [PubMed]
  16. Fernando, A.; Duarte, P.; Oliveira, J.F.S. Bioremoval of heavy metals from soil by Miscanthus sinensis × giganteus. In Proceedings of the Biomass for Energy and the Environment, Proceedings of the 9th European Bioenergy Conference, Copenhagen, Denmark, 24–27 June 1996; pp. 531–536. [Google Scholar]
  17. Namasivayam, C.; Höll, W.H. Chromium (III) removal in tannery waste waters using Chinese Reed (Miscanthus sinensis), a fast growing plant. Eur. J. Wood Wood Prod. 2004, 62, 74–80. [Google Scholar] [CrossRef]
  18. Hung, K.H.; Chiang, T.Y.; Chiu, C.T.; Hsu, T.W.; Ho, C.W. Isolation and characterization of microsatellite loci from a potential biofuel plant Miscanthus sinensis (Poaceae). Conserv. Genet. 2009, 10, 1377–1380. [Google Scholar] [CrossRef]
  19. Clark, L.V.; Brummer, J.E.; Glowacka, K.; Hall, M.C.; Sacks, E.J. A footprint of past climate change on the diversity and population structure of Miscanthus sinensis. Ann. Bot. 2014, 114, 97–107. [Google Scholar] [CrossRef]
  20. Nie, G.; Zhang, X.Q.; Huang, L.K.; Xu, W.Z.; Wang, J.P.; Zhang, Y.W.; Ma, X.; Yan, H. Genetic variability and population structure of the potential bioenergy crop Miscanthus sinensis (Poaceae) in Southwest China based on SRAP markers. Molecules 2014, 19, 12881–12897. [Google Scholar] [CrossRef] [PubMed]
  21. Nie, G.; Huang, L.; Zhang, X.; Megan, T.; Jiang, Y.; Yu, X.; Lin, X.; Wang, X.; Zhang, Y. Marker-Trait Association for Biomass Yield of Potential Bio-fuel Feedstock Miscanthus sinensis from Southwest China. Front. Plant Sci. 2016, 7, 802. [Google Scholar] [CrossRef]
  22. Liu, W.; Xu, L.; Wang, Y.; Shen, H.; Zhu, X.; Zhang, K.; Chen, Y.; Yu, R.; Limera, C.; Liu, L. Transcriptome-wide analysis of chromium-stress responsive micrornas to explore mirna-mediated regulatory networks in radish (Raphanus sativus L.). Sci. Rep. 2015, 5, 14024. [Google Scholar] [CrossRef] [PubMed]
  23. Hu, J.; Nakatani, M.; Mizuno, K.; Fujimura, T. Development and characterization of microsatellite markers in Sweetpotato. Breed. Sci. 2004, 54, 177–188. [Google Scholar] [CrossRef]
  24. Gupta, S.; Prasad, M. Development and characterization of genic SSR markers in Medicago truncatula and their transferability in leguminous and non-leguminous species. Genome 2009, 52, 761–771. [Google Scholar] [CrossRef] [PubMed]
  25. Varshney, R.K. Gene-based marker systems in plants: High throughput approaches for marker discovery and genotyping. In Molecular Techniques in Crop Improvement; Springer: Dordrecht, The Netherlands, 2010; pp. 119–142. [Google Scholar]
  26. Kane, N.C.; Rieseberg, L.H. Selective sweeps reveal candidate genes for adaptation to drought and salt tolerance in common sunflower, Helianthus annuus. Genetics 2007, 175, 1823–1834. [Google Scholar] [CrossRef] [PubMed]
  27. Yu, X.; Bai, G.; Luo, N.; Chen, Z.; Liu, S.; Liu, J. Association of simple sequence repeat (SSR) markers with submergence tolerance in diverse populations of perennial ryegrass. Plant Sci. 2011, 180, 391–398. [Google Scholar] [CrossRef] [PubMed]
  28. Nie, G.; Sun, M.; Huang, L.; Ma, X.; Zhang, X. Effect of moist pre-chill and dry pre-heat treatment on the germination of Miscanthus sinensis seed from southwest China. Grassl. Sci. 2017, 63, 93–100. [Google Scholar] [CrossRef]
  29. Arduini, I.; Masoni, A.; Ercoli, L. Effects of high chromium applications on Miscanthus during the period of maximum growth. Environ. Exp. Bot. 2006, 58, 234–243. [Google Scholar] [CrossRef]
  30. Sebastian, B.; Thomas, T.; Thomas, M.; Uwe, S.; Martin, M. MISA-web: A web server for microsatellite prediction. Bioinformatics 2017, 33, 2583–2585. [Google Scholar]
  31. Liu, K.J.; Muse, S.V. PowerMarker: An integrated analysis environment for genetic marker analysis. Bioinformatics 2005, 21, 2128–2129. [Google Scholar] [CrossRef]
  32. Evanno, G.S.; Regnaut, S.J.; Goudet, J. Detecting the number of clusters of individuals using the software STRUCTURE: A simulation study. Mol. Ecol. 2005, 14, 2611–2620. [Google Scholar] [CrossRef]
  33. Wilkins, C. The uptake of copper, arsenic and zinc by Miscanthus-environmental implications for use as an energy crop. Asp. Appl. Biol. 1997, 49, 335–340. [Google Scholar]
  34. Adhikari, A.; Adhikari, S.; Ghosh, S.; Azahar, I.; Hossain, Z. Imbalance of redox homeostasis and antioxidant defense status in maize under chromium (VI) stress. Environ. Exp. Bot. 2019, 169, 103873. [Google Scholar] [CrossRef]
  35. Jia, H.; Wang, X.; Wei, T.; Zhou, R.; Ding, Y. Accumulation and fixation of Cd by tomato cell wall pectin under Cd stress. Environ. Exp. Bot. 2019, 167, 103829. [Google Scholar] [CrossRef]
  36. De Caroli, M.; Furini, A.; DalCorso, G.; Rojas, M.; Di Sansebastiano, G.P. Endomembrane Reorganization induced by heavy metals. Plants 2020, 9, 482. [Google Scholar] [CrossRef] [PubMed]
  37. Liu, Y.; Liu, Y.Y.; Zhang, Q.; Fu, B.S.; Cai, J.; Wu, J.Z.; Chen, Y.H. Genome-wide association analysis of quantitative trait loci for salinity-tolerance related morphological indices in bread wheat. Euphytica 2018, 214, 176. [Google Scholar] [CrossRef]
  38. Zhang, P.; Zhong, K.; Tong, H.; Shahid, M.Q.; Li, J. Association mapping for aluminum tolerance in a core collection of rice landraces. Front. Plant Sci. 2016, 7, 1415. [Google Scholar] [CrossRef] [PubMed]
  39. Srivastava, D.; Tiwari, M.; Dutta, P.; Singh, P.; Chawda, K.; Kumari, M.; Chakrabarty, D. Chromium stress in plants: Toxicity, tolerance and phytoremediation. Sustainability 2021, 13, 4629. [Google Scholar] [CrossRef]
  40. Xu, Z.; Cai, M.; Chen, S.; Huang, X.; Wang, P. High-affinity sulfate transporter Sultr1; 2 is a major transporter for Cr (VI) uptake in plants. Environ. Sci. Technol. 2021, 55, 1576–1584. [Google Scholar] [CrossRef]
  41. Li, P.; Luo, T.; Pu, X. Plant transporters: Roles in stress responses and effects on growth and development. Plant Growth Regul. 2021, 93, 253–266. [Google Scholar] [CrossRef]
  42. Shewry, P.R.; Peterson, P.J. The Uptake and transport of chromium by barley seedlings (Hordeum vulgare L.). J. Exp. Bot. 1974, 25, 785–797. [Google Scholar] [CrossRef]
  43. Ferrari, M.; Cozza, R.; Marieschi, M.; Torelli, A. Role of sulfate transporters in chromium tolerance in Scenedesmus acutus M. (Sphaeropleales). Plants 2022, 11, 223. [Google Scholar] [CrossRef] [PubMed]
  44. Schiavon, M.; Pilon-Smits, E.A.; Wirtz, M.; Hell, R.; Malagoli, M. Interactions between chromium and sulfur metabolism in Brassica juncea. J. Environ. Qual. 2008, 37, 1536–1545. [Google Scholar] [CrossRef] [PubMed]
  45. Guo, Z.; Yuan, X.; Li, L.; Zeng, M.; Yang, J.; Tang, H.; Duan, C. Genome-Wide Analysis of the ATP-Binding Cassette (ABC) Transporter family in Zea mays L. and its response to heavy metal stresses. Int. J. Mol. Sci. 2022, 23, 2109. [Google Scholar] [CrossRef] [PubMed]
  46. Banasiak, J.; Jasiński, M. ATP-binding cassette (ABC) transporters in nonmodel plants. New Phytol. 2022, 233, 1597–1612. [Google Scholar] [CrossRef] [PubMed]
  47. Ghanizadeh, H.; Harrington, K.C. Non-target site mechanisms of resistance to herbicides. Crit. Rev. Plant Sci. 2017, 36, 24–34. [Google Scholar] [CrossRef]
  48. Thanh Ha Thi, D.; Enrico, M.; Youngsook, L. Functions of ABC transporters in plant growth and development. Curr. Opin. Plant Biol. 2018, 41, 32–38. [Google Scholar]
  49. Dahuja, A.; Kumar, R.R.; Sakhare, A. Role of ABC transporters in maintaining plant homeostasis under abiotic and biotic stresses. Physiol. Plant. 2020, 171, 785–801. [Google Scholar] [CrossRef]
  50. Dubey, S.; Saxena, S.; Chauhan, A.S.; Mathur, P.; Chakrabaroty, D. Identification and expression analysis of conserved micrornas during short and prolonged chromium stress in rice (Oryza sativa). Environ. Sci. Pollut. Res. 2020, 27, 380–390. [Google Scholar] [CrossRef] [PubMed]
  51. Lally, D.; Ingmire, P.; Tong, H.; He, Z. Antisense expression of a cell wall-associated protein kinase, WAK4, inhibits cell elongation and alters morphology. Plant Cell 2001, 13, 1317–1331. [Google Scholar]
  52. Anderson, C.M.; Wagner, T.A.; Perret, M. WAKs: Cell wall-associated kinases linking the cytoplasm to the extracellular matrix. Plant Mol. Biol. 2001, 47, 197–206. [Google Scholar] [CrossRef]
  53. Wang, D.; Qin, L.; Wu, M. Identification and characterization of WAK gene family in Saccharum and the negative roles of ScWAK1 under the pathogen stress. Int. J. Biol. Macromol. 2022, 224, 1–19. [Google Scholar] [CrossRef]
  54. Sivaguru, M.; Ezaki, B.; He, Z.; Tong, H.; Osawa, H.; Baluška, F. Aluminum-induced gene expression and protein localization of a cell wall-associated receptor kinase in Arabidopsis. Plant Physiol. 2003, 132, 2256–2266. [Google Scholar] [CrossRef]
Figure 1. Phenotypic changes and chromium content distribution of M. sinensis after Cr treatment: (A) The phenotypic changes observed for affected and unaffected M. sinensis genotypes at 7 days after Cr treatment. (B) Distribution of Cr content in the root, stem, and leaf tissues after Cr treatment. The data are the average of the three biological replicates of each genotype.
Agronomy 14 01458 g001
Figure 2. Distribution characteristics of EST-SSRs in M. sinensis: (A) Distribution characteristics of different EST-SSRs based on the number of nucleotides repeat units. (B) Distribution frequency of different dinucleotide repeat motifs and different trinucleotide repeat motifs.
Agronomy 14 01458 g002
Figure 3. Optimal value of K determined and population structure of 58 M. sinensis genotypes: (A) Mean log-likelihoods and their standard deviations from runs assuming different numbers of subpopulations (K). (B) Values of the delta K (∆K), which tends to peak at the value of K that corresponds to the highest hierarchical level of the substructure. (C) Population structure block, number 1–58 on the x-axis indicate the genotypes, and the number on the y-axis shows the group membership.
Agronomy 14 01458 g003
Figure 4. Manhattan plots of the general linear model (GLM) for association analysis between EST-SSR markers and traits. The −log10 (p) from each SRR marker are plotted against six Cr tolerance-related traits, including Cr content in different tissues, translocation factor (TF), and bioconcentration factor of aboveground (BF-Ag) and underground (BF-Ug).
Agronomy 14 01458 g004
Figure 5. Tissue-specific relative expression level of candidate gene response to Cr treatment based on RNA-seq. ML0 to ML72 represented M. sinensis seeding leaves suffering Cr stress 0 to 72 h, and MR0 to MR72 represented seeding roots suffering Cr stress 0 to 72 h: (A) Tissue-specific relative expression level of gene Cluster-86748.56403. (B) Tissue-specific relative expression level of gene Cluster-86748.59079. (C) Tissue-specific relative expression level of gene Cluster-86748.4001. (D) Tissue-specific relative expression level of gene Cluster-94422.0. Different lowercase letters indicate significant difference at p < 0.05.
Agronomy 14 01458 g005
Figure 6. Phylogenetic tree of candidate gene and homology gene among relative species, and haplotype analysis in the EST-SSR region of gene Cluster-94422.0 and Cluster-86748.59079: (A) Gene Cluster-94422.0. (B) Gene Cluster-86748.4001. (C) Gene Cluster-86748.56403. (D) Gene Cluster-86748.59079. (E) The significant difference in Cr content in leaves between the two haplotypes (‘1’) and (‘0’) of locus 28 in gene Cluster-94422.0 (p = 0.035). (F) The significant difference in Cr content in leaves between the two haplotypes (‘1’) and (‘0’) of locus 162 in gene Cluster-86748.59079 (p = 0.013) revealed in the M. sinensis genotypes. The * represent significant differences at p < 0.05.
Agronomy 14 01458 g006
Table 1. The mean, maximum, minimum, SD, CV, and F-value of Cr content in different tissues, TF, and BF of aboveground and underground tissues among M. sinensis genotypes at 7 days after Cr treatment.
VarietiesCr Concentration/(mg/kg)TFBF
RootStemLeafAbovegroundUnderground
Mean1205.77261.71212.530.392.376.03
Max2265.09933.081317.932.4811.2611.33
Min443.1556.9752.490.070.562.22
SD343.22205.33191.690.331.861.72
CV (%)28.4678.4690.1985.1378.5328.46
F13.32 ***32.78 ***83.48 ***1.4163.15 ***13.31 ***
*** Significant difference at the 0.001 level; SD: standard deviation; CV: coefficient of variation; TF: translocation factor; BF: bioconcentration factor.
Table 2. Polymorphism analysis of EST-SSR amplification products.
Primer NameGene NameTotal Number of
Amplified Bands
Number of
Polymorphic Bands
PPB (%)PIC (%)
1Cluster-86748.564031010100.0026.53
2Cluster-99255.012866.6735.34
3Cluster-97571.010550.0014.84
4Cluster-94422.09555.5624.53
5Cluster-86748.832553133.3346.20
6Cluster-86748.8222311872.7331.48
7Cluster-86748.8196512758.3337.28
8Cluster-86748.812489777.7841.01
9Cluster-85378.1121083.3323.39
10Cluster-66462.117952.9439.54
11Cluster-66335.1151173.3334.72
12Cluster-65872.0131292.3132.84
13Cluster-64532.03133.3349.76
14Cluster-45227.0151066.6741.90
15Cluster-86748.5410610880.0038.36
16Cluster-86748.204669666.6735.66
17Cluster-86748.4001171270.5939.95
18Cluster-86748.558299888.8937.34
19Cluster-86748.3371312975.0039.25
20Cluster-86748.16394151280.0043.85
21Cluster-104317.0161062.5037.08
22Cluster-86748.7627015853.3328.05
23Cluster-86748.683410880.0026.33
24Cluster-86748.590798562.5020.10
Total-272190--
Average-11.33 7.92 68.1634.39
PIC: polymorphism information content; PPB: percentage of polymorphic bands.
Table 3. Significant association information of M. sinensis under Cr stress.
PrimerGene IDAssociated TraitNCBI Annotation
1Cluster-86748.56403Root Cr, Leaf Cr, BF-UgHigh-affinity sulfate transporter
24Cluster-86748.59079Leaf Cr, BF-AgHigh-affinity sulfate transporter
4Cluster-94422.0Root Cr, Steam Cr, Leaf Cr, BF-Ug, BF-AgABC transporter family
5Cluster-86748.83255Root Cr, Steam Cr, Leaf Cr, BF-Ug, BF-Ag, TFABC transporter family
7Cluster-86748.81965Leaf Cr, TFABC transporter family
13Cluster-64532.0TFABC transporter family
2Cluster-99255.0Root Cr, BF-UgABC transporter family
8Cluster-86748.81248Steam Cr, Leaf Cr, BF-Ag, TFABC transporter family
9Cluster-85378.1Leaf Cr, TF, BF-AgABC transporter family
15Cluster-86748.54106Root Cr, BF-Ug, BF-AgHeavy metal ATPase (HMA) family
16Cluster-86748.20466Root Cr, BF-UgHeavy metal ATPase (HMA) family
19Cluster-86748.33713Root Cr, BF-UgZinc/iron regulated transporter protein
20Cluster-86748.16394Steam Cr, BF-AgZinc/iron regulated transporter protein
17Cluster-86748.4001Steam Cr, Leaf Cr, BF-Ag, TFWall-associated receptor kinase
Disclaimer/Publisher’s Note: The statements, opinions and data contained in all publications are solely those of the individual author(s) and contributor(s) and not of MDPI and/or the editor(s). MDPI and/or the editor(s) disclaim responsibility for any injury to people or property resulting from any ideas, methods, instructions or products referred to in the content.

