Article

Nanoparticle Uptake and Bioaccumulation in Pisum sativum L. (Green Pea) Analyzed via Dark-Field Microscopy, Infrared Spectroscopy, and Principal Component Analysis Combined with Machine Learning

1
Biology Department, Faculty of Engineering and Natural Sciences, Manisa Celal Bayar University, Manisa 45140, Turkey
2
Division of Physics, Engineering, Mathematics, and Computer Science, College of Agriculture, Science and Technology, Delaware State University, Dover, DE 19901, USA
3
Department of Agriculture and Natural Resources, College of Agriculture, Science and Technology, Delaware State University, Dover, DE 19901, USA
*
Author to whom correspondence should be addressed.
Agronomy 2024, 14(7), 1473; https://doi.org/10.3390/agronomy14071473
Submission received: 6 May 2024 / Revised: 30 June 2024 / Accepted: 2 July 2024 / Published: 8 July 2024
(This article belongs to the Special Issue Cutting Edge Research of Nanoparticles Application in Agriculture)

Abstract

:
The green pea (Pisum sativum L.) is an economically, nutritionally, and culturally important legume. It is a crop that is subject to various investigations due to its popularity with the development of various protocols in different topics, except for nano-biotechnological studies. This work was carried out to evaluate the uptake, distribution, translocation, and bioaccumulation of the single-walled carbon nanotubes (CNTs) and gold nanoparticles (AuNPs) within the economically important plant Pisum sativum morphologically and anatomically with a dark-field microscopy system. Data were analyzed for morphological parameters such as stem, tendril, root length, number, shape, width-length of the stipules, and root-stem-stipule. Our results proved the stimulation for growth and anatomical parameters such as CNTs aggregates and AuNPs particles at paranchyma, cortex, spongia cells, starch formation and accumulation in lenticels, stoma cells, and stomatal pores. In this study, we compared the utilization of the entire available Attenuated Total Reflectance—Fourier Transform Infrared Spectroscopy (ATR-FTIR) spectral range (525–4000 cm−1) for conducting principal component analysis (PCA) without excluding any specific spectral wavenumbers with the spectral range chosen based on larger PCA loadings. The results demonstrate that for both chosen spectral ranges of the PCA score plots, utilizing only the first three principal components (PCs), we effectively visually separated three groups: (1) plants treated with Au NPs, (2) plants treated with CNTs, and (3) control plants without nanoparticle treatment using ATR-FTIR spectral data from combined samples of root, stem, and leaves from the Pisum sativum plant. Our investigation shows that green pea, a species of the Fabaceae family, is low-cost, fast, and non-toxic and requires an environmentally safe process in the area of nanotechnology in bio-application regarding the green synthesis of nanoparticles; it is a step for green mining, phytoremediation, delivering drugs, and biomolecules. Our findings show that green pea and the Fabaceae family have more advantages for the biological synthesis of C-Au nanoparticles and guide soil health, agricultural development, pharmaceuticals, drug delivery science, and other types of medicinal investigations with a new approach, while a lot of economic plants in the Fabaceae family will be available for the green synthesis of more NPs with single and rapid protocols and will be a popular family in nano-biotechnological studies in the next few decades.

1. Introduction

The environment, biological systems, and human health are influenced by the rapid worldwide production and consumption of nanoparticles (NPs) [1]. Over the years, noble-metal nanoparticles rapidly grew with the inclusion of new nanocomposites into an assortment of products and technologies [2]. Synthesis of nanoparticles is currently an important research area to search for green materials and an eco-friendly manner for current science [3]. However, carbon and gold are multifunctional nanomaterials on account of their many useful properties and application potential within a wide range of products and technologies [4,5].
After carbon nanotubes were first discovered as a product of fullerene synthesis [6,7] in the early nineties, there has been an increasing interest in new forms of these novel carbons and their nanostructures [8,9]. Bioapplications of carbon nanotubes have been predicted and explored with great attention since the wide useful range of these one-dimensional carbon allotropes [10]. The studies were related to carbon nanotubes among various drug delivery systems [11], engineering [12], electronic, mechanical, and thermal properties [12,13,14]. Conversely, hundreds of new gold nanomaterials have been classified in recent years after their discovery [15,16]. There are a lot of applications that have been made about AuNPs biocompatible and inert properties [17,18]; drug and gene therapy/delivery [19], pharmaceutical and biomedical investigations [20,21], medical diagnostic strategies in nanotechnology [22,23], therapeutic agents for some human diseases [24].
Fabaceae family members took a big interest in NPs studies in the last decade, for example: AuNPs and CNTs in Cicer arietinum [25], Ag NPs in Glycyrrhiza glabra, Pteredon emerginatus [26,27], CdS and CuO NPs in Lathyrus sativus [28], Cu-CdS-CuO-ZnO NPs in Indigofera tinctoria [29], TiO2 and MgO NPs in Vigna unguiculata [30,31], FeO and ZnO NPs in Trigonella foenum-graecum [32], and Fe@ZnO, CuO NPs in Pisum sativum [33,34].
The Fabaceae family, including legume fruits dehiscing along both ventral (ovuliferous) and dorsal (non-ovuliferous), or indehiscent, sometimes fragmenting into 1-seeded portions (lomentum), is a very popular family with its economic plants in Asia Minor like bean (Phaseolous vulgaris), soybean (Soja hispida), kidney bean (Vigna unguiculata), broad bean (Vicia faba), lentil (Lens culinaris), chickpea (Cicer arietinum), pea green (Pisum sativum), peanut (Arachis hypogaea) [35] and in the world (FAO).
One of the annual plants, Pisum sativum, has a wide agro-ecological region that starts in Turkmenistan and elongates to North Africa and South Europe, including Anatolia Europe [36,37,38]. The genus Pisum includes two species: P. fulvum Sibth. Et Smith. and P. sativum L. The P. sativum is a cultivated species consisting of six subspecies: subsp. elatius (Bieb.) Schmalh.; subsp. syriacum (Boiss. et Noe) Berger; subsp. abyssinicum (A. Br.) Berger; subsp. transcaucasicum Makash.; subsp. asiaticum Govorov; subsp. sativum (green pea). On the other hand, some scientists have currently separated the genus into two species: P. sativum L. (green pea) and P. arvense L. (field pea) [39,40].
Attenuated total reflectance-Fourier transform infrared spectroscopy (ATR-FTIR) is currently one of the most extensively used Fourier transform infrared spectroscopy methods due to its ability to use a minimal amount of the test sample, simplicity, and fast sampling turnaround time [41]. Those methodological advantages lead to a higher throughput in the sample analysis, paving the way for future in-field applications.
Principal component analysis (PCA) is a well-recognized dimensionality reduction technique that can transform a large set of data into a smaller one, thus preserving the significant information of the original dataset [42]. In the current work, the PCA method was employed to transform the experimental spectroscopic data into a computed space of lower dimension, and PCA score plots were used to provide a visually represented relationship between extracted root, stem, and leaf samples of P. sativum plant and principal component variables (PCs) based on the likeness of their ATR-FTIR spectra, as it was previously described elsewhere [25].
Our primary goal is to evaluate the uptake, distribution, translocation, and bioaccumulation of the single-walled carbon nanotubes (CNTs) and gold nanoparticles (AuNPs) in the economically important plant P. sativum anatomically with dark-field microscopy and the application of infrared spectroscopy in combination with machine learning techniques.

2. Materials and Methods

The plant growth experiment was conducted in the Cooperative Extension Greenhouse, while plant preparation for various testing was conducted at the OSCAR Physics and Pre-Engineering Building located on Delaware State University’s main campus, Dover, Delaware.

2.1. Morphological Testing: Seedlings Development and Extraction

This study utilized water-soluble single-walled carbon nanotubes (CNTs) that were functionalized with polyethylene glycol (PEG), acquired from Carbon Solutions (Carbon Solutions, Riverside, CA, USA). These CNTs were kept in sterile distilled water (1.25 mg/mL concentration) for seed-NP exposure. Additionally, we employed gold nanoparticles (Au NPs) with a diameter of 10 nm and an optical density (OD) of 1. These Au NPs were suspended in a stabilized 0.1 mM phosphate-buffered saline (PBS), free from reactants. The Au NPs were sourced from Millipore Sigma (Millipore Sigma, Burlington, MA, USA), and for seed-NPs exposure, a 4× dilution with sterile distilled water was applied.
The properties of the carbon nanotubes (CNTs) obtained from [43] are as follows: the material type is P7-CNTs, with a tube length from 0.5 to 3 μm and an average diameter of 1.4 nm. CNTs typically exist in bundles with lengths ranging from 1 to 5 μm and 2 to 10 nm in diameter, where the length of the bundle falls between 500 and 600 nm and the bundle diameter between 4 and 5 nm [43]. The same commercial CNTs were described in [44].
Within this study, P7-CNTs were derived from commercial P3-CNTs through derivatization with PEG to achieve water solubility. As reported in [44], the characterization of P7-CNTs indicated the zeta potential of CNTs within our selected soil pH range (pH 6–8) is approximately −50 mV.
The properties of the 10 nm diameter gold nanoparticles, as derived from [44], are as follows: polydispersity index (PDI) ≤ 0.2, core size ranging from 8 to 12 nm, hydrodynamic diameter (Z) ranging from 11 to 25 nm, particle concentration per mL falling between 5.38 × 10¹² and 6.58 × 10¹², absorption maximum at 510–525 nm, optical density (OD) of 1, and a zeta potential of −25.8 mV at pH 7.4 in a stabilized suspension in 0.1 mM PBS (reactant-free), which were utilized in the study [45].
Then, 60 P. sativum seeds (cv. dried sugar snap pea) were sterilized with 7.5% sodium hypochlorite for 20 min. Afterwards, seeds were rinsed 3 times with autoclaved-distilled water and then placed into sterile tubes for further analysis [46].
Afterwards, 20 Pisum sativum seeds were treated with 15 mL CNTs (OD: 0.25): water (group I); another 20 seeds with 15 mL Au NPs (1.25 mg mL−1, 10 nm of diameter): water (group II); and 20 additional P. sativum seeds with 15 mL pure water as a control (group III) for 2 days. After 2 days, all three seed groups were planted into 0.5 L pots for 21 days in a growth chamber under the following conditions: temperature = 22 to 24 °C, humidity = 60%, 10-h light period, and intensity: 250 µmol/m2/s. During the planting process, NP-treated cultures were poured directly onto the seeds. Each group was monitored every 24 h, and each pot was irrigated with 8 mL of distilled water. After 21 days, the control, CNTs, and Au NPs group seedlings, the smallest and the biggest ones, were photographed, and different parts of the P. sativum plants (leaf-stem-root) were sampled, homogenized, and rinsed with deionized water. Afterwards, samples were collected for centrifugal filtration, vortexed for 10 s, and centrifuged for 30 min at 13,000 rpm (24 °C) for agitation.

2.2. Anatomical Testing

Transversal, longitudinal, and superficial hand cross sections were taken to define and compare the features of root-stem-leaf pea green seedlings exposed to CNTs and AuNPs solutions and control group. The dark-field microscopy system (leaves, stems, and roots were magnified ×40 µm. Anatomical data related to leaf, stem and root of control group, CNTs, AuNPs induced P. sativum samples were presented as minimum and maximum measurements. The anatomical characteristics of the species were evaluated and interpreted according to [47].

2.3. Spectroscopic Testing: Data Collection and Analysis

In order to analyze the ATR-FTIR spectral data obtained from the P. sativum plant, we employed the Principle Component Analysis technique and the Unscrambler 10.1 software (CAMO Analytics, Oslo, Norway), as previously described elsewhere [25]. We used the PCA method (mean centered), SVD algorithm, cross validation method, cross validation method used 18 segments, total number of components: 7. We used 60 P. sativum plant samples with a total of 7209 variables representing ATR-FTIR spectral wavenumbers for the 525–4000 cm−1 spectral range with variable weights: All 1.00. This was a full model without any size optimization that allowed all usage, including recalculation and visualizations.
Similarly to our previous work protocol [25], the 5 μL droplets of plant extract samples were deposited over an aperture located on the top of the ATR-FTIR spectrometer (Nicolet 6700 ATR-FTIR Spectrometer, Thermo Electron Corporation, Waltham, MA, USA). In this ATR-FTIR spectrometer, the aperture is designed on a diamond prism surface, intended for attenuated total reflection-based measurements. 5 μL aliquots from each tested group that were placed on the diamond crystal plate of the ATR-FTIR Spectrometer were dried by the air flow from a narrow plastic tube connected to an air pump at room temperature for 30 min to be subsequently analyzed by the ATR-FTIR. The ATR-FTIR spectra were collected with a resolution of 0.48 cm−1. An average of 100 scans were totaled for each spectrum. The background for the ATR-FTIR spectra was a spectrum of empty ATR diamond crystals in the air.

3. Results

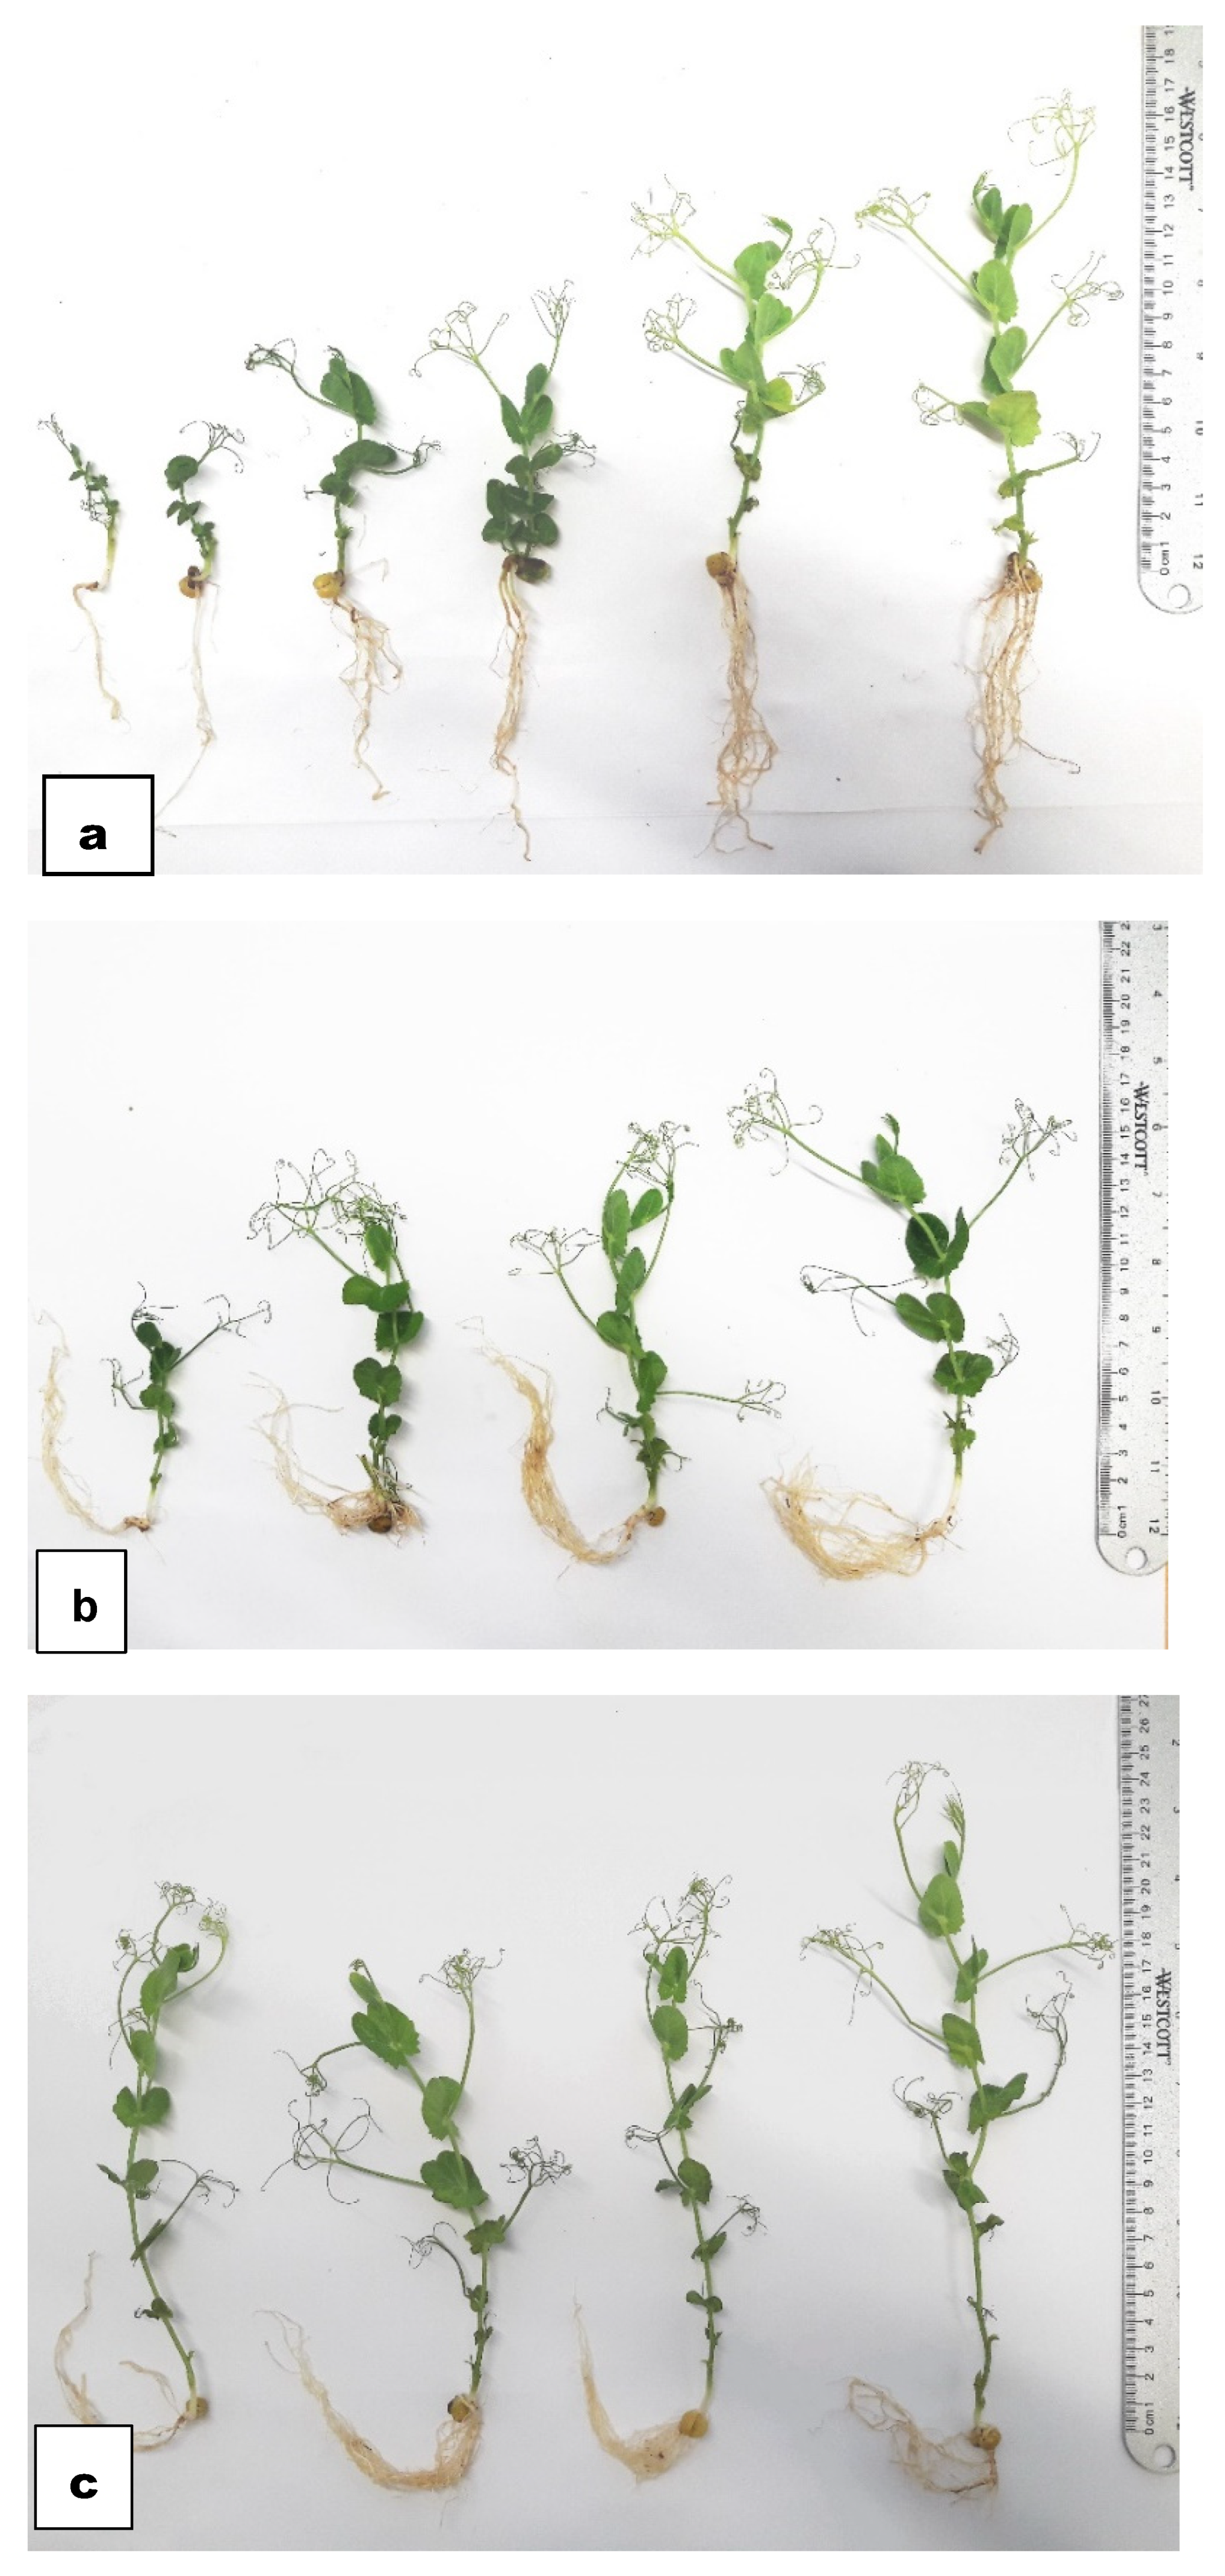
3.1. Morphological Results

There are a lot of physiological and biochemical interactions that occurred between CNTs and Au NPs in the pure water while they were passing the semipermeable Testa cell walls of the pea green seed coat. After the control group and NPs solution inducements to seeds, transportation started, and embryos were built; radicula developed the root; plumula developed the stem; and hipocotyl developed the part between plumula and radicula. Bioimages are showing the tested three groups, which have different morphologies of growth. Any leaflets (foliole) have developed on the stems of the seedlings regarding pea green in 3 weeks of growth time (Figure 1a–c).
Seeds were not papillose, and annual pea green seedlings had terete stems that were glabrous and glaucous. Control group seedling stems were about 5.2–14.3 cm, CNTs-treated ones were about 7.7–16.3 cm, and AuNPs-treated ones were about 17.7–23.8 cm. Stipules are obliquely ovate, dentate at least below the edges, rounded, and semi-amplexicaul at the base according to all groups; the stipule nodule number and measurements were given (in order); control group as 4–9 nodes/1.3–1.5 mm (the smallest stipule)/1.4–1.1 cm (the biggest stipule); CNTs group as 5–7 nodes/1.1–1.2 mm (the smallest stipule)/1.1–2.2 cm (the biggest stipule); AuNPs group as 8–9 nodes/1.3–3 mm (the smallest stipule)/0.9–1.8 cm (the biggest stipule). Control group tendril branches number is 1–5 and length is 1.2–6.1 cm; tendril branches number in CNTs is 3–6 and length is 2.2–7.3 cm; tendril branches number in AuNPs is 5–6 and length is 3.5–8.1 cm. Taproot is not dominant at all three stages of the seedlings but the lateral roots lengths are changing in three groups. Lateral roots, which are at different angles, length is right proportional to the stem length related control group (4.4–8.3 cm) but inversely proportional to the stem length as regards CNTs (7.4–9.3 cm) and AuNPs (7.4–9.4 cm) groups stem length.

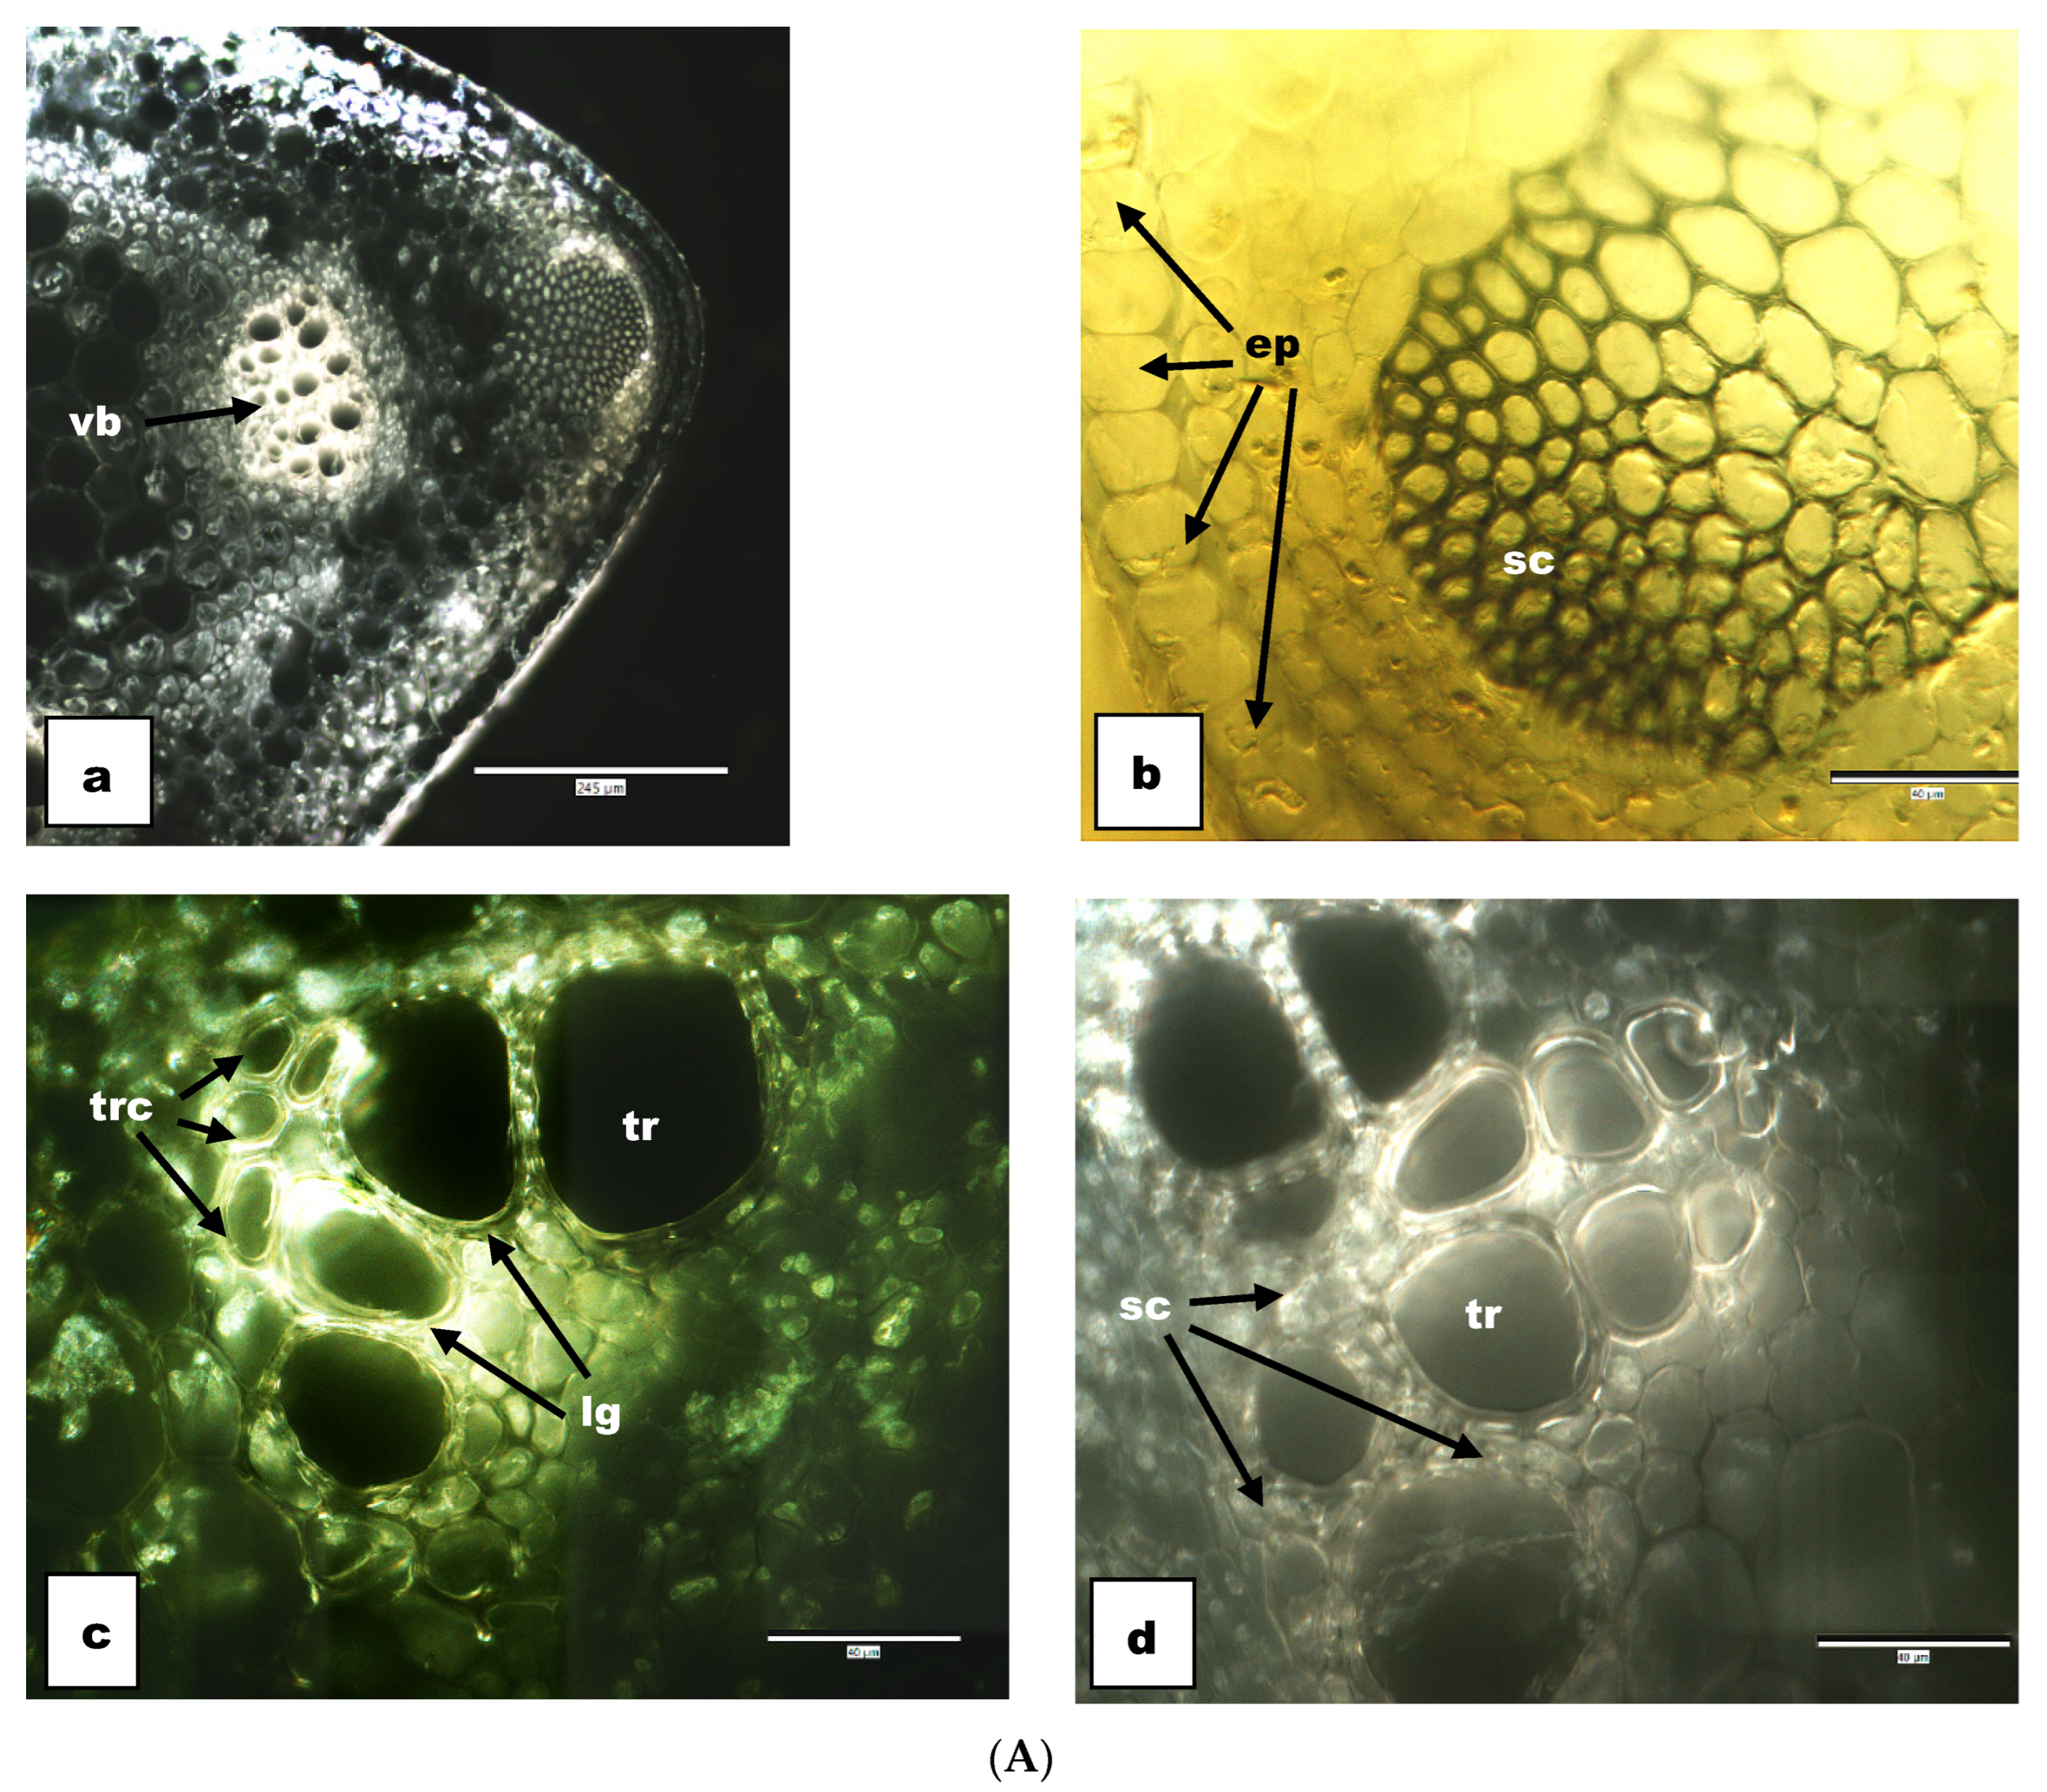
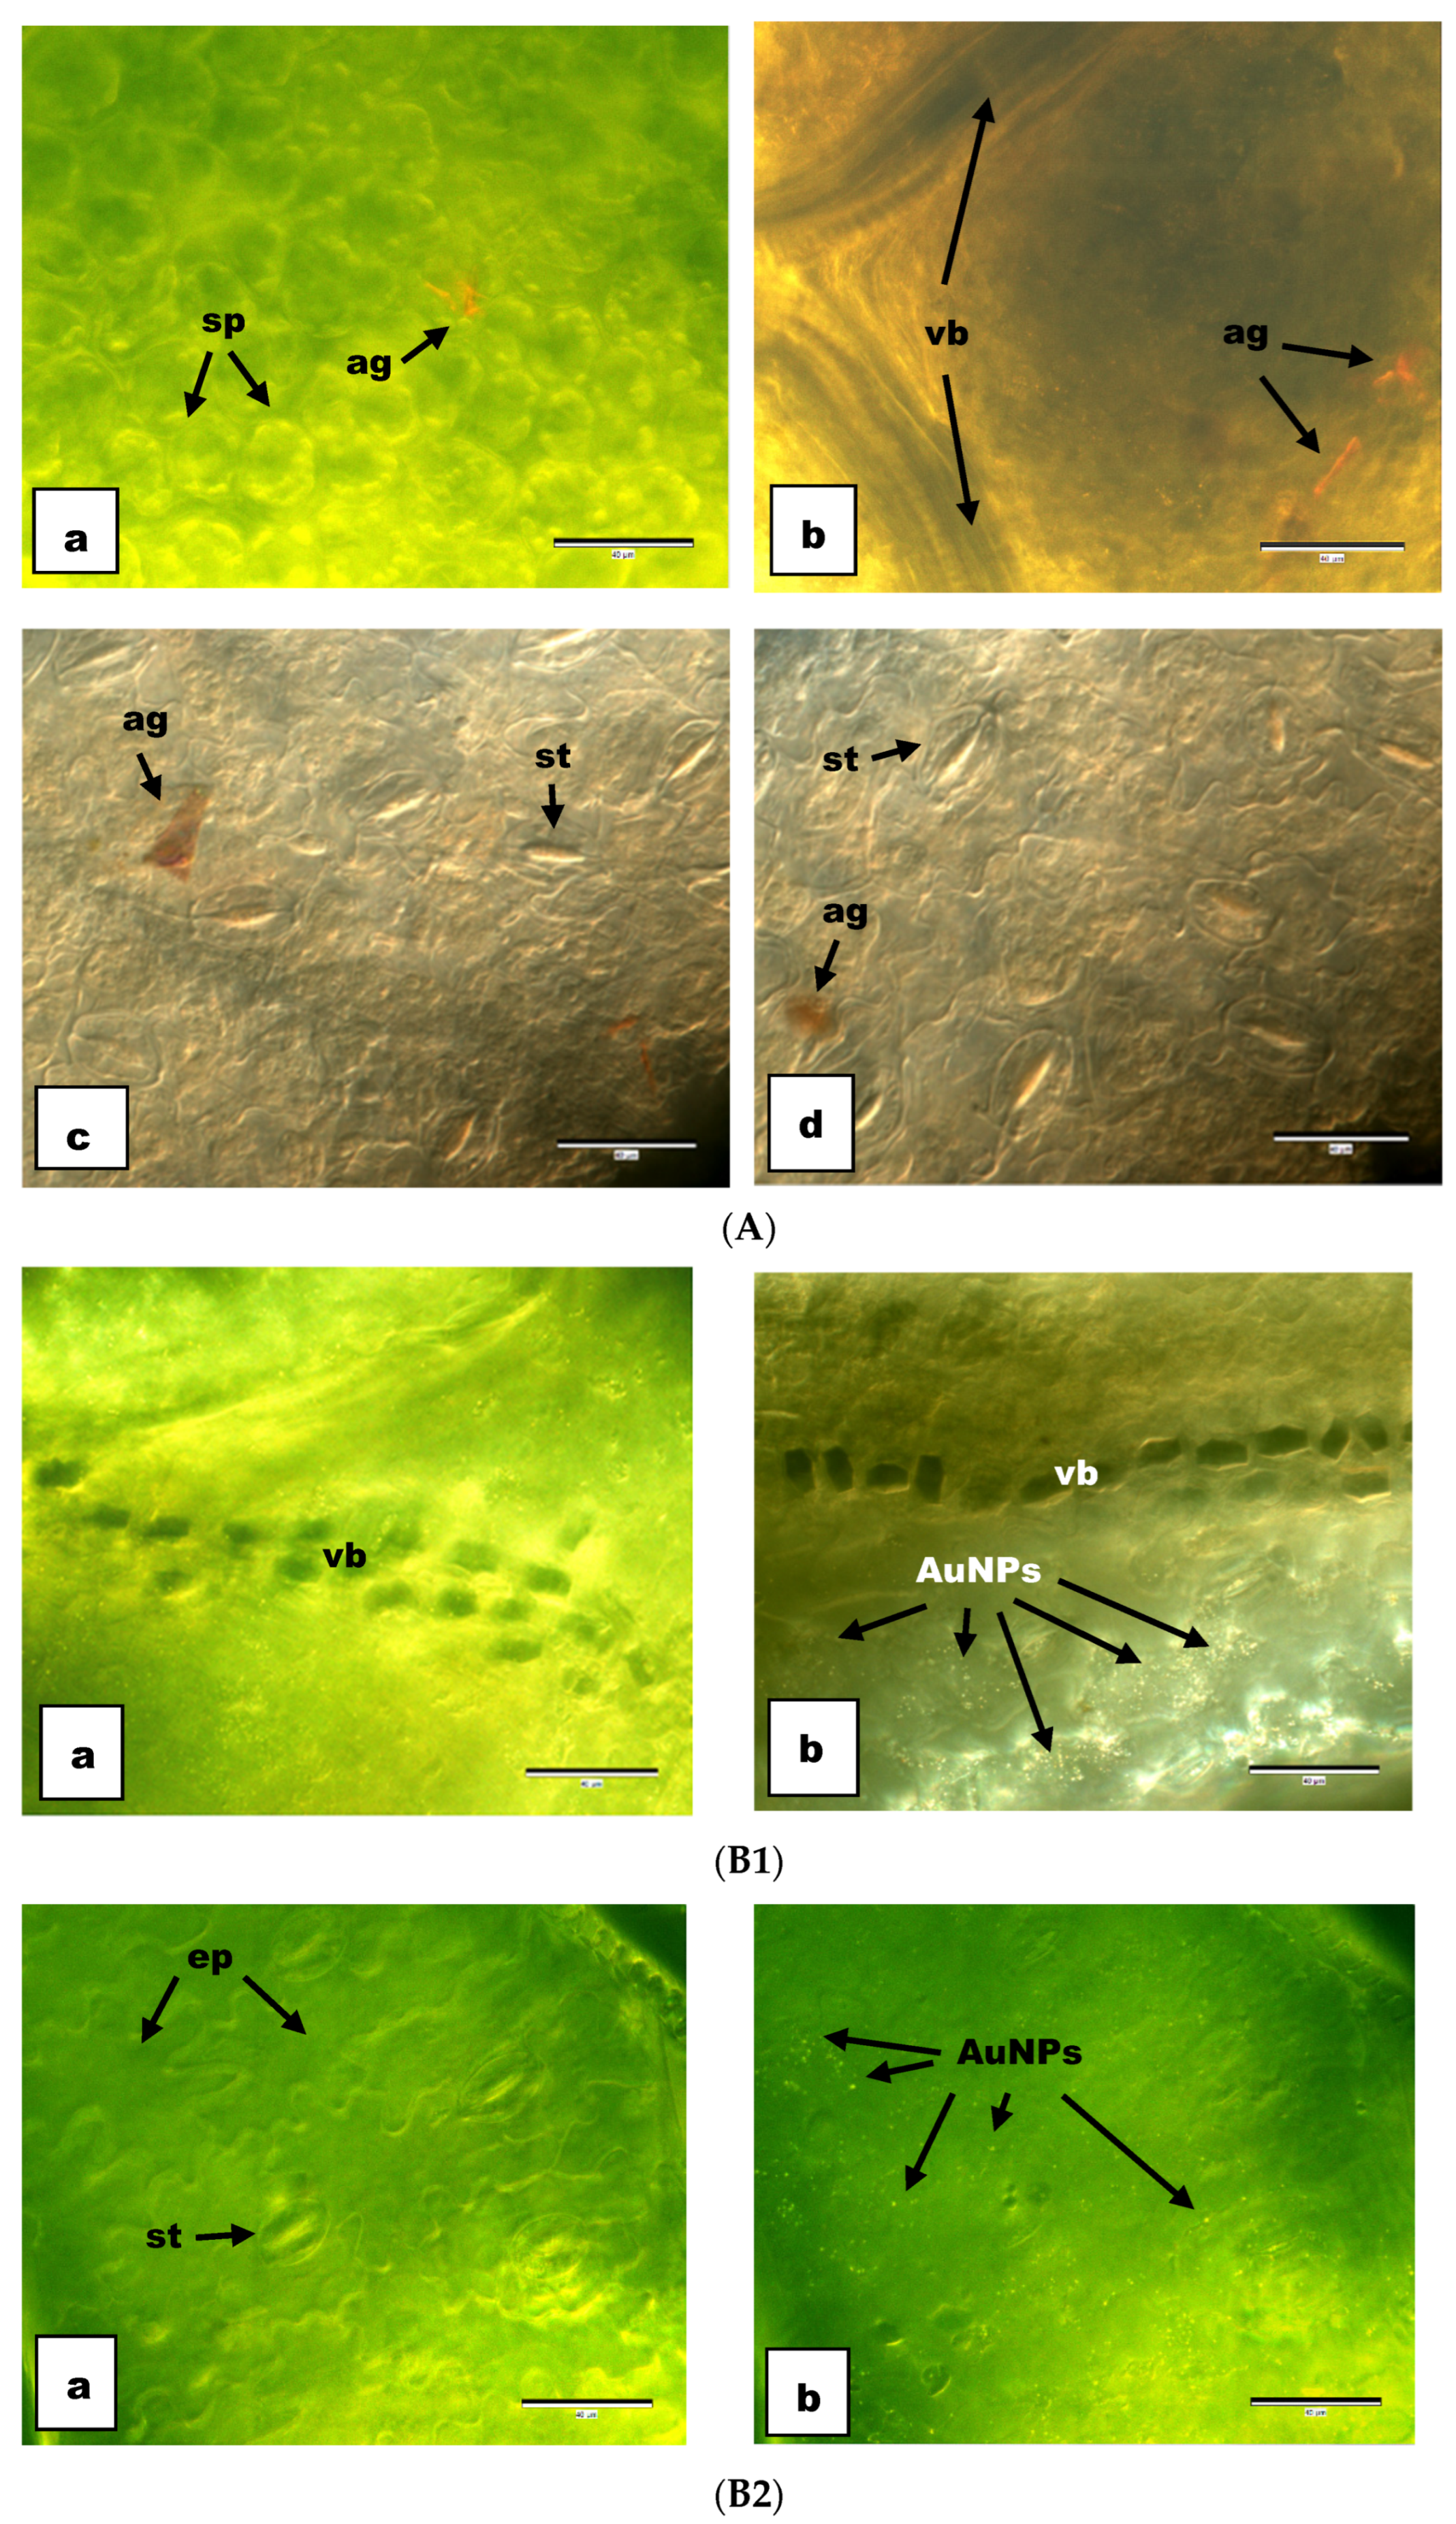
3.2. Anatomical Results

Anatomical data of meristematic tissues, such as root, stem, and stipule of seedlings, were stimulated by CNTs and AuNPs. Roots were at circular and stems were at square form for three groups. However, the stele of root and stem get wider after development of the nanoparticles. Epidermis cells outer walls has a thick cuticle layer at root and stem. CNTs and AuNPs increased the xylem and phloem components.
CNTs aggregates or CNTs particles were not observed between the vascular cylinder of root and epidermis which is named as cortex (Figure 2A). On the other hand, AuNPs were seen at the cortex as scattered particles (Figure 2B).
Enlargement of procambium regarding the stem tracheary cells, collateral vascular bundles, cortex elements, sclerenchymatic structure was investigated. Fibers and sclereids were not observed around phloem and xylem at the vascular bundles. There were not any CNTs and AuNPs observed at spiral arrangements of xylem bundles (Figure 3(Aa,b)). Considerable starch increment at phloem and lignification at xylems (trache and tracheids) were observed at CNPs inducement (Figure 3(Ac,d)). On the other hand, lenticels and cytoplasm of parenchymatous cells relating the stem were containing the AuNPs (Figure 3B).
According to superficial cross sections from the lamina of the stipules spongia cells of mesophyll and chloroplasts were seen easily. However, CNTs aggregates and AuNPs scattering particles were observed (Figure 4). CNTs aggregates were investigated in the spongia layer or on the epidermis layer (Figure 4A) but AuNPs were investigated especially in the stomata (guard cells, stomatal pore), epidermis cells including every parts of the lamina except veins (Figure 4(B1,B2)).

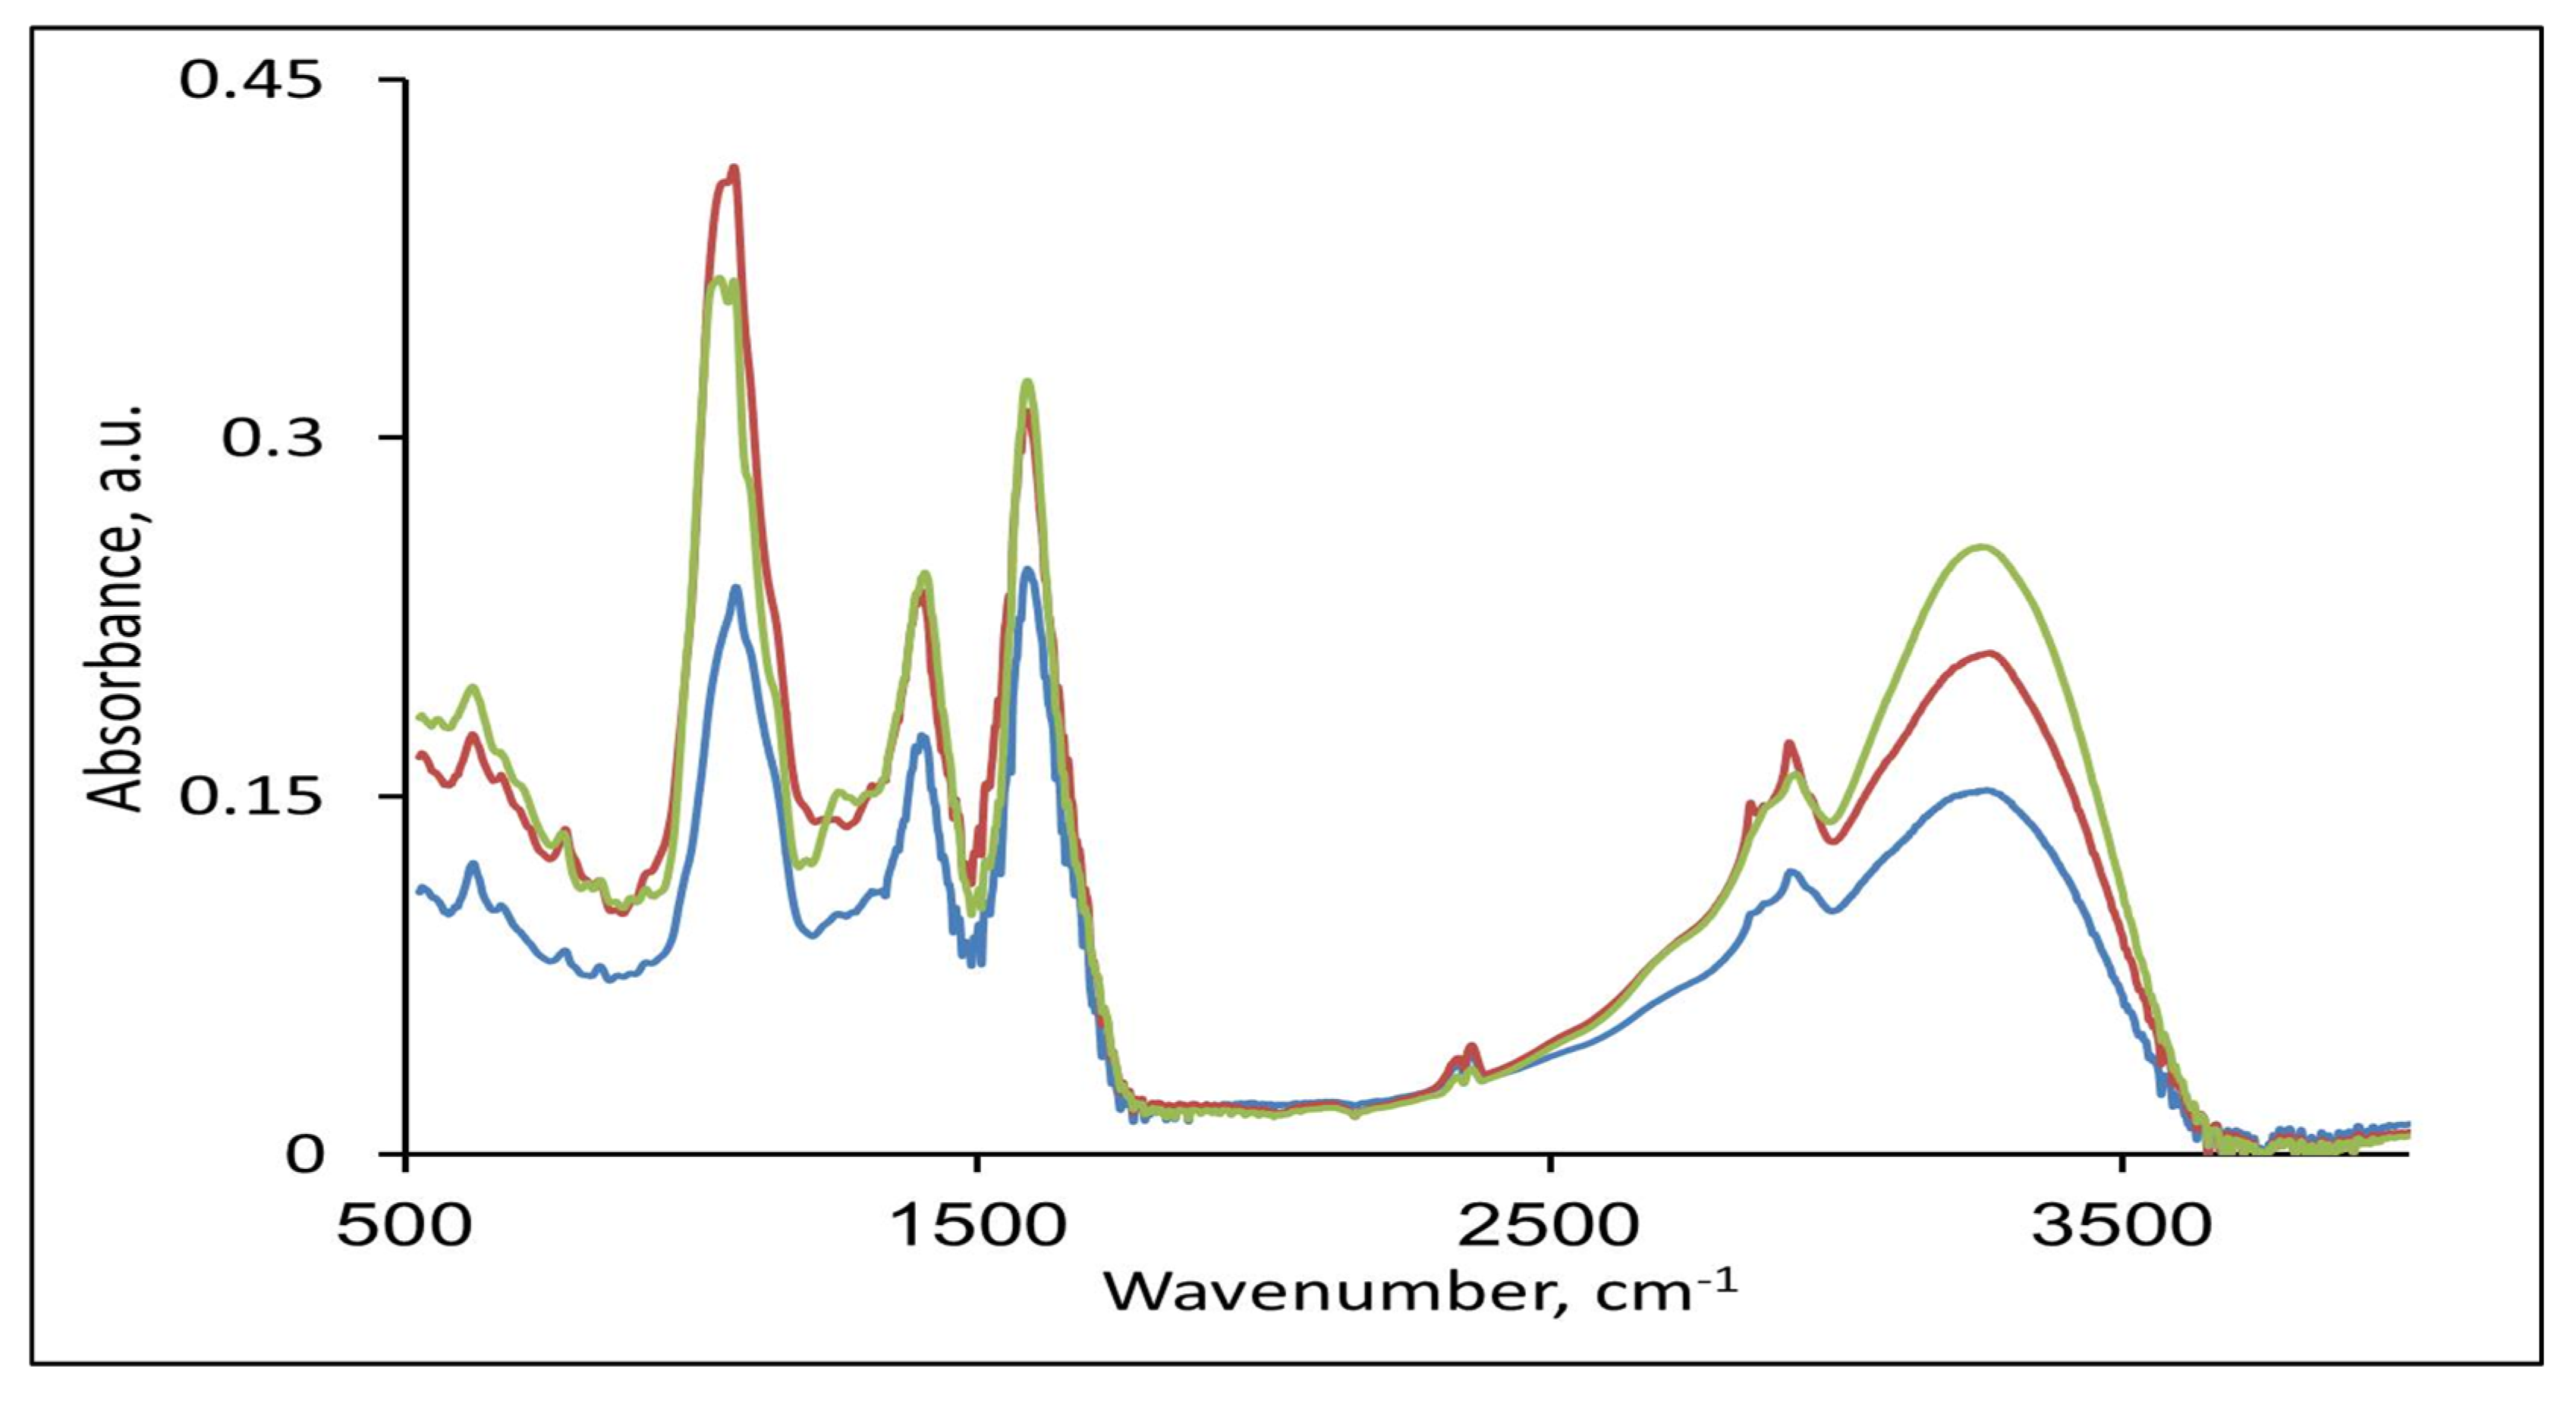
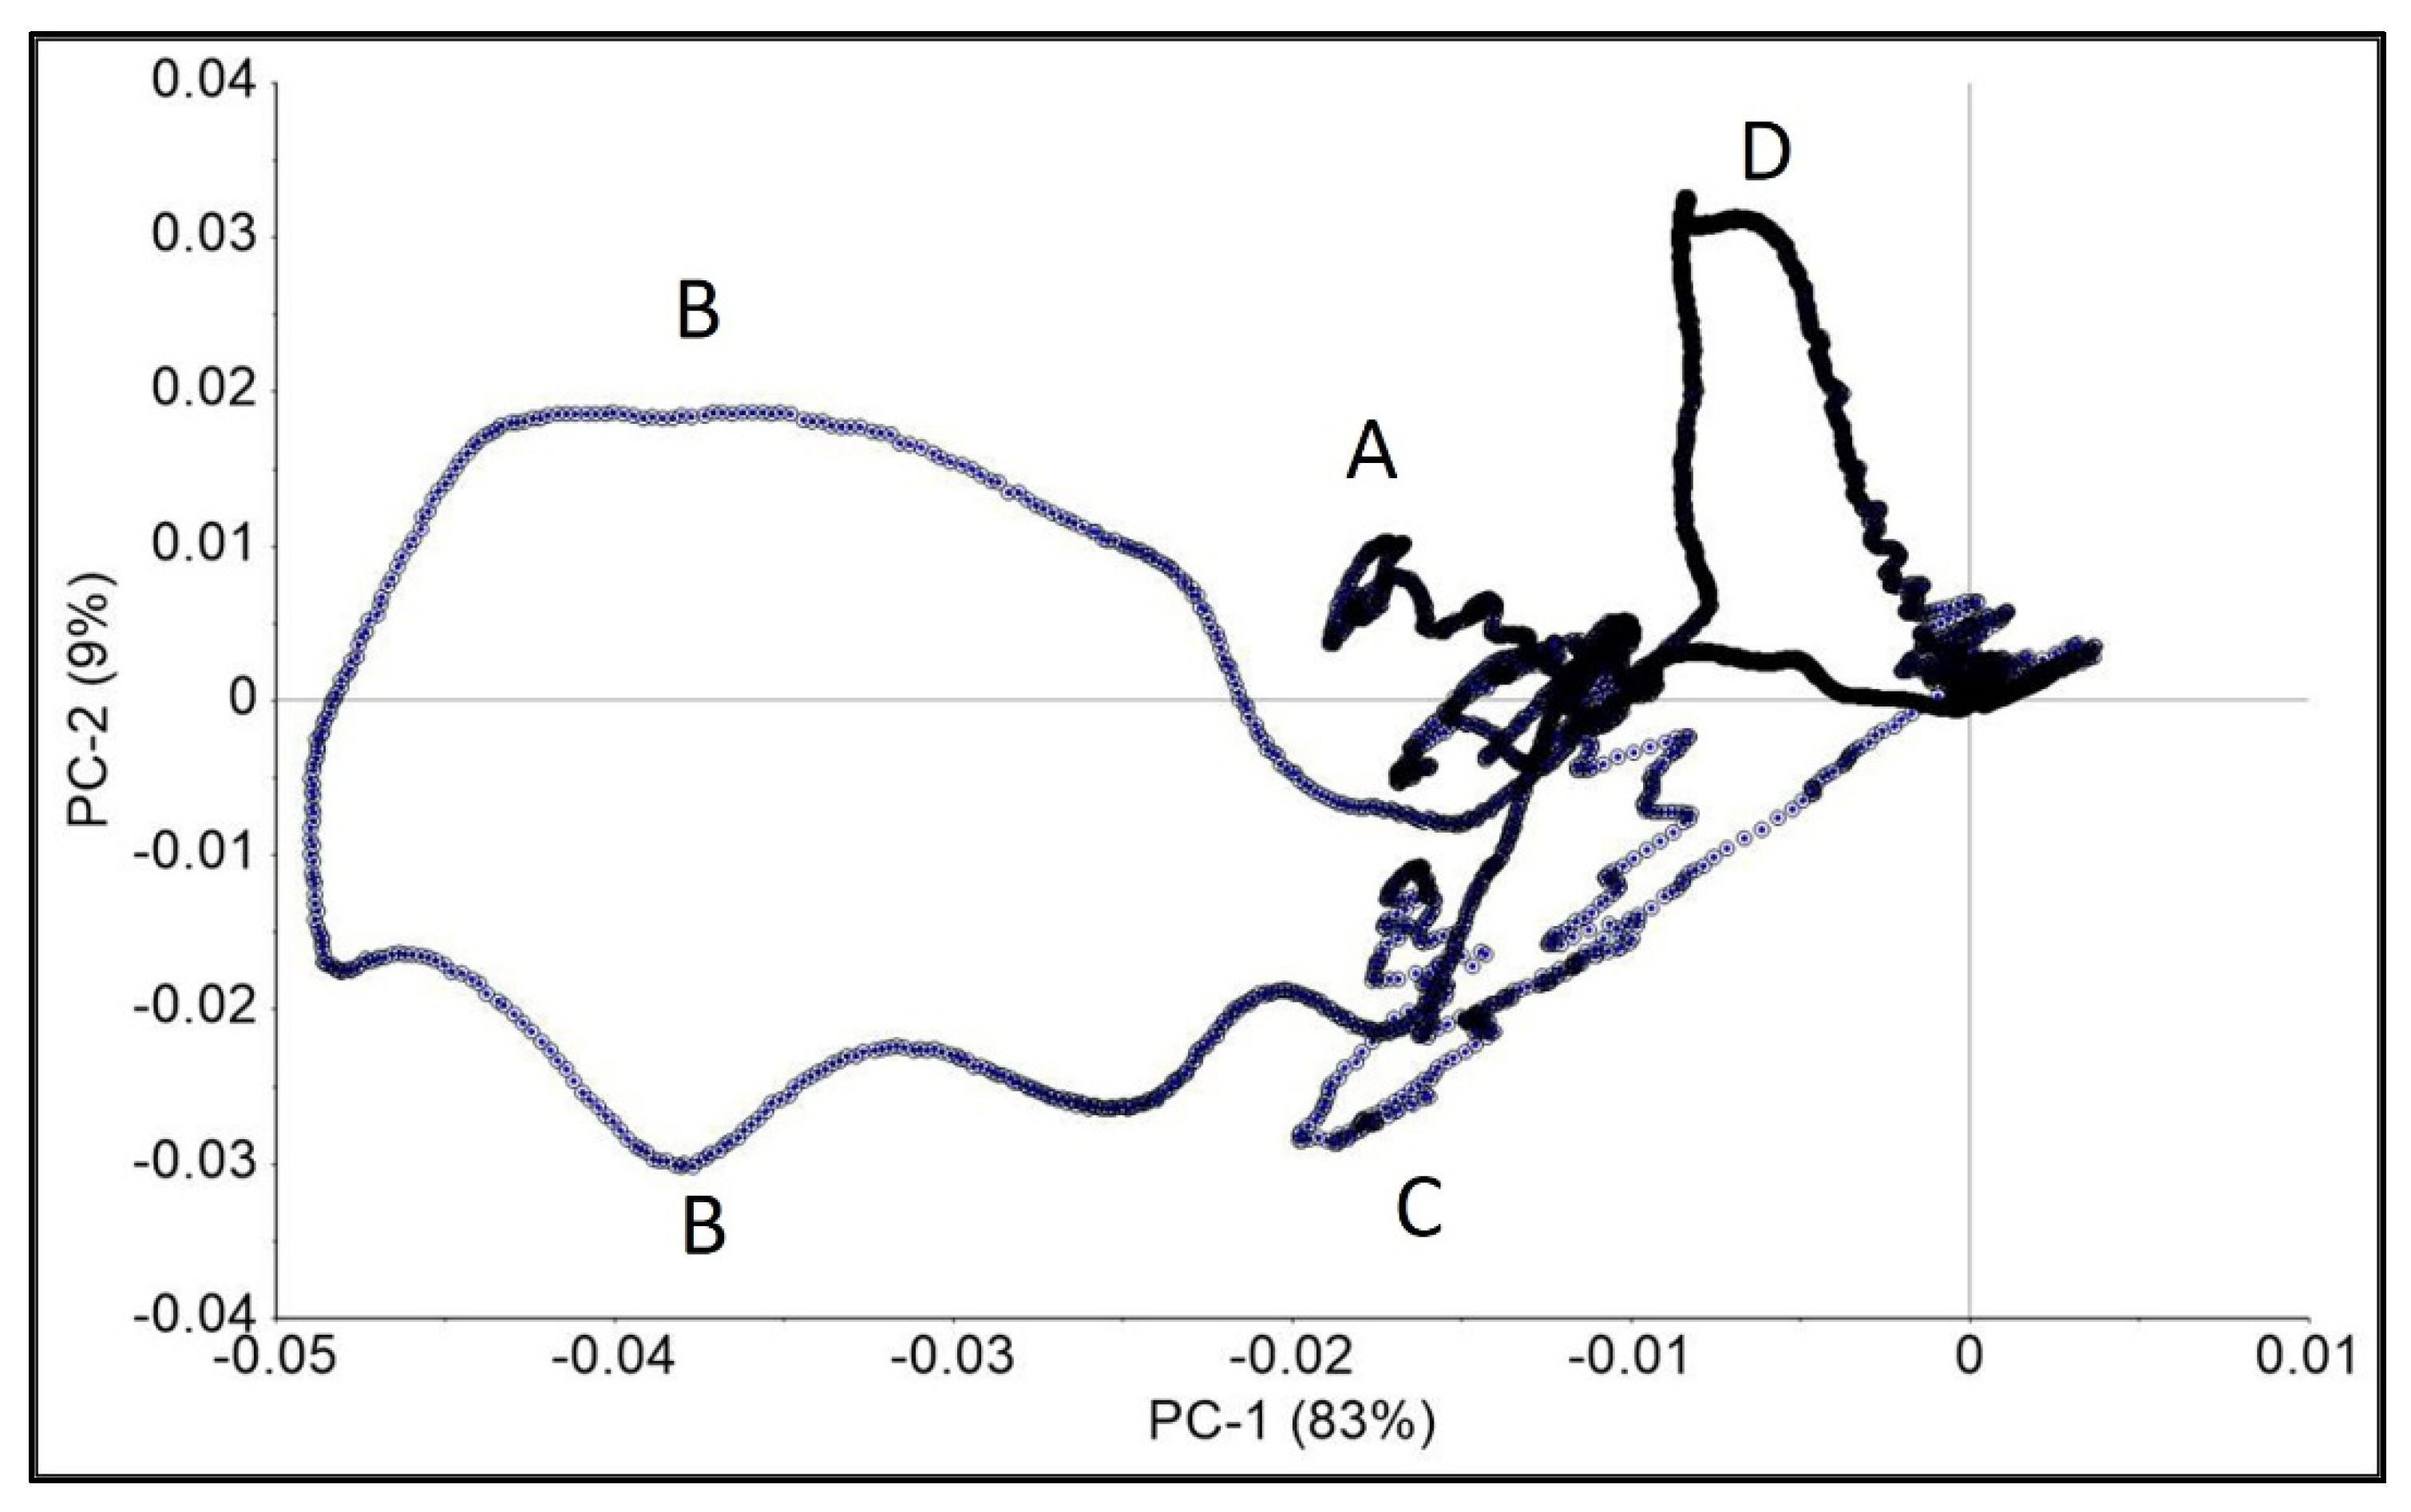
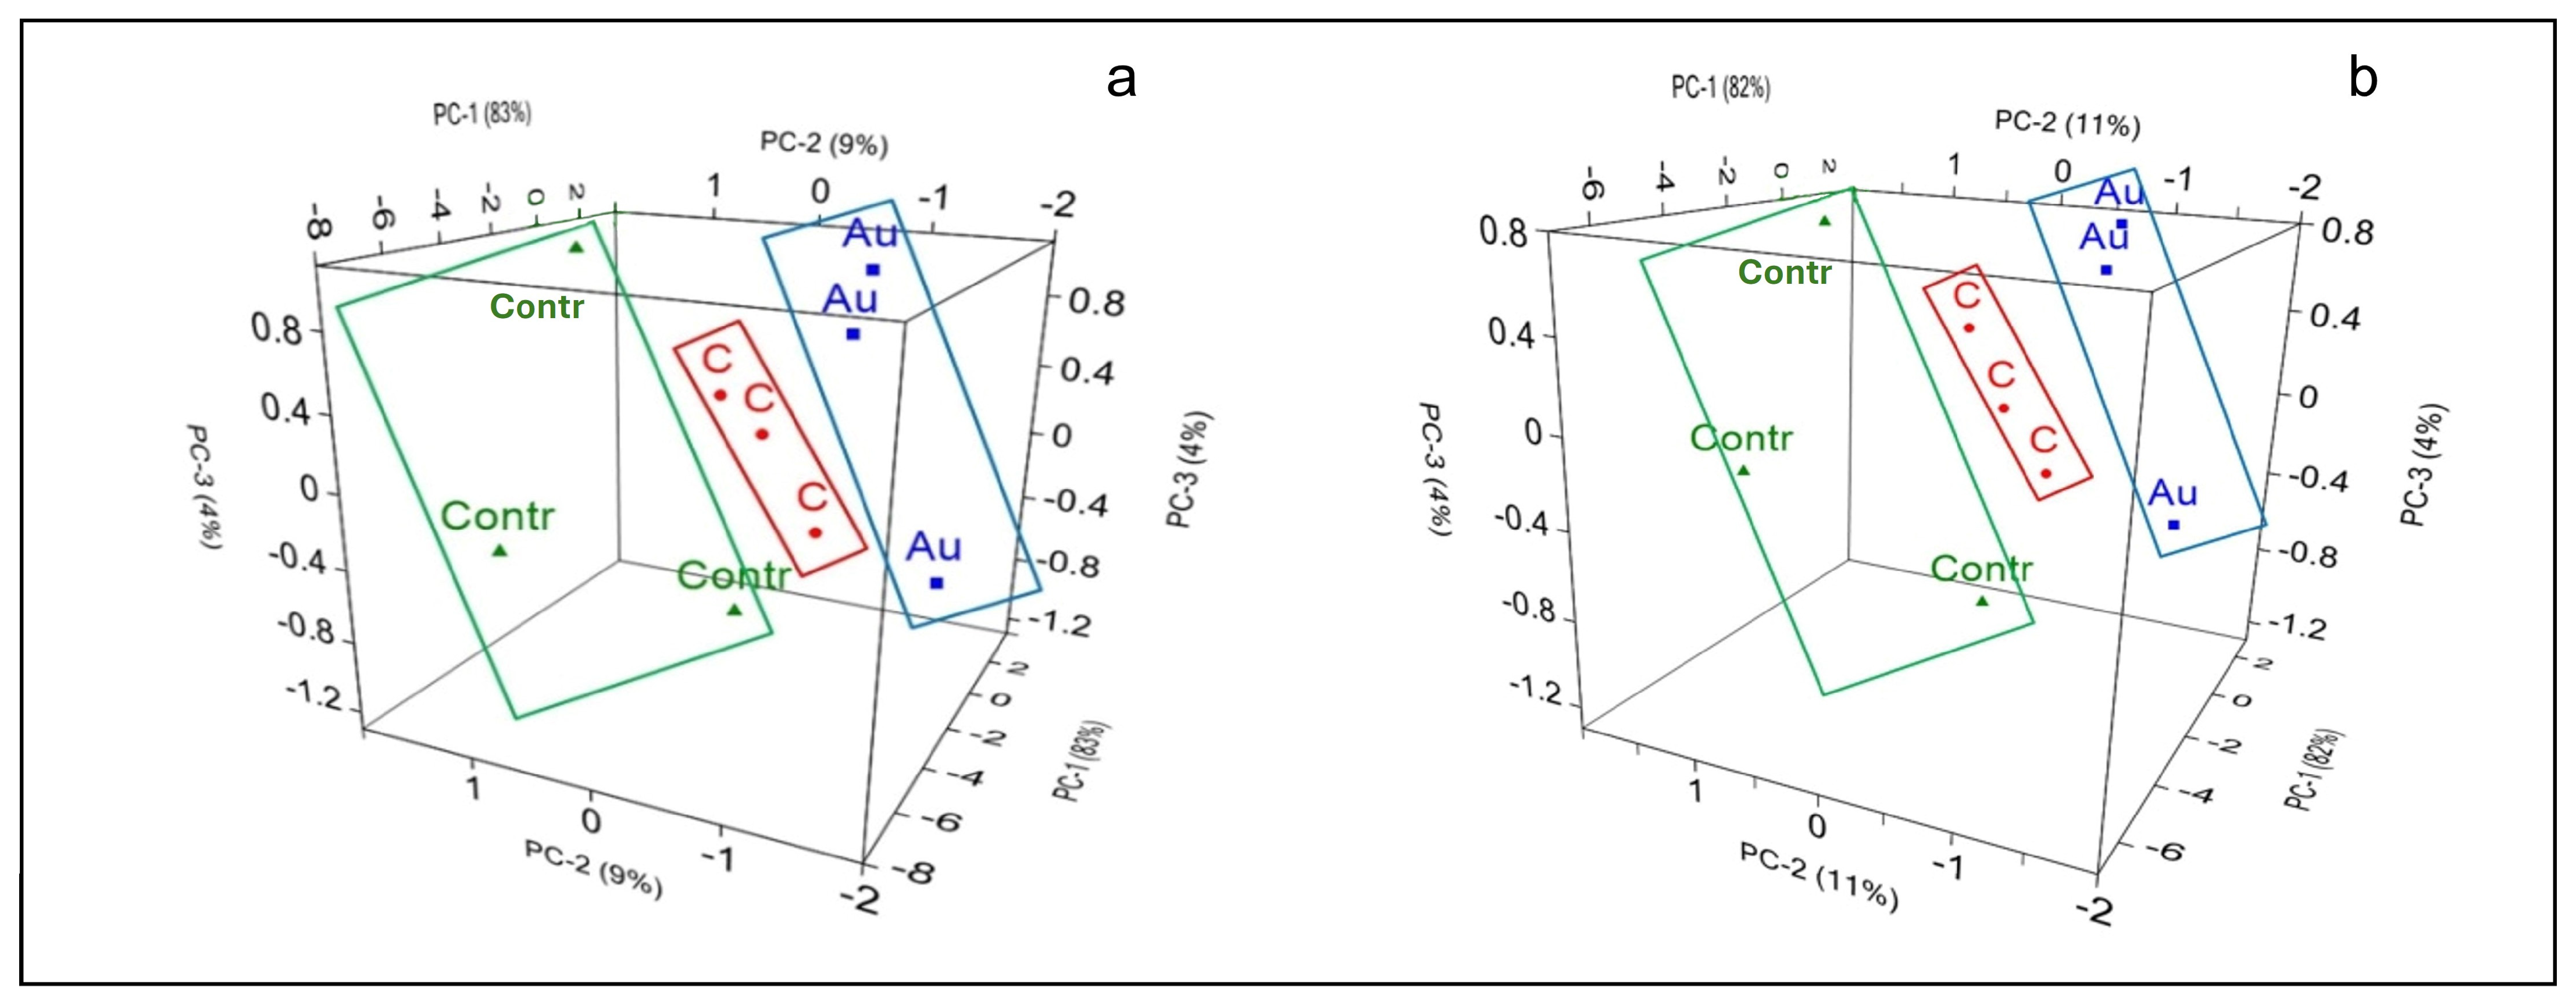
3.3. Spectroscopic Results

Previously, we reported the usefulness of combining infrared spectroscopy (specifically ATR-FTIR) and machine learning techniques, such as support vector machines (SVM), for monitoring the distribution and uptake of Au NPs and CNTs in C. arietinum samples [25]. Automatic classification of the ATR-FTIR spectra using an efficient statistical framework included PCA for reduction in dimensionality with the following SVM classification of spectral data for maximal separation of three different classes (namely, Au NPs-treated plants, CNTs-treated plants, and a control group of plants with no nanoparticle treatment) [25].
Figure 5 shows the two averaged ATR-FTIR spectra of green pea plant samples that were grown under the influence of Au NPs (blue) and CNTs (red) and the control one (green) for plants that were grown without nanoparticle exposure.
This study aimed to differentiate the chemical composition of a plant sample utilizing its spectroscopic data. As shown in Figure 5, which displays the ATR-FTIR spectra of the control group of Green Pea plant samples, as well as those treated with AuNPs and CNTs, there are no significant visual differences among the three spectra. This lack of distinction justified the use of machine learning techniques to analyze the chemical composition based on IR spectroscopy. The decision to use the PCA method in this study was influenced by our previous work with Chickpea plants [25], which concluded that PCA is one of the most robust and easy-to-implement algorithms for spectroscopic datasets.
We identified specific ATR-FTIR wavenumbers capable of distinguishing samples containing AuNPs or CNTs from aqueous extracts of Pisum sativum plants cultivated under their influence (i.e., wavenumber ranges A: 525–4000 cm−1; B: 525–646 cm−1, 962–1203 cm−1, 1499–1660 cm−1, 3075–3461 cm−1). Figure 6 illustrates the PCA loading plot to pinpoint variables (wavenumbers) with the greatest impact on the studied NPs. Larger PCA loadings signify a stronger influence on the component, while values closer to 0 indicate a weaker influence. Table 1 compares spectral ranges for PCA loading with stronger effects on PC for the following sample classes: (1) root, stem, and leaf samples of P. sativum plants grown under three conditions (column 1 in Table 1) and (2) specific ATR-FTIR spectral peaks/valleys of AuNPs (column 2 in Table 1) and CNTs (column 3 in Table 1).
The PCA loading variables for PC-1 and PC-2, as depicted in Figure 6, highlight peaks A, B, C, and D corresponding to spectral ranges detailed in Table 1 and Figure 6: range A at 525–646 cm−1; range B at 962–1203 cm−1; range C at 1499–1660 cm−1; and range D at 3075–3461 cm−1. These identified spectral ranges (A, B, C, and D) were used for dimensionality reduction through PCA and to visually separate plant samples treated with NPs using the PCA method.
In this study, we used three PCs for plotting PCA scores to visually separate three classes of interest related to plant growth conditions. Figure 3 shows the PCA score graph of the first three PCs for the ATR-FTIR spectral data of P. sativum.
In our investigation, we primarily utilized the initial two to three principal components (PCs) for classifying experimental data, influenced by our familiarity with three-dimensional space in daily life. Consequently, when visually examining the three-dimensional data (Figure 7), researchers inherently engage in relevant discrimination, prompting effective classification results through visual inspection.
Figure 7a,b depicts the PCA score plot of the first three PCs for the ATR-FTIR spectral data of P. sativum. The findings clearly indicate that even with just the first three PCs, we can successfully separate the samples into two groups treated with nanoparticles and one control group (Au NPs as blue squares, CNTs as red circles, and the control group as green triangles) using combined ATR-FTIR spectral data from P. sativum roots, stems, and leaves.

4. Discussion

In terms of plants, the term stress can be defined as the conditions affecting the growth, development, and yield of plants through abiotic (salinity, heavy metal accumulation, radiation, drought, low and high temperature, etc.) and biotic (disease-causing fungi, bacteria, viruses, pests, etc.) factors [48]. As climate change occurs, abiotic stress on agricultural production is an unavoidable threat to farmers’ ability to meet an increasing food demand. In response to these environmental conditions, plants have developed stress tolerance mechanisms by engaging various stress-responsive genes [49]. The importance of nanoparticle application to plants in countering abiotic stress and the physiological, biochemical, and molecular reactions include or cause various environmental and health results [50].
TiO NPs elongated roots in wheat and CNTs-AuNPs elongated seedlings in chickpeas [25,51]. P. sativum’s morphological root response was examined under fluoranthene stress and found to be reduced at the lateral numbers and growth [52]. Moreover, root lengths were all reduced, and root shape deformities were observed under the effects of silver nanoparticles (AgNPs) on green pea green seedlings [53]. According to our study, the longest stem, the higher the stipule number, and nearly similar root lengthiness but more lateral roots showed that AuNPs had more developer power on the pea green than CNTs. Hence, tendrils and branch length increasing in the AuNPs seedlings gave the seedlings strength for climbing and getting support (Figure 1).
There were some studies related to the anatomical structure changes of P. sativum seedlings after treatment with mophactin IT 3456, benzyladenine, fluoranthene and Cd. These chemicals and heavy metals affected the seedlings antagonistically [52,54,55]. On the other hand, iron doping was found to be a useful approach to reducing the toxicity of ZnO NPs in terrestrial plants, and the green pea was selected as a model for them [33]. Nano-CuO and bCuO improved the green pea’s nutritional quality, but exogenous indole-3-acetic acid combined with Cu-based compounds affected the green pea herbs and products negatively [34]. But according to our study, NPs increased all of the exogenous results. It was prepared to carry out comparative microscopical testing on plant material, which demonstrated the most positive response of plant growth to tested treatments compared to control. But antimicrobial and other detailed examinations must be carried out in the future.
CNT aggregates are in regular form; shapes were filiform, angular, deltate, rombic, eliptic, ovate, rarely amorphous in the pea green. These shape regularities of the plant related to C70 NTs are very specific and adaptable to the pea green. On the other hand, AuNPs were penetrated in the cells; stomas, cytoplasm, organelles etc.; so, it was hard to observe them (Figure 2, Figure 3 and Figure 4). CNTs and AuNPs must be investigated at the central cylindrical part of the root and protoxylems.
According to this information about the C-Au NPs permeability of green pea cells, it can be thought that C and Au NPs use the apoplastic pathway. If so, the growth and development of the seedlings are triggered by an extracellular signal of CNTs and AuNPs. However, we have not seen the NPs at xylem and phloem, but they can affect the lignification of them, primary-secondary cell walls, and middle lamellae physiologically, so it is hard to think that symplastic pathways were used at the reactions (Figure 2, Figure 3 and Figure 4).
The formation of supported lipid bilayers and their passive penetration, endocytotic uptake, membrane permeabilization-containing interactions with gold nanoparticles were studied on cells [56]. The AuNPs that we used in this study at a 10 nm scale were very small particles for green pea metabolism because they were easily seen in most of the parts and cells of the plant in our investigation. For example, AuNPs were observed at the stem in the lenticels and cells. On the other hand, they were examined at the stomas and all the cells in the leaf. This means that AuNPs are taking part in respiration and photosynthesis together for pea green (Figure 2, Figure 3 and Figure 4). Cell membrane lipid bilayers of green pea may catch some of the AuNPs, and this will be important in cancer nanotechnology.
The anatomical investigation of heterotrophic starch formation in leaf segments of green pea and sugar was found to be effective equally in all tissues [57]. In our study, the numerous tracheal elements tend to be crowded toward the stem periphery under NPs inducement; this is an organized network that makes easy endogenous transportation. Further, a lot of starch particles were observed at the phloem as a result of increased photosynthesis by C AuNPs (Figure 3A).
Eco-friendly green synthesis regarding plant extracts without chemicals includes an important place in nanotechnology. Chrysanthemum morifolium Ramat extract for synthesizing Ag Nps (2 mmol/L) and their successful implementation in clinical ultrasound gel [58]. As such, taking Au or other NPs from soil with green pea can be an effective method for their green synthesis.
Carbon nanotubes were used in cancer therapies [11]. AuNPs were synthesized from Vitex negundo (Lamiaceae) used for tumor targets [59] and from Gymnema sylvestre (Apocynaceae) used to show cytotoxic effects towards Hep2 cells [60]. However, green synthesis of NPs from Fabaceae family members, for example, Glycyrrhiza glabra, was used for treatment of Gastric ulcer [26]. In light of this information, it can be concluded that the green synthesis of NPs via green pea can be used for medicinal purposes.
The obtained results clearly showed that the PCA score plots based on just the first three PCs were satisfactory in achieving clear visual separation of all three groups: (1) Au NPs-treated plants; and (2) CNTs-treated plants; and (3) a control group of plants with no nanoparticle treatment-related classes (Au NPs as blue squares, CNTs as red circles, and the control group as green triangles) for ATR-FTIR combined spectral data of P. sativum stem, leaf, and root samples (all plant parts ATR-FTIR spectral data were combined for the analysis).
By comparing the spectra of the Au NPs and CNTs samples (Figure 5), four specific spectral ranges were identified: 525–646 cm−1, 962–1203 cm−1, 1499–1660 cm−1, 3075–3461 cm−1, to be used for dimensionality reduction and visual separation of the classes by PCA of the aqueous extracts of P. sativum used as a model plant grown under the influence of Au NPs and CNTs. The spectral ranges were selected based on larger PCA loadings of P. sativum. ATR-FTIR spectra (Figure 6, Table 1), which also partially overlap spectral ranges with distinct visual differences between the spectra of Au NPs and CNTs samples (Figure 5).
Other model plants from different families were used as extracellular studies for the synthesis of Au via UV–visible absorption spectra with different peaks: Azadirachta indica (Meliaceae, 550 nm) [61], Geranium graveolens (Geraniaceae, 440 nm) [62], Parthenium hysterophorus (Asteraceae, 474 nm) [63], and Aloe vera (Xanthorrhoeaceae, 50–350) [64]. However, there are a few reports made with ATR-FTIR spectra as regards some families with some peaks: Azadirachta indica (1725, 1615, 1140, 1076 cm−1) [61], Cicer arietinum (450–503, 750–870, 1022–1218 cm−1 [25].
Moreover, as shown in Figure 7, the PCA score plots based on just the initial three PCs are sufficient for the visual separation of all three groups, which include Au NPs-treated plants, CNTs-treated plants, and the control group of plants with no nanoparticle treatment. For the current work, we compare the spectral range 525–646 cm−1 + 962–1203 cm−1 + 1499–1660 cm−1 + 3075–3461 cm−1 (Figure 7b) chosen for PCA by stronger effect on the PCs, combined according to Table 1 with the whole available ATR-FTIR spectral range 525–4000 cm−1 (Figure 7a) for performing the PCA.
In Figure 7a, the first principal component (PC1) accounts for 83% of the variability in the data, the second principal component (PC2) for 9%, and the third principal component (PC3) for 4%. Combined, the first three principal components explain approximately 96% of the total variability. Similarly, in Figure 7b, PC1 explains 82% of the variability, PC2 explains 11%, and PC3 explains 4%, with the first three principal components together accounting for 97% of the total variability. The high percentage of variability explained by the first three principal components indicates that these components capture most of the information in the data. This effectively reduces the dataset’s dimensionality while preserving the majority of the original variability, facilitating easier visualization, analysis, and application of machine learning algorithms without significant information loss. Comparing the entire available ATR-FTIR spectral range (525–4000 cm−1) with the spectral range determined by larger PCA loadings, which indicate a stronger influence on the component (525–646 cm−1 + 962–1203 cm−1 + 1499–1660 cm−1 + 3075–3461 cm−1), shows that both sets of principal components capture a similar proportion of the data’s variability. This ensures consistent and reliable dimensionality reduction across different datasets.
In our study, we utilized the above-mentioned simplified analytical process, keeping in mind some possible future in-field applications of ATR-FTIR, with the ultimate goal of learning the level of uptake and presence evaluation of nanoparticles in plants in an actual natural farm environment.

5. Conclusions

Several studies have been published in regard to biogenesis or green synthesis of nanoparticles, but the morphological, anatomical, and spectral study with exogenous-endogenous ways reveals the accumulation of NPs in the economic plant green pea (P. sativum) was studied with this investigation first. Our findings show that the green pea and Fabaceae family have more advantages in the biological synthesis of C-Au nanoparticles, and they will guide soil health, agricultural development, pharmaceuticals, drug delivery science, and other types of medicinal investigations with a new approach. On the other hand, the Fabaceae family, which includes a lot of economic plants, will be available for green synthesis of more NPs with single and rapid protocols and will be a popular family in nano-biotechnological studies in the next decade.

Author Contributions

F.C. initiated, designed, and conducted initial methods and analysis of data. Y.M. performed spectroscopic analyses, provided resources and facilities, and analyzed the data. G.O. assisted with the preparation and sample analyzing logistics, provided resources and funding, participated in spectroscopic analysis, and co-advised students trained in this project with Y.M. All authors were involved in manuscript preparation. All authors have read and agreed to the published version of the manuscript.

Funding

This research was partially supported by USDA NIFA CBG Grant Award # 2017-38821-26439 as part of the Student Experiential Learning Program.

Data Availability Statement

Generated data are available upon request from the authors. Authors’ e-mail addresses are provided as: F. Candan at [email protected]; Y. Markushin at [email protected]; and G. Ozbay at [email protected].

Acknowledgments

We give thanks to Noureddine Melikechi and Dyremple Marsh for their administrative supports for this project to be conducted on Delaware State University campus. We extend our special thanks to Qi Lu for making her lab available for this project and Aaliyah Lackings for assisting with sampling and analyzing spectroscopic images. Students were provided training with various techniques used in this project.

Conflicts of Interest

The authors declare no conflict of interest.

References

  1. Ju, Y.; Li, X.; Ju, L.; Feng, H.; Tan, F.; Cui, Y.; Yang, Y.; Wang, X.; Cao, J.; Qiao, P.; et al. Nanoparticles in the Earth surface systems and their effects on the environment and resource. Gondwana Res. 2022, 110, 370–392. [Google Scholar] [CrossRef]
  2. Saber, N.B.; Mezni, A.; Alrooqi, A.; Altalhi, T. A review of ternary nanostructures based noble metal/semiconductor for en-vironmental and renewable energy applications. J. Mater. Res. Technol. 2020, 9, 15233–15262. [Google Scholar] [CrossRef]
  3. Mubayi, A.; Chatterji, S.; Rai, P.M.; Watal, G. The present study represents a clean, non-toxic as well as eco-friendly procedure for synthesizing AgNPs. Adv. Mater. Lett. 2012, 3, 519–525. [Google Scholar] [CrossRef]
  4. De Dios, A.S.; Diaz-Garcia, M.E. Multifunctional Nanoparticles: Analytical Prospects. Anal. Chim. Acta 2010, 666, 1–22. [Google Scholar] [CrossRef]
  5. McNeil, S.E. Nanotechnology for the biologist. J. Leukoc. Biol. 2005, 78, 585–594. [Google Scholar] [CrossRef]
  6. Iijima, S. Synthesis of Carbon Nanotubes. Nature 1991, 354, 56–58. [Google Scholar] [CrossRef]
  7. Iijima, S.; Ichihashi, T. Single-Shell Carbon Nanotubes of 1-nm Diameter. Nature 1993, 363, 603–605. [Google Scholar] [CrossRef]
  8. Dinadayalane, T.C.; Leszczynski, J. Remarkable diversity of carbon–carbon bonds: Structures and properties of fullerenes, carbon nanotubes, and graphene. Struct. Chem. 2010, 21, 1155–1169. [Google Scholar] [CrossRef]
  9. Subramoney, S. Novel Nanocarbons-Structure, Properties, and Potential Applications. Adv. Mater. 1998, 10, 1157–1171. [Google Scholar] [CrossRef]
  10. Lin, Y.; Taylor, S.; Li, H.; Fernando, K.A.S.; Qu, L.; Wang, W.; Gu, L.; Zhou, B.; Sun, Y.-P. Advances toward bioapplications of carbon nanotubes. J. Mater. Chem. 2004, 14, 527–541. [Google Scholar] [CrossRef]
  11. Kiran, A.R.; Kumari, G.K.; Krishnamurthy, P.T. Carbon nanotubes in drug delivery: Focus on anticancer therapies. J. Drug Deliv. Sci. Technol. 2020, 59, 101892. [Google Scholar] [CrossRef]
  12. Collins, P.G.; Arnold, M.S.; Avouris, P. Engineering Carbon Nanotubes and Nanotube Circuits Using Electrical Breakdown. Science 2001, 292, 706–709. [Google Scholar] [CrossRef]
  13. Mintmire, J.; White, C. Electronic and structural properties of carbon nanotubes. Carbon 1995, 33, 893–902. [Google Scholar] [CrossRef]
  14. Ruoff, R.S.; Lorents, D.C. Mechanical and thermal properties of carbon nanotubes. Carbon 1995, 33, 925–930. [Google Scholar] [CrossRef]
  15. Hassan, H.; Sharma, P.; Hasan, M.R.; Singh, S.; Thakur, D.; Narang, J. Gold nanomaterials—The golden approach from synthesis to applications. Mater. Sci. Energy Technol. 2022, 5, 375–390. [Google Scholar] [CrossRef]
  16. Tiwari, J.N.; Tiwari, R.N.; Kim, K.S. Zero-dimensional, one-dimensional, two-dimensional and three-dimensional nanostruc-tured materials for advanced electrochemical energy devices. Prog. Mater. Sci. J. 2012, 57, 724–803. [Google Scholar] [CrossRef]
  17. Bhattacharya, R.; Mukherjee, P. Biological properties of “naked” metal nanoparticles. Adv. Drug Deliv. Rev. J. 2008, 60, 1289–1306. [Google Scholar] [CrossRef]
  18. Connor, E.E.; Mwamuka, J.; Gole, A.; Murphy, C.J.; Wyatt, M.D. Gold Nanoparticles Are Taken Up by Human Cells but Do Not Cause Acute Cytotoxicity. Small 2005, 1, 325–327. [Google Scholar] [CrossRef]
  19. Papasani, M.R.; Wang, G.; Hill, R.A. Gold nanoparticles: The importance of physiological principles to devise strategies for targeted drug delivery. Nanomed. Nanotechnol. Biol. Med. 2012, 8, 804–814. [Google Scholar] [CrossRef]
  20. Dykman, L.; Khlebtsov, N. Gold nanoparticles in biomedical applications: Recent Advances and Perspectives. Chem. Soc. Rev. 2012, 41, 2256–2282. [Google Scholar] [CrossRef]
  21. Tiwari, P.M.; Vig, K.; Dennis, V.A.; Singh, S.R. Functionalized gold nanoparticles and their biomedical applications. Nanomaterials 2011, 1, 31–63. [Google Scholar] [CrossRef] [PubMed]
  22. Chuang, Y.-C.; Li, J.-C.; Chen, S.-H.; Liu, T.-Y.; Kuo, C.-H.; Huang, W.-T.; Lin, C.-S. An optical biosensing platform for proteinase activity using gold nanoparticles. Biomaterials 2010, 31, 6087–6095. [Google Scholar] [CrossRef] [PubMed]
  23. Mieszawska, A.J.; Mulder, W.J.M.; Fayad, Z.A.; Cormode, D.P. Multifunctional Gold Nanoparticles for Diagnosis and Therapy of Disease. Mol. Pharm. 2013, 10, 831–847. [Google Scholar] [CrossRef] [PubMed]
  24. Sibuyi, N.R.S.; Moabelo, K.L.; Fadaka, A.O.; Meyer, S.; Onani, M.O.; Madiehe, A.M.; Meyer, M. Multifunctional Gold Nanoparticles for Improved Diagnostic and Therapeutic Applications: A Review. Nanoscale Res. Lett. 2021, 16, 174. [Google Scholar] [CrossRef] [PubMed]
  25. Candan, F.; Markushin, Y.; Ozbay, G. Uptake and Presence Evaluation of Nanoparticles in Cicer arietinum L. by Infrared Spectroscopy and Machine Learning Techniques. Plants 2022, 11, 1569. [Google Scholar] [CrossRef] [PubMed]
  26. Sreelakshmy, V.; Deepa, M.K.; Mridula, P. Green synthesis of silver nanoparticles from Glycyrrhiza glabra root extract for the treatment of gastric ulcer. J. Dev. Drugs Open Access 2016, 5, 152. [Google Scholar] [CrossRef]
  27. Toledo, A.C.O.; De, D.P.D.S.F.; Boscardin, P.M.D.; De Paula, J.D.F.P. Biosynthesis and characterization of silver nanoparticles pro-duced with aqueous extract of Pterodon emarginatus Vogel-Fabaceae seeds associated with gentamicin sulfate and hyaluronic acid with potential antimicrobial activity. Braz. J. Dev. 2020, 6, 100655–100677. [Google Scholar] [CrossRef]
  28. Ghosh, B.; Datta, A.K.; Pramanik, A.; Kumbhakar, D.V.; Das, D.; Paul, R.; Biswas, J. Mutagenic Effectivity of Cadmium Sulphide and Copper Oxide Nanoparticles on Some Physiological and Cytological Attributes of Lathyrus sativus L. Cytologia 2017, 82, 267–271. [Google Scholar] [CrossRef]
  29. Bapi, G.; Kumar, D.A.; Debadrito, D.; Vishambhar, K.D.; Ankita, P. Assessment of nanoparticles (copper, cadmium sulphide, copper oxide and zinc oxide) mediated toxicity in a plant system (Indigofera tinctoria L.; Fabaceae). Res. J. Chem. Environ. 2018, 22, 34–48. [Google Scholar]
  30. Chatterjee, A.; Ajantha, M.; Talekar, A.; Revathyr, N.; Abraham, J. Biosynthesis, antimicrobial and cytotoxic effects of titanium dioxide nanoparticles using Vigna unguiculata seeds. Int. J. Pharmacogn. Phytochem. Res. 2017, 9, 95–99. [Google Scholar] [CrossRef]
  31. Tauseef, A.; Hisamuddin; Khalilullah, A.; Uddin, I. Role of MgO nanoparticles in the suppression of Meloidogyne incognita, infecting cowpea and improvement in plant growth and physiology. Exp. Parasitol. 2021, 220, 108045. [Google Scholar] [CrossRef] [PubMed]
  32. Tariverdizadeh, N.; Mohebodini, M.; Chamani, E.; Ebadi, A. Iron and zinc oxide nanoparticles: An efficient elicitor to enhance trigonelline alkaloid production in hairy roots of fenugreek. Ind. Crop. Prod. 2021, 162, 113240. [Google Scholar] [CrossRef]
  33. Mukherjee, A.; Pokhrel, S.; Bandyopadhyay, S.; Mädler, L.; Peralta-Videa, J.R.; Gardea-Torresdey, J.L. A soil mediated phy-to-toxicological study of iron doped zinc oxide nanoparticles (Fe@ZnO) in green peas (Pisum sativum L.). Chem. Eng. J. 2014, 258, 394–401. [Google Scholar] [CrossRef]
  34. Ochoa, L.; Medina-Velo, I.A.; Barrios, A.C.; Bonilla-Bird, N.J.; Hernandez-Viezcas, J.A.; Peralta-Videa, J.R.; Gardea-Torresdey, J.L. Modulation of CuO nanoparticles toxicity to green pea (Pisum sativum Fabaceae) by the phytohormone indole-3-acetic acid. Sci. Total. Environ. 2017, 598, 513–524. [Google Scholar] [CrossRef] [PubMed]
  35. Davis, P.H.; Pisum, L. Flora of Turkey and East Aegean Islands; Edinburgh University Press: Great Britain, UK, 1970; Volume 3, pp. 370–372. [Google Scholar]
  36. Jing, R.; Ambrose, M.A.; Knox, M.R.; Smykal, P.; Hybl, M.; Ramos, Á.; Caminero, C.; Burstin, J.; Duc, G.; van Soest, L.J.M.; et al. Genetic diversity in European Pisum germplasm collections. Theor. Appl. Genet. 2012, 125, 367–380. [Google Scholar] [CrossRef]
  37. Makasheva, R.X. Peas. The Cultural Flora of the USSR; Cereal Legumes; Kolos: Leningrad, Russia, 1979; Volume 4, p. 324. [Google Scholar]
  38. Poltoretskyi, S.; Karpenko, V.; Liubych, V.; Poltoretska, N.; Bilonozhko, V.; Demydas, H. Morphological and ecological features of green pea (Pisum sativum L.). Ukranian J. Ecol. Melitopol 2022, 12, 12–19. [Google Scholar] [CrossRef]
  39. Dyachenko, E.A.; Ryzhova, N.N.; Vishnyakova, M.A.; Kochieva, E.Z. Molecular genetic diversity of the pea (Pisum sativum L.) from the Vavilov Research Institute collection detected by the AFLP analysis. Russ. J. Genet. 2014, 50, 916–924. [Google Scholar] [CrossRef]
  40. Vaughan, J.C.; Geissler, C.A. The New Oxford Book of Foodplants; Oxford University Press: New York, NY, USA, 2009; p. 249. [Google Scholar]
  41. Marcano, A.; Pokrajac, D.; Lazarevic, A.; Smith, M.; Markushin, Y.; Melikechi, N. Statistical Analysis for Automatic Identification of Ovarian Cancer Protein-Biomarkers Based on Fast Fourier Transform Infrared Spectroscopy: Fourier Transforms-New Analytical Approaches and FTIR Strategies; InTech–Open Press: London, UK, 2011; Chapter 8; pp. 147–166. [Google Scholar]
  42. Jolliffe, I.T. Principal Component Analysis; Springer: New York, NY, USA, 2002; p. 518. [Google Scholar]
  43. Pokrajac, D.; Lazarevic, A.; Kecman, V.; Marcano, A.; Markushin, Y.; Vance, T.; Reljin, N.; McDaniel, S.; Melikechi, N. Automatic classification of laser-induced breakdown spectroscopy (LIBS) data of protein biomarker solutions. Appl. Spectrosc. 2014, 68, 1067–1075. [Google Scholar] [CrossRef] [PubMed]
  44. Rico, C.M.; Majumdar, S.; Duarte-Gardea, M.; Peralta-Videa, J.R.; Gardea-Torresdey, J.L. Interaction of nanoparticles with edible plants and their possible implications in the food chain. J. Agric. Food Chem. 2011, 27, 3485–3498. [Google Scholar] [CrossRef]
  45. Schwab, F.; Zhai, G.; Kern, M.; Turner, A.; Schnoor, J.L.; Barriers, W. Pathways and processes for uptake, translocation and accumulation of nanomaterials in plants—Critical review. Nanotoxicology 2016, 10, 257–278. [Google Scholar] [CrossRef]
  46. Shekhawat, G.S.; Mahawar, L.; Rajput, P.; Rajput, V.D.; Minkina, T.; Singh, R.K. Role of engineered carbon nanoparticles (CNPs) in promoting growth and metabolism of Vigna radiata (L.) Wilczek: Insights into the biochemical and physiological responses. Plants 2021, 10, 1317. [Google Scholar] [CrossRef]
  47. Fahn, A. Plant Anatomy, 3rd ed.; Bjorn Walles; Nordic Society Oikos: Oxford, UK; Pergamon, Turkey, 1982; ISBN 0-08-0280293. [Google Scholar] [CrossRef]
  48. Gull, A.; Lone, A.A.; Wani, N.U.I. Biotic and Abiotic Stresses in Plants. In Abiotic and Biotic Stress in Plants; De Oliveira, A.B., Ed.; IntechOpen: London, UK, 2019. [Google Scholar] [CrossRef]
  49. Pereira, A. Plant Abiotic Stress Challenges from the Changing Environment. Front. Plant Sci. 2016, 7, 1123. [Google Scholar] [CrossRef] [PubMed]
  50. Al-Khayri, J.M.; Rashmi, R.; Surya Ulhas, R.; Sudheer, W.N.; Banadka, A.; Nagella, P.; Aldaej, M.I.; Rezk, A.A.S.; Shehata, W.F.; Almaghasla, M.I. The Role of Nanoparticles in Response of Plants to Abiotic Stress at Physiological, Biochemical, and Molecular Levels. Plants 2023, 12, 292. [Google Scholar] [CrossRef] [PubMed]
  51. Larue, C.; Laurette, J.; Herlin-Boime, N.; Khodja, H.; Fayard, B.; Flank, A.-M.; Brisset, F.; Carriere, M. Accumulation, translocation and impact of TiO2 nanoparticles in wheat (Triticum aestivum spp.): Influence of diameter and crystal phase. Sci. Total Environ. 2012, 431, 197–208. [Google Scholar] [CrossRef] [PubMed]
  52. Kummerová, M.; Zezulka, S.; Babula, P.; Váňová, L. Root response in Pisum sativum and Zea mays under fluoranthenestress: Morphological and anatomical traits. Chemosphere 2013, 90, 665–673. [Google Scholar] [CrossRef] [PubMed]
  53. Labeeb, M.; Badr, A.; Haroun, S.A.; Mattar, M.Z.; El-Kholy, A.S.; El-Mehasseb, I.M. Ecofriendly Synthesis of Silver Nanoparticles and Their Effects on Early Growth and Cell Division in Roots of Green Pea (Pisum sativum L.). Gesunde Pflanz. 2020, 72, 113–127. [Google Scholar] [CrossRef]
  54. El-Okkiah, S.A.F.; El-Tahan, A.M.; Ibrahim, O.M.; Taha, M.A.; Korany, S.M.; Alsherif, E.A.; AbdElgawad, H.; Sen, E.Z.F.A.; Sharaf-Eldin, M.A. Under cadmium stress, silicon has a defensive effect on the morphology, physiology, and anatomy of pea (Pisum sativum L.) plants. Front. Plant Sci. 2022, 13, 997475. [Google Scholar] [CrossRef] [PubMed]
  55. Smoliñski, M.; Saniewski, M.; PieniaZek, J. The changes in anatomical structures in Pisum sativum L. seedlings after treatment with morphactin IT 3456 and benzyladenine. Acta Soc. Bot. Pol. 1969, XXXVIII, 303–308. [Google Scholar]
  56. Melby, E.S.; Mensch, A.C.; Lohse, S.E.; Hu, D.; Orr, G.; Murphy, C.J.; Hamers, R.J.; Pedersen, J.A. Formation of supported lipid bilayers containing phase-segregated domains and their interaction with gold nanoparticles. Environ. Sci. Nano 2016, 3, 45–55. [Google Scholar] [CrossRef]
  57. Kutík, J.; Beneš, K. The anatomical study of heterotrophic starch formation in leaf segments of maize and pea. Biol. Plant. 1981, 23, 52–57. [Google Scholar] [CrossRef]
  58. He, Y.; Du, Z.; Lv, H.; Jia, Q.; Tang, Z.; Zheng, X. Green synthesis of silver nanoparticles by Chrysanthemum morifolium Ramat. Extract and their application in clinical ultrasound gel. Int. J. Nanomed. 2013, 8, 1809–1815. [Google Scholar] [CrossRef] [PubMed]
  59. Devi, P.R.; Kumar, C.S.; Selvamani, P.; Subramanian, N.; Ruckmani, K. Synthesis and characterization of Arabic gum capped gold nanoparticles for tumor-targeted drug delivery. Mater. Lett. 2015, 139, 241–244. [Google Scholar] [CrossRef]
  60. Nakkala, J.R.; Mata, R.; Bhagat, E.; Sadras, S.R. Green synthesis of silver and gold nanoparticles from Gymnema sylvestre leaf extract: Study of antioxidant and anticancer activities. J. Nanopart. Res. 2015, 17, 151. [Google Scholar] [CrossRef]
  61. Shankar, S.S.; Ahmad, A.; Rai, A.; Sastry, M. Rapid synthesis of Au, Ag and bimetallic Au core-Ag shell nanoparticles by using neem (Azadirachta indica) leaf broth. J. Colloid Interface Sci. 2004, 275, 496–502. [Google Scholar] [CrossRef] [PubMed]
  62. Safaepour, M.; Shahverdi, A.R.; Shahverdi, H.R.; Khorramizadeh, M.R.; Gohari, A.R. Green synthesis of small silver nanoparticles using geraniol and its cytotoxicity against fibrosarcoma-wehi 164. Avicenna J. Med. Biotechnol. (AJMB) 2009, 1, 111–115. [Google Scholar] [PubMed]
  63. Parashar, V.; Parashar, R.; Sharma, B.; Pandey, A.C. Parthenium leaf extract mediated synthesis of silver nanoparticles: A novel approach towards weed utilization. Dig. J. Nanomater. Biostructures 2009, 4, 45–50. [Google Scholar]
  64. Chandran, S.P.; Chandhary, M.; Pasricha, R.; Ahmad, A.; Sastry, M. Synthesis of gold nanotriangles and silver nanoparticles using Aloe vera plant extract. Biotechnol. Prog. 2006, 22, 577–583. [Google Scholar] [CrossRef]
Figure 1. (a) Photo of green pea seedlings of the control group, (b) samples treated with: CNTs, and (c) samples treated with AuNPs, Ruler: 30 cm (Pictures taken by F. Candan).
Agronomy 14 01473 g001
Figure 2. (A) Cross sections of root exposed CNTs (a,b) cortex cells. 40 μm scale bar. (B) Cross sections of root exposed AuNPs (a,c) cortex cells (b,d) cortex cells and AuNPs view after microscrew movement, 40 μm scale bar.
Agronomy 14 01473 g002
Figure 3. (A) Cross sections of stem exposed CNTs (a) collateral vascular bundles (vb) general view (b) epidermis cells (ep) with thick cuticle and sclerenchyma (sc) (c) trache (tr) and tracheids (trc) with distinct lignin (lg) (d) trache (tr) and starch (sc) particles. Scale bar: (a) 245 μm (bd) 40 μm. (B) Longitudinal sections of stem exposed AuNPs (a) xylem (xy) (b) lenticel (le) and parenchymatous cells (pr) with AuNPs. 40 μm scale bar.
Agronomy 14 01473 g003aAgronomy 14 01473 g003b
Figure 4. (A) Superficial sections of stipule exposed to CNTS (a) spongia cells (sp) and CNTs filiform, amorphous aggregates (ag), (b) vascular bundles (vb), mesophyll layer and CNTs filiform aggregates (ag), (c) stomas (st), and angular CNTs aggregate (ag), (d) stomas (st), eliptic CNTs aggregate (ag). 40 μm scale bar. (B1) Superficial sections of stipule exposed to AuNps (a) vascular bundle (vb) (b) vascular bundle (vb) and AuNPs in the parenchymatous cells. 40 μm scale bar. (B2) Superficial sections of stipule exposed to AuNps (a) stoma (st) and epidermis cells (ep) (b) AuNPs view after microscrew movement. Scale bar: 40 μm.
Agronomy 14 01473 g004
Figure 5. ATR-FTIR averaged spectra of Pisum sativum plant samples influenced by Au NPs and CNTs. Note: Control—green line, Au NPs-treated plant—blue line, and CNTs-treated plants—red line.
Agronomy 14 01473 g005
Figure 6. PCA loading ATR-FTIR spectral ranges (A: 525–646 cm−1, B: 962–1203 cm−1, C: 1499–1660 cm−1, D: 3075–3461 cm−1) for Pisum sativum root, stem and leaf samples grown under three conditions (Class). See text and Table 1 for additional details.
Agronomy 14 01473 g006
Figure 7. The PCA score graphs of the first 3 principal components for ATR-FTIR spectral data of Pisum sativum grown at 3 conditions: Au: Au NPs-treated plants (blue), C: CNTs-treated plants (red) and Contr: control with no treatment (green). The spectral ranges used for PCA; (a): the whole spectral range: 525–4000 cm−1; (b): the combined spectral ranges: 525–646 cm−1 + 962–1203 cm−1 + 1499–1660 cm−1 + 3075–3461 cm−1. See text and Table 1 for additional details.
Agronomy 14 01473 g007
Table 1. Spectral ranges for PCA loading with stronger effects on the PC of the Pisum sativum root, stem and leaf samples grown with NPs in comparison with the ATR-FTIR spectral peaks/valleys of AuNPs and CNTs standard samples.
Spectral Ranges for PCA Loading with Stronger Effects on the PC for Pisum sativum L. Root, Stem and Leaf Samples Grown under Influence of NPs, cm−1ATR-FTIR Peaks, AuNPs-Standard, cm−1 [4]ATR-FTIR Peaks/Valleys (*) CNTs-Standard, cm−1 [4]
525–646 (A)450–503490–560 *
750–870790–850 *
962–1203 (B)1022–12181130–1260
1499–1660 (C), 3075–3461 (D)
Symbol (*) represents spectral valleys.
Disclaimer/Publisher’s Note: The statements, opinions and data contained in all publications are solely those of the individual author(s) and contributor(s) and not of MDPI and/or the editor(s). MDPI and/or the editor(s) disclaim responsibility for any injury to people or property resulting from any ideas, methods, instructions or products referred to in the content.

