Article

Climate Change Impacts on Future Wheat (Triticum aestivum) Yield, Growth Periods and Irrigation Requirements: A SALTMED Model Simulations Analysis

by
Junaid Nawaz Chauhdary
1,2,
Hong Li
1,*,
Ragab Ragab
3,
Md Rakibuzzaman
1,4,*,
Azeem Iqbal Khan
2,5,
Jing Zhao
1 and
Nadeem Akbar
6
1
Research Center of Fluid Machinery Engineering and Technology, Jiangsu University, Zhenjiang 212013, China
2
Water Management Research Centre, University of Agriculture, Faisalabad 38000, Pakistan
3
UK Centre for Ecology and Hydrology (UKCEH), Wallingford OX108BB, UK
4
Department of Mechanical Engineering, IUBAT—International University of Business Agriculture and Technology, Dhaka 1230, Bangladesh
5
Department of Plant Breeding and Genetics, University of Agriculture, Faisalabad 38000, Pakistan
6
Department of Agronomy, University of Agriculture, Faisalabad 38000, Pakistan
*
Authors to whom correspondence should be addressed.
Agronomy 2024, 14(7), 1484; https://doi.org/10.3390/agronomy14071484 (registering DOI)
Submission received: 30 May 2024 / Revised: 2 July 2024 / Accepted: 7 July 2024 / Published: 9 July 2024
(This article belongs to the Special Issue Crop Models for Agricultural Yield Prediction under Climate Change)

Abstract

:
Climate change poses emerging threats to wheat growth in coming future. These threats need to be explored to ensure sustainable wheat production. To do this, the SALTMED model was calibrated using data from experiments conducted on different levels of irrigation and nitrogen doses. The performance of the SALTMED model was assessed based on values of the root mean square error (RMSE), normalized root mean square error (NRMSE), coefficient of determination (R2) and coefficient of residual mass (CRM) that ranged from 0.23–1.82, 0.09–0.17, 0.91–0.93 and −0.01–0.02, respectively for calibration and 0.31–1.89, 0.11–0.31, 0.87–0.90 and −0.02–0.01, respectively for validation. Projections for future climate scenarios for wheat growth indicated that by the end of the century, sowing dates advanced by nine days under the RCP4.5 scenario and eleven days under the RCP8.5 scenario, while harvesting dates shifted earlier by twenty-four days under RCP4.5 and twenty-eight days under RCP8.5. Consequently, the overall crop duration was shortened by fifteen days under RCP4.5 and eighteen days under RCP8.5. Further simulations revealed that the wheat yield was reduced by 14.2% under RCP4.5 and 21.0% under RCP8.5; the dry matter was reduced by 14.9% under RCP4.5 and 23.3% under RCP8.5; the irrigation amount was expected to increase by 14.9% under RCP4.5 and 18.0% under RCP8.5; and water productivity was expected to be reduced by 25.3% under RCP4.5 and 33.0% under RCP8.5 until the end of century. The hypothetical scenarios showed that adding an extra 20–40% more nitrogen can enhance wheat yield and dry matter by 10.2–23.0% and 11.5–24.6%, respectively, under RCP4.5, and by 12.0–23.4% and 12.9–29.6%, respectively, under RCP8.5. This study offers valuable insights into the effects of climate change on future wheat production so that effective contingency plans could be made by policymakers and adopted by stakeholders for higher wheat productivity.

1. Introduction

Pakistan’s population is projected to grow at an annual rate of 2%, potentially doubling to 400 million in the near future. This rapid population growth poses a significant threat to food security [1]. Ensuring the country’s food security necessitates a focus on wheat production, which is a staple crop in Pakistan. Wheat is currently grown on 8.9 million hectares, yielding an annual production of 26.3 million tons [2]. As the primary food source for millions of people, maintaining and enhancing wheat production is critical for sustaining the country’s growing population.
Water availability is a pivotal element in wheat production. It is estimated that 70% of the world’s fresh water supply is consumed by agriculture [3]. Yet, global water resources are limited and suffering from inefficient water use efficiency at the farm level [4,5]. This challenge of water scarcity is especially acute in developing nations such as Pakistan, where there is considerable potential for agricultural output if adequate water resources are available to meet crop water needs [6]. One strategy to address this issue is the adoption of deficit irrigation, a method where water is supplied in amounts less than what would be considered full irrigation requirements [7]. By applying water below the crop’s full requirements, deficit irrigation can improve water use efficiency, an essential factor in areas experiencing water shortages. Assessing deficit irrigation is crucial for ensuring water adequacy and boosting wheat production in Pakistan’s semi-arid regions. Beyond water management, chemical fertilizers are crucial for enhancing wheat yields by providing the essential nutrients needed for the plants’ optimal growth and productivity. Nitrogen is a key nutrient that supports various plant physiological processes and is critical for wheat development [7]. Therefore, it is vital to tailor nitrogen management to the specific agricultural conditions of the area under study.
Climate change represents a significant global threat, impacting all sectors, including agriculture, that are crucial for food security. It poses risks to crop growth directly through more frequent and severe weather events, thus exacerbating the challenges faced by farmers worldwide [8]. Disrupted crop development can have serious consequences for countries like Pakistan, which rely heavily on an agriculture-based economy [2]. Additionally, Pakistan’s geography makes it particularly vulnerable to the impacts of climate change [9], and its agriculture sector is the primary victim of the adverse effects of climate change [10]. Extreme weather events such as droughts, floods, and heatwaves can severely impact crop yields and agricultural productivity. Despite these challenges, the agriculture sector remains a significant contributor to Pakistan’s economy. While the impacts of climate change on agriculture are widely acknowledged, there is a specific need for detailed, localized studies in Pakistan, particularly in the Punjab region, to understand how climatic variations will affect future wheat production. Future climate data are necessary for studying the impact of climate change on agricultural production systems. These data are provided by general circulation models (GCMs) and are widely used by scientists for environmental studies. These models help in predicting the impact of future climatic conditions on crop production. Crop–water–nitrogen models can simulate various aspects of crop response under these projected climate data sets, allowing for accurate predictions of future crop development and the adoption of better management strategies [11,12].
Crop–water simulation models like SALTMED are designed to integrate various factors, including water, soil, cultivar, nitrogen applications, environment, and crop processes, to accurately simulate crop growth [12,13]. SALTMED can simulate up to 20 fields simultaneously, covering various crops under diverse input conditions, making it a preferred tool for researchers. The ability of SALTMED to simulate crop dynamics in response to climatic variations also makes it suitable for assessing the impacts of long-term climate change on agricultural phenology and productivity [14]. There is limited work related to climate change studies and applications of the SALTMED model for semi-arid areas of Punjab. Given this context, the SALTMED model was selected for the current research to develop various wheat scenarios under the impacts of climate change.
Using crop models like SALTMED can provide valuable insights into the crop’s response to climate change. The ability to predict how wheat will respond under future climatic conditions can help in developing robust agricultural practices that ensure food security. Additionally, the application of crop simulation models helps in exploring various management strategies to maintain wheat yields under the impact of different climate change scenarios. In the current study, the field data from wheat sown under different irrigation and nitrogen levels was used for calibration of SALTMED model to develop simulations for investigating the impact of climate change on future wheat response in terms of crop sowing and harvesting dates, changes in the crop period, and crop productivity, as well as to provide insights and recommendations for sustainable agricultural practices that can help ensure food security in Pakistan despite the challenges posed by rapid population growth, water scarcity, and climate change. The sustainable agricultural practices included adjusting nitrogen application rates.

2. Material and Methods

The field experiments were conducted in Toba Tek Singh, Pakistan, an area that falls in central Punjab and has fertile lands with favorable climate conditions for the production of cereal crops, including wheat. The district has a moderate to hot climate, with summer temperatures reaching up to 40.55 °C [15]. It receives about 450 mm of annual rainfall, primarily during the monsoon season in July and August [16]. The area has a canal water supply from the Chenab River as well as abundant groundwater resources to fulfill the net crop water requirement. The combination of favorable climate conditions, adequate irrigation water supply, and fertile soil makes the district an important agricultural hub, supporting not only the local farmer community but also significantly contributing to the country’s food security. The experiments were conducted at two different sites within the Toba Tek Singh to account for the spatial soil variability in terms of fertility.

2.1. Field Experiment and Sampling

The experiments were conducted at two different plots within the Tehsil Gojra area of Toba Tek Singh. The two plots were labeled as site-1 and site-2. The soil of these two sites was different. Soil samples were taken at a depth of 30 cm from three locations to form one representative composite sample for each site. The properties of the soil were determined in terms of the electrical conductivity (EC), sodium adsorption ratio (SAR), organic matter (O.M), nitrogen (N), phosphorus (P), potassium (K), zinc (Zn), iron (Fe), manganese (Mn), and copper (Cu). The soil texture and the density were also determined as physical properties of the soil. All the analyses were conducted at the laboratories of Ayub Agriculture Research Institute (AARI), Pakistan.
The experiments were carried out in two seasons, i.e., 2020–2021 and 2021–2022. Four treatments were included in the experiment, comprised of two irrigation levels (I100 = 100% of ETc and I80 = 80% of ETc) and two nitrogen levels (N100: 100 kgN·ha−1 and N80: 80 kgN·ha−1). Each treatment had three replicates at each site. The treatments were I100 × N100, I80 × N100, I100 × N80, and I80 × N80. To apply nitrogen, urea and DAP (diammonium phosphate) were used as fertilizer compounds. For N100, 18 kg of DAP and 178 kg of urea were applied in one hectare, while for N80, 13 kg of DAP and 146 kg of urea were used. The experiment was set up under a two-factorial randomized complete block design (RCBD). Since the experiments were conducted on farmers’ fields, all crop management practices, apart from the experimental treatments, were left to the farmers’ discretion and the availability of inputs.

2.2. Crop Data Collection and Analysis

For the purpose of crop data collection, three specific locations were selected within each replicate of every treatment. The average value obtained from these three locations was then used in the analysis. Data collection focused on key crop parameters, including grain yield, dry matter, and plant height, which were recorded at the time of harvest. The irrigation amount was computed by multiplying the discharge rate of the irrigation water by the duration of irrigation. This provided a precise measure of the total volume of water applied to the crops. Water productivity was subsequently calculated by dividing the grain yield by the amount of applied irrigation water. To evaluate the significance of the differences among the outcomes of various treatments, an analysis of variance (ANOVA) was performed. This statistical method was coupled with the least significant difference (LSD) test, which helped to identify which specific treatments had significant effects on the crop parameters.

2.3. Climate and Data Downscaling

Climate data spanning from 1991 to 2023 were obtained from the Pakistan Meteorological Department’s observatory, encompassing daily maximum temperature, minimum temperature, precipitation, and solar radiation. Additionally, future climate datasets derived from general circulation models (GCMs) were sourced from the CMIP5 project website [17]. The selection of GCMs was based on their reliability for the study area’s conditions, as reported in the published literature [18,19]. The chosen GCMs included ACCESS (CSIRO-BOM, Australia), BCC-CSM (BCC, China), IPSL-CM5A (IPSL, France), MPI-ESM (MPI-M, Germany), and HadGEM2 (UK Met Office, UK).
Climate change projections from these GCMs were obtained for two representative concentration pathways (RCPs): RCP 4.5 and RCP 8.5. RCP 4.5 represents a scenario where greenhouse gas emissions continue at the current rate until 2050, followed by the implementation of effective control measures to reduce emissions. In contrast, RCP 8.5 depicts a scenario of uncontrolled greenhouse gas emissions, with a steady rise until the end of the century. These RCPs were chosen to represent partially controlled and worst-case scenarios, as adopted in other relevant studies [20]. In this study, the distribution mapping (DM) technique, a popular statistical downscaling method, was utilized to refine the raw data, rendering it usable. DM has been recommended by other researchers due to its advantages over alternative methods [19,21]. The CMhyd (Climate Model Data for Hydrologic Modeling) software (https://swat.tamu.edu/software/cmhyd/) was employed for data downscaling that intercompared past climate data from 1991 to 2005 to train the downloaded raw data to refined future data up to 2100. It is noteworthy that CMhyd requires a minimum of ten years of historical data to perform data downscaling on future datasets effectively.

2.4. SALTMED Model Applications

The current study employed the latest version of SALTMED, version 2019 [13,22] to determine the wheat response in future contexts under the impact of climate change. The model is freely available at the official website of UK Centre for Ecology & Hydrology (https://www.ceh.ac.uk/data/software-models/saltmed). The flow chart for model applications and proposed output is shown in Figure 1. The SALTMED model was calibrated using climate data and field data from these experiments. Future climate projections were sourced from various general circulation models (GCMs) and refined using the standard downscaling technique to make them suitable for the model to run for future simulations to derive the study’s conclusions.
The SALTMED model was selected in the present study due to the fact that it has been proven effective in simulating wheat yield parameters under erratic input conditions. However, its precision depends on careful calibration tailored to the specific conditions of each crop [12,23]. To run the model, the crop data (yield, dry matter, and plant height) were acquired from the observed wheat parameters under field experiments, soil data were acquired from a soil analysis, irrigation and nitrogen data were recorded during their applications, while many of the model parameters that were used during calibration were taken from the model database. During calibration, the model parameters were adjusted until the performance indicators reached acceptable levels. During the validation run, the calibrated parameters were used (unchanged). The field data from 2020–2021 were used for model calibration, while the next year’s data (2021–2022) were used for its validation. Performance indicators, including the coefficient of determination (R2), root mean square error (RMSE), normalized root mean square error (NRMSE), and coefficient of residual mass (CRM), were used as described by other researchers [19,22].
SALTMED simulations were conducted to predict wheat yield and dry matter under various climate change scenarios. These simulations utilized climate data sourced from multiple GCMs, combined with two RCPS: RCP4.5 and RCP8.5. The simulation analyzed five future wheat seasons at consistent intervals until the end of the century, comparing baseline crop responses (2021–2022) with projected future crop behaviors influenced by climate change. The chosen future wheat seasons for this analysis were 2039–2040, 2054–2055, 2069–2070, 2084–2085, and 2099–2100. By examining these seasons, this study aimed to provide a comprehensive understanding of how climate change could potentially threaten future wheat production and food security. Throughout the simulation, the calibrated model parameters remained constant, with alterations made only to the input climate data. After identifying the impacts of climate change on crop yields, further hypothetical scenarios were designed to investigate the effects of increased nitrogen doses (N120 = 120 kgN·ha−1 and N140 = 140 kgN·ha−1) on wheat yield to assess the countereffects of the negative impacts of climate change on wheat production. These additional simulations aimed to determine if higher nitrogen levels could mitigate the anticipated reduced wheat yields due to changing climatic conditions, thereby ensuring more stable and sustainable wheat production in the future.

3. Results

3.1. Soil Fertility of the Experiment Sites

The experiments were conducted at two different plots with different fertility levels. The analysis of the soil showed that site-2 had more fertile soil compared with that of site-1. The soil of both sites was sandy clay loam. The soil of site-1 was saline, with EC = 8.4 dS·m−1 and SAR = 17 meq·L−1, compared with those parameters of the soil from site-2 (EC = 4.2 dS·m−1 and SAR = 10 meq·L−1). Due to excessive salts, the soil of site-1 was slightly compressed, with a value of 1.63 g·cm−3 for its bulk density, whereas the bulk density of the soil from site-2 was lower (1.54 g·cm−3). The soil from site-2 had better nutrient concentrations regarding organic matter (O.M) = 1.4%, nitrogen (N) = 12 mg·kg−1, phosphorus (P) = 7.0 mg·kg−1, potassium (K) = 85 mg·kg−1, zinc (Zn) = 0.2 mg·kg−1, iron (Fe) = 2 mg·kg−1, manganese (Mn) = 2.1 mg·kg−1, and copper (Cu) = 0.15 mg·kg−1, whereas these nutrients were O.M = 4.2 %, N = 35 mg·kg−1, P = 22 mg·kg−1, K = 145 mg·kg−1, Zn = 1.2 mg·kg−1, Fe= 4.2 mg·kg−1, Mn = 3.2 mg·kg−1, and Cu = 0.27 mg·kg−1 in the soil of site-2. The detailed results are given in Table 1.

3.2. Wheat Response under Different Treatments

The treatments, which included different levels of water quantity and nitrogen doses, significantly impacted crop growth and yield parameters. Among these treatments, I100 N100 resulted in the highest wheat yield (4.83 T·ha−1), dry matter (12.45 T·ha−1), and plant height (95.11 cm). I80 × N80 produced significantly lower wheat yields (4.38 T·ha−1) and dry matter (11.54 T·ha−1), but the same plant height (93.02 cm) and higher water productivity (1.29 kg·m−3) were obtained compared to I100 × N100. A similar trend was observed when comparing the crop parameters under I100 × N80 and I80 × N80. I100 × N80 produced a significantly higher yield (3.87 T·ha−1), dry matter (9.88 Mg·ha−1), and plant height (91.99 cm), whereas the water productivity was lower (0.93 kg·m−3) than that under I80 × N80, i.e., yield = 3.40 T·ha−1, dry matter = 8.84 T·ha−1, plant height = 88.31 cm, and water productivity = 1.01 kg·m−3. The amount of applied irrigation was 426 mm and 340 mm under I100 and I80, respectively, in the 2020–2021 season, while it was 406 mm and 325 mm under I100 and I80, respectively, in the 2021–2022 season.
The wheat performed better in the 2020–2021 season regarding the yield, dry matter, plant height, and water productivity, which were 4.38 T·ha−1, 11.49 T·ha−1, 94.04 cm, and 1.14 kg·m−3, respectively, compared with those in the 2021–2022 season, i.e., 3.86 T·ha−1, 9.87 T·ha−1, 90.17 cm, and 1.05 kg·m−3, respectively. Site-1 produced the weaker crop, as the yield parameters and the productivity of the wheat were significantly lower at site-1 (yield = 3.57 T·ha−1, dry matter = 10.12 T·ha−1, plant height = 91.21 cm, and water productivity = 0.95 kg·m−3) compared with those at site-2 (yield = 4.67 T·ha−1, dry matter = 11.24 T·ha−1, plant height = 93.01 cm, and water productivity = 1.25 kg·m−3). Detailed results regarding the crop parameters are given in Table 2.

3.3. Projected Future Climate Data for Model Run

The downloaded data from the selected GCMs were downscaled using historical observed data spanning from 1991 to 2005. To facilitate a visual comparison of different climatic parameters, an advanced analytical technique known as the Taylor diagram was developed, as depicted in Figure 2. This comprehensive analysis employed well-established statistical indicators, such as standard deviations and correlation coefficients, to assess the reliability and accuracy of datasets from each GCM model, which included ACCESS, BCC-CSM, IPSL-CM5A, MPI-ESM, and HadGEM2.
The performance of the various GCMs demonstrated significant variability in their ability to predict different climatic parameters. The predicted climate data were correlated with the past data (1991–2005). For precipitation, the correlation coefficients were 0.48 for ACCESS, 0.30 for BCC-CSM, 0.33 for IPSL-CM5A, 0.50 for MPI-ESM, and 0.58 for HadGEM2, indicating varying degrees of alignment with the observed data. For solar radiation, the correlation coefficients were 0.81 for ACCESS, 0.63 for BCC-CSM, 0.67 for IPSL-CM5A, 0.66 for MPI-ESM, and 0.59 for HadGEM2, reflecting differences in the predictive accuracy. When evaluating the maximum temperature, the correlation coefficients were found to be 0.87 for ACCESS, 0.86 for BCC-CSM, 0.89 for IPSL-CM5A, 0.87 for MPI-ESM, and 0.88 for HadGEM2, showing relatively high agreement with the historical data. For the minimum temperature, the correlation coefficients were 0.93 for ACCESS, 0.92 for BCC-CSM, 0.91 for IPSL-CM5A, 0.94 for MPI-ESM, and 0.89 for HadGEM2, also indicating a high level of accuracy in the predictions. Given the observed variability in performance across different climatic parameters, a composite dataset was developed regarding future climate. This composite dataset contained the values of different parameters corresponding to the GCMs, where the value of the correlation coefficient was the highest. Specifically, precipitation data were selected from HadGEM2, which had the highest correlation coefficient of 0.58. Solar radiation data were taken from ACCESS, with a correlation coefficient of 0.81. Maximum temperature data were chosen from IPSL-CM5A, which had the highest correlation coefficient of 0.89. Lastly, minimum temperature data were sourced from MPI-ESM, which exhibited the highest correlation coefficient of 0.94. This composite dataset aimed to leverage the strengths of each model to provide the most reliable and accurate representation of future climatic parameters.
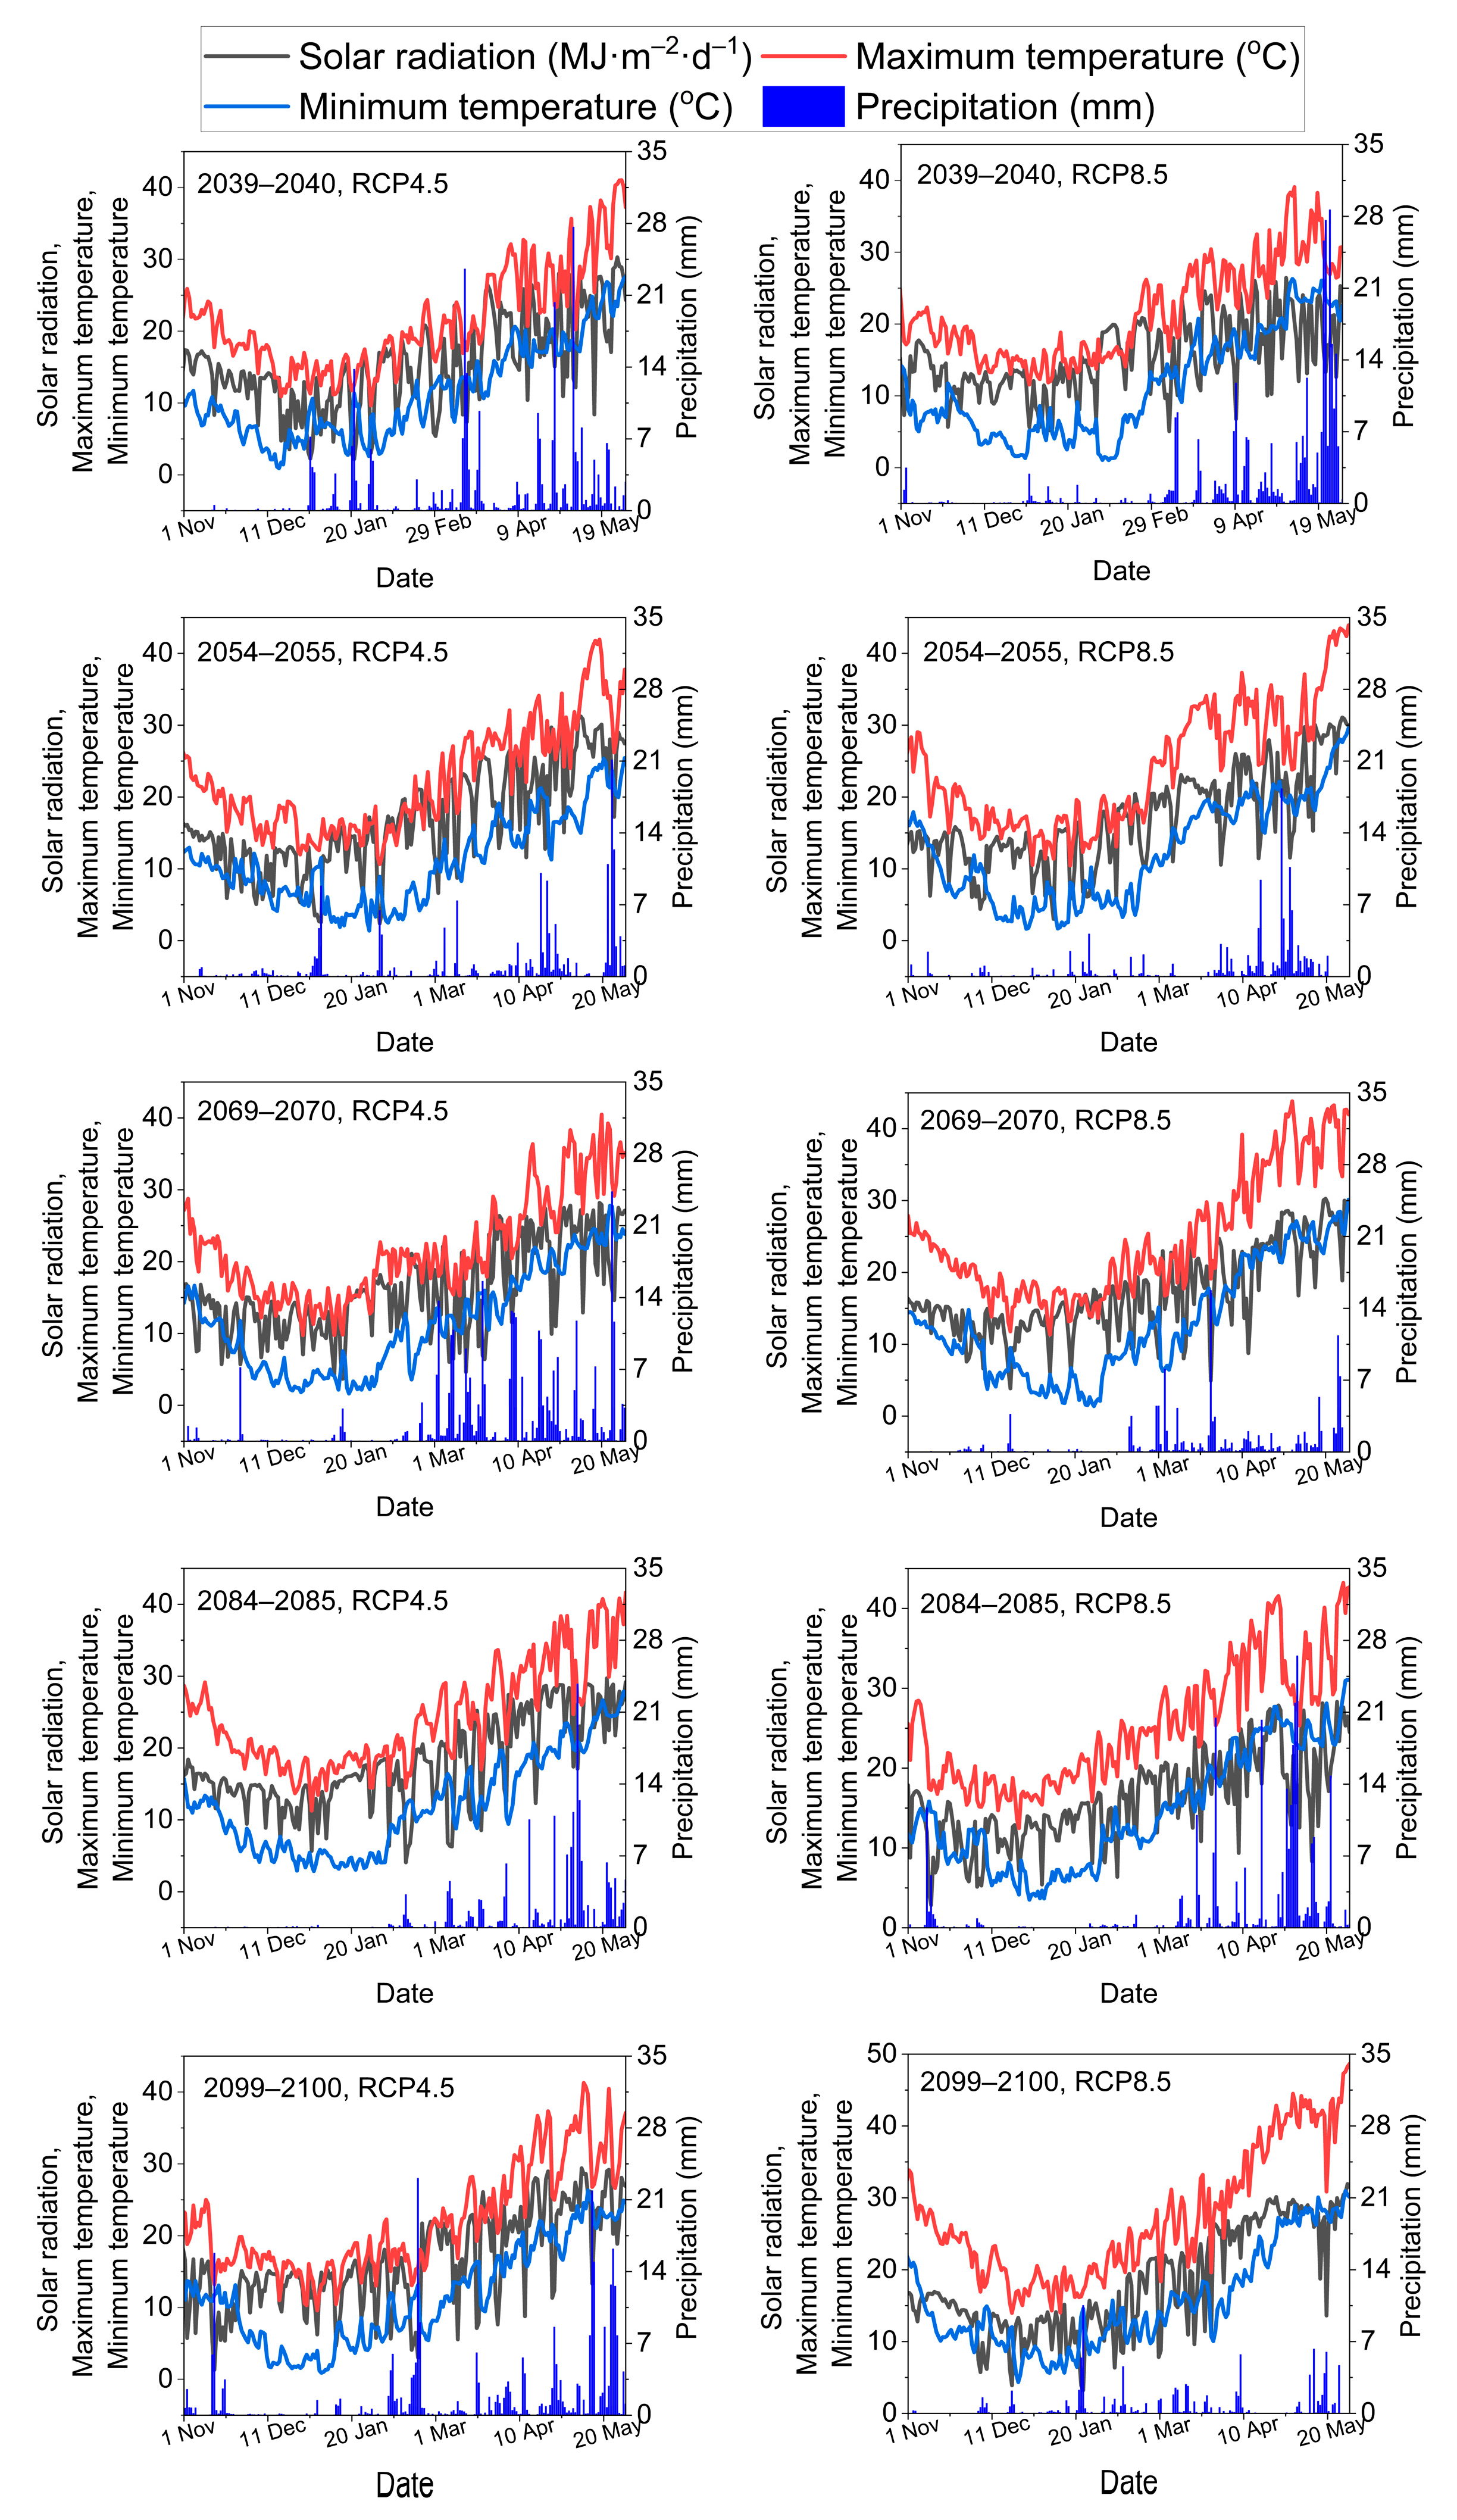
The future dataset encompassed five wheat seasons, i.e., 2039–2040, 2054–2055, 2069–2070, 2084–2085, and 2099–2100. The climate parameters were taken from the start of November to the end of May, because this period covered the wheat season in the study area. This dataset pertained to a specific climate parameter obtained from a designated GCM, as previously described, under two RCPs, namely, RCP4.5 and RCP8.5. It was noted that the changes in precipitation were projected to be 105%, 14%, 98%, 70%, and 85% under the RCP 4.5 scenario, while the changes were projected to be 81%, −22%, −20%, 11%, and −33% under the RCP 8.5 scenario for the periods of 2039–2040, 2054–2055, 2069–2070, 2084–2085, and 2099–2100, respectively, when compared to the baseline climate of 2021–2022. The increase in solar radiation intensity would amount to 3%, 1%, 5%, 4%, and 12% under RCP 4.5 and 4%, 7%, 12%, 8%, and 14% under RCP 8.5 for the periods of 2039–2040, 2054–2055, 2069–2070, 2084–2085, and 2099–2100, respectively, in comparison to the baseline climate of 2021–2022. Similarly, the increase in maximum temperature was expected to be 2%, 3%, 4%, 8%, and 11% under RCP 4.5, whereas it was expected to increase by 5%, 7%, 9%, 10%, and 12% under RCP 8.5 during 2039–2040, 2054–2055, 2069–2070, 2084–2085, and 2099–2100, respectively. The increase in minimum temperature was expected to be 3%, 7%, 8%, 9%, and 10% under RCP 4.5, whereas it would be 3%, 12%, 16%, 25%, and 36% under RCP 8.5 during 2039–2040, 2054–2055, 2069–2070, 2084–2085, and 2099–2100, respectively. An illustration of the projected climate parameters is given in Figure 3.

3.4. SALTMED Model Run

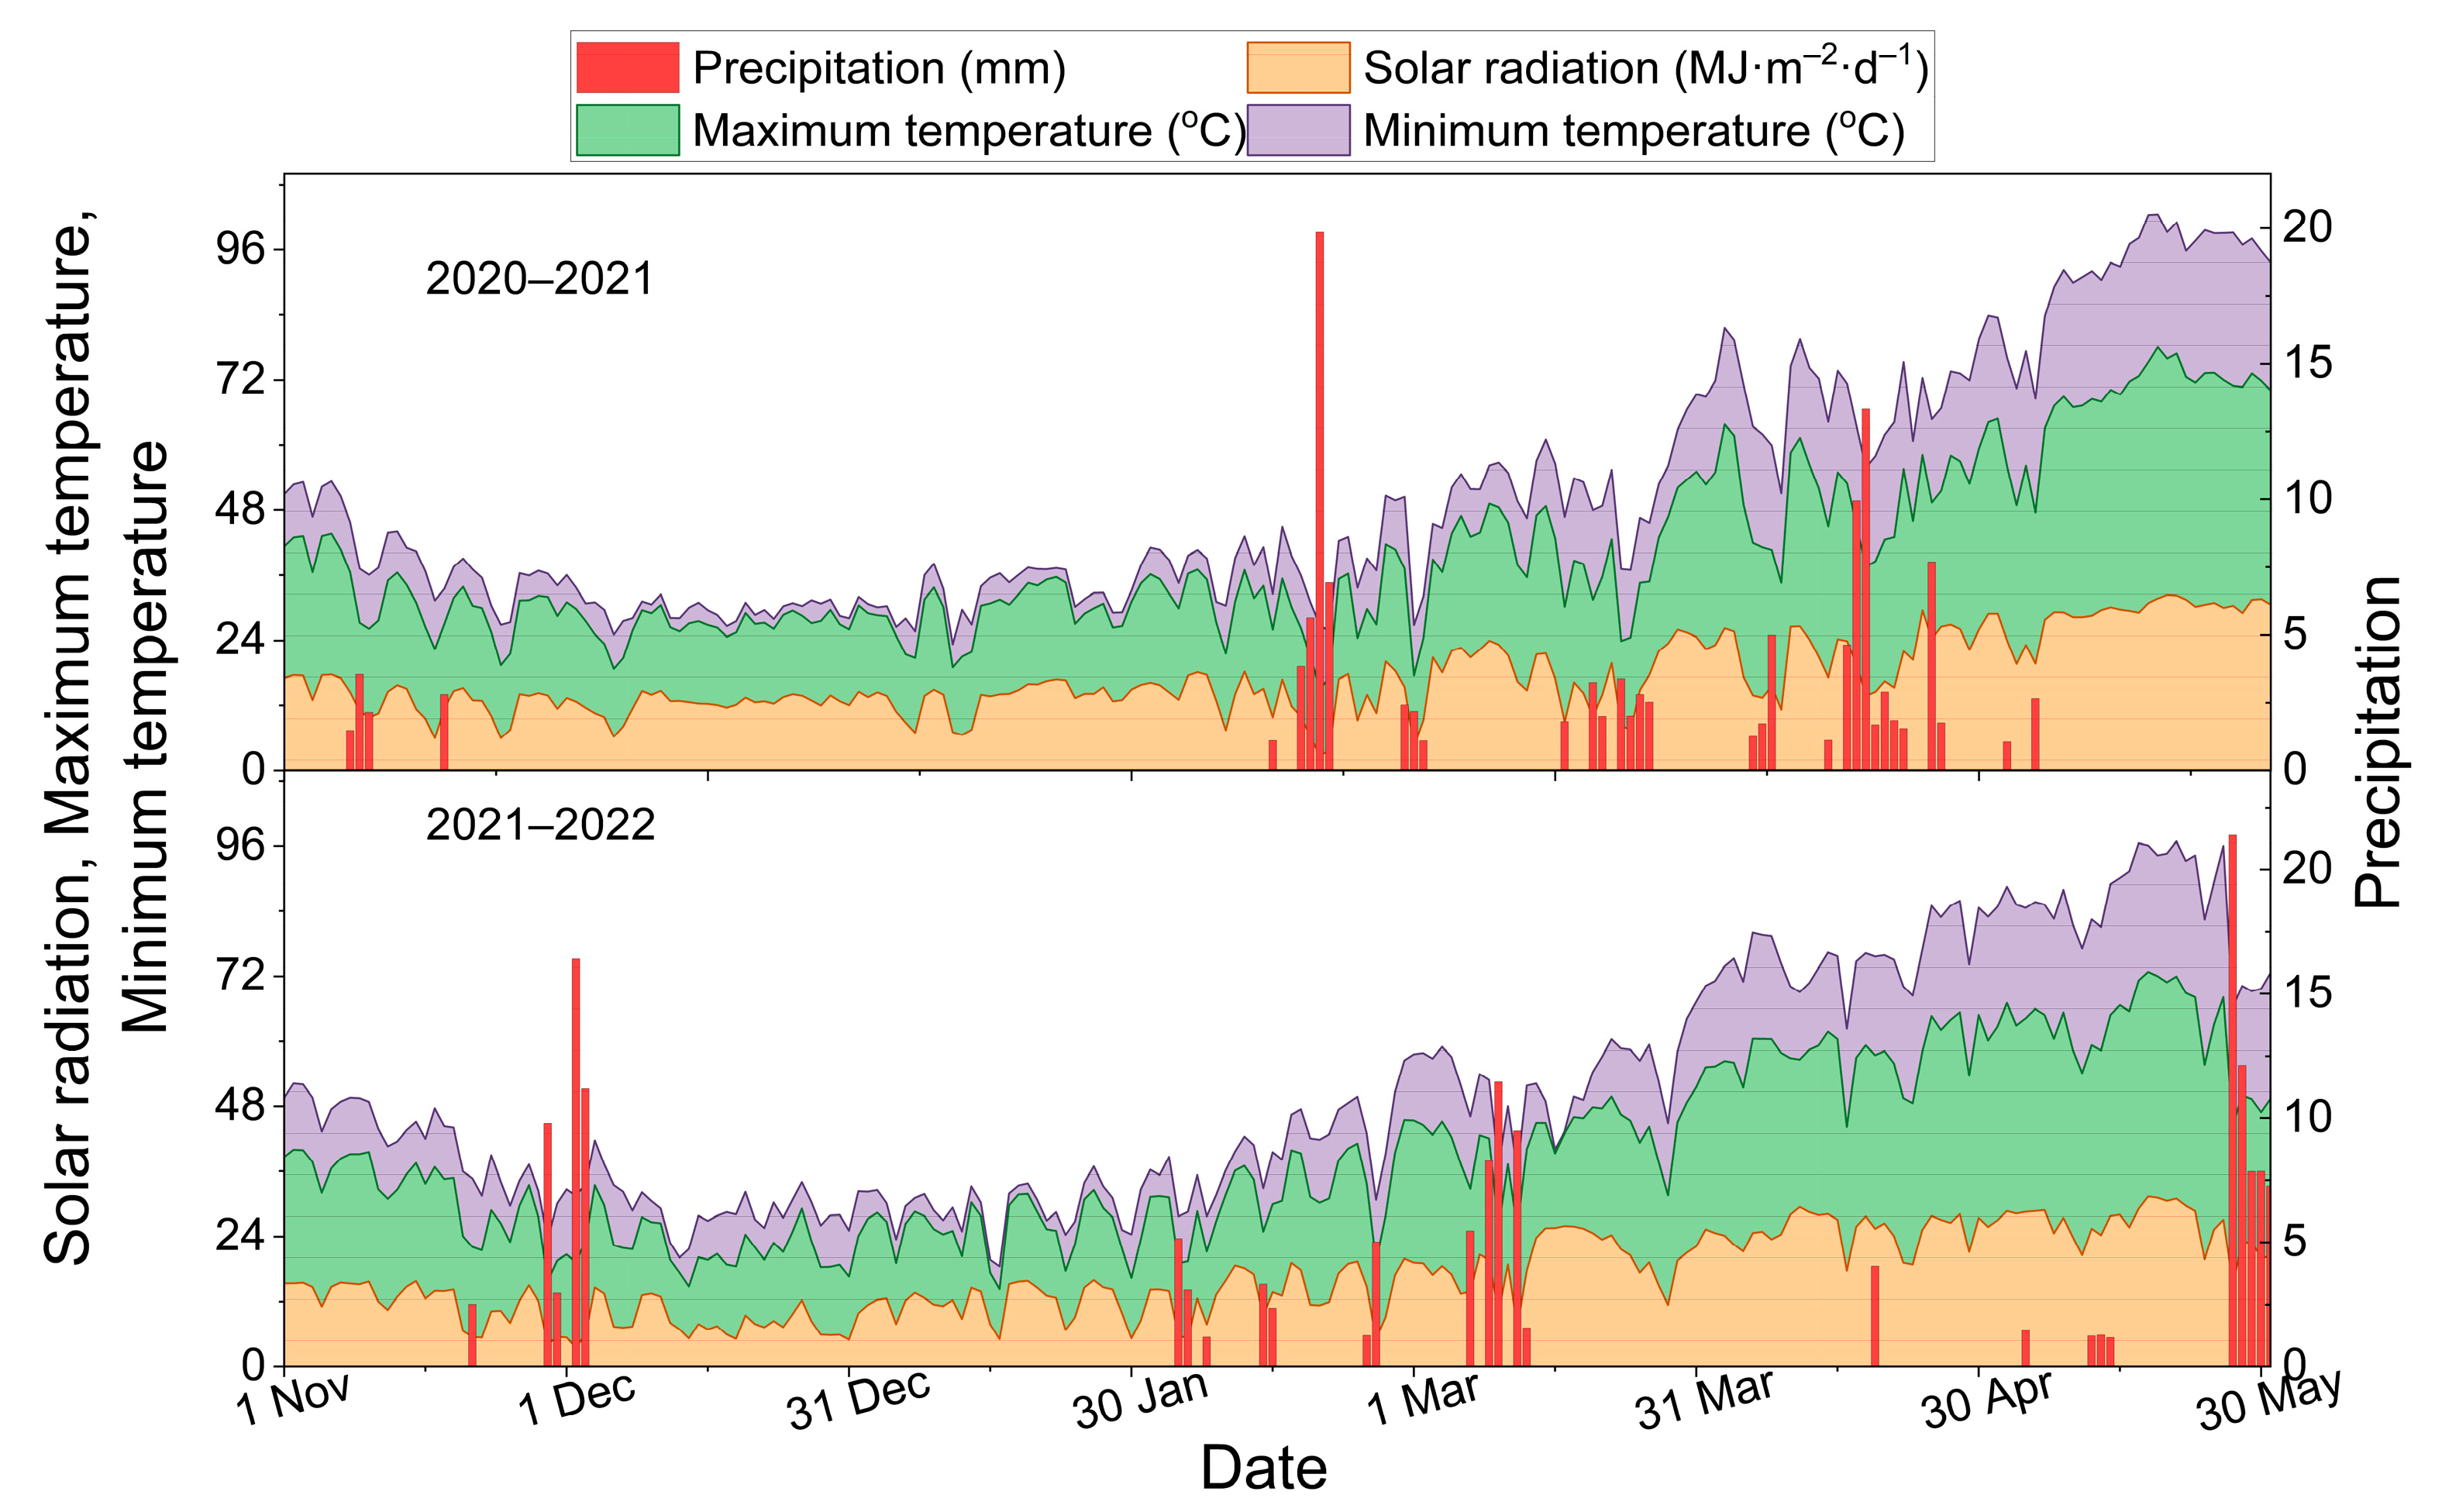
The model run was conducted to simulate the following crop parameters: yield, dry matter, and plant height. The SALTMED model utilized climate data obtained from the study area. These data included detailed records of rainfall and other climatic variables over two wheat seasons. For the year 2020–2021, the total rainfall measured was 121 mm, while in 2021–2022, it was slightly lower, at 107 mm. In addition to rainfall, the climate data included the average daily values for solar radiation, maximum temperature, and minimum temperature. In the years 2020–2021, the average solar radiation was 15.7 MJ·m−2·d−1, the average maximum temperature was 20.2 °C, and the average minimum temperature was 8.9 °C. In the years 2021–2022, these averages were slightly higher: solar radiation was 16.2 MJ·m−2·d−1, the maximum temperature was 21.2 °C, and the minimum temperature was 10.5 °C. These detailed climatic conditions, which are crucial for accurately modeling crop growth, are illustrated in Figure 4. The variations in these parameters between the two seasons provide insights into how different weather conditions can affect agricultural productivity.
By incorporating this climate data into the SALTMED model, model development (calibration and validation) was performed. At the start, model calibration was performed using data from the 2020–2021 season. During calibration, the fine-tuning of soil and crop-related model input parameters was performed to adjust the model predictions to match the observed values. Only input parameters that were taken from model database were fine-tuned, while the measured input parameters were kept unchanged. The calibrated values of soil-related model parameters, including saturated hydraulic conductivity, were 133 mm·d−1; field capacity, 22%; wilting point, 12.9%; saturated water content, 43.1%; maximum evaporation depth, 88 mm; Lambda pore size distribution index, 0.370; bubbling pressure, 11.25 cm. The crop-related parameter of harvest index was taken as 0.446. The calibrated values of the crop coefficient were 0.6, 1.13, and 0.44; the transpiration coefficients were 0.5, 0.85, and 0.45; the fraction cover was 0.52, 0.94, and 0.98; the leaf area index was 0.9, 4.2, and 4.1; the plant height was 0.4, 0.97, and 0.95; and the osmotic potential (π50) was 8, 10, and 12 for the initial, mid, and end crop growth stages, respectively.
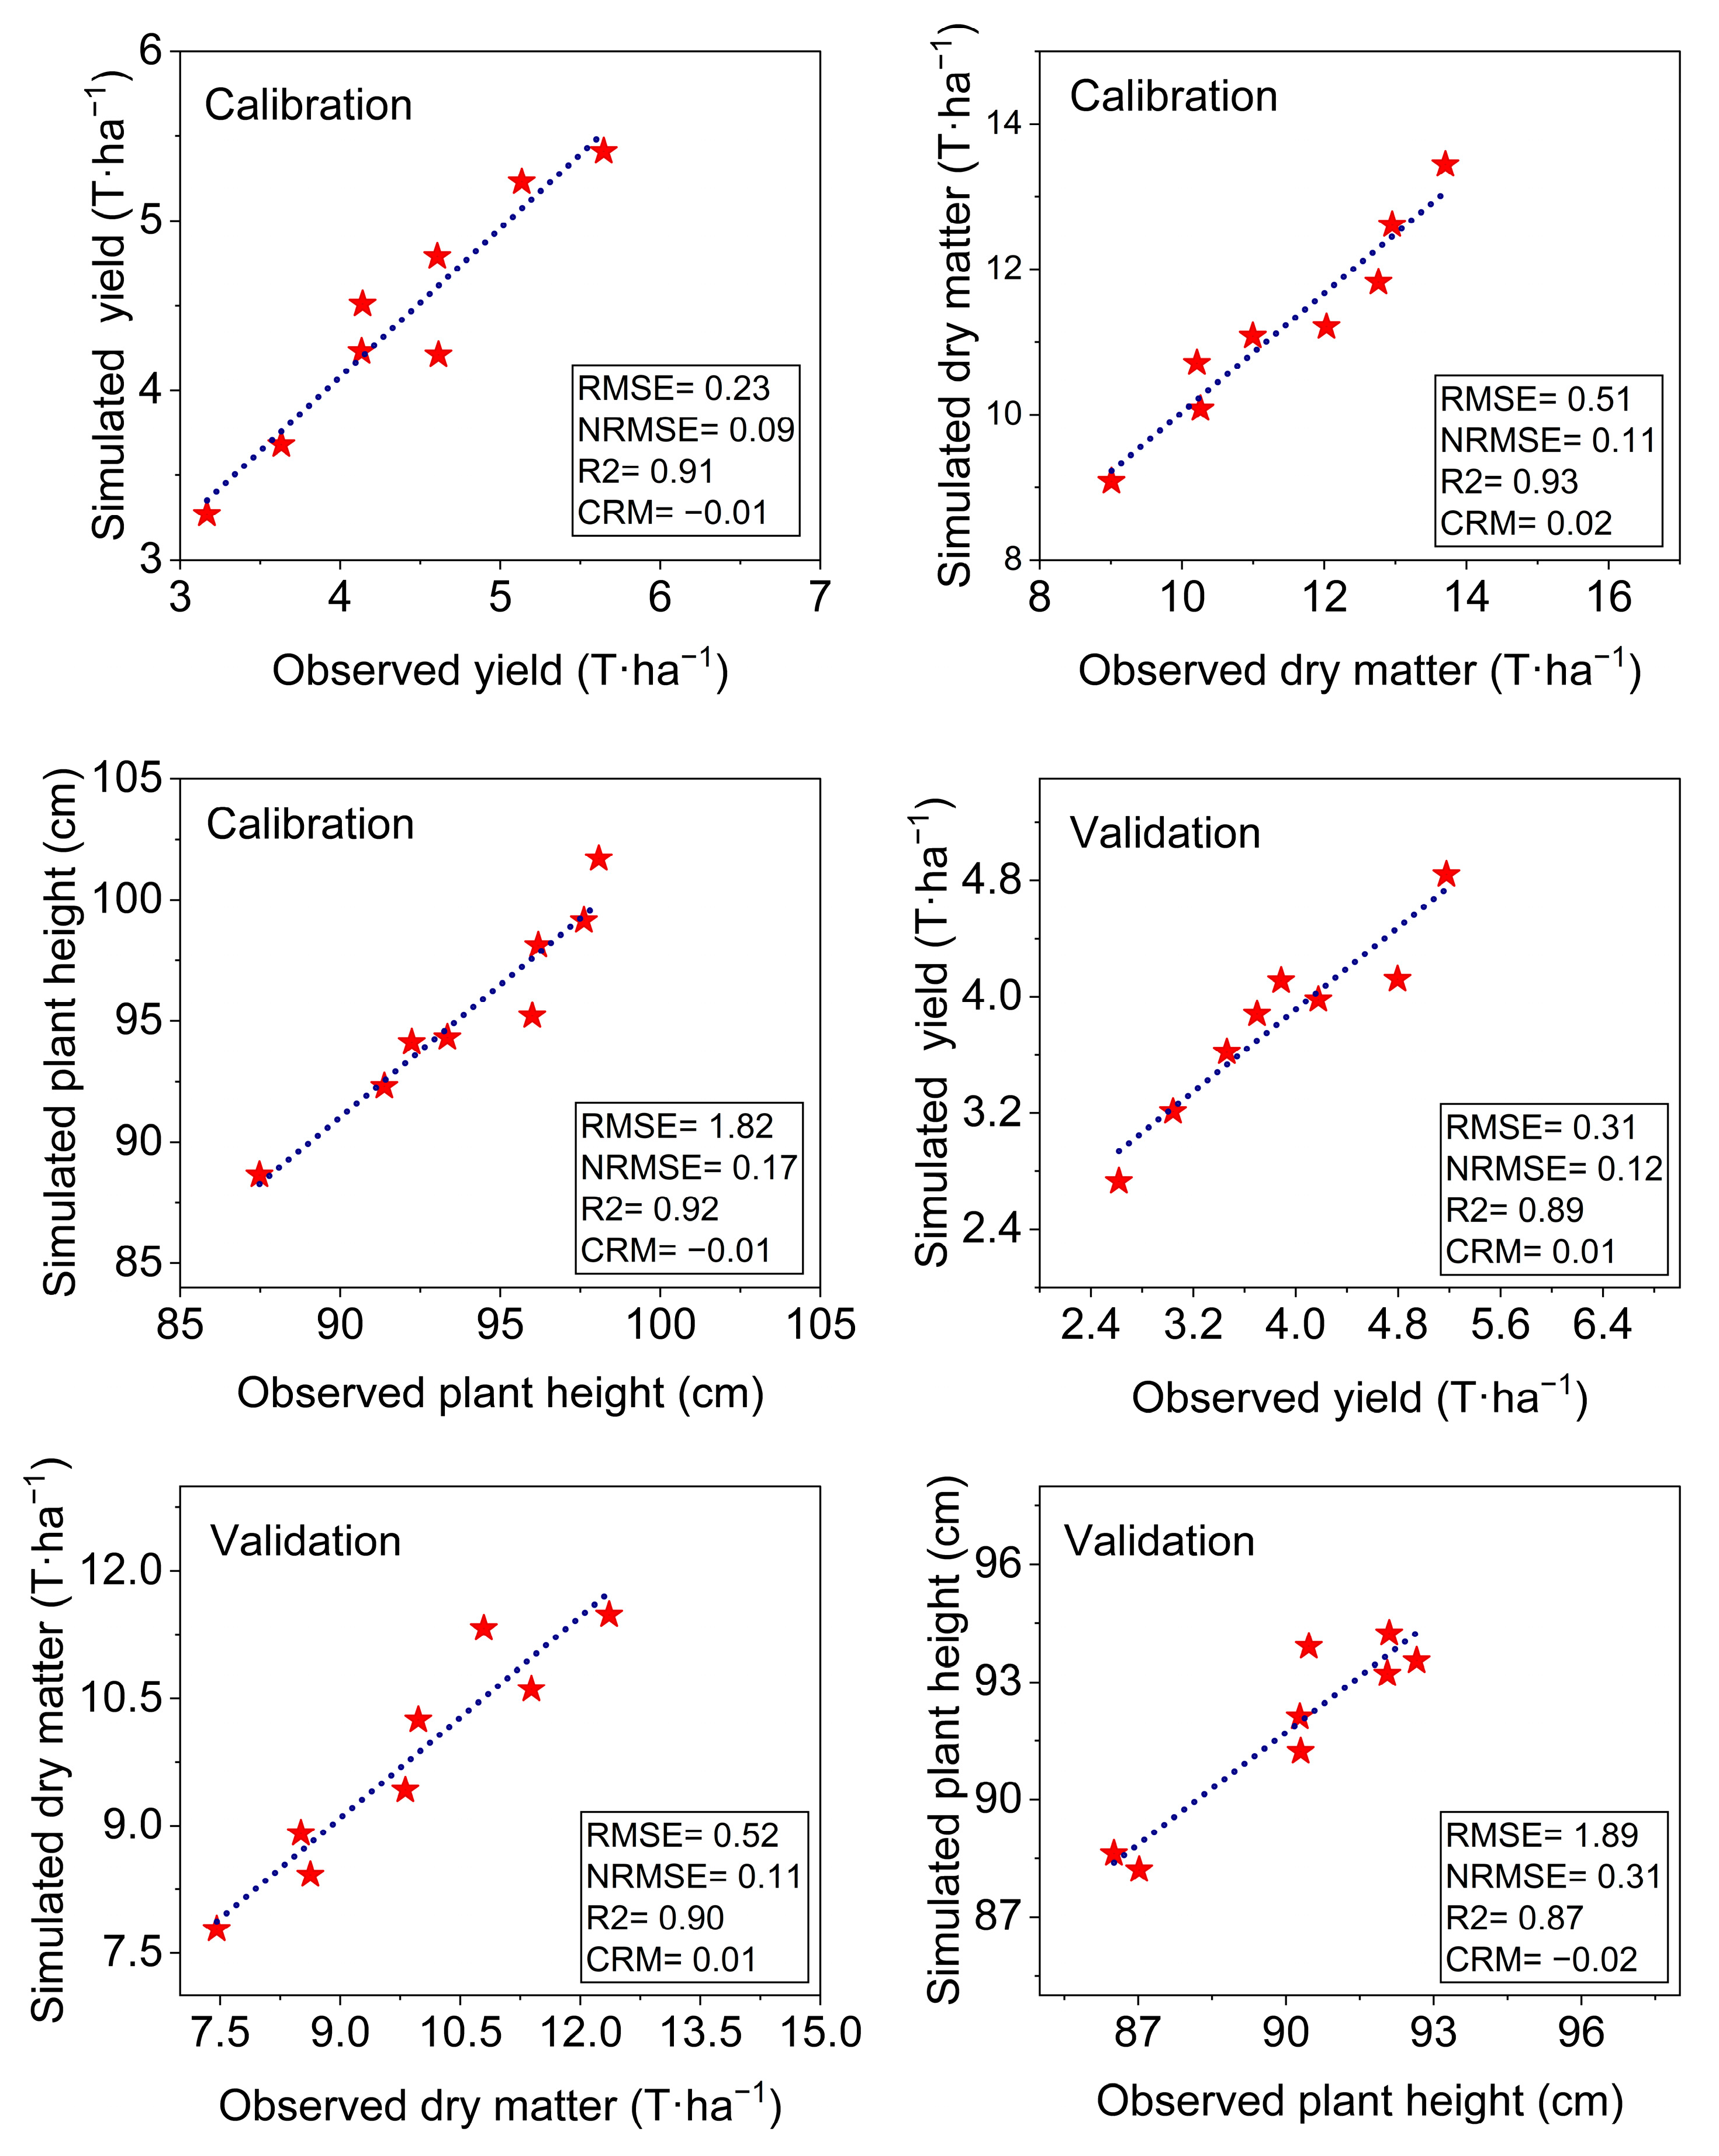
Following the calibration process, the model underwent validation using field data from the 2021–2022 season, employing the same calibrated parameters. The performance of the model run was evaluated using performance indicators such as RMSE, NRMSE, R2, and CRM. The RMSE values were 0.16, 0.53, 2.33, and 0.62 during calibration and 0.12, 0.60, 1.57, and 1.14 during validation for grain yield, dry matter, plant height, and soil moisture, respectively. The NRMSE values ranged from 0.15 to 0.30 for calibration and 0.14 to 0.55 for validation.
Comparisons between the model-predicted values and the observed data revealed the best performance in terms of R2, yielding values ranging from 0.90 to 0.93 during calibration and 0.87 to 0.90 during validation. The CRM ranged from −0.03 to 0.01 during calibration and from −0.05 to 0.01 during validation. The calibrated values for the soil and crop-related model parameters are given in Table 3.
Following the calibration process, the model was validated using field data from the 2021–2022 season, employing the same calibrated parameters. The purpose of this validation was to ensure that the model accurately predicted crop performance under different conditions. The model’s performance was evaluated using several performance indicators, including RMSE, NRMSE, R2, and CRM. The RMSE values indicate the average magnitude of the errors between the predicted and observed values, with lower values representing better model performance. The RMSE values during the calibration phase were 0.23 for yield, 0.51 for dry matter, and 1.82 for plant height. During the validation phase, the RMSE values were 0.31 for yield, 0.52 for dry matter, and 1.82 for plant height. The NRMSE is a normalized version of the RMSE, which allows for easier comparisons across different datasets by expressing the RMSE as a fraction of the observed data range. This normalization makes it easier to assess the relative accuracy of the model predictions. The NRMSE values during the calibration phase were 0.09 for yield, 0.11 for dry matter, and 1.17 for plant height. During the validation phase, the RMSE values were 0.12 for yield, 0.11 for dry matter, and 0.31 for plant height.
The R2 value measures the proportion of variance in the observed data that is predictable from the model. The R2 values during the calibration phase were 0.91 for yield, 0.93 for dry matter, and 0.92 for plant height. During the validation phase, the RMSE values were 0.89 for yield, 0.90 for dry matter, and 0.87 for plant height. The CRM is used to evaluate the tendency of the model to overestimate or underestimate the observed values. A CRM value close to zero indicates that the model predictions are unbiased. Negative CRM values suggest a slight overestimation, while positive values indicate underestimation. The CRM values ranged from −0.03 to 0.01 during calibration and from −0.05 to 0.01 during validation. The CRM values ranged from −0.01 to 0.02 during calibration and from −0.02 to 0.01 during validation. The detailed performance indicators are given in Table 4, and the comparison between the observed and simulated data points are illustrated in Figure 5.

3.5. Scenario Simulation

3.5.1. Impact on Crop Growth Period

The impending threats of climate change to global wheat production are clear, with forecasts indicating changes in crop growth periods, enhanced irrigation demand, and reduced crop productivities until the end of century due to rising temperatures and changing precipitation patterns, as identified in the previous section of this manuscript. To evaluate the effects of climate change on wheat production, the SALTMED model was used to simulate wheat responses, utilizing the same calibrated model parameters and projected future climate data. These simulations covered future wheat seasons from the near to far-future, specifically the periods of 2039–2040, 2054–2055, 2069–2070, 2084–2085, and 2099–2100, to assess crop responses in comparison to the 2021–2022 wheat season.
The SALTMED model was run with the option of using the accumulated degree days (heat units) to identify each phenological stage as well as to identify the length of the growing season, sowing, and harvest dates, as shown in the model dialogue below (Figure 6). The basic temperature for wheat growth was selected from the literature [25], whereas the growing degree days were calculated from the wheat season of 2021–2022 (base data). Later, these were used for future simulations.
The impact of climate change was determined by analyzing various factors, including sowing and harvesting dates, irrigation requirements, wheat yield, and dry matter production. The simulations revealed that climate change will likely cause earlier sowing and harvesting dates, shortening the overall crop period compared to the baseline data (2021–2022). These changes were driven by rising temperatures and shifting precipitation patterns, as identified in the previous section of this manuscript.
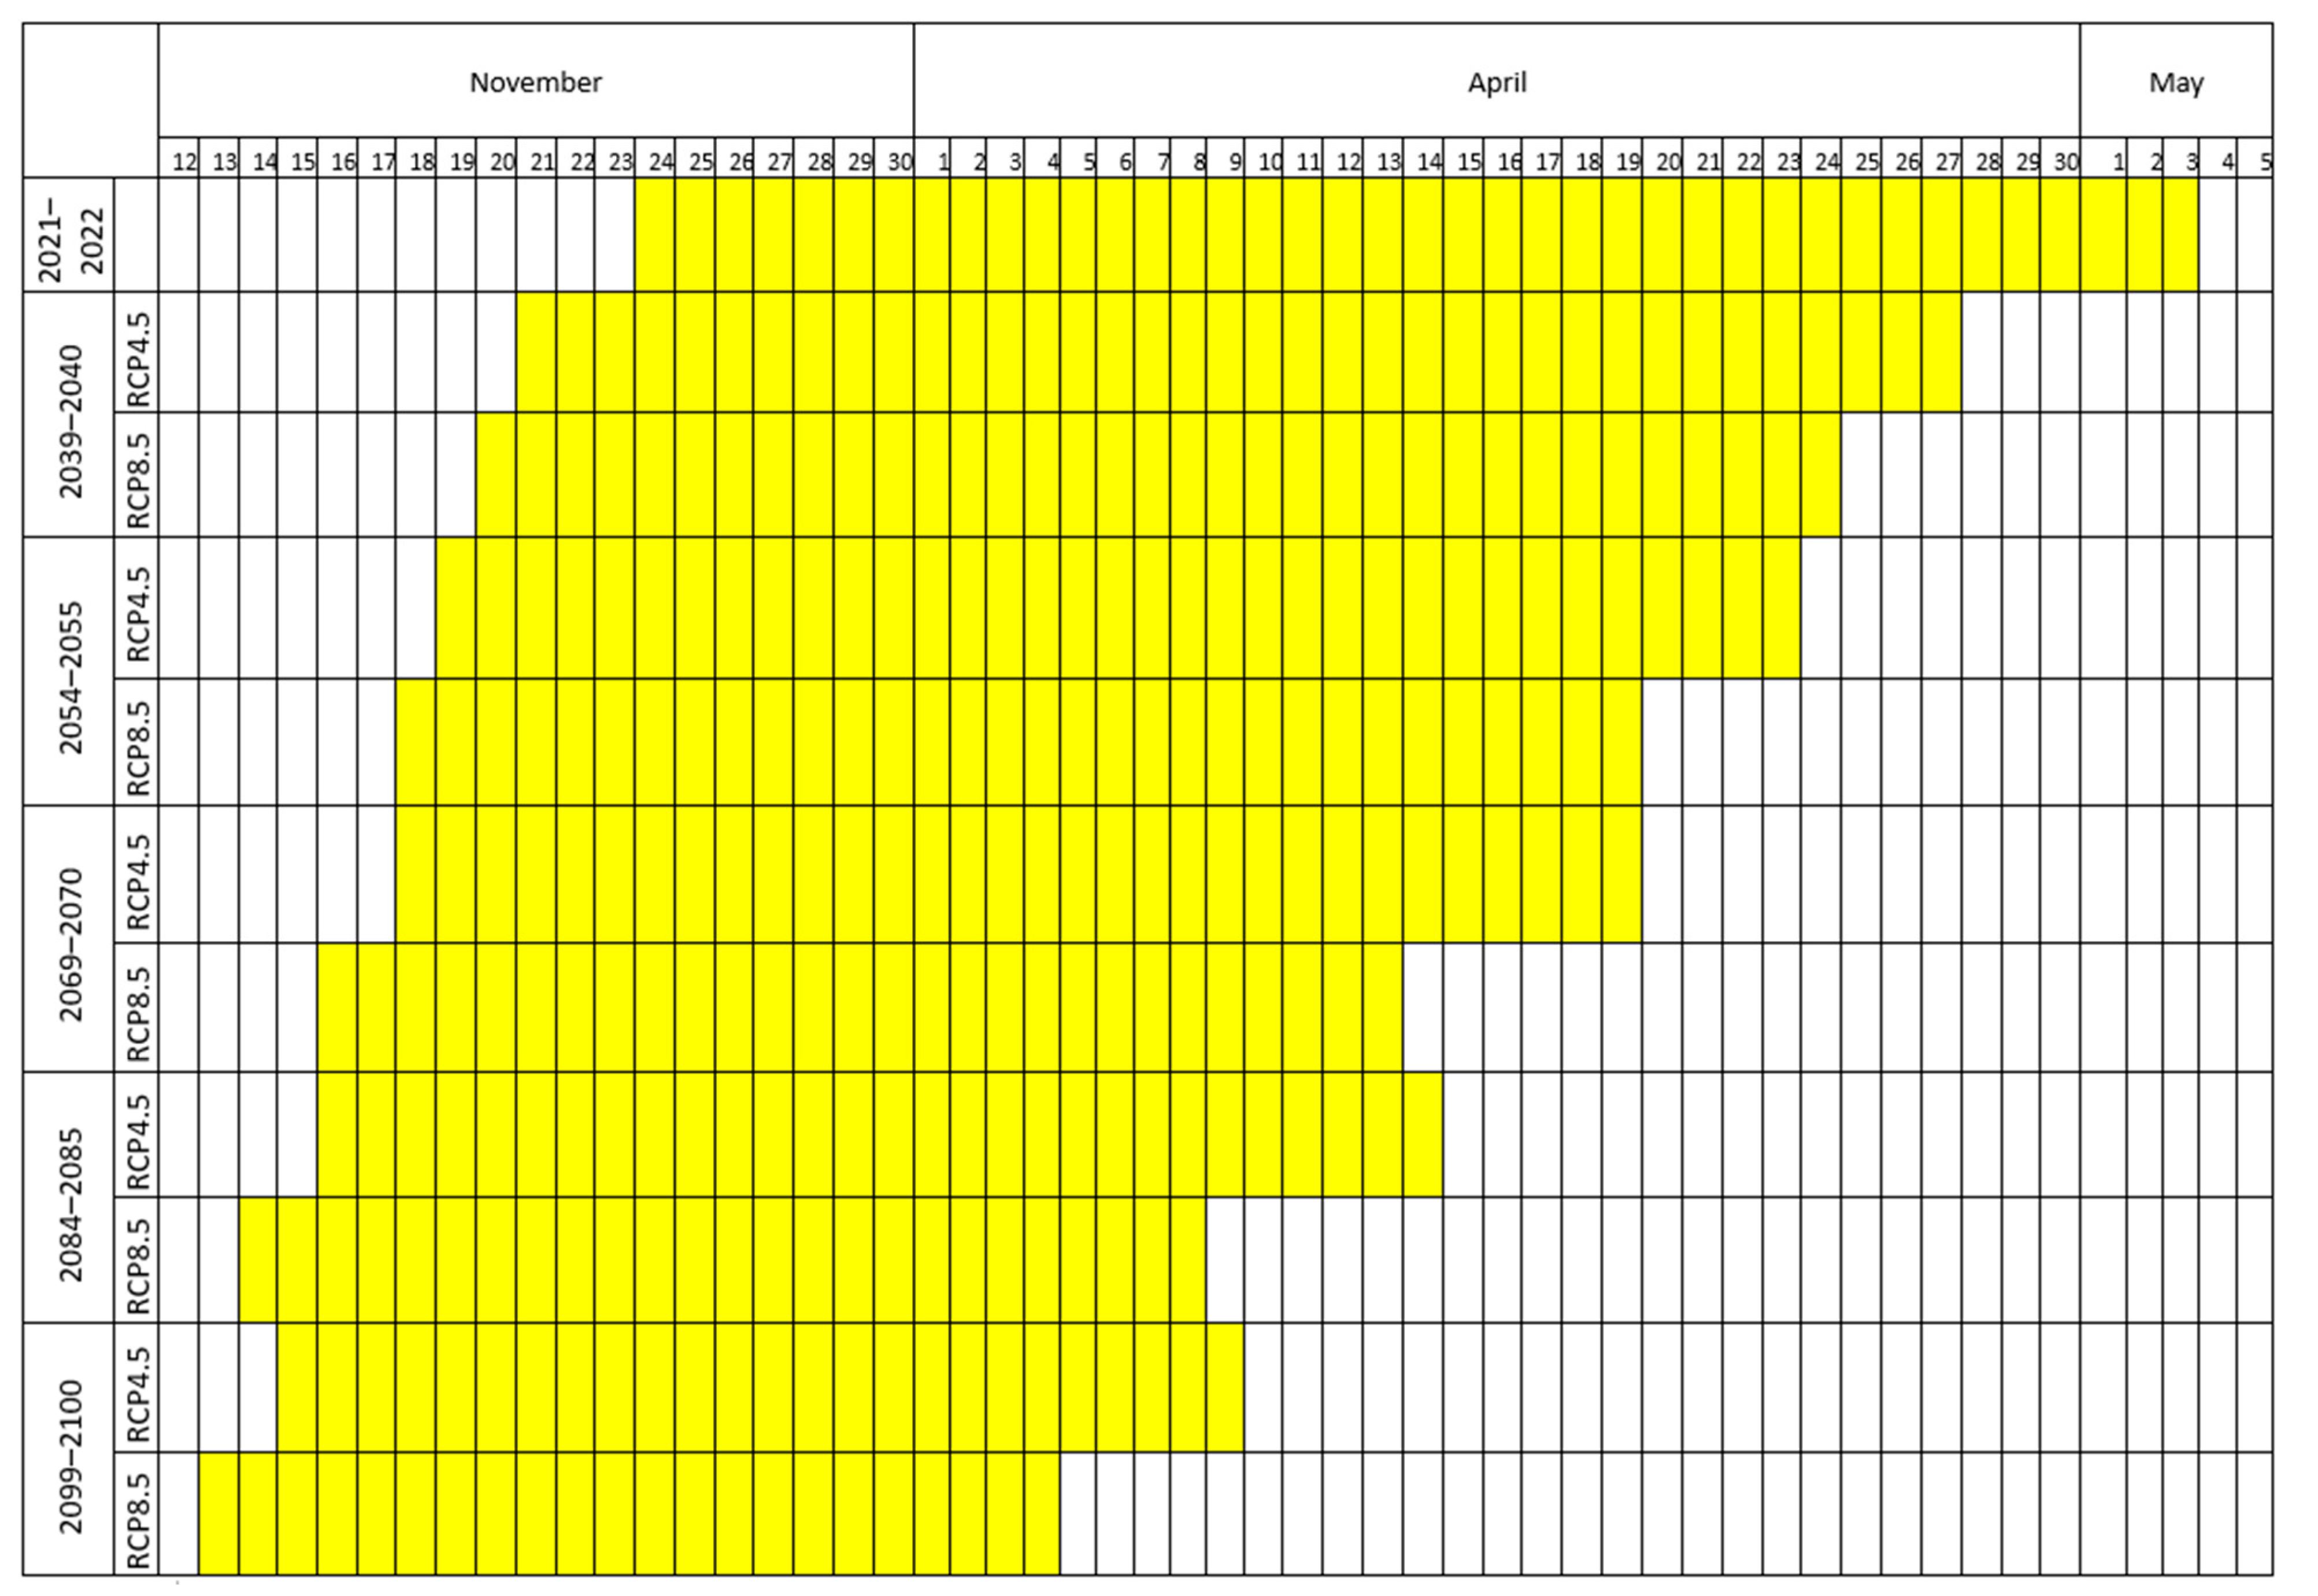
The sowing dates of wheat were 21st November (three days earlier), 19th November (five days earlier), 18th November (six days earlier), 16th November (eight days earlier), and 15th November (nine days earlier) under RCP4.5 during the 2039–2040, 2054–2055, 2069–2070, 2084–2085, and 2099–2100 wheat seasons, respectively, compared with that of 24th November in the 2021–2022 season. For RCP8.5, the sowing dates were 20th November (four days earlier), 18th November (six days earlier), 16th November (eight days earlier), 14th November (ten days earlier), and 13th November (eleven days earlier) under RCP8.5 during the 2039–2040, 2054–2055, 2069–2070, 2084–2085, and 2099–2100 wheat seasons, respectively, compared with that of 24th November in the 2021–2022 season. Similarly, the harvesting dates of wheat were 27th April (six days earlier), 23rd April (ten days earlier), 19th April (fourteen days earlier), 14th April (nineteen days earlier), and 09th April (twenty-four days earlier) under RCP4.5 during the 2039–2040, 2054–2055, 2069–2070, 2084–2085, and 2099–2100 wheat seasons, respectively, compared with that of 03rd May in the 2021–2022 season. Whereas for RCP8.5, the harvesting dates were 24th April (nine days earlier), 19th April (fourteen days earlier), 13th April (twenty days earlier), 09th April (twenty-four days earlier), and 05th April (twenty-eight days earlier) under RCP8.5 during the 2039–2040, 2054–2055, 2069–2070, 2084–2085, and 2099–2100 wheat seasons, respectively, compared with that of 03rd May in the 2021–2022 season. The details are illustrated in Figure 7.
The reduction in the wheat crop growth period under the ‘future’ simulations showed that the crop growth period was 158 days (two days shorter), 155 days (three days shorter), 152 days (eight days shorter), 149 days (eleven days shorter), and 145 days (fifteen days shorter) under RCP4.5, while it was 156 days (four days shorter), 152 days (eight days shorter), 147 days (thirteen days shorter), 145 days (fifteen days shorter), and 142 days (eighteen days shorter) under RCP8.5 during the 2039–2040, 2054–2055, 2069–2070, 2084–2085, and 2099–2100 wheat seasons, respectively, when compared with that in the 2021–2022 season (160 days). The duration of the crop period under different scenarios can be seen in Figure 7.

3.5.2. Impact on Crop Yield and Productivity

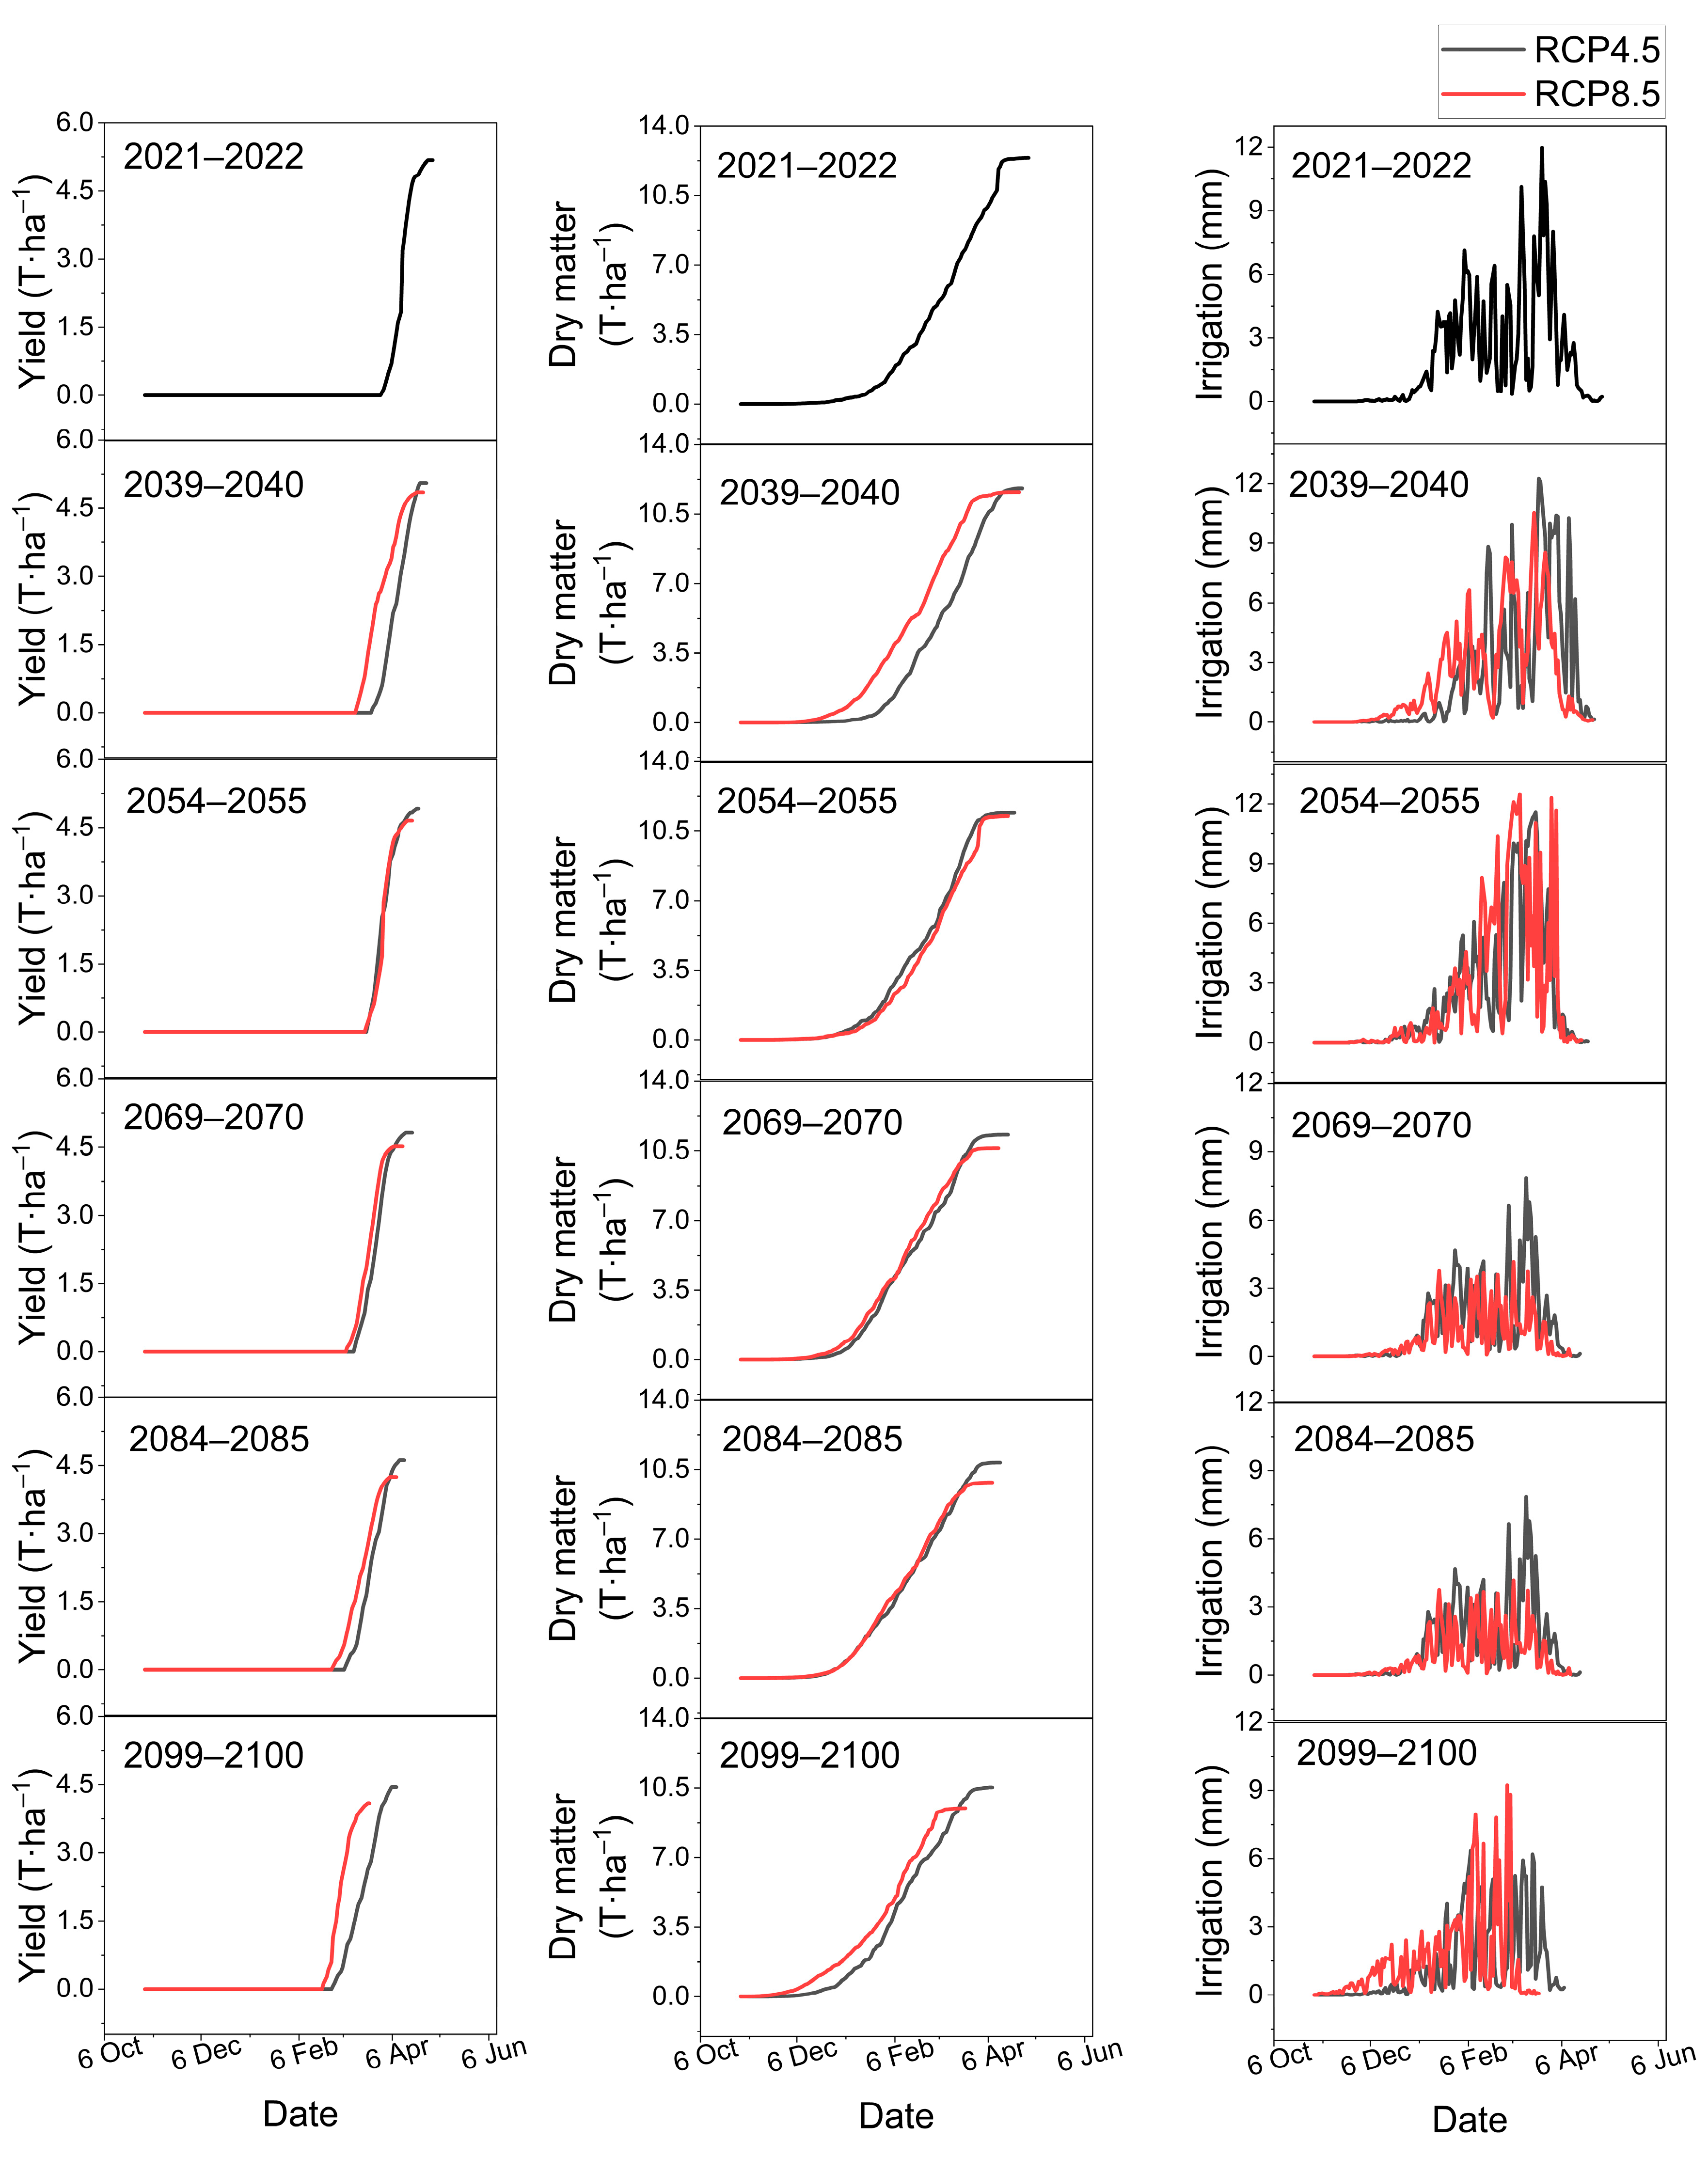
It was observed that the wheat yield in the 2039–2040, 2054–2055, 2069–2070, 2084–2085, and 2099–2100 seasons was reduced by 2.4%, 5.1%, 7.1%, 10.9%, and 14.2%, respectively, under RCP4.5 and by 3.6%, 10.0%, 12.8%, 18.0%, and 21.0%, respectively, under RCP8.5. Similarly, the dry matter was reduced by 4.6%, 7.5%, 8.6%, 12.2%, and 14.9% under RCP4.5 and by 6.1%, 8.9%, 14.0%, 20.4%, and 23.3% under RCP8.5 in the 2039–2040, 2054–2055, 2069–2070, 2084–2085, and 2099–2100 seasons, respectively.
On the contrary, the irrigation requirement of wheat was increased by 3.0%, 5.0%, 8.1%, 11.2%, and 14.9% under RCP4.5 and by 5.5%, 7.0%, 11.1%, 14.2%, and 18.0% under RCP8.5 in the 2039–2040, 2054–2055, 2069–2070, 2084–2085, and 2099–2100 seasons, respectively. The trends indicate that the future simulations showed a reduction in yield and an increase in irrigation requirements, resulting in a negative impact of climate change on the water productivity of wheat. Hence, the water productivity in the 2039–2040, 2054–2055, 2069–2070, 2084–2085, and 2099–2100 seasons was reduced by 5.3%, 9.6%, 14.1%, 19.9%, and 25.3%, respectively, under RCP4.5 and by 11.2%, 15.9%, 21.5%, 28.2%, and 33.0%, respectively, under RCP8.5.
Overall, the wheat yield was reduced by 14.2% (RCP4.5) to 21.0% (RCP8.5), the dry matter was reduced by 14.9% (RCP4.5) to 23.3% (RCP8.5), the irrigation requirements were increased by 14.9% (RCP4.5) to 18.0% (RCP8.5), and the water productivity was reduced by 25.3% (RCP4.5) to 33.0% (RCP8.5) until the end of the century. The results are given in Table 5, and the seasonal growth, wheat yield, dry matter, and irrigation requirements are shown in Figure 8.

3.5.3. Simulations of Hypothetical Scenarios

To thoroughly evaluate the potential of additional nitrogen applications for enhancing wheat yield and counteracting the adverse effects of climate change on future wheat production, a series of simulations were conducted using the SALTMED model. These simulations incorporated various hypothetical scenarios that involved increasing nitrogen doses to levels higher than the standard, specifically N120 (120 kgN·ha−1) and N140 (140 kgN·ha−1). These nitrogen doses were tested under the I100 condition, which corresponds to 100% of the crop water requirement, CWR. This choice was made because the I100 condition had previously demonstrated superior wheat crop performance compared to lower irrigation levels.
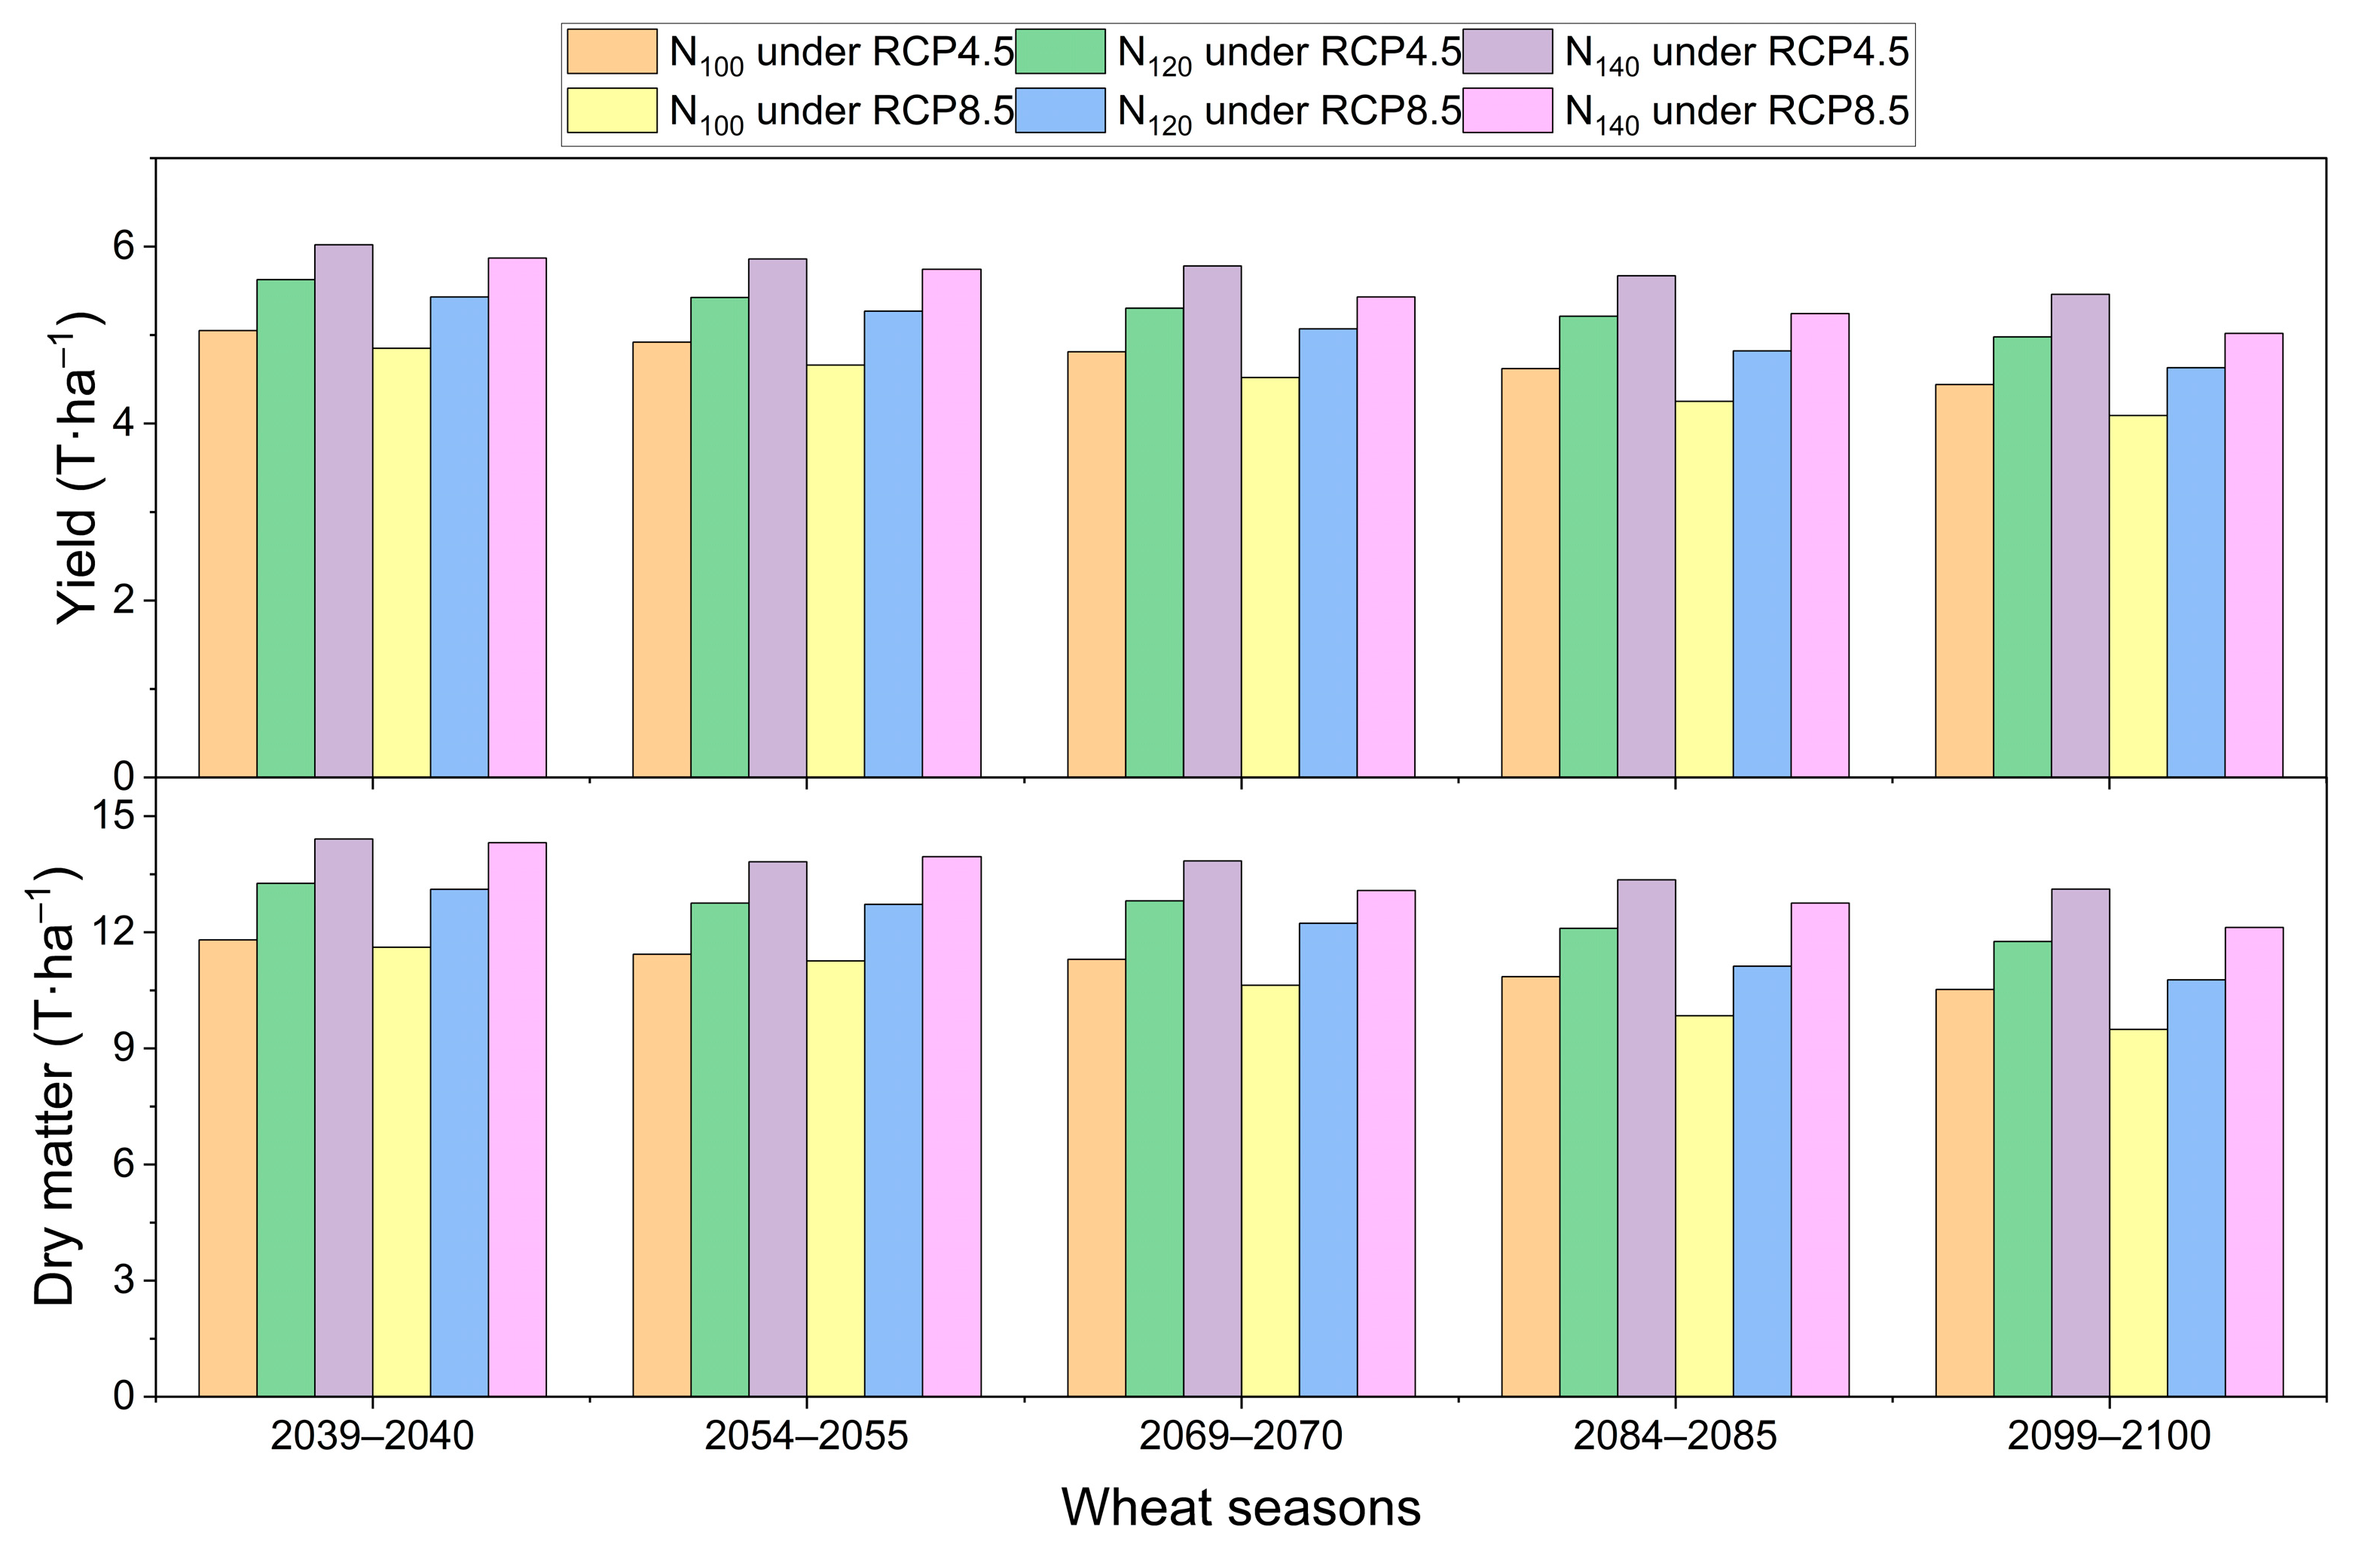
The simulations were meticulously designed to span multiple future wheat growing seasons to capture a range of potential climate conditions and their impacts. The specific time frames selected for these simulations included the wheat growing seasons of 2039–2040, 2054–2055, 2069–2070, 2084–2085, and 2099–2100. The results revealed that N120 produced a 5.62 T·ha−1 yield (11.4% higher) and 13.26 T·ha−1 of dry matter (12.4% higher) in the 2039–2040 season; a 5.42 T·ha−1 yield (10.2% higher) and 12.75 T·ha−1 of dry matter (11.5% higher) in the 2054–2055 season; a 5.3 T·ha−1 yield (10.2% higher) and 12.81 T·ha−1 of dry matter (13.4% higher) in the 2069–2070 season; a 5.21 T·ha−1 yield (12.8% higher) and 12.10 T·ha−1 of dry matter (11.5% higher) in the 2084–2085 season; and a 4.97 T·ha−1 yield (12.1% higher) and 11.76 T·ha−1 of dry matter (11.8% higher) in the 2099–2100 season under RCP4.5. Similarly, N140 produced a 6.20 T·ha−1 yield (19.2% higher) and 14.41 T·ha−1 of dry matter (22.1% higher) in the 2039–2040 season; a 5.86 T·ha−1 yield (19.1% higher) and 13.82 T·ha−1 of dry matter (20.9% higher) in the 2054–2055 season; a 5.78 T·ha−1 yield (20.2% higher) and 13.84 T·ha−1 of dry matter (22.5% higher) in the 2069–2070 season; a 5.67 T·ha−1 yield (22.7% higher) and 13.35 T·ha−1 of dry matter (23.1% higher) in the 2084–2085 season; and a 5.46 T·ha−1 yield (23.0% higher) and 13.11 T·ha−1 of dry matter (24.6% higher) in the 2099–2100 season under RCP4.5.
Under the RCP8.5 scenario, N120 produced a 5.43 T·ha−1 yield (12.0% higher) and 13.11 T·ha−1 of dry matter (12.9% higher) in the 2039–2040 season; a 5.27 T·ha−1 yield (13.1% higher) and 12.7 T·ha−1 of dry matter (13.0% higher) in the 2054–2055 season; a 5.07 T·ha−1 yield (12.2% higher) and 12.23 T·ha−1 of dry matter (15.1% higher) in the 2069–2070 season; a 4.82 T·ha−1 yield (13.4% higher) and 11.12 T·ha−1 of dry matter (13.0% higher) in the 2084–2085 season; and a 4.63 T·ha−1 yield (13.2% higher) and 10.77 T·ha−1 of dry matter (13.5% higher) in the 2099–2100 season. Similarly, N140 produced a 5.87 T·ha−1 yield (21.0% higher) and 14.31 T·ha−1 of dry matter (23.3% higher) in the 2039–2040 season; a 5.74 T·ha−1 yield (23.2% higher) and 13.95 T·ha−1 of dry matter (23.9% higher) in the 2054–2055 season; a 5.43 T·ha−1 yield (20.1% higher) and 13.07 T·ha−1 of dry matter (23.0% higher) in the 2069–2070 season; a 5.24 T·ha−1 yield (23.4% higher) and 12.75 T·ha−1 of dry matter (29.6% higher) in the 2084–2085 season; and a 5.01 T·ha−1 yield (22.7% higher) and 12.12 T·ha−1 of dry matter (27.7% higher) in the 2099–2100 season compared to RCP8.5.
Overall, N120 increased the wheat yield by 10.2–12.8% and dry matter by 11.5–13.4% under RCP4.5, whereas the wheat yield and dry matter were increased by 12.0–13.2% and 12.9–15.1%, respectively, under RCP8.5. Similarly, N140 increased the wheat yield by 19.1–23.0% and dry matter by 20.9–24.6% under RCP4.5, whereas these were improved by 20.1–23.4% and 23.0–29.6, respectively, under RCP8.5. The details regarding the improvements under different hypothetical scenarios are given in Table 6, while an illustration of the crop yield and dry matter is shown in Figure 9.

4. Discussion

The treatments with I100 (100% of CWR) and N100 (100 kgN·ha−1) performed better than the corresponding treatments with I80 (80% of CWR) and N80 (80 kgN·ha−1). This was due to optimal water application under I100 compared with I80. Full irrigation ensures that wheat plants receive adequate water throughout their growth stages, which is crucial for processes like photosynthesis, nutrient uptake, and overall plant metabolism [26]. Consistent moisture helps prevent stress that can hinder growth and grain filling [27]. Adequate and regular water supply ensures that the plants do not experience periods of drought stress, which can negatively affect physiological processes and reduce the overall productivity of the crop. Maintaining consistent moisture levels supports continuous growth, promotes optimal photosynthesis, enhances nutrient uptake, and ensures proper grain development. This steady water supply helps the plants to achieve their full growth potential and maximizes yield. On the other hand, deficit irrigation reduces the water supply at critical growth periods due to water stress, reduced photosynthetic efficiency, and lower biomass accumulation, ultimately resulting in decreased yields [28].
The wheat performed better at site-2 compared with site-1. This was due to the fact that the soil at site-2 was relatively more fertile and contained an optimal balance of essential nutrients, including nitrogen (N), phosphorus (P), potassium (K), zinc (Zn), iron (Fe), manganese (Mn), and copper (Cu). Additionally, the soil at site-2 had a higher organic matter content, which further promoted healthy plant growth. The presence of these nutrients in adequate quantities is crucial for various physiological and biochemical processes in plants, such as enzyme activation, chlorophyll formation, and energy transfer. Moreover, the increased organic matter improves soil structure, water retention, and microbial activity, all of which contribute to a more supportive environment for root development and nutrient uptake. Consequently, plants grown in the more fertile soil of site-2 exhibited better growth and higher productivity compared to those grown in less-fertile conditions [29]. The presence of organic matter in fertile soils improves soil structure, water retention, and nutrient-holding capacity, all of which are beneficial for crop yield. Marschner and Rengel [30] studied the effects of soil fertility on wheat production and reported that the availability of macronutrients like N, P, and K in soil significantly impacts plant growth and crop yield by supporting essential plant metabolic processes. Smith et al. [31] explained that beneficial micronutrients like Zn, Fe, and Mn enhance wheat yield. The soil of site-1 was saline, with higher EC and SAR; therefore, higher EC causes osmotic stress, limiting the plant’s water uptake and causing nutrient imbalances and deficiencies [32]. A high SAR reflects excess sodium, which displaces essential calcium and magnesium on soil particles, deteriorating soil structure and reducing permeability [33].
Nitrogen, a vital element within the agricultural domain, especially in wheat cultivation, plays a crucial role in determining the final yield of wheat production. According to Shi et al. [34], nitrogen is the most significant factor influencing wheat yield. The proper management of nitrogen levels is paramount for achieving optimal growth and maximum yield in wheat farming. Optimal nitrogen application leads to improved plant structure, notably through enhanced tiller formation. Tillering in wheat refers to the formation of lateral branches from the main stem, which can support additional spikes and grains. The process of tillering is crucial for maximizing grain yield, as it increases the number of potential grain-bearing structures per plant. Higher nitrogen application rates have been observed to stimulate tillering significantly. Moreover, nitrogen improves grain quality and size; factors that are crucial for market value and consumer preference. By facilitating the accumulation of carbohydrates in the plant’s biomass, nitrogen indirectly influences the weight and nutritional content of the wheat grain, as discussed by Yu et al. [35]. This accumulation not only supports robust plant growth but also enhances the water productivity of wheat; an essential factor considering the increasing concerns about water productivity in agriculture. Enhanced photosynthesis due to an adequate nitrogen supply leads to greater carbohydrate accumulation in wheat plants. This process is crucial for energy storage for later use in grain filling and development. Robust photosynthetic activity ensures a steady supply of carbohydrates, which are vital for the development of a plump, nutrient-rich grain, thus maximizing the economic return per hectare of cultivated land [36]. The effectiveness of nitrogen in improving wheat yield is not universally straightforward, as it largely depends on the specific cultivar and prevailing field conditions. Wu et al. [37] suggested that different wheat cultivars respond differently to nitrogen supplementation, indicating the necessity for tailored fertilizer practices that align with the specific genetic makeup and growth requirements of the cultivar in question. Researchers like Abebe and Sharma et al. [38,39] have been advocating for the importance of nitrogen and exploring its potential through extensive studies. Chaudhary [32] noted that as fertigation levels increased, crop yields initially increased, but they began to decrease once those levels surpassed a certain threshold.
The SALTMED model showed excellent performance during calibration and validation, reflected in higher values across all the performance indicators. The RMSE and NRMSE values were minimal and within the already established ranges in previous studies [40,41,42]. Also, the CRM values indicated negligible tendencies towards overestimation or underestimation, with decreased biasness (lower R2) in future predictions [12,32,43,44].
Climate change has become an increasingly critical factor in agricultural productivity, particularly affecting wheat yields across various geographic regions. Recent studies and simulations have highlighted a concerning trend: a gradual decline in wheat yields from the present into the future.
In semi-arid irrigated regions, higher temperatures play a role in shaping agricultural outcomes. Hanson et al. [45] and Hernandez-Ochoa et al. [46] have documented the multiple stresses that increased temperatures impose on wheat crops. These stresses include a disruption of normal growth patterns, a reduction in the length of growing periods, and disturbances in plant phenology, all of which contribute to diminished grain and biomass yields. Opposite to these findings, Wang et al. [47] presented a more subtle view of the interactions between climate change and wheat productivity. Their research suggested that wheat yields could actually improve under conditions of slightly increased CO2 concentrations, which bolster plant photosynthesis and enhance yield potentials. However, this optimistic scenario is not universally supported. Ishaque et al. [48] presented evidence that suggests a reduction in wheat yields under projected future climates within the same study area. These findings corroborate the broader consensus that, while some benefits from increased CO2 might be observed, the overall impact of climate change tends to negate these gains and poses a significant threat to agricultural stability and food security.
As the scientific community continues to study and understand the multifaceted effects of climate change on agriculture, it becomes increasingly important to sustainably employ advanced technologies and techniques to enhance wheat productivity in the future.

5. Conclusions

In this study, the SALTMED model was employed to assess future wheat growth. To train the model, field data were used from experiments conducted over two years (2020–2021 and 2021–2022), conducted with two levels of irrigation (I100 = 100 of ETc and I80 = 80% of ETc) and nitrogen doses (N100 = 100 kgN·ha−1 and N80 = 80 kgN·ha−1) for the wheat. The SALTMED model was calibrated for the wheat yield, dry matter, and plant height, and the performance of the calibration and validation processes was determined in terms of the root mean square error (RMSE), normalized root mean square error (NRMSE), coefficient of determination (R2), and coefficient of residual mass (CRM). The values of RMSE, NRMSE, R2, and CRM ranged from 0.23 to 1.82, 0.09 to 0.17, 0.91 to 0.93, and −0.01 to 0.02, respectively, for calibration, while for validation, they ranged from 0.31 to 1.89, 0.11 to 0.31, 0.87 to 0.90, and −0.02 to 0.01, respectively.
The projections for future climate scenarios indicated significant shifts in wheat phenology by the end of the century. The sowing dates advanced by nine days under RCP4.5 and eleven days under RCP8.5, while the harvesting dates shifted earlier by twenty-four days under RCP4.5 and twenty-eight days under RCP8.5. Consequently, the overall crop period was shortened by fifteen days under RCP4.5 and eighteen days under RCP8.5. Further simulations revealed substantial reductions in the wheat yield and dry matter, with yields decreasing by 14.2% under RCP4.5 and 21.0% under RCP8.5 and dry matter reducing by 14.9% under RCP4.5 and 23.3% under RCP8.5. Additionally, the irrigation requirement increased by 14.9% under RCP4.5 and 18.0% under RCP8.5, leading to a significant decline in water productivity, which decreased by 25.3% under RCP4.5 and 33.0% under RCP8.5 by the end of the century. Hypothetical scenarios suggested that increasing nitrogen applications by 20–40% could mitigate some of the negative impacts of climate change. These adjustments could enhance wheat yield by 11.4–20.8% and dry matter by 12.1–26.6% under RCP4.5 and by 12.8–22.1% and 13.5–25.5% under RCP8.5. These findings offer valuable insights into the effects of climate change on future wheat production, providing a basis for policymakers and stakeholders to develop effective contingency plans. Additionally, sustainable solutions can be adopted that can promote higher productivity in the region, helping to counteract the adverse impacts of climate change on wheat farming. The practical applications of this study include precision agriculture techniques informed by model predictions, aiding farmers in optimizing irrigation and nitrogen management amidst changing climatic conditions. Future research could focus on refining model parameters, integrating socio-economic impacts, and developing climate-resilient wheat varieties, thereby enhancing agricultural sustainability and resilience in the face of climate change challenges.

Author Contributions

Conceptualization, J.N.C. and R.R.; methodology, N.A. and A.I.K.; software, J.N.C. and R.R.; validation, H.L., R.R., M.R., N.A., A.I.K., and J.Z.; formal analysis, M.R. and J.Z.; investigation, J.N.C.; writing—original draft, J.N.C.; writing—review and editing, J.N.C., H.L., and R.R. All authors have read and agreed to the published version of the manuscript.

Funding

This research received no external funding.

Data Availability Statement

The data will be made available upon request.

Acknowledgments

The authors extend their gratitude to the local farmers (Khalid Rizwan) in Pakistan for permitting and assisting in the execution of the wheat experiments in their fields.

Conflicts of Interest

There are no competing interests in the submission of this manuscript. This manuscript was approved by all authors before submission.

References

  1. World Bank. The World Bank. Annual Report. 2020; World Bank: Washington, DC, USA, 2020; ISBN 978-1-4648-1619-2. [Google Scholar]
  2. GOV. Economic Survey of Pakistan 2021-22; Economic Adviser’s Wing, Finance Division, Government of Pakistan: Islamabad, Pakistan, 2022. [Google Scholar]
  3. Kiprutto, N.; Rotich, L.K.; Riungu, G.K. Agriculture, Climate Change and Food Security. OAlib 2015, 2, 1–7. [Google Scholar] [CrossRef]
  4. Dhakal, R.S.; Syme, G.; Andre, E.; Sabato, C. Sustainable Water Management for Urban Agriculture, Gardens and Public Open Space Irrigation: A Case Study in Perth. Agric. Sci. 2015, 6, 676–685. [Google Scholar] [CrossRef]
  5. Pastor, A.V.; Palazzo, A.; Havlik, P.; Biemans, H.; Wada, Y.; Obersteiner, M.; Kabat, P.; Ludwig, F. The Global Nexus of Food–Trade–Water Sustaining Environmental Flows by 2050. Nat. Sustain. 2019, 2, 499–507. [Google Scholar] [CrossRef]
  6. Makate, C.; Makate, M.; Mango, N.; Siziba, S. Increasing Resilience of Smallholder Farmers to Climate Change through Multiple Adoption of Proven Climate-Smart Agriculture Innovations. Lessons from Southern Africa. J. Environ. Manag. 2019, 231, 858–868. [Google Scholar] [CrossRef]
  7. Ahanger, M.; Qin, C.; Begum, N.; Maodong, Q.; Dong, X.; El-Esawi, M.A.; El-Sheikh, M.; Alatar, A.; Zhang, L. Nitrogen Availability Prevents Oxidative Effects of Salinity on Wheat Growth and Photosynthesis by Up-Regulating the Antioxidants and Osmolytes Metabolism, and Secondary Metabolite Accumulation. BMC Plant Biol. 2019, 19, 479. [Google Scholar] [CrossRef]
  8. Wiebe, K.; Robinson, S.; Cattaneo, A. Climate Change, Agriculture and Food Security. In Sustainable Food and Agriculture; Elsevier: Amsterdam, The Netherlands, 2019; pp. 55–74. [Google Scholar]
  9. World Bank. World Bank Annual Report 2023: A New Era in Development (English); World Bank: Washington, DC, USA, 2023. [Google Scholar]
  10. Hellin, J.; Fisher, E. Climate-Smart Agriculture and Non-Agricultural Livelihood Transformation. Climate 2019, 7, 48. [Google Scholar] [CrossRef]
  11. Rahman, M.H.; Ahmad, A.; Wang, X.; Wajid, A.; Nasim, W.; Hussain, M.; Ahmad, B.; Ahmad, I.; Ali, Z.; Ishaque, W.; et al. Multi-Model Projections of Future Climate and Climate Change Impacts Uncertainty Assessment for Cotton Production in Pakistan. Agric. For. Meteorol. 2018, 253–254, 94–113. [Google Scholar] [CrossRef]
  12. Chauhdary, J.N.; Bakhsh, A.; Engel, B.A.; Ragab, R. Improving Corn Production by Adopting Efficient Fertigation Practices: Experimental and Modeling Approach. Agric. Water Manag. 2019, 221, 449–461. [Google Scholar] [CrossRef]
  13. Ragab, R. SALTMED Publications in Irrigation and Drainage, 1st ed.; Schultz, B., Ed.; Wiley Online Library: Hoboken, NJ, USA, 2020. [Google Scholar]
  14. Hirich, A.; Fatnassi, H.; Ragab, R.; Choukr-Allah, R. Prediction of Climate Change Impact on Corn Grown in the South of Morocco Using the Saltmed Model. Irrig. Drain. 2016, 65, 9–18. [Google Scholar] [CrossRef]
  15. Pakpedia Gojra Weather Statistics. Available online: https://www.pakpedia.pk/gojra/#:~:text=Throughout%20the%20year%2C%20the%20temperature%20may%20vary%20from,resulting%20in%20average%20annual%20rainfall%20of%2068.58%20mm (accessed on 13 February 2024).
  16. WWO. Toba Tek Singh Annual Weather Averages. Available online: https://www.worldweatheronline.com/toba-tek-singh-weather-averages/punjab/pk.aspx (accessed on 13 February 2024).
  17. Taylor, K.; Ronald, S.; Meehl, G. An Overview of CMIP5 and the Experiment Design. Bull. Am. Meteorol. Soc. 2011, 93, 485–498. [Google Scholar] [CrossRef]
  18. Haider, H.; Zaman, M.; Liu, S.; Saifullah, M.; Usman, M.; Chauhdary, J.N.; Anjum, M.N.; Waseem, M. Appraisal of Climate Change and Its Impact on Water Resources of Pakistan: A Case Study of Mangla Watershed. Atmosphere 2020, 11, 1071. [Google Scholar] [CrossRef]
  19. Chauhdary, J.N.; Li, H.; Akbar, N.; Javaid, M.; Rizwan, M.; Akhlaq, M. Evaluating Corn Production under Different Plant Spacings through Integrated Modeling Approach and Simulating Its Future Response under Climate Change Scenarios. Agric. Water Manag. 2024, 293, 108691. [Google Scholar] [CrossRef]
  20. Jones, C.; Robertson, E.; Arora, V.; Friedlingstein, P.; Shevliakova, E.; Bopp, L.; Brovkin, V.; Hajima, T.; Kato, E.; Kawamiya, M.; et al. Twenty-First-Century Compatible CO2 Emissions and Airborne Fraction Simulated by CMIP5 Earth System Models under Four Representative Concentration Pathways. J. Clim. 2013, 26, 4398–4413. [Google Scholar] [CrossRef]
  21. Tschöke, G.V.; Kruk, N.S.; de Queiroz, P.I.B.; Chou, S.C.; de Sousa Junior, W.C. Comparison of Two Bias Correction Methods for Precipitation Simulated with a Regional Climate Model. Theor. Appl. Climatol. 2017, 127, 841–852. [Google Scholar] [CrossRef]
  22. Ragab, R. Integrated Management Tool for Water, Crop, Soil and N-Fertilizers: The Saltmed Model. Irrig. Drain. 2015, 64, 1–12. [Google Scholar] [CrossRef]
  23. Soothar, R.K.; Zhang, W.; Zhang, Y.; Tankari, M.; Mirjat, U.; Wang, Y. Evaluating the Performance of SALTMED Model under Alternate Irrigation Using Saline and Fresh Water Strategies to Winter Wheat in the North China Plain. Environ. Sci. Pollut. Res. 2019, 26, 34499–34509. [Google Scholar] [CrossRef]
  24. French, R.J. Nutrient Management Guidelines for Wheat in Mediterranean-Type Environments. Aust. J. Agric. Res. 1998, 39, 631–642. [Google Scholar]
  25. Shaheen, N.; Jahandad, A.; Goheer, M.A.; Ahmad, Q.A. Future Changes in Growing Degree Days of Wheat Crop in Pakistan as Simulated in CORDEX South Asia Experiments. APN Sci. Bull. 2020, 10, 1–12. [Google Scholar] [CrossRef]
  26. Adeel, A.; Adnan, M. Impact of Full vs. Deficit Irrigations on Various Phenological Stages of Wheat. Int. J. Agron. Agric. Res. 2018, 13, 55–62. [Google Scholar]
  27. Zamani, A.; Emam, Y.; Edalat, M. Response of Bread Wheat Cultivars to Terminal Water Stress and Cytokinin Application from a Grain Phenotyping Perspective. Agronomy 2024, 14, 182. [Google Scholar] [CrossRef]
  28. Ali, S.; Xu, Y.; Ma, X.; Ahmad, I.; Kamran, M.; Dong, Z.; Cai, T.; Jia, Q.; Ren, X.; Zhang, P.; et al. Planting Patterns and Deficit Irrigation Strategies to Improve Wheat Production and Water Use Efficiency under Simulated Rainfall Conditions. Front. Plant Sci. 2017, 8, 1408. [Google Scholar] [CrossRef] [PubMed]
  29. Lal, R. Enhancing Crop Yields in the Developing Countries through Restoration of the Soil Organic Carbon Pool in Agricultural Lands. Land. Degrad. Dev. 2006, 17, 197–209. [Google Scholar] [CrossRef]
  30. Marschner, P.; Rengel, Z. Nutrient Availability in Soils. In Marschner’s Mineral Nutrition of Higher Plants; Elsevier: Amsterdam, The Netherlands, 2012; pp. 315–330. [Google Scholar]
  31. Smith, S.E.; Read, D. Mycorrhizas in Agriculture, Horticulture and Forestry. In Mycorrhizal Symbiosis; Elsevier: Amsterdam, The Netherlands, 2008; pp. 611–625. [Google Scholar]
  32. Chauhdary, J.N. Modeling Effects of Different Irrigation and Fertigation Strategies on Maize (Zea mays) Response and Salinity Buildup in Root Zone under Drip Irrigation. Ph.D. Dissertation, University of Agriculture, Faisalabad, Pakistan, 2018. [Google Scholar]
  33. Roy, S.; Chowdhury, N. Salt Stress in Plants and Amelioration Strategies: A Critical Review. In Abiotic Stress in Plants; IntechOpen: London, UK, 2021. [Google Scholar]
  34. Shi, H.; Hou, L.; Xu, X.; Zhu, Y.; Zhai, B.; Liu, Z. Effects of Different Rates of Nitrogen Fertilizer on Apple Yield, Fruit Quality, and Dynamics of Soil Moisture and Nitrate in Soil of Rainfed Apple Orchards on the Loess Plateau, China. Eur. J. Agron. 2023, 150, 126950. [Google Scholar] [CrossRef]
  35. Yu, B.-G.; Chen, X.-X.; Zhou, C.-X.; Ding, T.-B.; Wang, Z.-H.; Zou, C.-Q. Nutritional Composition of Maize Grain Associated with Phosphorus and Zinc Fertilization. J. Food Compos. Anal. 2022, 114, 104775. [Google Scholar] [CrossRef]
  36. Li, S.X.; Wang, Z.H.; Hu, T.T.; Gao, Y.J.; Stewart, B.A. Chapter 3 Nitrogen in Dryland Soils of China and Its Management. In Advances in Agronomy; Elsevier: Amsterdam, The Netherlands, 2009; pp. 123–181. [Google Scholar]
  37. Wu, W.; Wang, Y.; Wang, L.; Xu, H.; Zörb, C.; Geilfus, C.-M.; Xue, C.; Sun, Z.; Ma, W. Booting Stage Is the Key Timing for Split Nitrogen Application in Improving Grain Yield and Quality of Wheat—A Global Meta-Analysis. Field Crops Res. 2022, 287, 108665. [Google Scholar] [CrossRef]
  38. Sharma, A.R.; Behera, U.K. Response of Wheat (Tritucum aestivum) to Nitrogen Fertilization under Varying Tillage and Crop Establishment Practices in Greengram–Wheat Cropping System. Exp. Agric. 2016, 52, 605–616. [Google Scholar] [CrossRef]
  39. Abebe, B. Effect of the Time and Rate of N-Fertilizer Application on Growth and Yield of Wheat (Triticum aestivum L.) at Gamo-Gofa Zone, Southern Ethiopia. J. Nat. Sci. Res. 2016, 6, 111–122. [Google Scholar]
  40. Feleke, H.G.; Savage, M.; Tesfaye, K. Calibration and Validation of APSIM–Maize, DSSAT CERES–Maize and AquaCrop Models for Ethiopian Tropical Environments. S. Afr. J. Plant Soil 2021, 38, 36–51. [Google Scholar] [CrossRef]
  41. Ren, X.; Sun, D.; Wang, Q. Modeling the Effects of Plant Density on Maize Productivity and Water Balance in the Loess Plateau of China. Agric. Water Manag. 2016, 171, 40–48. [Google Scholar] [CrossRef]
  42. Daliakopoulos, I.N.; Pappa, P.; Grillakis, M.G.; Varouchakis, E.A.; Tsanis, I.K. Modeling Soil Salinity in Greenhouse Cultivations under a Changing Climate with SALTMED: Model Modification and Application in Timpaki, Crete. Soil. Sci. 2016, 181, 241–251. [Google Scholar] [CrossRef]
  43. Chauhdary, J.N.; Bakhsh, A.; Ragab, R.; Khaliq, A.; Engel, B.A.; Rizwan, M.; Shahid, M.A.; Nawaz, Q. Modeling Corn Growth and Root Zone Salinity Dynamics to Improve Irrigation and Fertigation Management under Semi-Arid Conditions. Agric. Water Manag. 2020, 230, 105952. [Google Scholar] [CrossRef]
  44. Gaydon, D.S.; Balwinder-Singh; Wang, E.; Poulton, P.L.; Ahmad, B.; Ahmed, F.; Akhter, S.; Ali, I.; Amarasingha, R.; Chaki, A.K.; et al. Evaluation of the APSIM Model in Cropping Systems of Asia. Field Crops Res. 2017, 204, 52–75. [Google Scholar] [CrossRef]
  45. Hanson, C.E.; Palutikof, J.P.; Livermore, M.T.J.; Barring, L.; Bindi, M.; Corte-Real, J.; Durao, R.; Giannakopoulos, C.; Good, P.; Holt, T.; et al. Modelling the Impact of Climate Extremes: An Overview of the MICE Project. Clim. Chang. 2007, 81, 163–177. [Google Scholar] [CrossRef]
  46. Hernandez-Ochoa, I.M.; Asseng, S.; Kassie, B.T.; Xiong, W.; Robertson, R.; Luz Pequeno, D.N.; Sonder, K.; Reynolds, M.; Babar, M.A.; Molero Milan, A.; et al. Climate Change Impact on Mexico Wheat Production. Agric. For. Meteorol. 2018, 263, 373–387. [Google Scholar] [CrossRef]
  47. Wang, D.; Heckathorn, S.A.; Wang, X.; Philpott, S.M. A Meta-Analysis of Plant Physiological and Growth Responses to Temperature and Elevated CO2. Oecologia 2012, 169, 1–13. [Google Scholar] [CrossRef]
  48. Ishaque, W.; Osman, R.; Hafiza, B.S.; Malghani, S.; Zhao, B.; Xu, M.; Ata-Ul-Karim, S.T. Quantifying the Impacts of Climate Change on Wheat Phenology, Yield, and Evapotranspiration under Irrigated and Rainfed Conditions. Agric. Water Manag. 2023, 275, 108017. [Google Scholar] [CrossRef]
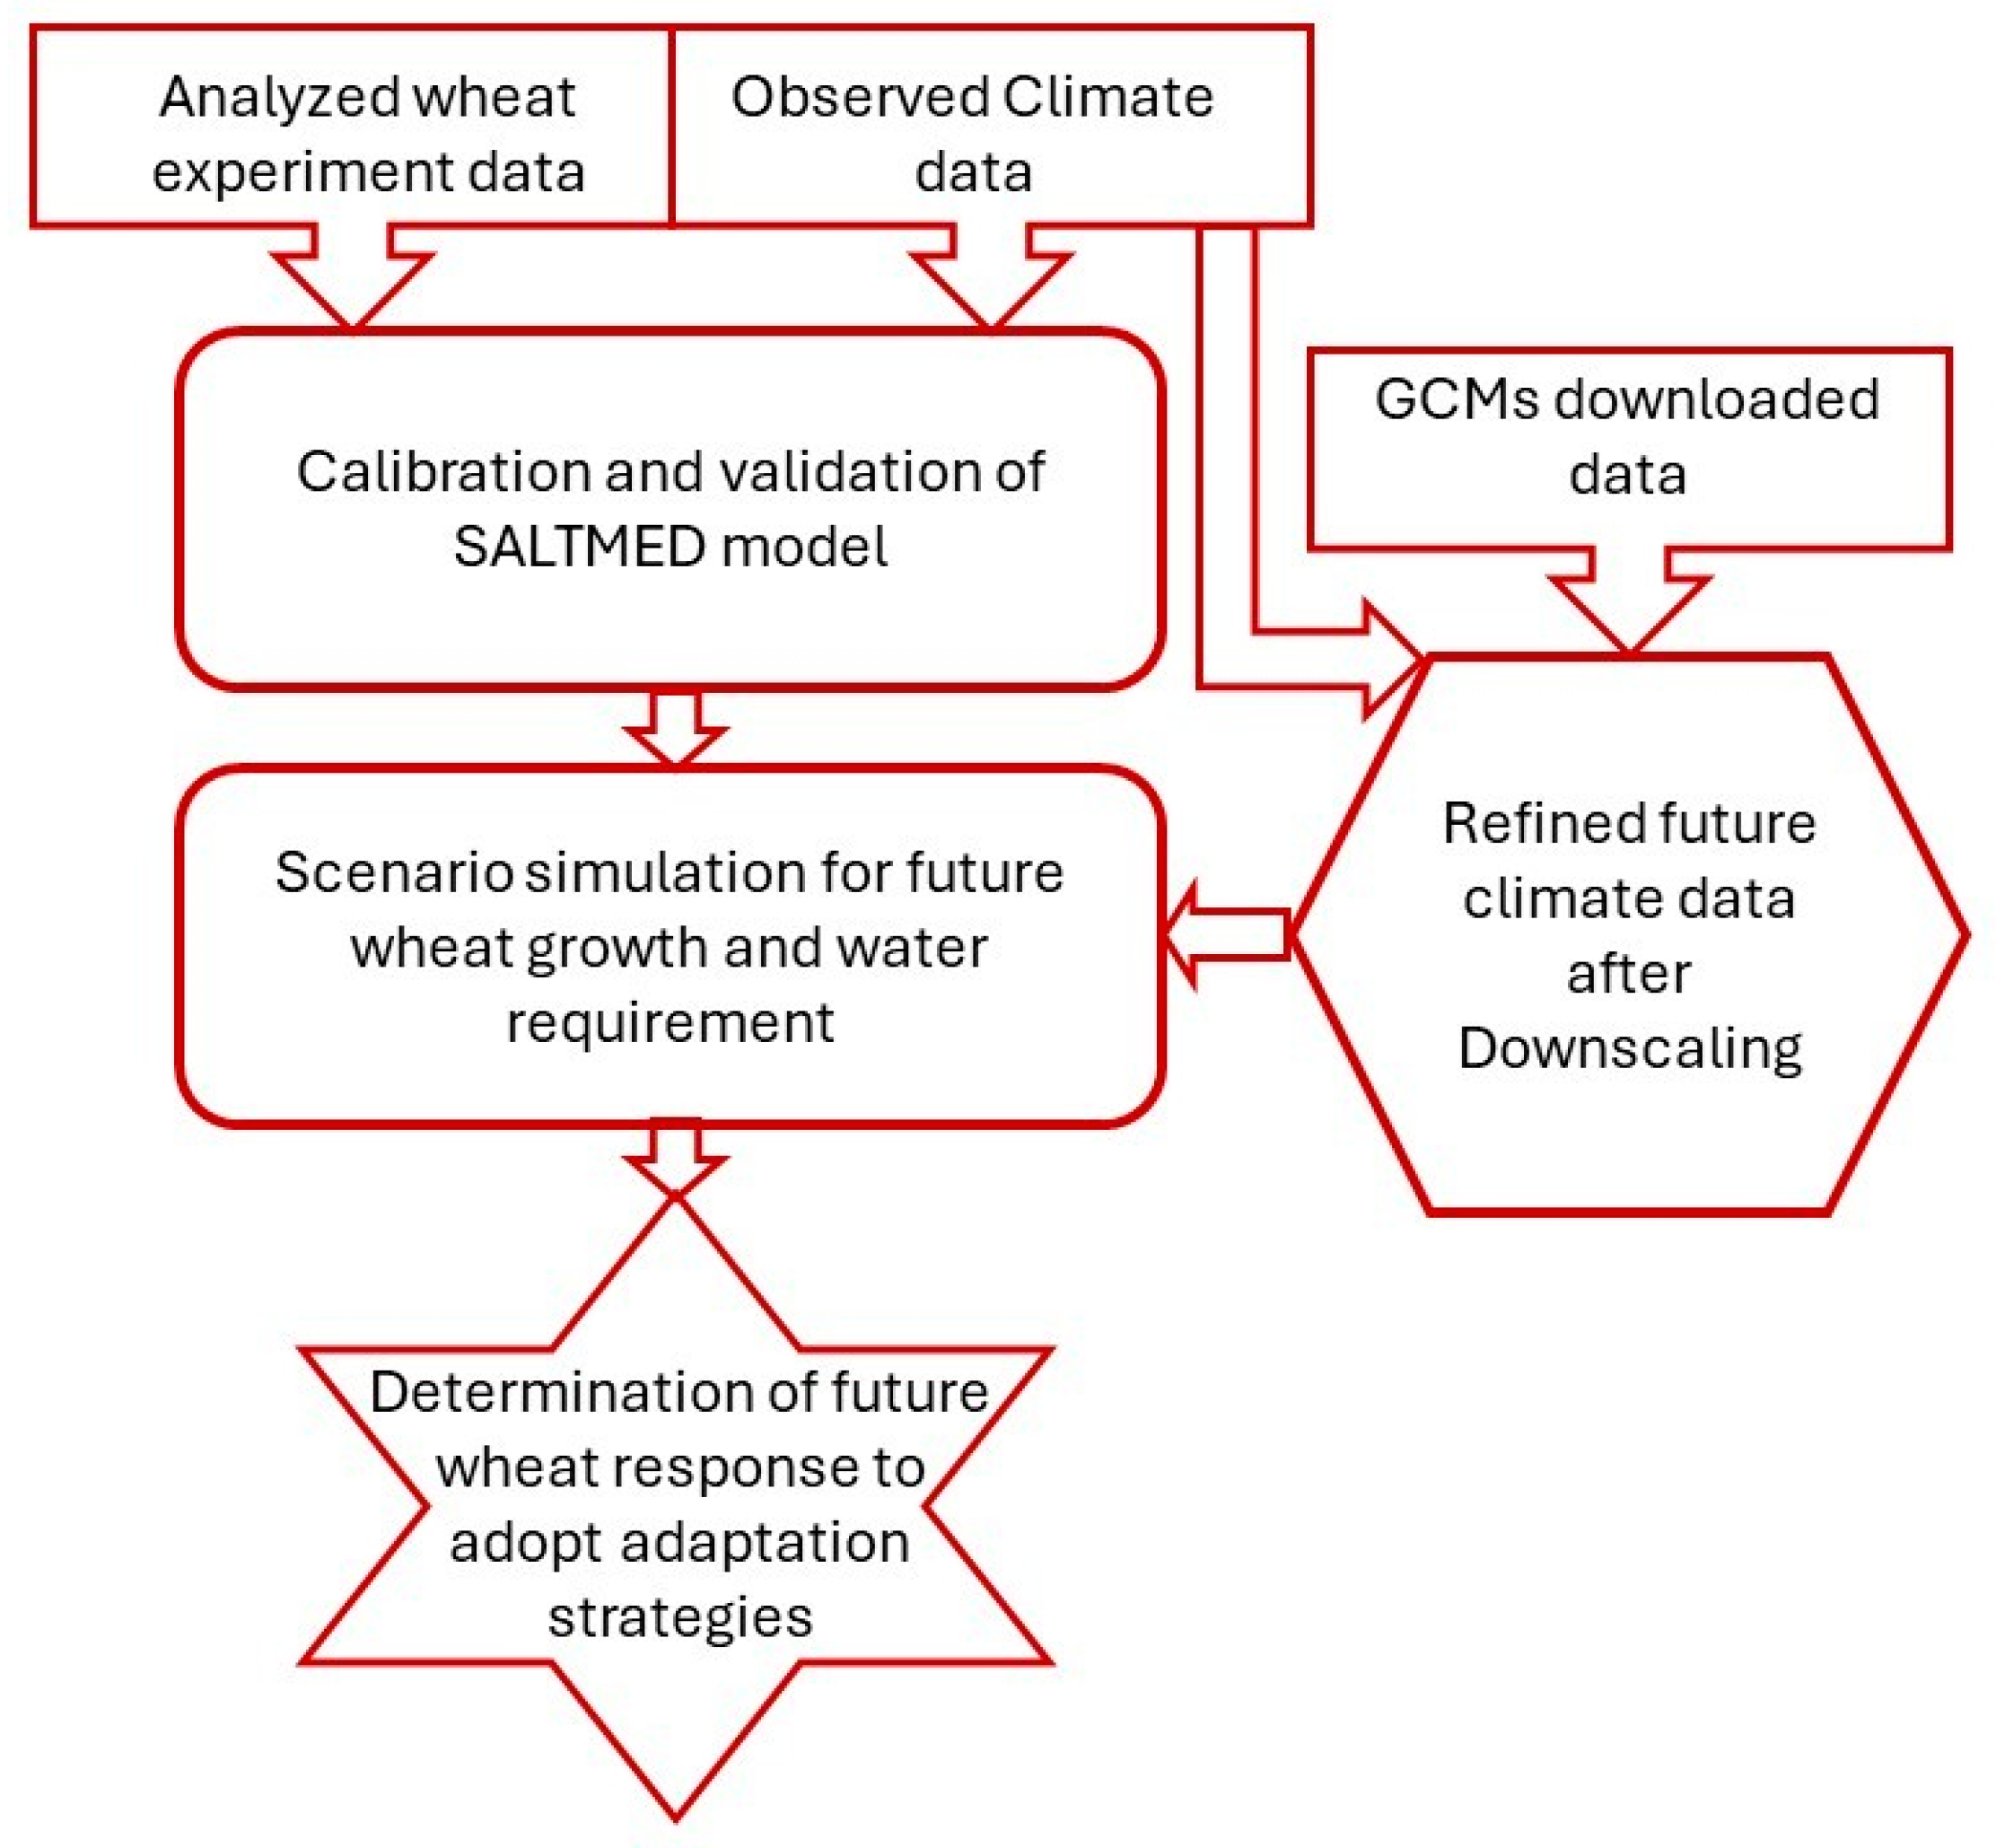
Figure 1. Flowchart depicting the application of the SALTMED model for predicting future climate change on wheat response.
Agronomy 14 01484 g001
Figure 2. Comparative analysis of GCM data with observed data (1991–2005). (a) Maximum temperature, (b) minimum temperature, (c) solar radiation, and (d) precipitation.
Agronomy 14 01484 g002
Figure 3. Projected future climate data under two RCPs for selected wheat seasons.
Agronomy 14 01484 g003
Figure 4. Climate conditions at the experiment site for wheat seasons 2020–2021 and 2021–2022.
Agronomy 14 01484 g004
Figure 5. Comparison between observed and simulated values of crop parameters during calibration and validation of SALTMED.
Agronomy 14 01484 g005
Figure 6. SALTMED model dialogue to simulate crop growth using the accumulated degree days (heat units) for wheat grown in central Punjab, Pakistan.
Agronomy 14 01484 g006
Figure 7. Illustration of changes in wheat crop growth periods under various climate scenarios.
Agronomy 14 01484 g007
Figure 8. Simulations of wheat yield, dry matter, and irrigation requirements under different scenarios of future climate change.
Agronomy 14 01484 g008
Figure 9. Simulation of wheat grain yield and dry matter under various hypothetical nitrogen application scenarios in the context of future climate change.
Agronomy 14 01484 g009
Table 1. Results of soil analysis for both sites.
ParametersSite-1Site-2Acceptable Ranges of Selected Parameters [24]
Physical properties
Soil textureSandy clay loam soil (50.14% sand, 23.35% silt, 26.51 clay)Sandy clay loam soil (47.21% sand, 26.49% silt, 26.3 clay)----
Bulk density (g·cm−3)1.631.54
Chemical properties
pH8.78.17–7.5
EC (dS·m−1)8.44.2<2 for good soil,
4–8 for moderate soil
SAR: sodium adsorption ratio (meq·L−1)17108–18
O.M: organic matter (%)1.44.23–5
N: nitrogen (mg·kg−1)123520–40
P: Olsen phosphate
(mg·kg−1)
7.02215–30
K: extractable potassium (mg·kg−1)85145100–200
Zn: zinc (mg·kg−1)0.21.21–3
Fe: iron (mg·kg−1)24.24.5–6.5
Mn: manganese (mg·kg−1)2.13.22–5
Cu: copper (mg·kg−1)0.150.270.2–1.0
Table 2. Comparison of the yield parameters and water productivity of the wheat.
Yield (T·ha−1)Dry Matter (T·ha−1)Plant Height (cm)Water Productivity (kg·m−3)
Treatment Wise Comparison
I100 × N1004.83 a ± 0.2012.45 a ± 0.3395.11 a ± 1.371.16 b ± 0.05
I80 × N1004.38 b ± 0.1811.54 b + 0.2393.02 ab ± 0.841.29 a ± 0.06
I100 × N803.87 c ± 0.179.88 c ± 0.2891.99 b ± 0.890.93 d ± 0.04
I80 × N803.40 d ± 0.198.84 d ± 0.3188.31 c ± 0.871.01 c ± 0.05
LSD0.4450.9042.8790.064
Year Wise Comparison
2020–20214.38 a ± 0.1611.49 a ± 0.3294.04 a ± 0.871.14 a ± 0.04
2021–20223.86 b ± 0.179.87 b ± 0.3290.17 b ± 0.621.05 b ± 0.05
LSD0.4710.9362.1920.081
Site Wise Comparison
Site-13.57 b ± 0.1310.12 b ± 0.3691.21 a ± 0.770.95 b ± 0.03
Site-24.67 a ± 0.1411.24 a ± 0.3393.01 a ± 0.891.25 a ± 0.04
LSD0.3681.0012.4250.092
Treatment means with different letters are significantly different at p = 0.05 based on the LSD (least significant difference) test.
Table 3. Calibrated values for soil and crop-related model parameters.
Soil ParametersCrop Parameters
ParametersCalibrated/Measured ValueParametersCalibrated/Measured Value
Saturated water content/porosity0.442 m3·m−3Harvest index0.432
Maximum evaporation depth96 mmLeaf area index0.86 (initial stage)
0.47 (mid stage)
0.45 (end stage)
Wilting point0.121 m3·m−3Fraction cover (Fc)0.56 (initial stage)
0.92 (mid stage)
0.97 (end stage)
Field capacity0.212 m3·m−3Transpiration crop coefficient (Kcb)0.58 (initial stage)
0.91 (mid stage)
0.47 (end stage)
Bubbling pressure9.29 cmPlant height0.35 m (initial stage)
1.05 m (mid stage)
1.00 m (end stage)
Saturated hydraulic conductivity128 mm·d−1π5010 (initial stage)
11 (mid stage)
13 (end stage)
Lambda pore size distribution index0.310Crop coefficient (Kc)0.7 (initial stage)
1.21 (mid stage)
0.48 (end stage)
Table 4. Evaluation of model calibration and validation for crop parameters.
Model RunSitesTreatmentYield (T·ha−1)Dry Matter (T·ha−1)Plant Height (cm)
ObservedSimulatedObservedSimulatedObservedSimulated
CalibrationSite-1I100 × N1004.614.7912.9512.6198.08101.70
I100 × N1005.655.4113.7013.4497.6299.14
I80 × N1004.144.5112.0311.2193.3594.32
I80 × N1005.145.2312.7611.8296.1998.12
Site-2I100 × N803.633.6810.2110.7191.3892.31
I100 × N804.614.2111.0011.0896.0095.21
I80 × N803.173.279.019.0887.4888.64
I80 × N804.134.2310.2610.0892.2494.12
RMSE0.23--0.51--1.82--
NRMSE0.09--0.11--0.17--
R20.91--0.93--0.92--
CRM-0.01--0.02---0.01--
ValidationSite-1I100 × N1003.894.1110.8011.3292.194.2
I100 × N1005.184.8412.3611.4892.793.5
I80 × N1003.463.629.9810.2590.593.9
I80 × N1004.804.1211.3910.6192.193.2
Site-2I100 × N803.043.218.518.9190.2892.12
I100 × N804.183.989.819.4290.3091.23
I80 × N802.622.737.467.7886.5188.62
I80 × N803.703.888.638.4287.0288.21
RMSE0.31--0.52--1.89--
NRMSE0.12--0.11--0.31--
R20.89--0.90--0.87--
CRM0.01--0.01--−0.02--
Table 5. The simulated wheat yield, dry matter, irrigation requirements and water productivity under different scenarios of future climate change.
Wheat SeasonWheat Yield (T·ha−1)Dry Matter (T·ha−1)
Baseline data2021–20225.18 12.36
RCP4.5% DecreaseRCP8.5% DecreaseRCP4.5% DecreaseRCP8.5% Decrease
Future simulations2039–20405.052.44.856.311.804.611.616.1
2054–20554.925.14.6610.011.437.511.268.9
2069–20704.817.14.5212.811.308.610.6314.0
2084–20854.6210.94.2518.010.8512.29.8420.4
2099–21004.4414.24.0921.010.5214.99.4923.3
Wheat seasonIrrigation requirement (mm)Water productivity (kg·m−3)
Baseline data2021–2022365 1.42
RCP4.5% IncreaseRCP8.5% IncreaseRCP4.5% DecreaseRCP8.5% Decrease
Future simulations2039–20403763.03855.51.345.31.2611.2
2054–20553835.03917.01.289.61.1915.9
2069–20703958.140511.11.2214.11.1121.5
2084–208540611.241714.21.1419.91.0228.2
2099–210041914.943118.01.0625.30.9533.0
Table 6. Percent increase in wheat yield and dry matter under hypothetical scenarios.
Wheat Season% Increase in Yield under RCP4.5% Increase in Yield under RCP4.5
N120N140N120N140
2039–204011.419.212.021.0
2054–205510.219.113.123.2
2069–207010.220.212.220.1
2084–208512.822.713.423.4
2099–210012.123.013.222.7
Average11.420.812.822.1
% increase in dry matter under RCP4.5% increase in dry matter under RCP8.5
N120N140N120N140
2039–204012.422.112.923.3
2054–205511.520.913.023.9
2069–207013.422.515.123.0
2084–208511.523.113.029.6
2099–210011.824.613.527.7
Average12.122.613.525.5
Disclaimer/Publisher’s Note: The statements, opinions and data contained in all publications are solely those of the individual author(s) and contributor(s) and not of MDPI and/or the editor(s). MDPI and/or the editor(s) disclaim responsibility for any injury to people or property resulting from any ideas, methods, instructions or products referred to in the content.