Article

Sensitivity Analysis of Performance Indices of Surge-Flow Irrigation with System Variables Using the SIRMOD Model

by
Catalina Romay
1,*,
Alejandra Ezquerra-Canalejo
2 and
Guido Fernando Botta
3
1
Facultad de Agronomía, Universidad de Buenos Aires, CABA, Buenos Aires 1417, Argentina
2
Escuela Técnica Superior de Ingeniería de Monte, Forestal y del Medio Natural, Universidad Politécnica de Madrid, 28040 Madrid, Spain
3
Departamento de Tecnología, Universidad de Luján, Luján 6700, Argentina
*
Author to whom correspondence should be addressed.
Agronomy 2024, 14(7), 1509; https://doi.org/10.3390/agronomy14071509
Submission received: 12 January 2024 / Revised: 15 February 2024 / Accepted: 18 February 2024 / Published: 12 July 2024

Abstract

:
A current challenge of irrigationengineering is to modernize surface irrigation. For example, surge flow irrigation has the potential to increase the efficiency of applying irrigationwater. The objective of this study was to perform a sensitivity analysis using the performance indices: Application Efficiency (AE), Storage Efficiency (SE), Distribution Efficiency (DE), Deep Percolation (DP), and Runoff (RO), and to investigate their relationship with the main system variables: length (L), unit flow rate (Qo), surge cycles and surge time, using the SIRMOD model. The SIRMOD model simulates the hydraulics of surface irrigation at the field level. The model with the best fit of AE, DE, DP, and RO as a function of L, Qo, or surge cycles and surge time was a quadratic polynomial function with an R2 > 0.70. The model reflects the goodness of fit to the variable that is intended to be explained. The AE is an increasing function of L and a decreasing function of Qo, while DE and RO are decreasing functions of L and are increasing functions of Qo. The number of surges has an impact on the stream size of each surge and on the volume of water stored, but not on the performance indices. It was demonstrated that the SIRMOD model provided the ability to adjust the system parameters and design variables, giving answersto any surge flow configuration. The potential application efficiency (AEpot) (>80%) can be achieved by establishing, e.g., an optimal flow rate (Qopt), with a schedule for the cycle number and surge time, according to soil characteristics.

1. Introduction

Surface irrigation is the most common irrigation technique worldwide due to its low costs and energy requirements compared to pressurized irrigation systems. At the same time, the furrow system is the most commonly used method in surface irrigation [1]. In this method, water is applied to the furrows, which are small channels built into the soil, and moves across the soil surface by gravity forces. In this manner, water infiltrates laterally and deeply through the wetted perimeter to fill the soil. Nevertheless, furrow irrigation presents certain problems, such as low yield indices, inadequate uniformity, and high deep percolation and runoff [2,3]. Thence, a current challenge of irrigation engineering is to modernize and rehabilitate surface irrigation, obtaining high efficiencies and uniformity, and minimizing runoff and deep percolation losses. Achievement of these premises, i.e., the introduction of new irrigation techniques such as surge flow irrigation, may be reached. Nonetheless, it implies the adoption of evaluation and design techniques that allow adjusting the water supply to the seasonal requirements of the crops.
Surge flow irrigation is the intermittent application of water to surface irrigated furrows in a series of relatively short on-and-off time periods called cycles [4]. Cycle times vary from a few minutes to several hours. This practice is more complex than continuous furrow irrigation. In addition to selecting the flow rate and the application time, surge flow irrigation also requires the selection of cycle times, the cycle ratio, and the flow rate, or the time reduction strategy. The cycle time is defined as the sum of the on-time (surge with water) and off-time (surge without water), and the surge cycle ratio is the relation between the on-time to the total cycle time. For example, if thesurgeon-time was 20 min andthe surge-off timewas 20 min, then the cycle time would be 40 min (20 + 20) and thecycle ratio would be 0.5 (surgeon-time 20 min compared to cycle time 40 min (20/40) = 0.5).
Surge flow irrigation technology was first applied in Bulgaria [4,5] and in the former Russian territories named Kyrgyzstan and Uzbekistan [6,7,8,9]. However, this new technology was not widely adopted in these regions. The impacts of surge irrigation were initially observed later in the United States. Stringham and Keller [10] introduced the surge flow concept at the Irrigation and Drainage Specialty Conference of the American Society of Civil Engineers. In March 1986, the US Patent Office issued patent number 4.577.802 titled “Method and System for furrows irrigating”, listing Drs. Jack Keller and G.E. Stringham as inventors and the Utah State University Foundation as assignee.
The first field trials on surge flow irrigation were conducted by [11] and later summarized by [12]. This technique was widely applied in the United States in the 1980s [13]. Automation of this system came about through the manufacture of commercial automated butterfly valves with programmable computers, assembled on pipes with adjustable gates, providing accurate flow to the furrow [14,15,16]. These early field evaluations were replaced by numerous trials under a wide range of conditions and expanded by promoting regional research coordination.
The adoption and use of surge flow irrigation have gained popularity and acceptance in many areas of the world over conventional surface irrigation since the early 1980s. As a matter of fact, it is estimated to be one of the most promising methods. Amer and Attafy [17] stated that to improve furrow irrigation performance, several variations of the traditional method have been developed, among them the technique of surge irrigation.
Several studies have been carried out with the objective of increasing irrigation efficiency under the surface irrigation technique [18]. A large number of researchers [19,20,21,22,23] have studied the potential benefits of irrigating with surge flow compared to conventional irrigation.
The early field surge flow furrow evaluations showed an interesting application efficiencies comparison, with 87% in surge irrigation and 29% in continuous irrigation [13]. Romay et al. [24] showed the results of comparative evaluations between conventional and surge irrigation. They concluded that the depth applied in surge flow furrow irrigation was very close to half of that applied with conventional irrigation. Hence, the application efficiency was doubled. Deep percolation and runoff were, as a percentage, lower in surge flow irrigation. Nevertheless, equipment underutilization was still evident, as the efficiencies achieved were far from those that were feasible (70% or more). Romay et al. [25] concluded that the introduction of surge flow irrigation was very well accepted by users, allowing an increase in irrigation efficiency. In point of fact, it was economically very convenient in all the cases analyzed if its effects were combined as technology savings (water and labor) and valorization (yield increase). Likewise, in most cases, the investment was highly profitable considering only the savings effect, being amortized in a very short term (less than two years). The evaluation of user opinion and preference showed a satisfactory assessment of the method, coinciding at all levels (producer, manager, and irrigator). However, they also recommended that the after-sales services should adjust the operating mechanism to achieve greater user satisfaction. This could be quickly capitalized through an increase in the number of clients and/or the surface area under surge irrigation. Horst et al. [26] observed that the best water productivity was achieved with the surge flow technique adopting alternate-furrow irrigation, reducing water consumption by 44% and increasing application efficiency by 85%. However, the results identified the need to better adjust inflow rates to soil infiltration conditions, cut-off times to the soil water deficits, and improve irrigation scheduling. Kifle et al. [20] summarized that treatments with surge irrigation which applied moderate flow rates and low cycle rates managed to reach the end of the furrow with a 23% faster advance time compared to conventional irrigation. Schaible and Aillery [16] concluded that field assessment using surge irrigation compared to conventional irrigation saved water by 50% in sugarcane production and around 25% in cotton. Kifle et al. [22] found no significant differences in onion production using alternate-furrow irrigation compared to conventional irrigation. Nonetheless, the effect of surge irrigation was significant compared to conventional irrigation on the performance indices (application efficiencyand distribution efficiency). The runoff losses in continuous flow were higher than those of surge and alternate flow at the same flow rate.This was reflected in the water use efficiency, giving a significant difference in the onion crop yields per mm of water applied. They recommended that these irrigation methods (surge and alternate) could enhance poor water management practices in regions with limited water resources. Mattar et al. [21] compared continuous and surge irrigations under different levels of flow rate and tillage depth to assess their potential for improving irrigation system performance and wheat production. They found a water saving of 8 to 34% in surge-irrigated plots under different levels of flow rate and tillage depth. They found also that, for different parameters like the volume of water, distribution uniformity, application efficiency, deep percolation losses, and yield of wheat, the surge mode of irrigation is convincingly better compared with conventional irrigation. Abdel-Moneim et al. [27] showed that the surge flow resulted in the highest overall efficiency compared with continuous flow. Water saving by surge irrigation varied from 23 to 60% over continuous flow for the first irrigation. They observed that surge irrigation at the midpoint of the furrow offered greater opportunity for water intake because it applied water in cycles, a state thatresulted in a high amount of water being stored in the root zone, which in turn resulted in high application efficiency.
In parallel withthese field trials, efforts were concentrated on the development of simulation models for the operation of surge flow irrigation. Mailapalli et al. [28] concluded that the performance of surface irrigation systems could be improved if irrigation hydraulics were mathematically simulated, without having to resort to extensive field experiments which were costly and time-consuming.
For several years, different mathematical models were formulated, tested, and simulated for surge flow furrow irrigation systems, with and without slope. The first efforts involved modifying one of the hydraulic models (kinematic wave) to simulate the advance of water [29]. Elliott et al. [30] as well as Purkey and Wallender [31] evaluated the Barre de Saint-Venant equations under a zero-inertia model using data collected from surge irrigation field evaluations. They used the modified Kostiacov equation to describe the infiltration characteristics. The results showed that the model could predict the advance under these infiltration conditions. Essafi [32] formulated a volume balance model that was successfully verified for surge irrigation conditions. Walker and Skogerboe [13] did the same for the full hydrodynamic model. Camacho et al. [33] as well as Cahoon and Eisenhauer [34] modified the proposed models by including other factors affecting water infiltration in furrows, such as geometry and wetted perimeter, along with time and cycle ratio. These models had significant potential to facilitate and simplify the analysis of surge irrigation and allowed the prediction of infiltration at different cycle times and cycle ratios.
Improving the efficiency and performance of surface irrigation methods can be achieved using mathematical models for simulating irrigation performance and investigating the variations in management variables, in which substantial improvement in irrigation efficiency is obtained [3]. The major benefits of mathematical simulation models for surface irrigation include their high speed, low cost, capacity to investigatevarious combinations of design parameters without the need for extensive and high-cost field experiments, and ability to rapidly review new surface irrigation schemes across a wide range [23]. Currently, the development of models to modernize and optimize surface irrigation systems has multiplied. The SIRMOD III model [35] and the WinSRFR 5.1 model [36,37,38] are the two surface irrigation simulation programs that include surge irrigation with various options for surge times and cycle ratios. These models have been developed with a user-friendly interface.
Ismail et al. [39] evaluated and optimized the performance of furrow irrigation systems in Egypt using the WinSRFR 5.1 software. They concluded that increasing the furrow length reduced irrigation performance, and the optimal combination of inflow rate and cut-off time resulted in increased application efficiency and reduced deep percolation losses. Yadeta et al. [40] assessed furrow irrigation performance using the WinSRFR software in Ethiopia. The results indicated that changing decision variables (inflow rate and cut-off time) significantly improved performance indices, such as application efficiency and deep percolation, but the uniformity of distribution remained unchanged. Ahmadabadi et al. [3] investigated various scenarios using the SIRMOD model to improve furrow irrigation application efficiency in sugar beet fields located in the Moghan plain of Ardabil province, Iran. The results demonstrated that using different scenarios could significantly reduce water losses in the field. Ebrahimian et al. [41] used several models to estimate infiltration parameters of furrow irrigation. The results demonstrated that the Elliott et al. [30] method was the most accurate among the various two-point methods. The multi-level calibration method was the most accurate method for estimating the infiltration coefficients compared to other computer-based models. Their sensitivity analysis demonstrated that changes of errors in estimating infiltration parameters were a function of soil texture, furrow length, inflow, and field slope. Hornbuckle et al. [42] concluded that the SIRMOD model presents different strategies to improve the efficiency and performance of irrigation systems, and it has proved to be extremely useful for improving irrigation efficiency. The SIRMOD model is considered a powerful tool for agricultural water management.
To evaluate the performance of the surface irrigation simulation models and obtain reliable results, the field parameters of the model need to be measured with an acceptable level of accuracy. The simulation accuracy of the model depends on the input factors, especially the inflow rate, the infiltration equation coefficients, and the Manning’s roughness coefficient [43]
The surge flow furrow irrigation technique has the potential to efficiently use water and energy resources, while maintaining high crop production, for a wide range of soil types and slopes. It is necessary to design and manage this irrigation technique properly in order to enhance its application. Simulation models are tools that allow us to examine situations that cannot be achieved with the available design and evaluation procedures. They are tools that allow sensitivity analysis based on system parameters and recommended design variables. Most studies have evaluated the accuracy and performance of the SIRMOD model for conventional furrow irrigation systems; however, few studies have evaluated surge flow furrow irrigation. The objective of this study was to analyze the performance indices Application Efficiency (AE), Storage Efficiency (SE), Distribution Efficiency (DE), Deep Percolation (DP), and Runoff (RO), and their relationship with the main system variables: length (L), unit flow rate (Qo), surge cycles, and surge time. The SIRMOD model was calibrated and validated using field measurements. In order to improve performance indices, different management approacheswere simulated via the SIRMOD model, and then the results were compared with those of field measurements.

2. Materials and Methods

2.1. Physical Parameters for Surge Irrigation

Irrigation, regardless of the technique used, seeks to refill the root zone with waterthat nature does not supply. Thus, the crop does not experience water stress, and resources such as energy, water, nutrients, and cultural practices are conserved. The aim of the irrigation design is to maximize benefits, in terms of net economic gains, or in irrigation performance, given the constraints under which the system must operate. The performance indices (AE, SE, DE, DP, and RO) result from the interaction of several parameters. These parameters are P = f (a, k, fo, n, So, Zreq, L, Vmax, Qo, and tco), where P represents the performance indicator function of the physical parameters (system variables and system parameters), which are defined below.
The physical parameters that determine the outcome of an irrigation event are generally of two types, as given by [44]:
(1)
System parameters: parameters that characterize the system under study and have little or no margin for change (the required irrigation depth (Zreq), the maximum allowable velocity (Vmax), the field slope (So), the roughness expressed through the Manning’s coefficient (n), the infiltration equation (k, a and fo, given the modified Kostiakov–Lewis infiltration equation), and the parameters characterizing the furrow’s geometry).
(2)
System variables: variables whose magnitudes can change within a relatively wide range of values defined by the decision maker (the flow rate (Qo), the time of cutoff (tco) defined from the number of cycles and surge times, and, to a lesser extent, the furrow length (L)).
The irrigation system design must be based on the required application depth, Zreq, which is equal to the soil moisture removed by crop evapotranspiration. The required depth depends on adequate knowledge of infiltration changes over time. However, field conditions quantified from the measured soil physical parameters, particularly infiltration and roughness, are highly spatially and temporally variable and become difficult to characterize in a timely manner throughout the irrigation season. The design should be continuously updated and adjusted during the irrigation season to meet ongoing field changes. In practice, this is done by initially estimating two of the three design and management parameters, Qo and tco, not only at the design stage on the field but also before or immediately after the start of each irrigation.

2.2. Simulation Model

For modeling surface irrigation, the flow is divided into the water movement on the soil surface and the movement below the surface. It will be conditioned by furrow geometry, while infiltration will be conditioned by the characteristics of the profile. The total hydraulic process is therefore complex, and its rational analysis is practically impossible. However, the data from the mathematical models have allowed engineers to improve systematically irrigation system design and operation which, for many years, have been mainly based on the rule of thumb, rough empirical guidelines, and approximations [45]. The flow hydraulics in surface irrigation is modeled with the Barre de Saint-Venant equations (mass and momentum conservation). Its resolution can be through full resolution, or with simplified models called full hydrodynamic (FH), zero inertia (ZI), kinematic wave (KW), or volume balance (VB). The FH is the most complex and the most accurate. It is based on the complete Saint-Venant equations for the conservation of mass and momentum. The ZI is a slightly simplified version of the complete Saint-Venant equations that leaves out the acceleration or inertia terms in the momentum equation. The KW uses further simplifications and uniform flow assumptions. The simplest model, one that involves the largest number of assumptions, is the VB. It is based on the analytical or numerical solution of the temporally and spatiallylumped mass conservation, commonly referred to as the “volume balance” approach [46]. These models use simplified analysis based on algebraic solutions to hydrodynamics and generally use infiltration functions that are easy to simulate under uniform soil conditions.

2.2.1. SIRMOD III Software

The SIRMOD III model [47] is acomprehensive softwaresuitefor simulating surface irrigation hydraulics. The simulation routine used in SIRMOD III is based on the numerical solution of the Saint-Venant equation as described by [13]. Based on the theoretical principles of volume balance and selecting a combination of operational parameters, the model allows real situations to be simulated, which will result in the optimization of irrigation practice. It does not optimize the variables but simulates the response system by incorporating values of each variable extracted from field tests. It then allows the design that will conclude in the optimal management of the surface irrigation practice. In addition to the numerical output, the program provides a graphical display of the water flow paths, relating the distance to the time of the irrigation phases.
The SIRMOD model uses three approaches (FH, ZI, and KW) to simulate the hydraulics of surface irrigation (border, furrow, and basin) on the field scale, and helps in the evaluation of alternative field layouts (L and So) and management practices like Zreq and tco. It presents a simplified field design module and a ‘‘two-point’’ solution for the calculation of the infiltration parameters from the irrigation advance data. The software allows the user to specify furrow, border, or basin configurations with free-draining or blocked downstream boundary conditions under continuous or surged flow regimes and cutback options. Figure 1 presents a flow diagram of the software, with the input data requirements for the simulation component and the output volume balance, and simulated system performance for surge flow irrigation.

2.2.2. Irrigation Performance Indices

The indicators were defined as follows:
Application efficiency:
A E = Average depth of water added to the root zone storage Average depth of water applied to the furrow × 100
Storage efficiency:
S E = Average depth of water added to root zone storage Average depth of potencial soil moisture storage × 100
Distribution efficiency
D E = Average depth of the lower 25% of infiltrated water Average depth of infiltrated water applied to the furrow × 100
Deep percolation
D P = Average depth of deep percolated water Average depth of water applied to the furrow × 100
Runoff
R O = Average depth of run off water Average depth of water applied to the furrow × 100
Of these required inputs, the most difficult to determine adequately are the infiltration characteristics and the furrow inflows, which often require either relatively expensive equipment or significant periods of time and skilled operators. Infiltration characteristics are represented in the SIRMOD model with the Kostiakov–Lewis infiltration equation.

2.3. Field Data

The input data used in this study came from an MSc thesis on irrigation and drainage [48]. In this research, the performance of the surge flow furrow irrigation technique was evaluated and compared with conventional irrigation, based on the Walker and Skogerboe methodology [13]. The performance was determined by applying the volume balance model from field data of the irrigation units. Thirty data sets for furrows were used in this assessment. Soil texture was obtained using the hydrometer method [49], and the textural class was determined using the USDA method. The soil bulk density (BD) was measured using the cylinder method [50]. The average slopes of the experimental field were obtained using the Pentax auto-level AP series [51]. In each of the fields, before irrigation events, samples were collected from the beginning, middle, and end of the furrow from three different depths (0–30, 30–60, and 60–90 cm), and the water content of the samples was measure in the laboratory. Soil samples were oven dried at 105 °C. The water content in the root zone was measured 24–48–72h after the irrigation event to determine dry weight Wg (g g−1) and was used to calculate the water requirement in the root zone (volumetric humidity, Wv) from Wg*BD (cm3 cm−3). The length of the furrow was measured with a tapemeasure. The volume of water applied, drained, and infiltrated was measured through inflow and outflow, with trapezoidal flumes. Cross-section area and furrow geometry parameters were measured using a furrow perfilometer. The timeof cut-off, number of cycles, surge cycle on time, surge adjust time, and surge adjust ratio were recorded through a survey.

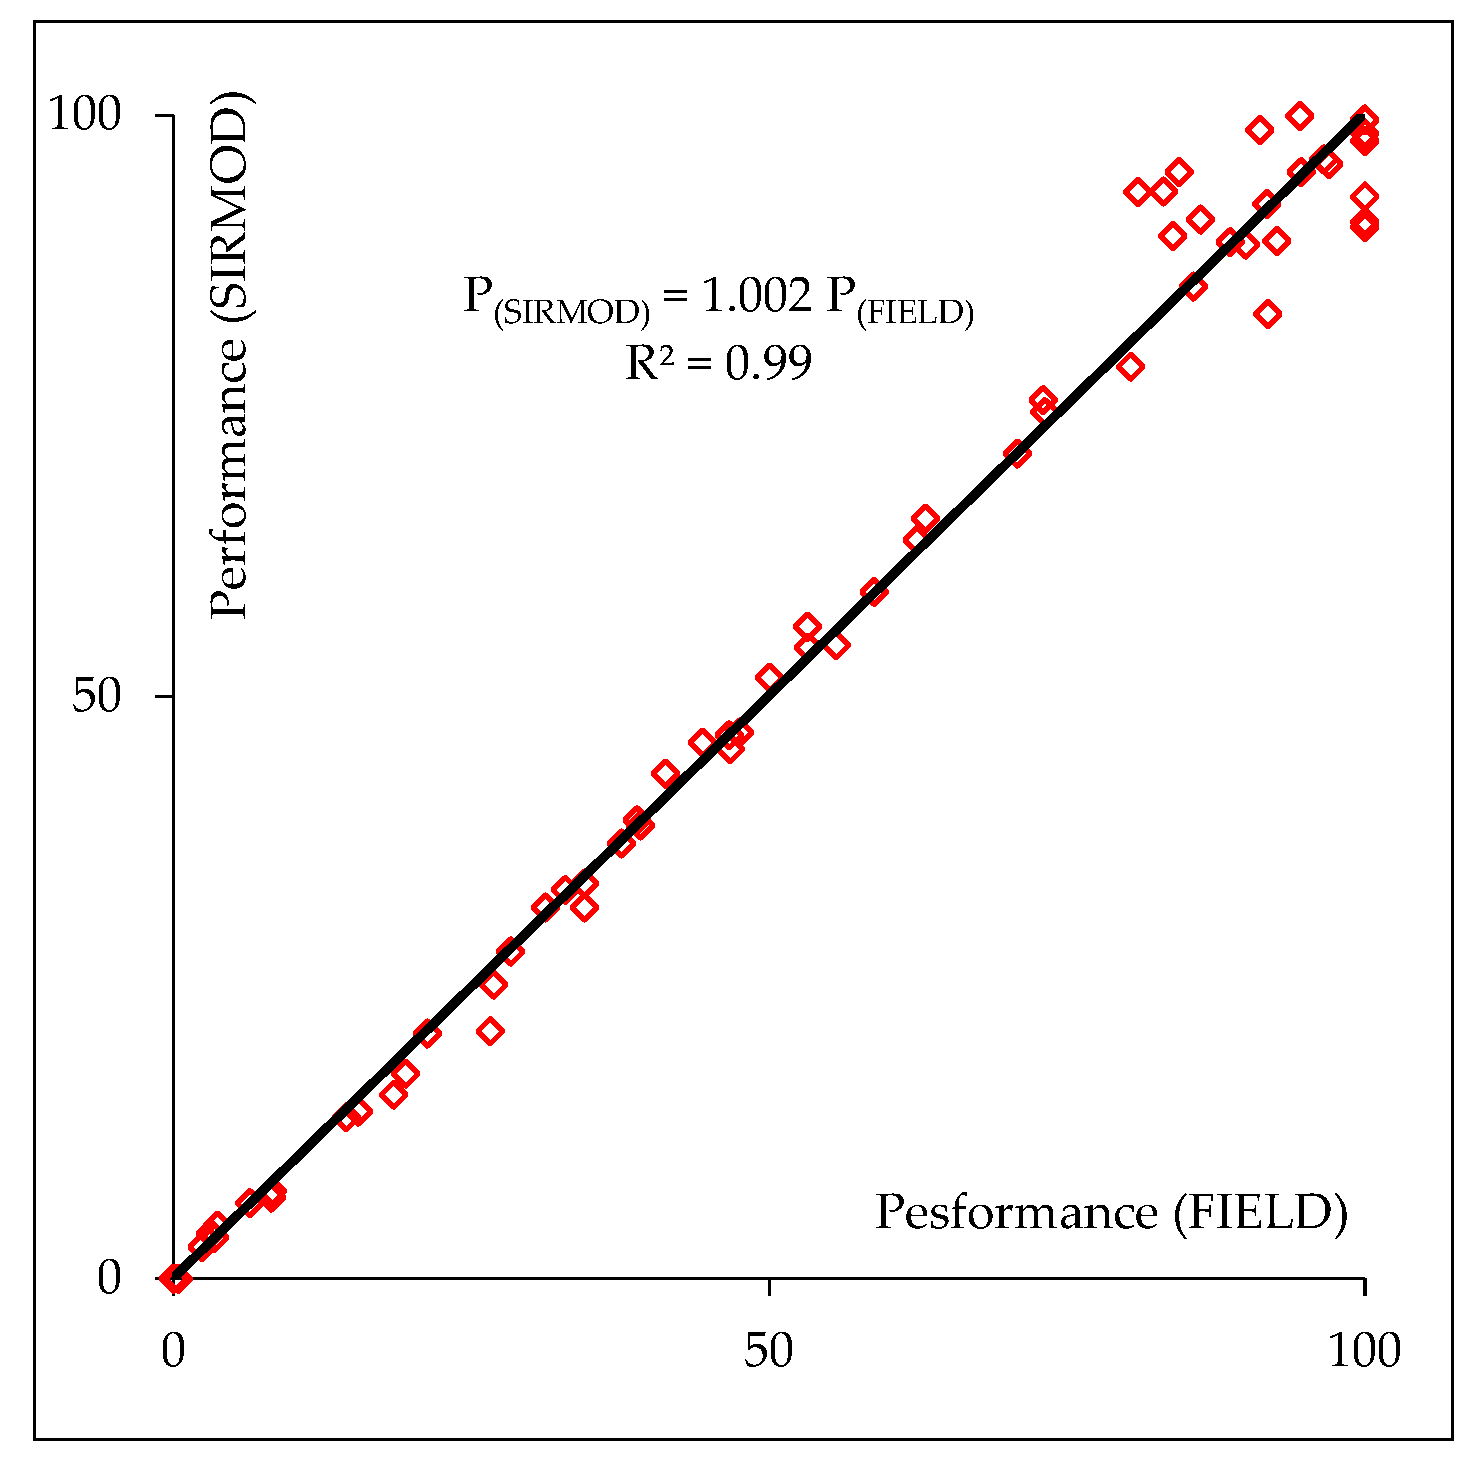
2.4. Calibration and Validation of the SIRMOD Model

This paragraph summarizes the results from the thesis [48] that were used to calibrate and validate the SIRMOD model.The trend of the field results showed an improvement in the water application by surge irrigation compared to the conventional method. The analysis of variance (ANOVA) indicated that there were significant differences in AE and RO, and there were no significant differences in DE and DP (p < 0.01). The average AE of all evaluations was 55% (minimum 21%, maximum 89%), and a decrease in losses with an average DP of 31% (minimum 3%, maximum 62%), and an average RO of 13% (minimum 0%, maximum 63%). The application depth exceeded therequired depth by the crop, resulting in SE of 100% in all cases. The average DE was 89% (minimum 71%, maximum 98%). The performance according to Roscher’sclassification was satisfactory in storage and distribution, and good in application [52]. Nevertheless, the recommended index values were not reached (APE 70% or more).
To calibrate and validate the model, all case studies were simulated with the SIRMOD III model. Accurate information was entered on system parameters and variables, which interact and determine responses such as application, infiltrated, stored, runoff, and percolated depths, and finally calculate the performance indices (AP, ST, DI, DP, and RO). Figure 2 shows the statistical correlation between surge flow furrow irrigation performance indices from field evaluations and simulations (SIRMOD III), giving a determination coefficient of R2 = 0.99.
The model suggests that an error of less than 5% in the simulations is acceptable. The results of all the simulations performed are below this value. It is observed that the simulations have a high linear fit with a coefficient of 1.002 between the performance indices obtained from the field evaluations compared to the simulations.

2.5. Sensitivity Analysisof Performance Indices with SIRMOD Software

Modifying parameters and variables of surge irrigation systems (L, Qo, tco, cycle number, and surge times) through simulation (validated model) allows analysis of how the performance indices vary. Merrian et al. [53] propose the calculation of the potential application efficiency (AEpot) which can be achieved when the average infiltrated and stored depth equals the required water depth. It indicates the degree of application efficiency that the method can achieve if the management is correct, minimizing losses by deep percolation and runoff, and operating the irrigation with adequate flow rates and precise application times. For each simulated (validated) evaluation, L was modified, decreasing and increasing by 5 m for each new simulation. For Qo, it was increased and decreased in steps of 10%, and the number of surge cycles (n) was modified by 3, 4, 5, 6, and 7, maintaining the total irrigation time. In each simulation, all other parameters and system variables were kept constant. The results of the performance indices were recorded, and those that ensured the minimum infiltrated depth at the end of the furrow and the minimum Zreq (SE = 100%) were analyzed. The results obtained from P = f(Qo), P = f(L), and P = f(n) were represented graphically by analyzing the best-fitting model. Then, considering the Qopt, tco was adjusted through a new schedule of surge cycles and surge times that would result in the maximum AEpot.
Table 1 summarizes the physical properties, parameters, and system variables introduced in the SIRMOD III model of three field studies classified into fine, medium, and coarse soil. The results of these cases are presented in detail. Then, the potential performance indices are shown for all case studies, establishing the optimal flow rate, Qopt, added to a number of cycles and surge times, according to the hydraulic characteristics.

3. Results and Discussion

The performance indices AE, SE, DE, RO, and DP were calculated as a function of variations in L when Qo was given, variations in Qo when L was given, and variations in tco (number of surge cycles and surge time) when Qo and L were given.

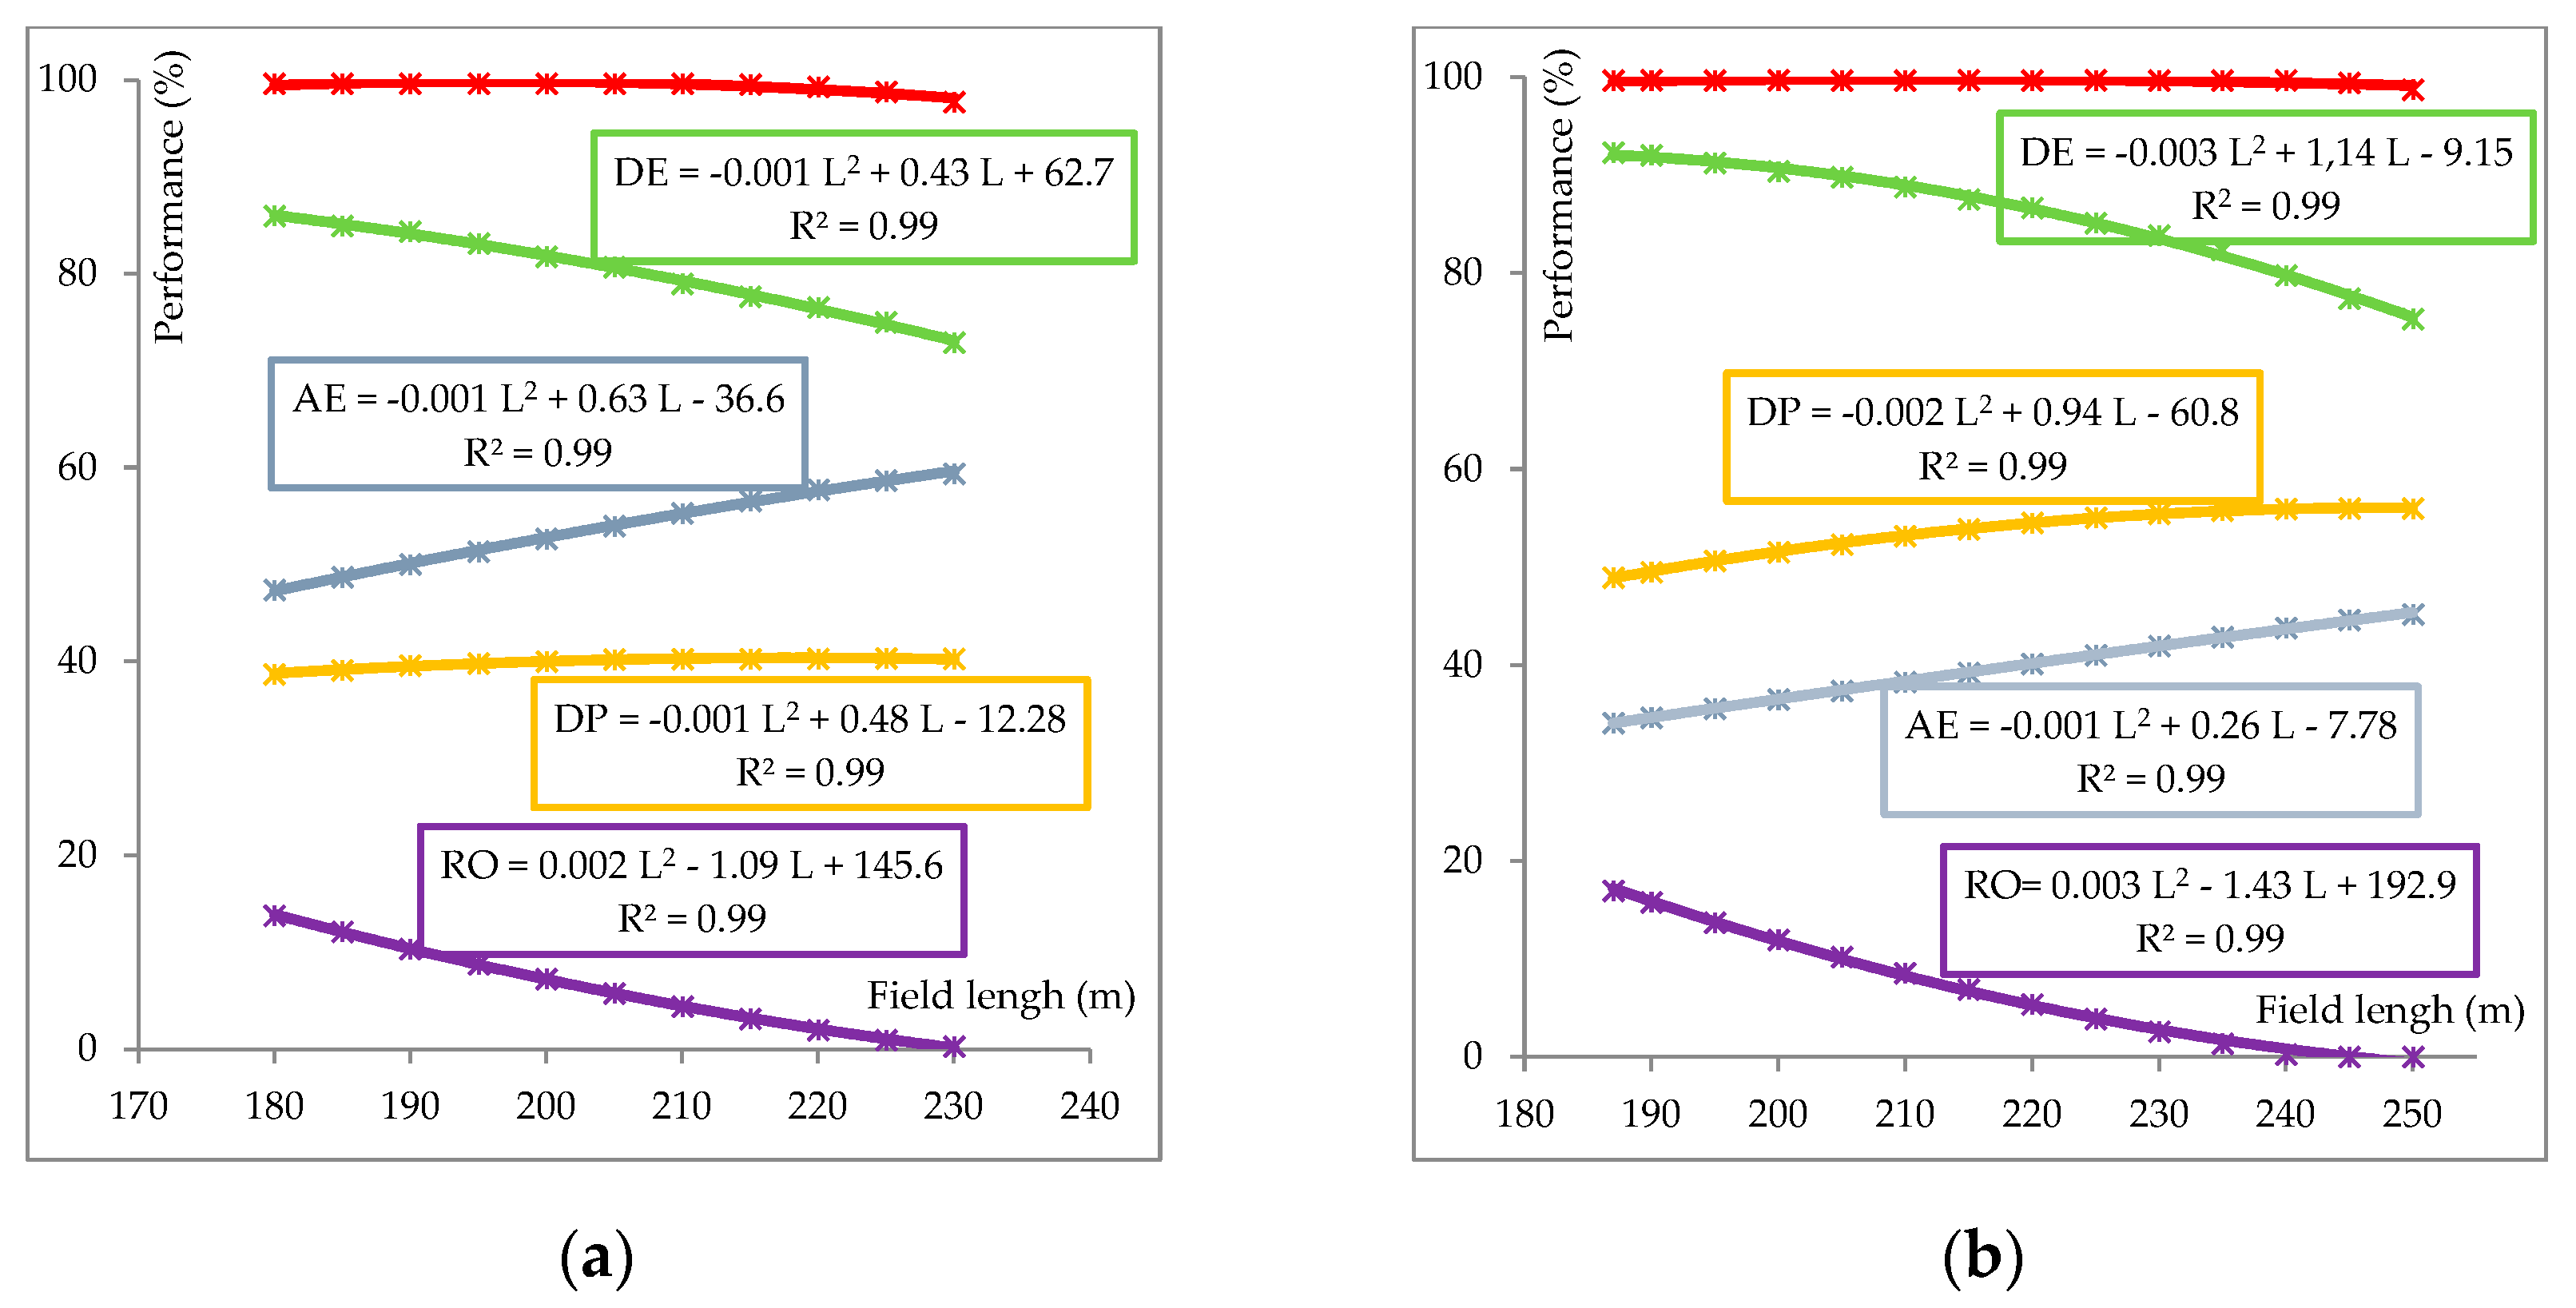
3.1. Simulation Performance Indices as a Function of L

The simulation performance index results as a function of L when Qo and the programming cycle number and surge times were given for fine- and medium-textured soils are presented in Figure 3. As can be seen, AE is an increasing function of L, while DE and RO are decreasing functions of L. The mathematical model with the best fit between AE, DI, DP, RO, and L is a quadratic polynomial function with R2 = 0.
The results showed that simulation models are tools that allow us to find the optimal length of the irrigation unit. Many authors have concluded that surge flow irrigation produces the advance of the waterfront more quickly, allowing the irrigation unit to be lengthened. The average increase in length recorded in this study was 28% in fine soils and 34% in medium soils. Modifying the length with surge irrigation improved AE by 25% in fine soils and 28% in medium soils. The RO was reduced on average by 98% in both soils. When AE improved, DE decreased (on average, the DE decreased by 14% in both types of soil). In the coarse soils studied, the L of the unit could only be lengthened by an average of 5% without showing an appreciable increase in AE. Holzapfel et al. [54] analyzed the relationship between the system variables of furrow irrigation and the performance indices as a basis for design and management. The results indicated that increasing the length of the furrow increased AE and reduced RO and DE. Xu et al. [2] showed that AE values were increased by increasing the length of the furrow.

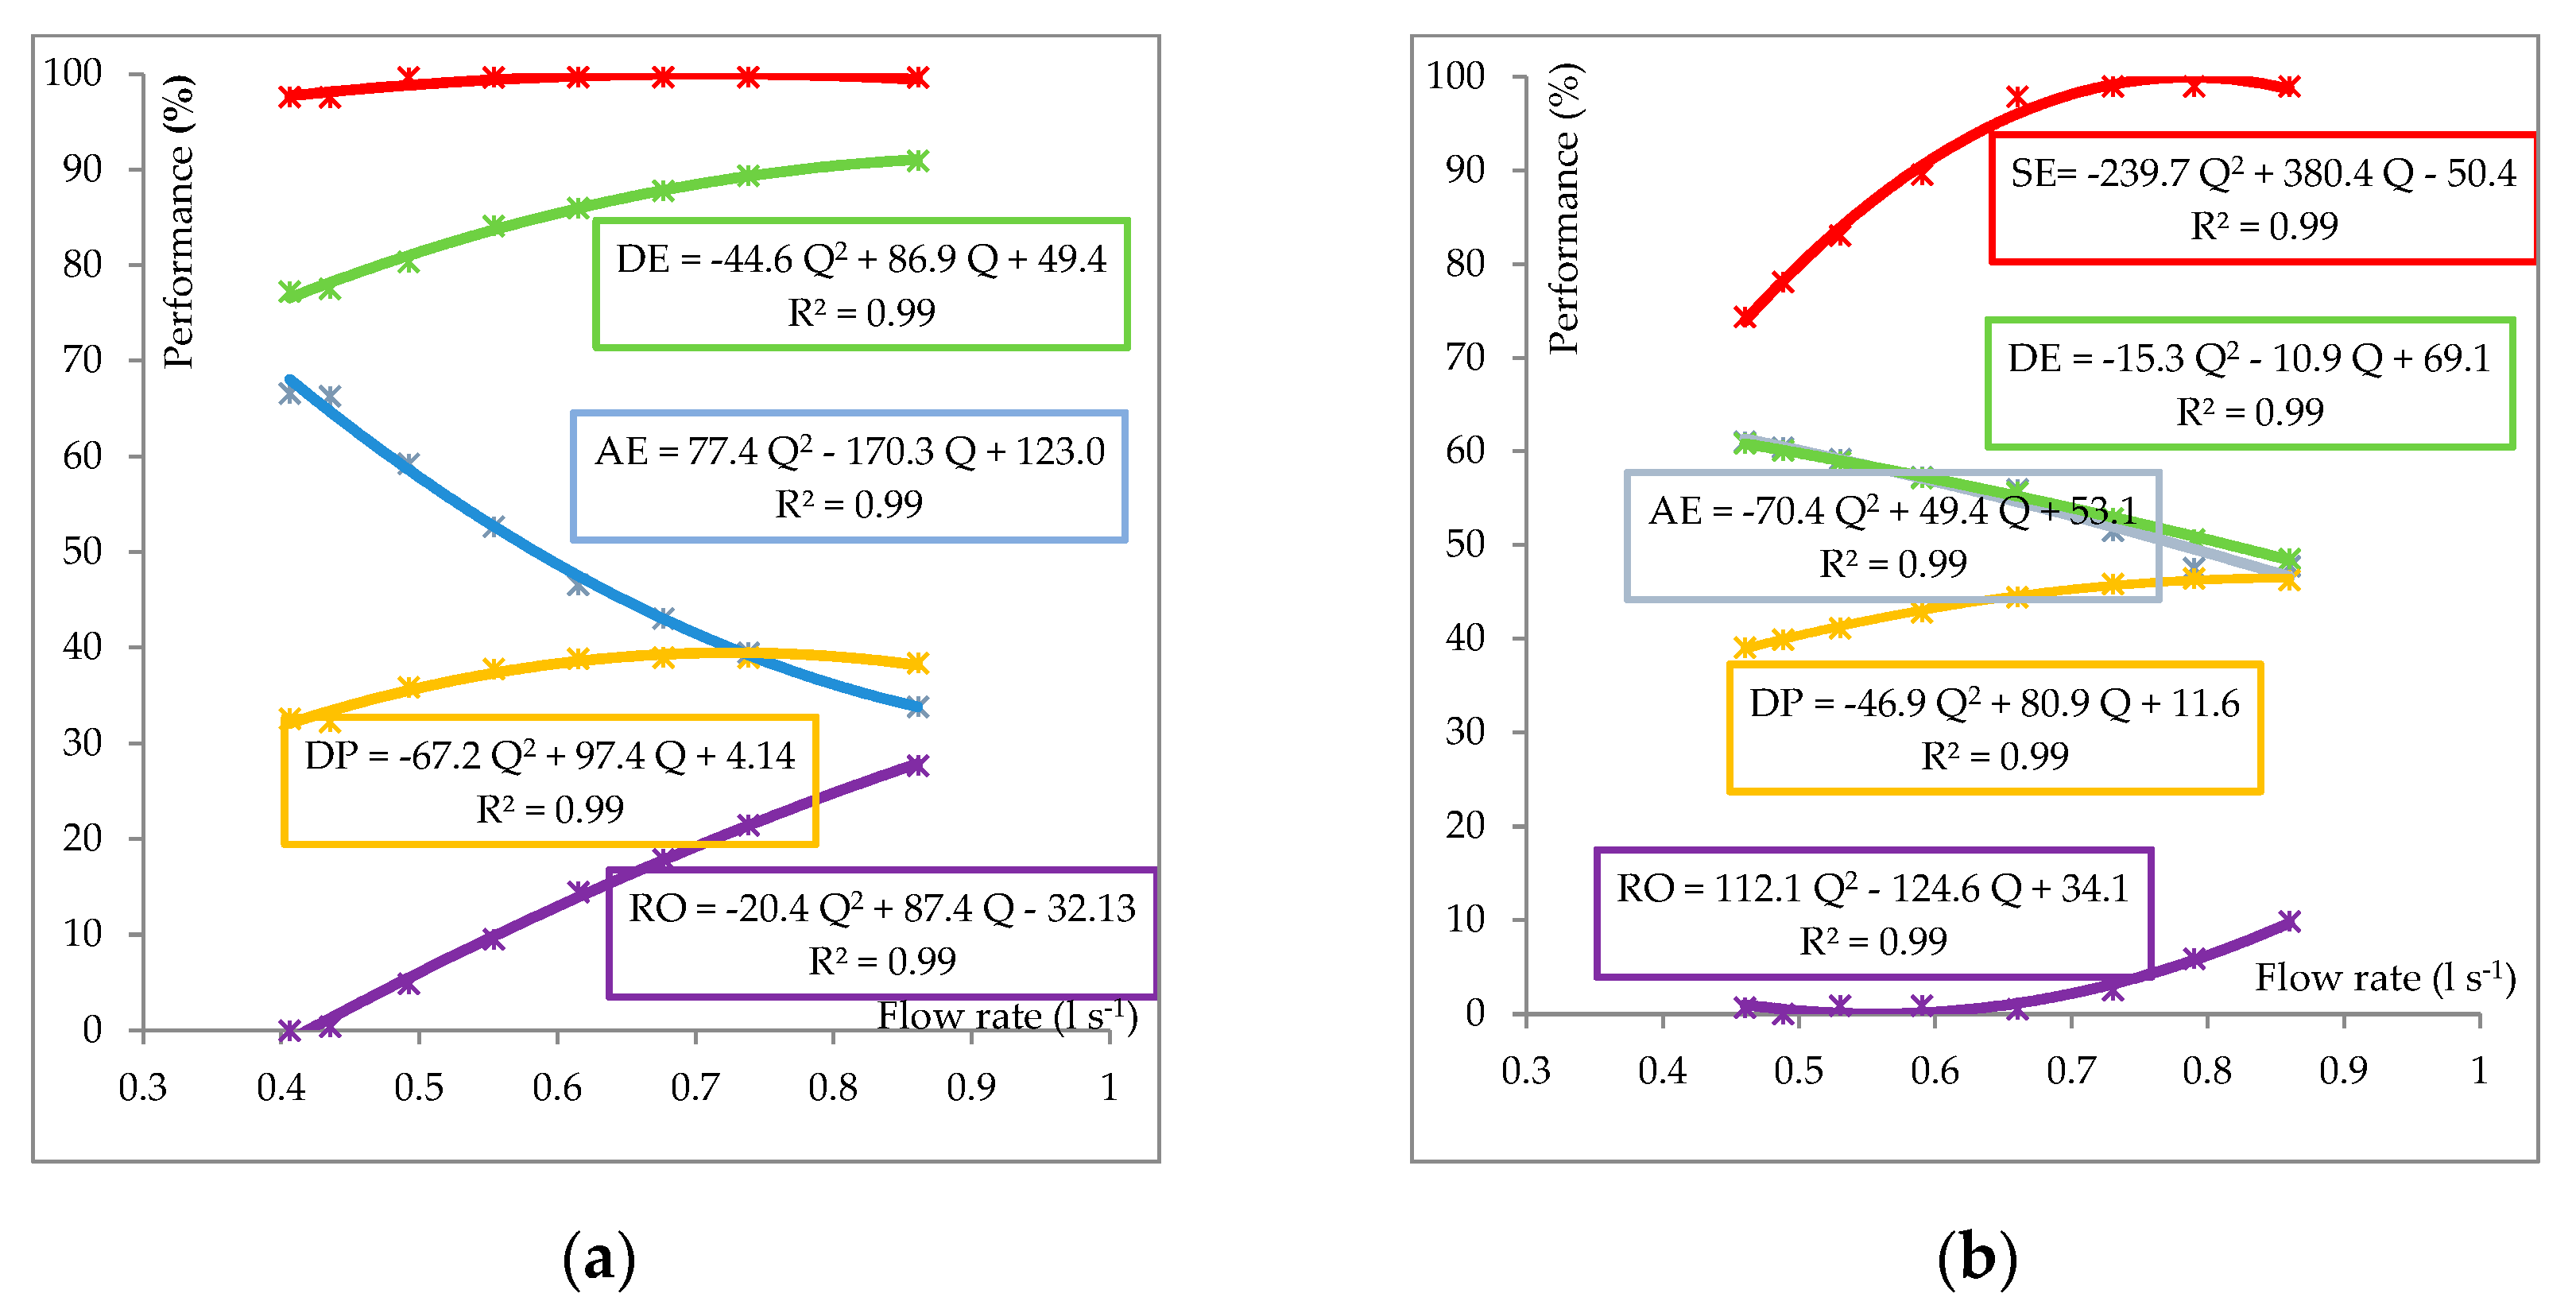
3.2. Simulation Performance Indices as a Function of Qo

The simulation performance indices results as a function of Qo when L and the programming cycle number and surge time were given, for fine- and coarse-textured soils are presented in Figure 4. The flow variations that maintained 100% SE were 10, 20, and 30% above and below the field evaluated value in fine- and medium-texture soils. Coarse-texture soils modify SE by changing Qo. The mathematical model with the best fit between AE, DE, DP, RO, and Qo was a quadratic polynomial function with an R2 between 0.98 and 0.99.
Reducing the flow by 30% simulates the maximum AE for all soil types, given an average increasein AE by 30% in medium-texture soils, and 42% in fine-texture soils. Decreasing the flow in coarse soils improves AE by only 8%. As expected, the losses of water decreased when Qo was reduced (DP and RO decreased on average by 97% in all soil types). Similar to SE, when the water application is improved, the DE is affected, decreasing within acceptable limits. Salahou et al. [55] concluded that increasing Qo increased irrigation losses, particularly RO, and reduced AE. Nie et al. [56] found that if Qo had been properly determined, the efficiency of the irrigation system would have definitely increased.

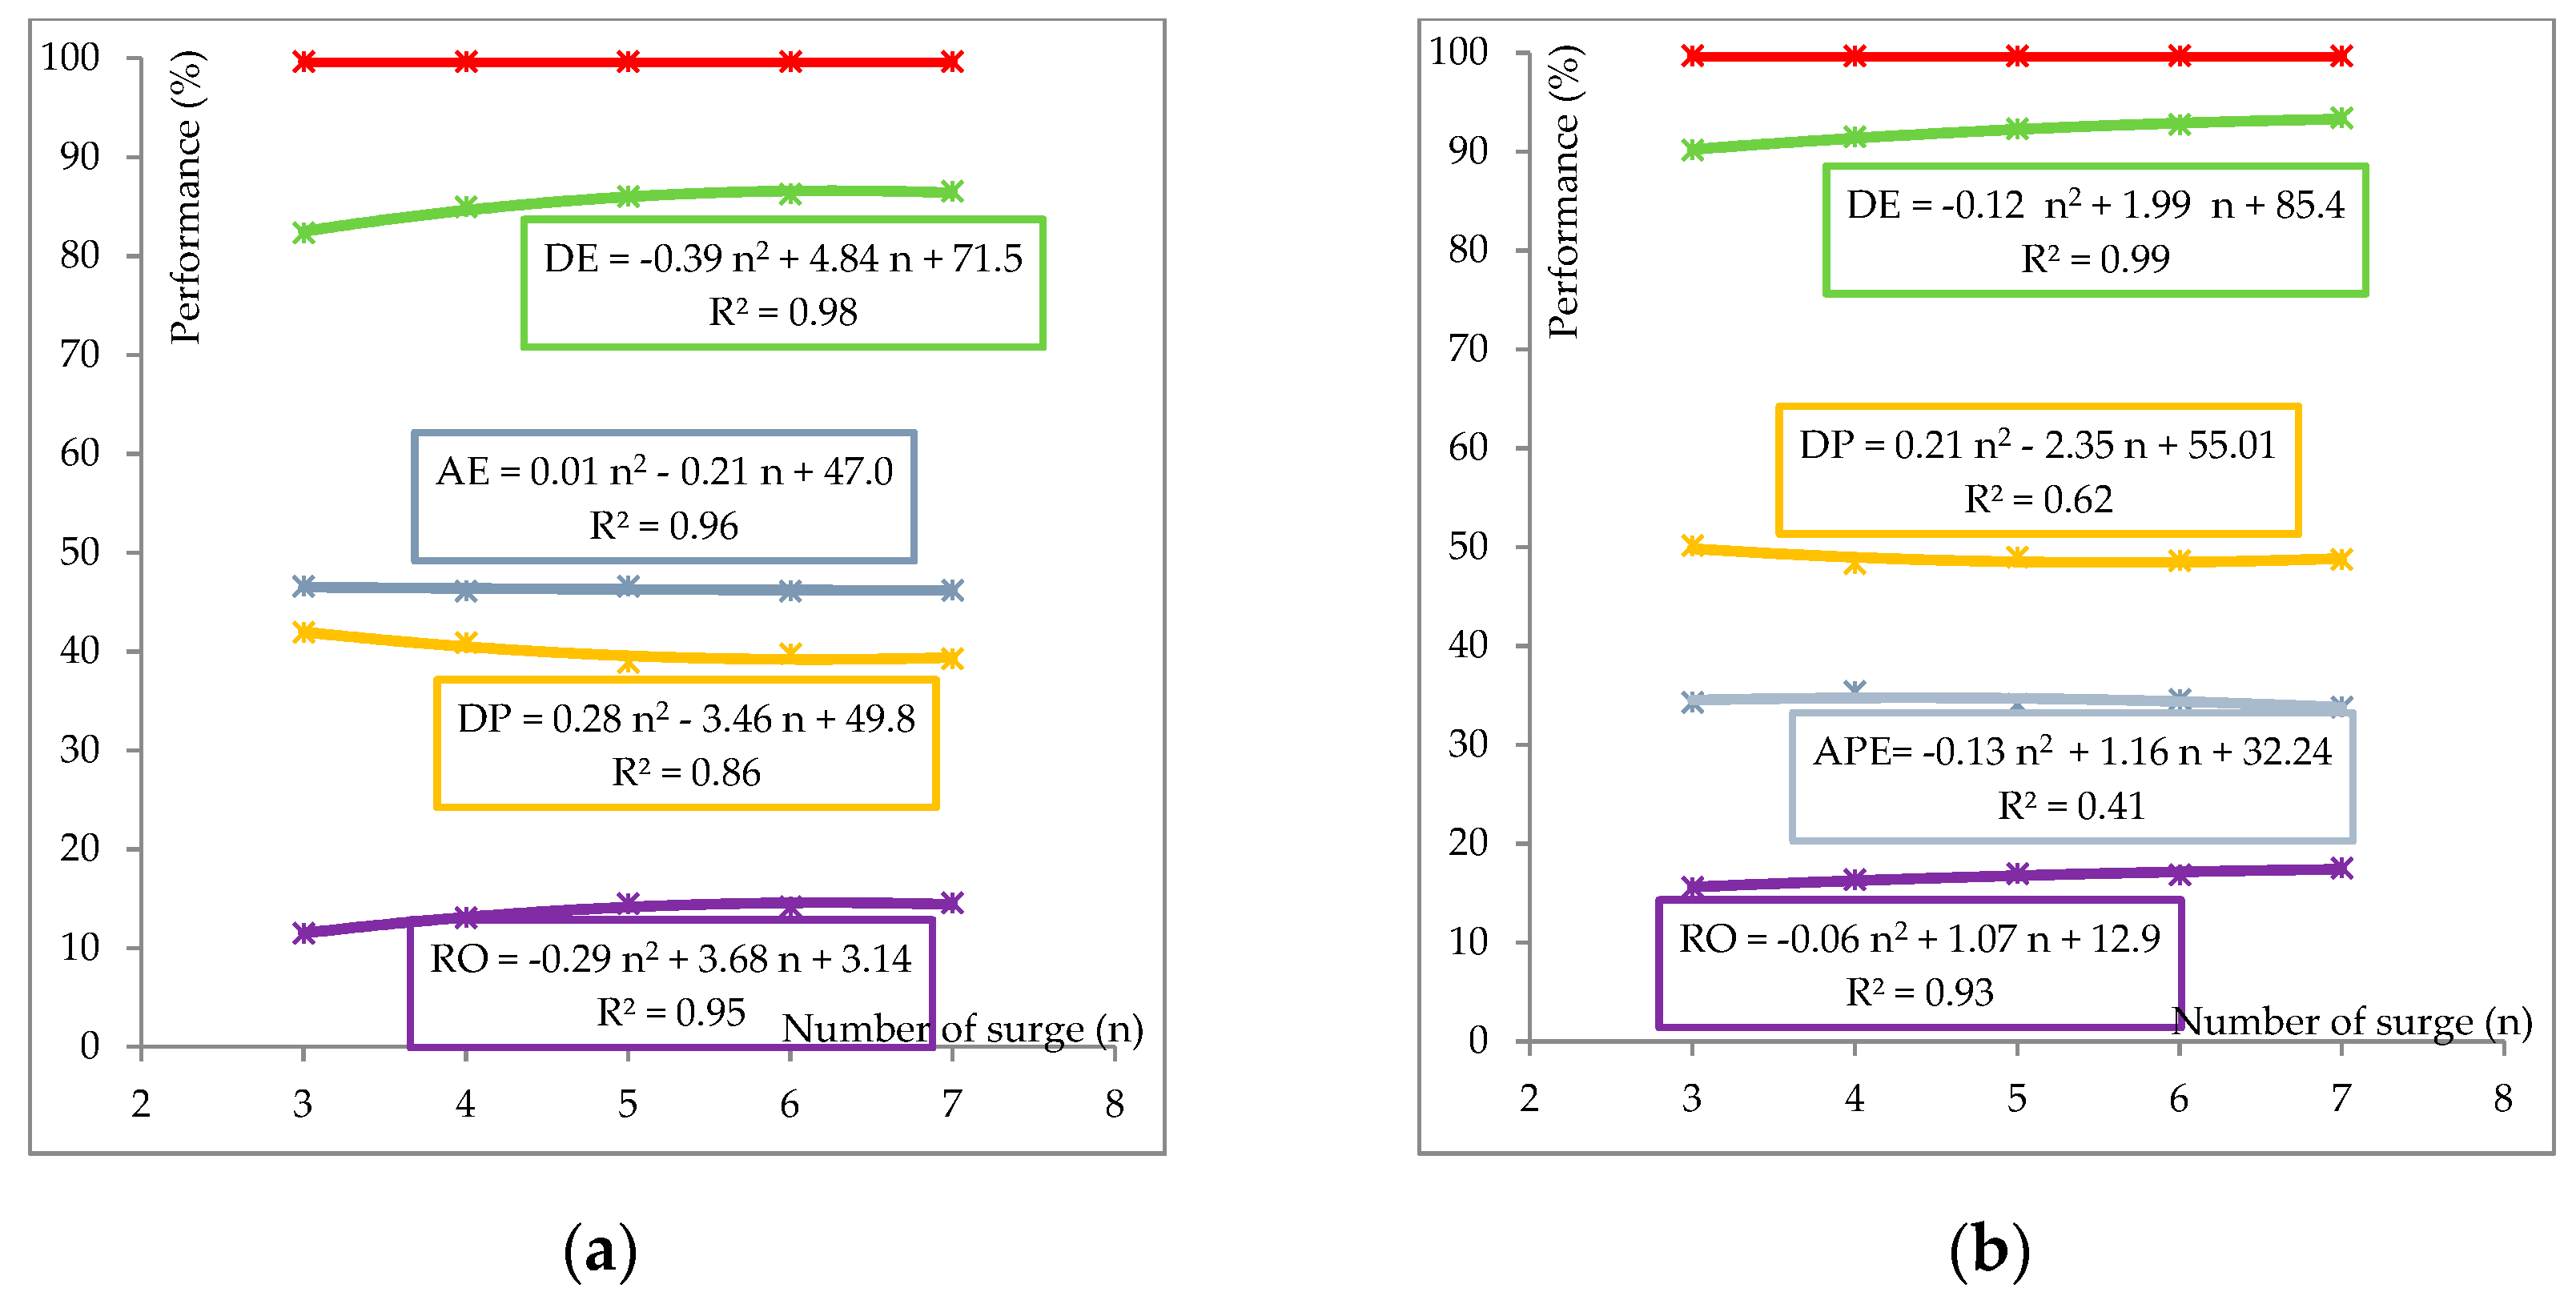
3.3. Simulation Performance Indices as a Function of n

The most widespread automatic surge irrigation system is the P&R valve. It has a controller with a solar panel that powers a battery using a small electric motor to switch flow direction changes by cycling the surges. The controller sets on-time variables during the advance phase to achieve nearly equal dry advance distances for each cycle. When the advance phase is completed, the controller reduces the cycle time (shorter application time) for the post-advance phase. Figure 5 presents the simulation performance index results as a function of the number of cycles (n = three, four, five, six, or seven surges), maintaining the field tco when Qo and L were given for fine- and medium-textured soils.
The mathematical model with the best fit between AE, DE, DP, RO, and n was a quadratic polynomial function with R2 > 0.7. When the number of cycles (surge times) is modified, respecting the established tco, it can be observed that the performance indices do not present much variation. Increasing or decreasing the number of surges has an impact on the stream size of each surge and the volume of water stored, but not on the performance indices. Figure 6 shows the volumes of water stored in each surge of the advance phase when programming three, four, five, six, or seven cycles for fine- and medium-textured soils.
As the number of surges increases, the time of each surge is reduced, and the advancing steam size is shortened. The volume stored depends on the complex process between the advance rate and the infiltration rate. It can be observed that by modifying the programming and increasing the number of surges, the stores in each surge are smaller. However, the total of volumes stored is similar in all cases. This reflects that the programming of the cycle times is substantial in the advance phase, improving the hydraulic conditions of the furrows that will depend on the physical parameters involved. Then, the reduction in irrigation times in the post-advance phase will be adjusted to reduce runoff and replenish the Zreq.

3.4. Optimization of System Variables

Starting from a target value for SE, the task of selecting the combination of Qo, L, tco, cycle number, and surge time, which would result in an optimal AE and an acceptable level of DE, is not easy. It requires understanding how the performance indices relate to these variables. Analyzing the simultaneous variations of the variables is even more complex. It is known that when irrigation times are reduced, or flow rates are regulated, the performance indices improve. As reported by [3], some studies showed that a reasonable combination of Qo and tco increases AE to 75–90%. Starting from the Qo that maximizes the AE, and addingnew programming (cycle number, surge times), the performance indices responses were adjusted. Figure 7 shows the original irrigator scheduling compared to the new programming for fine- and coarse-textured soils.
The new programming adjusts seven cycles for fine-textured soils, and four cycles for coarse-textured soils. It is reasonable to think that fine soils require shorter cycles than coarse-textured soils, which would require fewer but longer cycles. Coarse soils require higher flows due to their high infiltrability and allow water to remain on the surface for further advancement. Figure 8 represents the advance and recession phases and the distribution of the infiltrated water under surge flow irrigation for fine- and coarse-textured soils, respectively, resulting from the optimal Qo and the new schedule (cycle number and surge times). Table 2 summarizes the performance indices of the field evaluations and those obtained after defining Qo and the new schedule for the three soil types.
The results showed that a new surge flow irrigation schedule can be adapted, improving performance indices. For fine-textured soils, the recommendation would be to program with a greater number of cycles (six to seven), and shorter surge times. On the contrary, in coarse-textured soils, the programming would be a smaller number of cycles (three to five) with longer surge times. For medium-textured soils, five to six cycles would be recommended. Post-advance times should be programmed based on the steady-state infiltration rate, thus reducing DP and RO.
Finally, the results of the performance indices of all cases evaluated are presented. The AE and SE obtained from field evaluations compared to the AEpot and STpot simulated (flow and times) for surge irrigation are shown in Figure 9.
The figure shows that the surge irrigation technique can achieve a higher AE by revising the design parameters (Qo and tco—cycles number and surge time). The performance indices are within the potential to achieve cited in the research (greater than 70%). Following Roscher´s classification, the AEpot is “Satisfactory” and “Good” [52]. Kapur et al. [57] concluded that the AEpot was in the order of 78% to 84% for surge flow furrow irrigation. When the flow rate and water application time are modified to improve AE, SE changes. The decrease in SE is more significant in those cases where the AE improved greatly. Despite this, the performance rating of Roscher´s classification is still “Good”, above 90% [52]. Figure 10 represents the DE obtained from the field evaluation and the surge irrigation potentials for all evaluations. Similar to SE, when the water application is improved, the DE is affected. The performance for the DE remains “Satisfactory” with an average of 84%. Pascual-Severa et al. [58] andGudissa et al. [59] concluded that surge flow furrow irrigation was a promising technology, giving values of 87% and 86% for DE.
The field water losses represented by DP and RO and the simulation results are presented in Figure 11. As the AE improves, the DP decreases, reaching an average of 13%. The RO decreases substantially, reaching an average of 6%.

4. Conclusions

The SIRMOD III software model provided the ability to adjust the system parameters and design variables, giving an answer to any surge flow configuration. The SIRMOD III model was validated by incorporating data from field evaluations. The errors in the simulations were less than 5%. The fitting linear model of the performance indices showed a high coefficient of determination, R2 = 0.99.
It was demonstrated that the potential application efficiency (AEpot) (greater than 80%) can be achieved by following some recommendations, such as establishing an optimal flow rate (Qopt) with a cut-off time (tco) adjusted to a schedule of surge cycles and surge times according to the soil characteristics. It would be interesting to evaluate the simultaneous variations of the variables system. The simulation software (SIRMOD III and WinSRFE 5.1) has not yet incorporated the sensitivity test for surge flow irrigation.
Surge irrigation requires a higher level of management skill than conventional furrow irrigation. Most irrigators need assistance when first operating a surge system. They need to be able to observe the progress of each irrigation during the season as infiltration changes and to adjust surge times and flow rates. Field observations and evaluations of each surge irrigation can help to adjust the cycle number and surge times accurately.

Author Contributions

Conceptualization, C.R., A.E.-C. and G.F.B.; methodology, investigation, and data validation C.R.; writing—review and editing, C.R.; visualization, supervision, A.E.-C. and G.F.B. All authors have read and agreed to the published version of the manuscript.

Funding

This research received no external funding.

Data Availability Statement

The data reported in this article are available from Catalina [email protected].

Acknowledgments

Operational support provided by the owners of the farm where this study was conducted is gratefully acknowledged.

Conflicts of Interest

The authors declare no conflicts of interest.

References

  1. Mazarei, R.; Mohammadi, A.S.; Naseri, A.A.; Ebrahimian, H.; Naseri, A.A. Temporal variability of infiltration and roughness coefficients and furrow irrigation performance under different inflow rates. Agric. Water Manag. 2021, 245, 106465. [Google Scholar] [CrossRef]
  2. Xu, J.; Cai, H.; Saddique, Q.; Wang, X.; Li, L.; Ma, C.; Lu, Y. Evaluation and optimization of border irrigation in different irrigation seasons based on temporal variation of infiltration and roughness. Agric. Water Manag. 2019, 214, 64–77. [Google Scholar] [CrossRef]
  3. Ahmadabad, Y.H.; Liaghat, A.; Sohrabi, T.; Razoulzadeh, A.; Ebrahimian, H. Improving performance of furrow irrigation systems using simulation modeling in the Moghan Plain of Iran. J. Irrig. Drain. 2021, 70, 131–149. [Google Scholar] [CrossRef]
  4. Varlev, I. Improvement in the uniformity along the furrows and beds with surge irrigation. Sci. Work. Inst. Land Improv. 1971, XII, 5–21. [Google Scholar]
  5. Varlev, I.; Popova, Z.; Gospodinov, I. Furrow surge irrigation as a water saving technique. In Water and the Environment: Innovation Issues in Irrigation and Drainage; Pereira, L.S., Gowing, J.W., Eds.; Selected Papers of 1st Inter-Regional Conf. Environment–Water, Lisbon; E & FN Spon: London, UK, 1998; pp. 131–139. [Google Scholar]
  6. Penzin, M.P.; Terpigorev, A.A. Proving a way of irrigation stream regulation under furrow irrigation. In New Irrigation Techniques and Technologies; Ugrumov, A.V., Ed.; All-Union Research Institute for Hydraulic Engineering and Land Reclamation (VNIIGiM): Moscow, Russia, 1977; pp. 9–17. [Google Scholar]
  7. Khamrayev, N.R.; Yusupov, T.Y. Surge flow technology. Cotton Prod. J. 1980, 7, 30–32. [Google Scholar]
  8. Terpigorev, A.A. Water movement in furrows in case of surge-flow irrigation under conditions of high slopes. In Major Trends on Technical Progress in Irrigation Mechanization and Technologies; Ugrumov, A.V., Ed.; VNIIGeM: Moscow, Russia, 1983; pp. 129–134. [Google Scholar]
  9. Pavlov, G.N.; Horst, M.G. About a method of surge irrigation parameters calculation. In Land Reclamation and Water Management; Dukhovny, V.A., Ed.; SANIIRI: Tashkent, Uzbekistan, 1995; pp. 73–86. [Google Scholar]
  10. Stringham, G.E.; Keller, J. Surge flow for automatic irrigation. In Proceedings of the Specialty Conference of American Society of Civil Engineers, New York, NY, USA, 17–20 July 1979; pp. 132–142. [Google Scholar]
  11. Coolidge, P.S. Advance Rates under an Automated Pulsed Flow Irrigation System. Master’s Thesis, Utha State University, Logan, UT, USA, 1981. [Google Scholar]
  12. Coolidge, P.S.; Walker, W.R.; Bishop, A.A. Advance and Runoff Surge Flow Furrow Irrigation. J. Irrig. Drain. Div. ASAE 1982, 108, 35–42. [Google Scholar] [CrossRef]
  13. Paula, M. Surface irrigation theory and practice: Wyn R. Walker and Gaylord V. Skogerboe. Prentice-Hall, Englewood Cliffs, NJ, U.S.A. Agric. Water Manag. 1988, 15, 205–207. [Google Scholar] [CrossRef]
  14. Izuno, F.T.; Podmore, T.H. Surge Irrigation Management. Agric. Water Manag. 1986, 11, 279–291. [Google Scholar] [CrossRef]
  15. Humpherys, A.S. Surge irrigation: 1. An overview. ICID Bull. 1989, 38, 35–48. [Google Scholar]
  16. Schaible, G.D.; Aillery, M.P. Water Conservation in Irrigated Agriculture: Trends and Challenges in the Face of Emerging Demands; Economic Research Service, Economic Information Bulletin 99; USDA: Washington, DC, USA, 2012; 67p. Available online: http://www.ers.usda.gov (accessed on 17 August 2023).
  17. Amer, M.H.; Attafy, T.M. Effect of Surge Flow on some Irrigation Indices of Furrow Irrigation System. J. Soil Sci. Agric. Eng. Mansoura Univ. 2017, 8, 703–708. [Google Scholar] [CrossRef]
  18. Mazarei, R.; Mohammadi, A.S.; Naseri, A.A.; Ebrahimian, H.; Izadpanah, Z. Optimization of furrow irrigation performance of sugarcane fields based on inflow and geometric parameters using WinSRFR in Southwest of Iran. Agric. Water Manag. 2020, 228, 105899. [Google Scholar] [CrossRef]
  19. Eid, S.M. Surge Flow Irrigation for Corn and Wheat under Different Land Levelling Practices in Heavy Clay Soils. Doctoral Dissertation, Department of Soil Science, Faculty of Agriculture, Kafr El-Sheikh, Tanta University, Tanta, Egypt, 1998. [Google Scholar]
  20. Kifle, M.; Tilahun, K.; Yazew, E. Evaluation of surge flow furrow irrigation for onion production in a semiarid region of Ethiopia. Irrig. Sci. 2008, 26, 325–333. [Google Scholar] [CrossRef]
  21. Mattar, M.A.; El-Saadawy, M.A.; Helmy, M.A.; Sorour, H.M. Field assessment of surge and continuous furrow irrigation methods in relation to tillage systems. Int. Agrophysic 2017, 31, 219–230. [Google Scholar] [CrossRef]
  22. Kifle, M.; Gebremicael, T.G.; Girmay, A.; Gebremedihin, T. Effect of surge flow and alternate irrigation on the irrigation efficiency and water productivity of onion in the semi-arid areas of North Ethiopia. Agric. Water Manag. 2017, 187, 69–76. [Google Scholar] [CrossRef]
  23. Mehri, A.; Mohammadi, A.M.; Ebrahimian, H.; Boroomandnasab, S. Evaluation and optimization of surge and alternate furrow irrigation performance in maize fields using the WinSRFR software. Agric. Water Manag. 2023, 276, 108052. [Google Scholar] [CrossRef]
  24. Romay, C.; Morabito, J.A. Comparison between Traditional and Surge Flow Irrigation. Analysis of Cases in Mendoza—Argentina. In Proceedings of the International Conference Efficient Use of Water, Mendoza, Argentina, 26–28 April 2000. [Google Scholar]
  25. Romay, C.; Morabito, J.A.; Salatino, S.; Roby, O.; Solsona, J.; Alturria, L. Integral Assessment of Surge Flow Irrigation in Argentine Irrigated Oasis. Irrigation efficiency, economic analysis and user evaluation. In Fourth Inter-American Dialogue on Water Management. “In Quest of solutions”; Foz de Iguazú: Paraná, Brasil, 2001. [Google Scholar]
  26. Horst, M.G.; Shamutalov, S.S.; Gonçalves, J.M.; Pereira, L.S. Assessing impacts of surge-flow irrigation on water saving and productivity of cotton. Agric. Water Manag. 2007, 87, 115–127. [Google Scholar] [CrossRef]
  27. Mohammed, A.; Abdeen, N.; Hamid, A.R. Effect of irrigation technique on efficiency of furrow irrigation. In Proceedings of the International Conference on Chemical, Environmental and Biological Sciences (CEBS-2015), Dubai, United Arab Emirates, 18–19 March 2015; pp. 168–170. [Google Scholar] [CrossRef]
  28. Mailapalli, D.R.; Singh, R.; Raghuwanshi, N.S. Physically based model for simulating flow in furrow irrigation. I: Model development. ASCE J. Irrig. Drain. Eng. 2009, 135, 739–746. [Google Scholar] [CrossRef]
  29. Walker, W.R.; Lee, T. Kinematic Wave Approximation of Surged Furrow Advance. J. Irrig. Drain. Div. ASAE Winter Meet. 1981, 81, 2544. [Google Scholar]
  30. Elliott, R.L.; Walker, W.R. Field evaluation of furrow infiltration and advance functions. Trans. ASAE 1982, 25, 396–400. [Google Scholar] [CrossRef]
  31. Purkey, D.R.; Wallender, W.W. Surge Flow Infiltration Variability. Soil Water Div. Trans. ASAE 1989, 32, 894–900. [Google Scholar] [CrossRef]
  32. Essafi, B. A Recursive Volume Balance Model for Continuous and Surge Flow Irrigation. Ph.D. Thesis, Department of Agricultural and Irrigation Engineering, Utah State University, Logan, UT, USA, 1983. [Google Scholar]
  33. Camacho, E.; Roldán, J.; Alcaide, M. Infiltration Under Surge Furrow Irrigation. In International Symposium on Irrigation of Horticultural Crops. Acta Hortic. 1993, 335, 497–504. [Google Scholar] [CrossRef]
  34. Cahoon, J.; Eisenhauer, D. Inferences of Cycle Ratio-Time Surged Flow Infiltration Function. Irrig. Sci. 1994, 15, 173–182. [Google Scholar] [CrossRef]
  35. Utah State University. Surface Irrigation Simulation Software, SIRMOD III; Irrigation Software Division, Biological and Irrigation Engineering Department, Utah State University: Logan, UT, USA, 2003. [Google Scholar]
  36. Bautista, E.; Schlegel, J.L. WinSRFR 5.1. USDA-Agricultural Research Service Arid Land Agricultural Research Center, 21881 North Cardon Lane Maricopa, AZ, USA 85138. 2019. Available online: http://www.ars.usda.gov/services/software/download.htm?softwareid=413 (accessed on 15 November 2019).
  37. Bautista, E.; Clemmens, A.J.; Strelkoff, T.S.; Schlegel, J. Modern analysis of surface irrigation systems with WinSRFR. Agric. Water Manag. 2009, 96, 1146–1154. [Google Scholar] [CrossRef]
  38. Bautista, E.; Clemmens, A.J.; Strelkoff, T.S.; Niblackl, M. Analysis of surface irrigation systems with WinSRFR, example application. Agric. Water Manag. 2009, 96, 1162–1169. [Google Scholar] [CrossRef]
  39. Ismail, S.M.; Thabet, A.; Abdel El-Al, A.; Omara, A.I. Improving irrigation performance of raised bed wheat using the WinSRFR model under Egyptian condition. J. Agric. Eng. 2021, 38, 309–332. [Google Scholar] [CrossRef]
  40. Yadeta, B.; Ayana, M.; Yitayew, M.; Hordofa, T. Performance evaluation of furrow irrigation water management practice under Wonji Shoa Sugar Estate condition, in Central Ethiopia. J. Eng. Appl. Sci. 2022, 69, 21. [Google Scholar] [CrossRef]
  41. Ebrahimian, H.; Ghaffari, P.; Ghameshlou, A.N.; Tabatabaei, S.H.; Dizaj, A.A. Extensive comparison of various infiltration estimation methods for furrow irrigation under different field conditions. Agric. Water Manag. 2020, 230, 105960. [Google Scholar] [CrossRef]
  42. Hornbuckle, J.W.; Chisten, E.W.; Faulkner, R.D. Improving the Efficiency and Performance of Furrow Irrigation Using Simulation Modeling in South-Eastern Australia; Environmental Engineering Department, University of New England: Armidale, NSW, Australia, 1999; pp. 1–18. Available online: https://www.researchgate.net/publication/242688203 (accessed on 25 August 2023).
  43. Ebrahimian, H.; Liaghat, A. Field evaluation of various mathematical models for furrow and border irrigation systems. J. Soil Water Res. 2011, 6, 91–101. [Google Scholar] [CrossRef]
  44. Feyen, J.; Zerihun, D. Assessment of the performance of border and furrow irrigation systems and the relationship between performance indicators and system variables. Agric. Water Manag. 1999, 40, 353–362. [Google Scholar]
  45. Losada, A. Irrigation Methods: Introduction, Design, Operational Irrigation Units; International Irrigation Course; Agricultural Research Institute (INIA, CRIDA): Córdoba, Chile, 1982. [Google Scholar]
  46. Jurriens, M.; Zerihun, D.; Boonstra, J.; Feyen, J. SURDEV: Surface Irrigation Software, Design, Operation, and Evaluation of Basin, Border, and Furrow Irrigation; International Institute for Land Reclamation and Improvement, ILRI: Wageningen, The Netherlands, 2001. [Google Scholar]
  47. Walker, W.R. SIRMOD—Surface Irrigation Modeling Software; Utah State University: Logan, UT, USA, 1998. [Google Scholar]
  48. Romay, C. Performance of Surge Flow Irrigation in Mendoza, Argentina. Current and Potential Efficiencies. Master’s Thesis, Faculty of Agrarian Science, Cuyo National University, Mendoza, Argentina, 2014. [Google Scholar]
  49. Gee, G.W.; Or, D. Particle-size analysis. In Methods of Soil Analysis. Part 4; Book Series No. 5; Daney, J.H., Topp, G.C., Eds.; SSSA: Madison, WI, USA, 2002; pp. 255–293. [Google Scholar]
  50. Erbach, D.C. Measurement of Soil Bulk Density and Moisture. Trans. Am. Soc. Agric. Eng. 1987, 30, 922–931. [Google Scholar] [CrossRef]
  51. Page, A.L.; Miller, R.H.; Keeney, D.R. Methods of Soil Analysis. Part II, Chemical and Microbiological Properties, 2nd ed.; American Society of Agronomy, Inc.: Madison, WI, USA, 1982. [Google Scholar]
  52. Rosches, K. Surface Irrigation. Characteristics, Design and Performance; Department of Irrigation and Civil Engineering, Agriculture University: Wageningen, The Netherland, 1985. [Google Scholar]
  53. Merrian, J.; Keller, J.; Alfaro, J. Irrigation System Evaluation and Improvement; Department of Agriculture and Utah Water Research Laboratory, Utah State University: Logan, UT, USA, 1973. [Google Scholar]
  54. Holzapfel, E.A.; Leiva, C.; Marino, M.A.; Paredes, J.; Arumí, J.L.; Billib, M. Furrow irrigation management and design criteria using efficiency parameters and simulation models. Chil. J. Agric. Res. 2010, 70, 287–296. [Google Scholar] [CrossRef]
  55. Salahou, M.K.; Xiyun, J.; Haishen, L. Border irrigation performance with distance-based cut off. Agric. Water Manag. 2018, 201, 27–37. [Google Scholar] [CrossRef]
  56. Nie, W.B.; Li, Y.B.; Zhang, F.; Ma, X.Y. Optimal discharge for closed-end border irrigation under soil infiltration variability. Agric. Water Manag. 2019, 221, 58–65. [Google Scholar] [CrossRef]
  57. Kapur, B.; Ünlü, M.; Kanber, R.; Tekın, S.; Koç, D.L.; Kekeç, U. A comparative field study of the alternate every other furrow surge irrigation and the every furrow surge irrigation techniques. J. Food Agric. Environ. 2013, 11, 389–397. [Google Scholar]
  58. Pascual-Seva, N.; San Bautista, A.; López-Galarza, S.; Maroto, J.V.; Pascual, B. Furrow-irrigated chufa crops in Valencia (Spain). II: Performance analysis and optimization. Span. J. Agric. Res. 2013, 11, 268–278. [Google Scholar] [CrossRef]
  59. Gudissa, H.D.; Edossa, D.C. Evaluation of surge and cutback flow furrow irrigation systems for pepper (Capsicum annuum) production. J. Irrig. Drain. 2014, 63, 463–473. [Google Scholar] [CrossRef]
Figure 1. Flow diagram of the SIRMOD III software.
Agronomy 14 01509 g001
Figure 2. Fitting linear model between performance indices from surge flow field evaluations and simulations (SIRMOD III).
Agronomy 14 01509 g002
Figure 3. Performance indices vs field length for (a) fine- and (b) medium-textured soils. The red line represents the storage efficiency and establishes the limits of the sensitivity analysis considering the replacement of the required depth that is, maintaining the same at values of 97 to 100%.
Agronomy 14 01509 g003
Figure 4. Performance indices vs unit flow rate for (a) fine, and (b) coarse-textured soils.
Agronomy 14 01509 g004
Figure 5. Performance indices vs number of surges for (a) fine, and (b) medium-textured soils. The red line represents 100% storage efficiency.
Agronomy 14 01509 g005
Figure 6. Volumes of water stored in each surge of the advance phase for (a) fine, and (b) medium-texture soil.
Agronomy 14 01509 g006
Figure 7. Original irrigator scheduling versus new programming for (a) fine- and (b) coarse-textured soils.
Agronomy 14 01509 g007
Figure 8. Advance and recession phases, showing the subsurface profile, under surge flow irrigation for (a) fine- and (b) coarse-textured soils. Colour lines: 1st surge blue, 2nd surge red, 3rd surge green, 4th surge brown, 5th surge gray, 6th surge violet, and 7th surge yellow.
Agronomy 14 01509 g008
Figure 9. Field and simulated application and storage efficiency.
Agronomy 14 01509 g009
Figure 10. Field and simulated distribution efficiency.
Agronomy 14 01509 g010
Figure 11. Field and simulated deep percolation and runoff.
Agronomy 14 01509 g011
Table 1. Physical properties, parameters, and system variables of three types of soil.
Physical Properties,
Parameters and System Variables
Fine Soil
(Silty Clay Loam)
Medium Soil
(Loam)
Coarse Soil
(Sandy Loam)
Sand (%)73764
Silt (%)534224
Clay (%)402112
BD (g cm−3)1.261.421.50
WB (mm) Kostiakov5.610.523.6
A (-) Kostiakov0.420.40.43
Ib (mm h−1) Kostiakov4.58.039.9
Qo (l s−1)0.620.650.63
L (m)180187180
tco (min)708708420
w (m)0.90.90.5
So (m m−1)0.00160.00240.0062
n (m1/6) (dry surge)0.040.040.04
n (m1/6) (wet surge)0.020.020.02
Dry surgeσ1 (m2–σ2) 1.5350.7340.731
σ2 (-) 1.7131.4681.536
γ1 (m1-γ2)3.1341.5171.767
γ2 (-) 0.7500.5510.656
Ao (m2) (dry surge)0.007330.006050.00416
Wet surgeσ1 (m2–σ2)1.4872.1010.805
σ2 (-) 1.7201.8011.509
γ1 (m1-γ2)2.8513.1491.487
γ2 (-) 0.7340.7300.553
Ao (m2) wet surge0.004400.003980.00268
Vmax (m min−1)14119
Zr (mm)745497
Dry surgek (mm3 m−1 min−a)0.00080.001840.00201
a (-)0.730.4570.555
fo (mm3 m−1 min)0.0001480.0001370.000155
Wet surgek (mm3 m−1 min−a)0.00250.001740.00175
a (-)0.0020.4280.472
fo (mm3 m−1 min)0.0001480.0001280.000131
BDbulk density, Qo unit flow rate, L field length, tco cutoff time, k, a y fo, modified Kostiakov–Lewis infiltration parameters, w field row, So field slope, n Manning’s roughness coefficient, σ1, σ2, γ1, γ2, parameters characterizing the furrow geometry, Ao cross-sectional flow area, Zreq required application depth, and Vmax maximum non-erosive velocity.
Table 2. Performance indices for initial and new surge flow schedule.
Performance
(%)
Initial Schedule
Textures
Fine Medium Coarse
New Schedule
Texture
Fine Medium Coarse
AE473556909385
SE100100100989294
DE929271938198
DP3916444315
RO14490640
Disclaimer/Publisher’s Note: The statements, opinions and data contained in all publications are solely those of the individual author(s) and contributor(s) and not of MDPI and/or the editor(s). MDPI and/or the editor(s) disclaim responsibility for any injury to people or property resulting from any ideas, methods, instructions or products referred to in the content.

