Article

Effects of Biochar Pyrolysis Temperature and Application Rate on Saline Soil Quality and Maize Yield

1
Yinshanbeilu Grassland Eco-Hydrology National Observation and Research Station, China Institute of Water Resources and Hydropower Research, Beijing 100038, China
2
Institute of Water Resources for Pastoral Area Ministry of Water Resources, Hohhot 010020, China
3
College of Water Conservancy and Civil Engineering, Inner Mongolia Agricultural University, Hohhot 010018, China
*
Authors to whom correspondence should be addressed.
These authors contributed equally to this work.
Agronomy 2024, 14(7), 1529; https://doi.org/10.3390/agronomy14071529
Submission received: 13 June 2024 / Revised: 10 July 2024 / Accepted: 11 July 2024 / Published: 14 July 2024
(This article belongs to the Section Agricultural Biosystem and Biological Engineering)

Abstract

:
The application of biochar to improve the quality of saline soils has attracted widespread attention. However, the impact of saline soil amendments with biochar prepared at different pyrolysis temperatures remains unclear. Therefore, we conducted a two-year (2022–2023) field experiment in the Hetao Irrigation District, China, to evaluate the effects of the biochar pyrolysis temperature (C1: 300 °C, C2: 500 °C, and C3: 700 °C) and application rate (T1: 10 t/ha and T2: 20 t/ha) on the soil quality and maize yield. The results indicated that (1) all biochar treatments significantly decreased the soil bulk density and increased the soil porosity; (2) treatment C3T1 significantly increased the soil moisture content and decreased soil salinity. The C3T2 treatment significantly increased the soil’s organic carbon content, and the soil’s available phosphorus content was greatest in the C1T2 treatment. (3) The maize yield increased linearly with the soil quality index (SQI), which was attributed mainly to improvements in the soil water–salt conditions and increases in the soil organic carbon content. In summary, biochar produced at high pyrolysis temperatures, when applied at a low application rate (C3T1), can result in high corn yields and improve saline soil quality.

1. Introduction

Soil salinization is a primary factor constraining global land utilization efficiency improvement and agricultural production development [1]. Currently, the total global area of cropland affected by salinity and alkalinity is approximately 831 million hectares [2]. Salinized soils are widely distributed in the northwestern region of China because of factors such as agricultural irrigation and climatic conditions. Saline soils are prone to issues such as compaction difficulties, poor permeability and aeration, low water retention, and nutrient retention capabilities, which significantly reduce crop productivity [3]. Therefore, under the dual pressures of population growth and soil salinization, improving the physicochemical properties of saline farmland soil and ensuring its sustainable utilization for crop production have become urgent scientific challenges that need to be addressed.
Biochar is a potential soil amendment for improving soil characteristics. Compared with other soil amendments, biochar has a large surface area and high organic carbon content, allowing it to retain more moisture and nutrients while providing a substantial amount of organic carbon [4]. Moreover, biochar has the capacity to ameliorate soil properties by regulating the soil moisture content, increasing the soil porosity, and retaining multivalent cations [5,6]. Furthermore, biochar can serve as a habitat for soil microorganisms, contributing to improving the quality of the soil rhizosphere microenvironment [7]. However, some studies have indicated that biochar can have ineffective or even negative effects on saline soil quality and plant growth. For example, soluble alkali ions (e.g., Na+, K+, Mg2+, and Ca2+) and minerals in biochar can significantly increase soil salinity [8]. Additionally, carbonates and oxygen-containing functional groups in biochar can significantly increase soil alkalinity, potentially leading to reduced soil permeability and an imbalanced nutrient supply in saline soils, further diminishing soil productivity [9]. The differential efficacy of biochar in improving saline soils is predominantly associated with factors such as the type of feedstock used, pyrolysis temperature, and application rate of the biochar. Hence, determining the optimal utilization of biochar to mitigate soil salinity, increase crop yield, and increase crop quality constitutes a crucial research endeavor for fostering sustainable land use in the arid farmlands of the northwestern region.
The pyrolysis temperature is one of the most critical factors influencing the properties and functionalities of biochar [10]. Biochar produced under high-temperature pyrolysis has lower O/C and H/C ratios but positively influences aromaticity, pH, and electrical conductivity [10]. Under low-temperature pyrolysis conditions, biochar can yield relatively stable aromatic main chains and more C=O and C-H functional groups. These oxygen-containing functional groups, upon oxidation, can serve as effective nutrient exchange sites, thereby facilitating the improvement of soil fertility [5,6]. On the other hand, research by Gell et al. [11] suggested that, owing to the accumulation of organic compounds, biochar produced under low-temperature pyrolysis may exhibit greater phytotoxicity. With changes in pyrolysis temperature, the physicochemical properties of biochar vary significantly, leading to potential differences in its effectiveness in terms of soil improvement. Additionally, the application rate of biochar significantly influences soil physicochemical properties. Zhao et al. [12] demonstrated that soil pH increases with increasing biochar application rates. However, Zhao et al. [13] reported a trend where the soil pH initially decreased but then increased with increasing application rates of corn straw biochar. Fu et al. [14] reported that excessive application of biochar can disrupt the equilibrium between the liquid and gas phases in soil. Biederman et al. [15] proposed that the optimal application rate of biochar for soil improvement ranges from 10 to 30 t/ha, which can increase crop productivity and reduce soil erosion. However, excessive application of biochar can lead to inhibited crop growth, decreased yields, reduced quality, and significantly lower water and nutrient productivity, resulting in severe impacts on the surrounding soil and water environment [13,16]. Hence, exploring the mechanisms through which biochar enhances saline soil quality and fosters crop growth while also proposing suitable methods for its application holds paramount theoretical and practical significance in improving the ecological environment of saline farmlands and ensuring sustainable agricultural development.
The Hetao Irrigation District, located in the arid to semiarid region of Northwest China, serves as a crucial grain production base for the country. Soil salinization is the primary limiting factor for local soil productivity. Owing to its moderate salt tolerance, corn is considered one of the main characteristic cash crops in this region. After harvest, a large amount of crop straw is generated. However, limitations such as land occupation and burning restrictions hinder the utilization or disposal of crop straw to prevent air pollution. Directly returning crop straw to the field may also lead to numerous negative impacts. For example, the decomposition of straw releases a large amount of CO2, which is detrimental to carbon sequestration and emission reduction efforts. Additionally, straw may harbor insect eggs, potentially causing widespread outbreaks of pests and diseases in the following year’s planting season. Therefore, it is imperative to explore sustainable ways to harness the potential of crop straw utilization. Previous studies have indicated that converting straw into biochar through pyrolysis under high-temperature and low-oxygen conditions and then applying it to the soil can unlock the potential of biochar to ameliorate salinity and increase fertility. This approach not only addresses the limited utilization of straw resources but also reduces soil salinity, improves soil fertility, and increases crop yields [17,18]. However, currently, there are few comprehensive evaluations regarding the impact of biochar derived at various pyrolysis temperatures on the amelioration of saline soil quality and crop yield. Furthermore, as the application rate of biochar varies, different temperatures may have diverse effects on the physicochemical properties of saline soil and crop yield. Therefore, this study conducted a two-year field experiment in moderately saline maize farmland in which biochar derived at three pyrolysis temperatures (300, 500, and 700 °C) was applied at two different application rates (10 t/ha and 20 t/ha) to assess soil amelioration. The objectives of this study were as follows: (1) to evaluate the effects of biochar derived at different pyrolysis temperatures on saline soil quality and its regulating factors and (2) to investigate the relationship between soil quality and maize yield and determine the appropriate pyrolysis temperature and application rate of biochar.

2. Materials and Methods

2.1. Overview of the Experimental Site
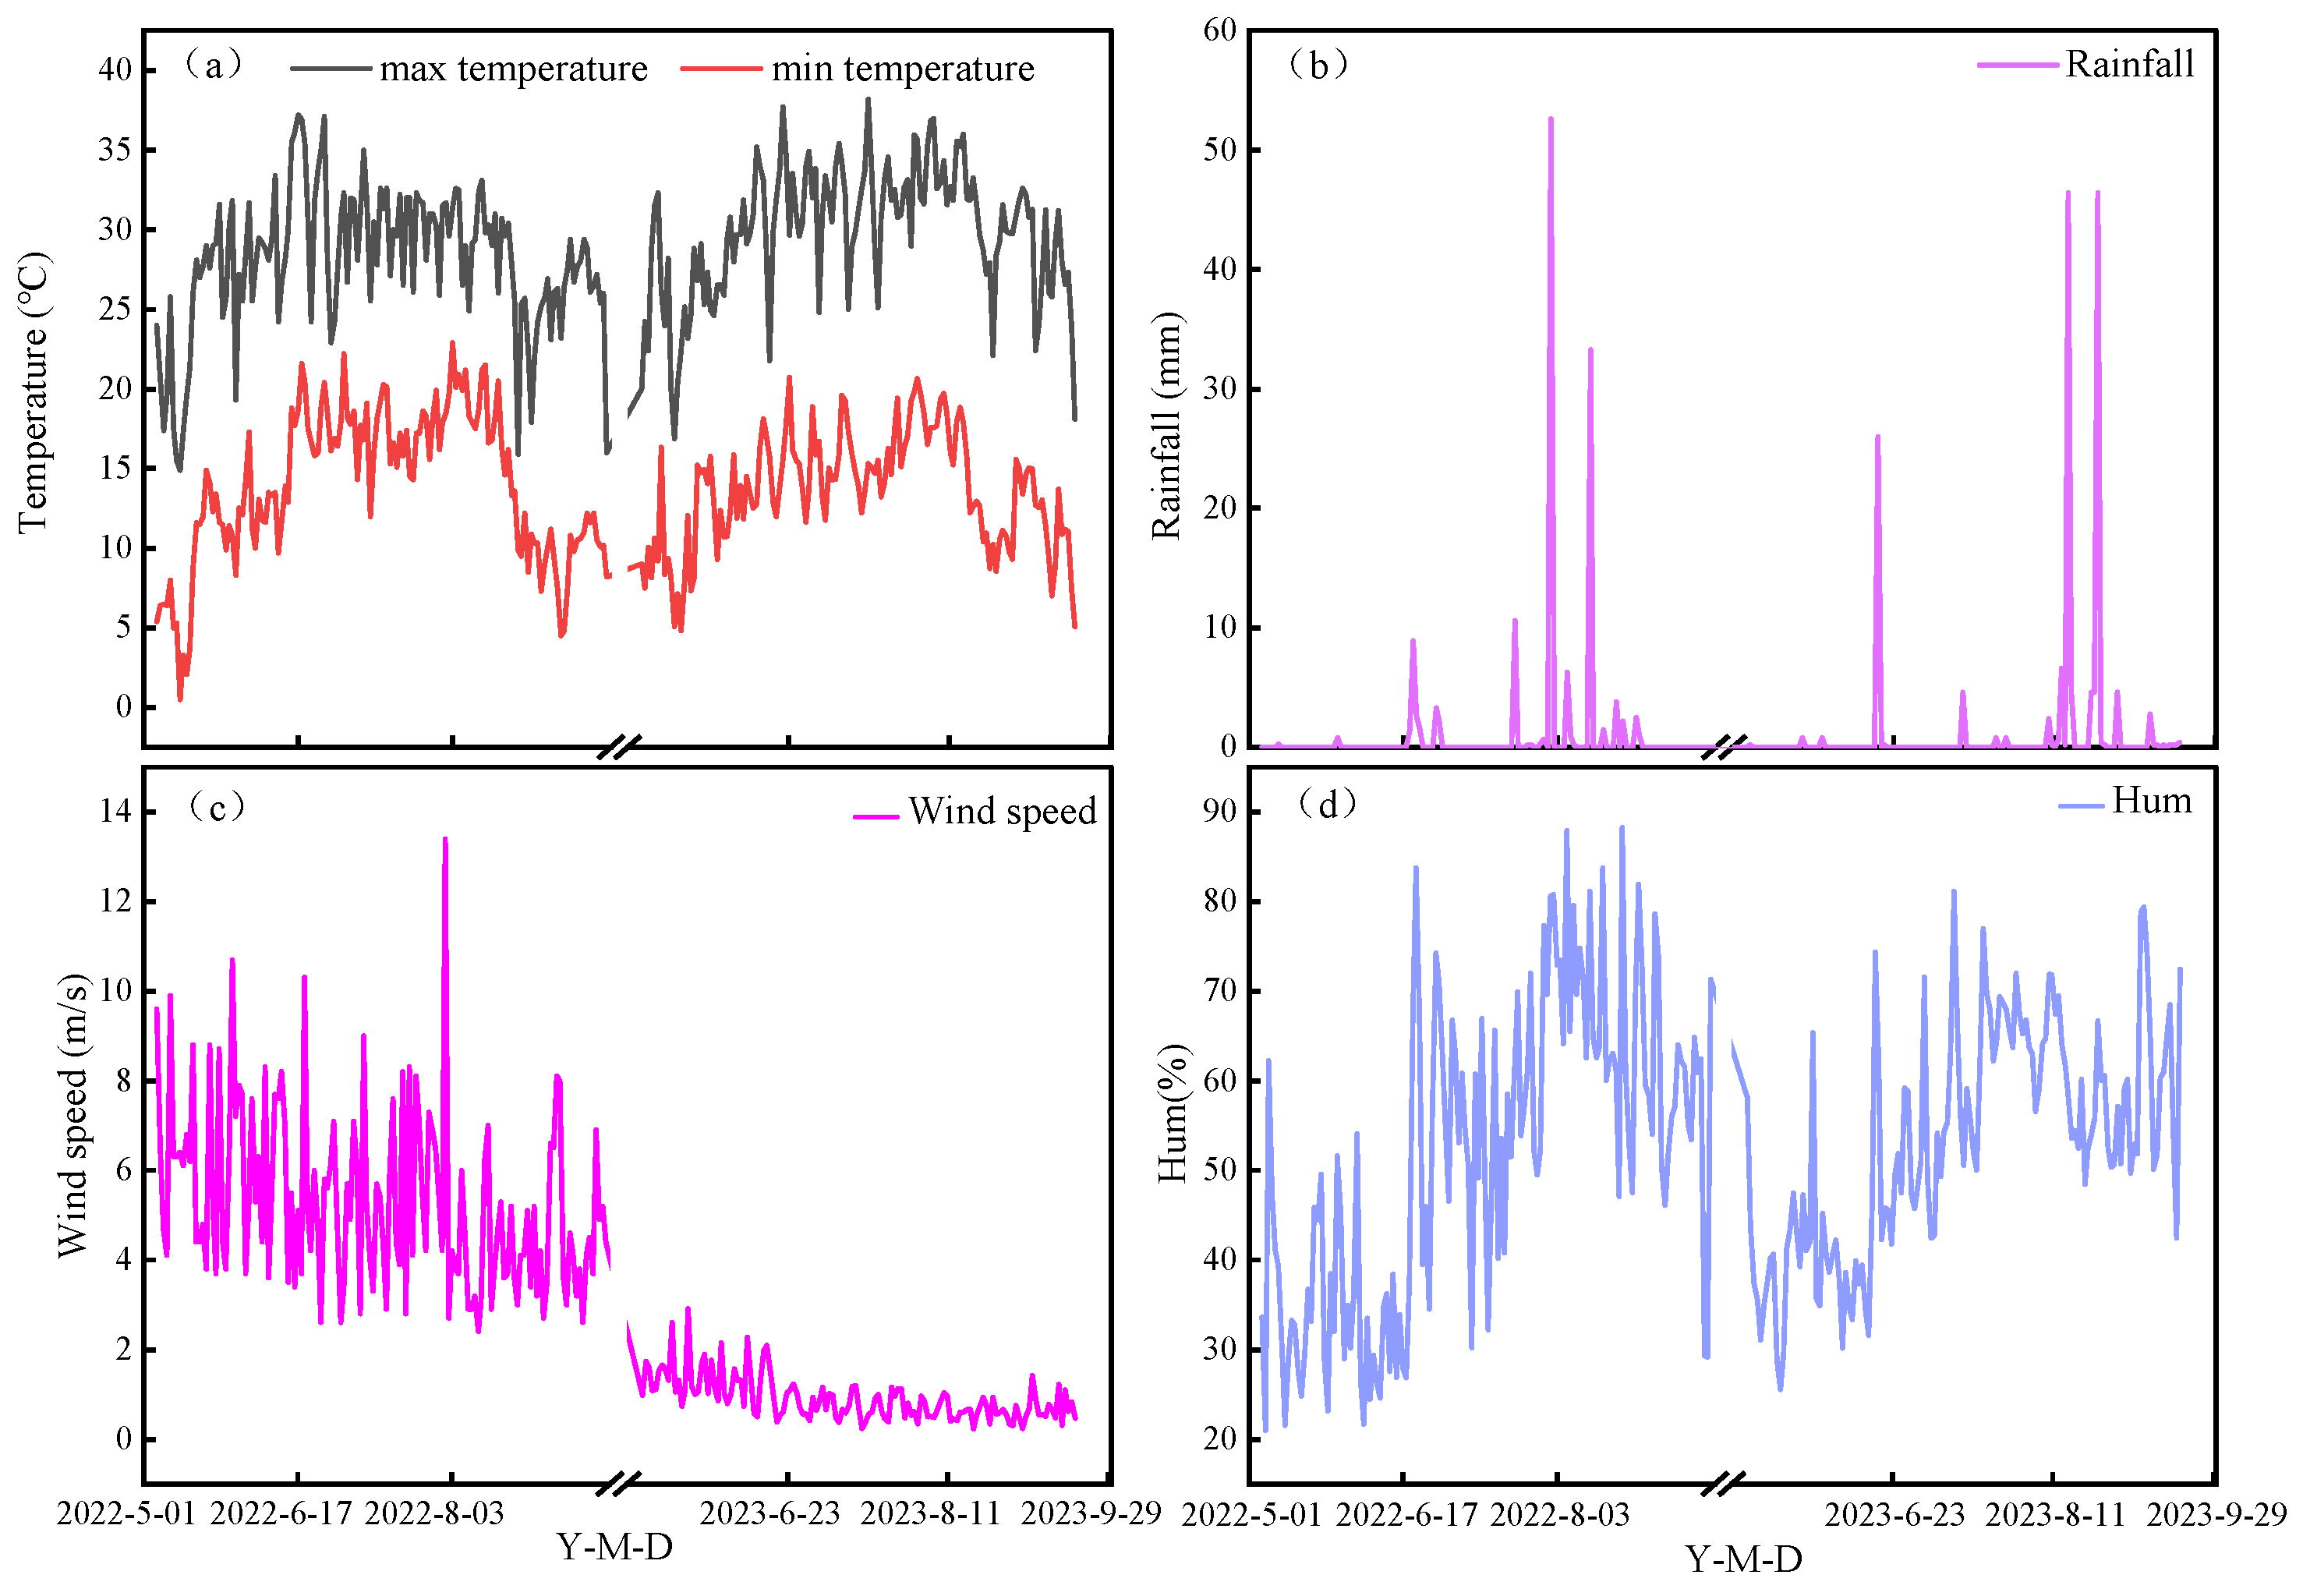
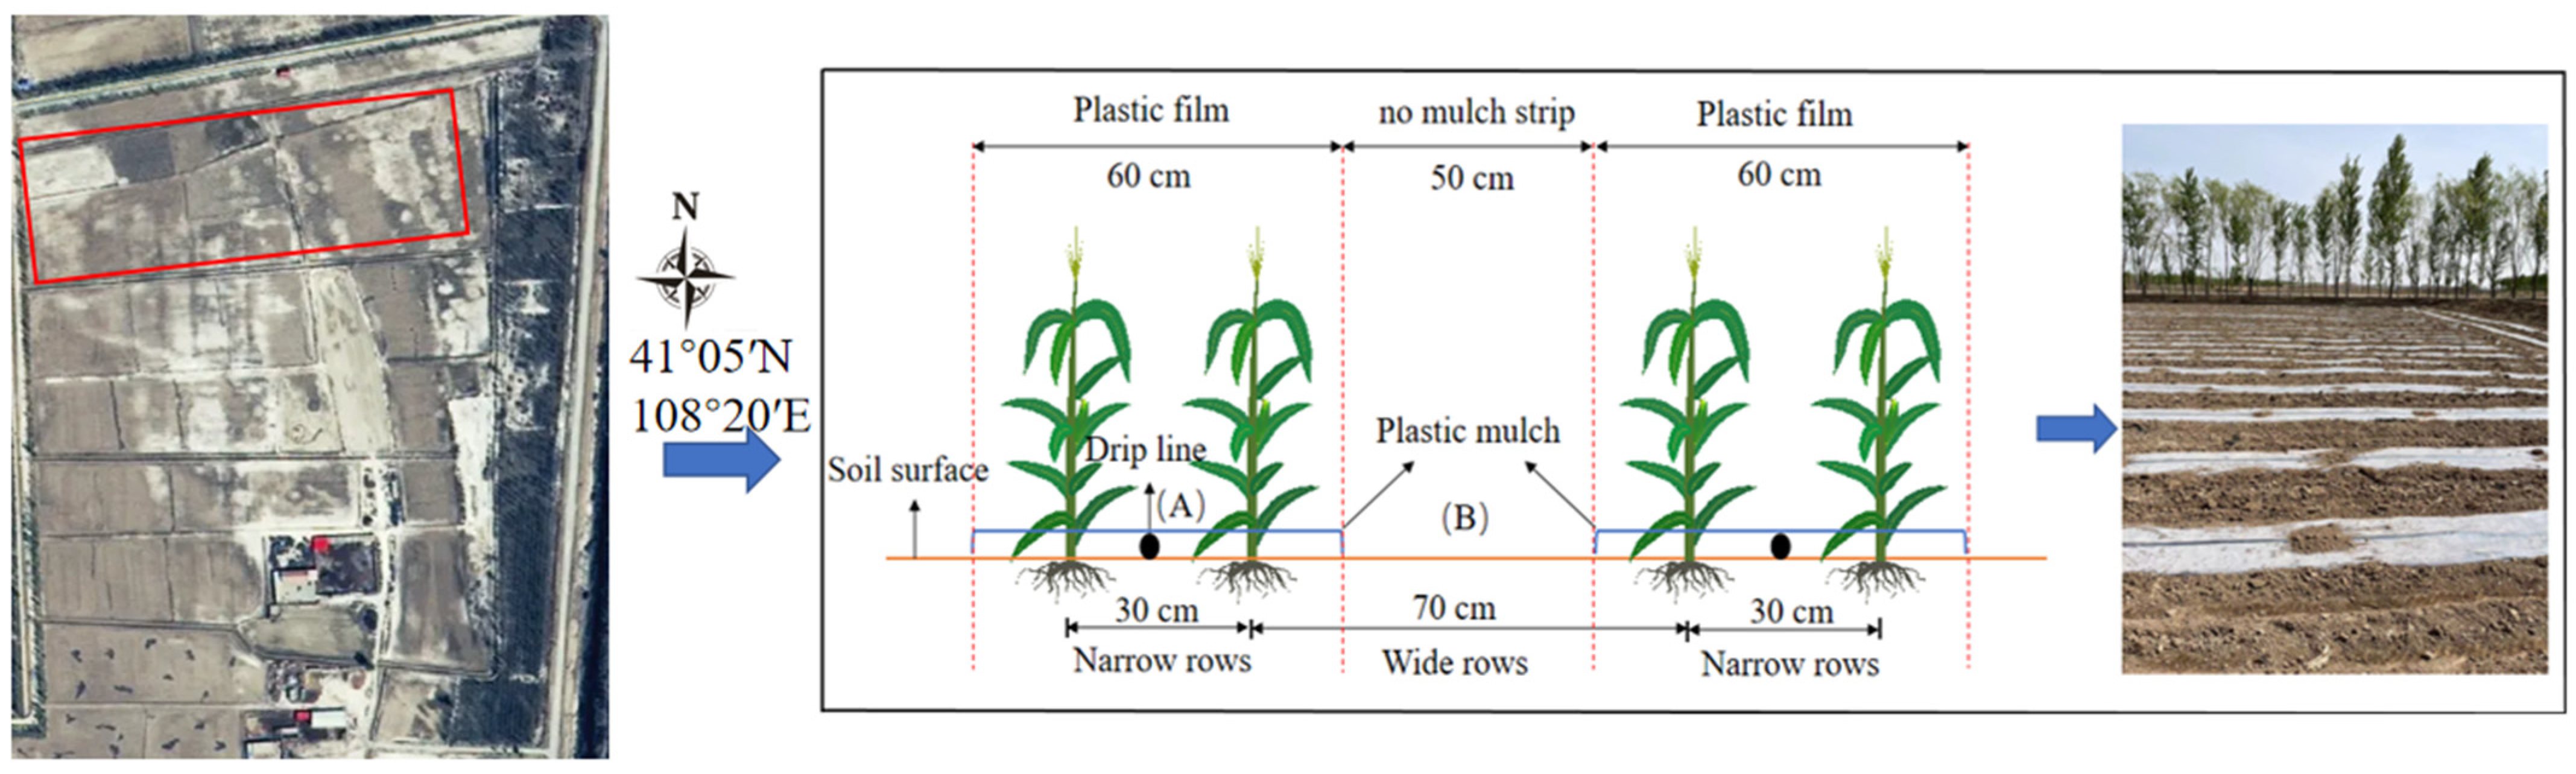
2.1.1. Study Site

The research area is located at the saline–alkali land restoration and improvement experimental base in Sunflower Town, Wuyuan County, within the Hetao Irrigation District (41°05′42″ N, 108°20′42″ E). This site is situated in the middle and upper reaches of the Yellow River, within a temperate arid to semiarid continental monsoon climate zone. The area has an annual average temperature of 7 °C, annual precipitation ranging from 152 to 240 mm, an annual sunshine duration of 2204.5 h, a cumulative annual temperature of 7572.4 °C, and a frost-free period lasting between 120 and 150 days. Within the experimental site, a field micrometeorological station (HOBO-U30) was established to automatically record meteorological data, including wind speed, air temperature, precipitation, and relative humidity. The meteorological data for the corn growing seasons of 2022 and 2023 are presented in Figure 1. Groundwater level fluctuations were measured via groundwater level sensors (groundwater level wireless monitoring system DATA-6216, China). During the two-year growing periods (5 May to 19 September 2022 and 10 May to 20 September 2023), the depth to groundwater ranged between 0.36 and 2.15 m and between 0.26 and 2.34 m, respectively.

2.1.2. Initial Soil Properties

Before the beginning of the experiment in 2022, initial soil samples from depths ranging from 0 to 100 cm were collected. The sand, silt, and clay contents at different soil depths (0–20, 20–40, 40–60, 60–80, and 80–100 cm depths) were measured via a Malvern laser particle size analyzer (Mastersizer 2000, Malvern Company, Malvern, UK). On the basis of these measurements [19], the soil type of the research area was determined to be loamy sand (Table 1). The electrical conductivity of the soil extract solutions with a soil-to-water ratio of 1:5 was measured via a DDS-307A conductivity meter [19]. The concentrations of CO3 and HCO3 were measured via the acid–base titration method, whereas the concentrations of Ca2+, Mg2+, and SO42− were measured via the EDTA titration method [20]. The concentration of Cl was determined via the silver nitrate titration method, and the concentration of Na+ was calculated on the basis of charge balance [20]. The soil chemical properties of the experimental site are listed in Table 2. The average soil salinity in the 0–60 cm layer of the experimental field ranged from 0.2% to 0.4%, indicating that the soil was moderately saline [21]. Furthermore, the ratio of chloride ions to sulfate ions in the 0–60 cm layer ranged from 20% to 100%. The soil salinity in the experimental area was categorized as chloride–sulfate type [21]. The total N content was determined via the Kjeldahl method; the available P was determined via the Olsen method; the available K content was extracted via ammonium acetate (NH4OAc) and via flame photometry; the organic matter was determined by potassium dichromate volume-external heating; and the alkali-hydrolyzed nitrogen was determined by alkali-diffusion method [20]. The initial soil properties of the plow layer (0–20 cm) in the experimental area are presented in detail in Table 3.

2.2. Biochar Preparation and Characteristics

2.2.1. Source of Raw Materials

Corn stalks were collected from the surrounding rural areas of the experimental site. After cleaning, air drying, and crushing, the samples were processed in a grinder for 5 min and then set aside for further use. The naphthalene used for analysis was of analytical grade with a purity greater than 99%. Its molar mass is 118.1 g/mol, and its water solubility (Cs, 25 °C) is 30.3 g/mol. The molecular area and molecular volume are 0.685 nm2 and 0.215 nm3, respectively.

2.2.2. Preparation Method for the Biochar

The specific steps for biochar production were as follows: 500 kg straw was dried, crushed, sieved through a 100-mesh sieve, and placed in a rotary furnace. Air was introduced into the furnace at a ventilation rate of 30 cm3/min (maintaining the partial pressure of oxygen at approximately 20 kPa). Prior to pyrolysis, nitrogen (N2) was introduced into the vacuum furnace at a rate of 100 cm3/L for approximately 10 min to create an inert atmosphere. The chamber temperature was increased to 300 °C, 500 °C, and 700 °C at a rate of 10 °C/min via a vacuum tube furnace (GSL 1600), and each temperature was maintained for 3 h. The corn straw biochar, once pyrolyzed, is acidified with ferrous sulfate (0.5%) for 48 h. The sample was then washed with deionized water until the pH of the biochar reached 6.5, resulting in acidified biochar.
The biochar samples were subjected to thermogravimetric (TG) and derivative thermogravimetric (DTG) analyses via a thermogravimetric analyzer (PerkinElmer Pyris™ 1 TGA, PerkinElmer, Waltham, USA). The pH of the biochar solution (sample/water = 1:20 w/v) was measured via a pH meter (Eutech pH 510, Eutech, Waltham, USA) [20]. The electrical conductivity (EC) value of the biochar was determined via a conductivity meter (DDS-307, Shanghai INESA Scientific Instrument Co., Ltd., Shanghai, China) [21]. The total contents of carbon (C), hydrogen (H), nitrogen (N), and sulfur (S) in the biochar were analyzed via an elemental analyzer (vario MICRO cube, Elementar Company, Hanau, Germany). Fifty milligrams of biochar passed through sieve No. 35 (0.5 mm) was used for this analysis [22]. The C, H, N, and S contents were measured in helium atmospheres. The O content was then measured in a helium–hydrogen atmosphere [22]. The ash content was determined by heating the sample at 800 °C for 4 h in a muffle furnace (Thermo BF51866KC-1, Elementar Company, Hanau, Germany) under ambient atmosphere [22]. The total organic carbon (TOC) in the biochar was determined via the potassium dichromate oxidation method [20]. The total potassium (TK) and total phosphorus (TP) were determined by digesting samples with HClO4-HF solution and measured by flame spectrophotometer and phosphomolybdate colorimetric method, respectively [23]. The properties of the biochar produced at different pyrolysis temperatures are detailed in Table 4.

2.3. Experimental Design

2.3.1. Biochar Treatment

Before sowing in 2022, seven treatments were established on the saline–alkali farmland. These treatments included no biochar application (CK) and three gradients of biochar pyrolysis temperatures, 300 °C (C1), 500 °C (C2), and 700 °C (C3), combined with two levels of biochar application, 10 t/ha (T1) and 20 t/ha (T2), and labeled CK, C1T1, C1T2, C2T1, C2T2, C3T1, and C3T2 (Table 5). Each treatment was replicated three times. The biochar was evenly distributed on the surface of the soil in each plot and then mixed uniformly with the soil (0–20 cm layer) via a rotary tiller. Each plot measured 8 m × 10 m and was replicated three times. To prevent cross-contamination between adjacent plots due to irrigation and fertilization, a 1.5 m wide buffer zone was established between them.

2.3.2. Maize Planting and Drip Irrigation System Arrangement

The maize variety used in this study was JunKai 918, a hybrid bred from the maternal parent B598 and the paternal parent B009. It has an average growth period of 130 days and is well-suited for local cultivation. The planting density was 67,500 plants per hectare, with a spacing of 30 cm between plants and 50 cm between rows. The planting dates for the two years were 5 May and 10 May. Drip irrigation and fertilization were applied under mulch, with a planting pattern of one row per film and two lines of plants (as shown in Figure 2). The drip irrigation tape was a single-wing labyrinth type, with a spacing of 30 cm between drip heads and a flow rate of 2500 cm3/h. The mulch film covered a width of 60 cm and had a thickness of 0.01 mm.

2.3.3. Irrigation and Fertilization

The irrigation and fertilization regime for maize followed local farmer practices. The irrigation water was sourced from groundwater wells, with an electrical conductivity ranging from 0.35 to 0.85 dS/m. The irrigation water amount was 22.5 mm, and irrigation was carried out 8 times throughout the growing season. Drip irrigation fertilization employed commonly used fertilizers, including urea (N: 46%), calcium superphosphate (P2O5: 12%), and potassium sulfate (K2O: 50%). Additional liquid fertilizer (ammonium nitrate solution, N: 32%) was applied as a top dressing. The base fertilizer (urea, calcium superphosphate, potassium sulfate) was applied through the film with a fertilizer planter, while the top dressing was applied via a fertilizer tank with ammonium nitrate solution. The detailed irrigation and fertilization schedules are provided in Table 6.

2.4. Measurement Indicators and Methods

2.4.1. Soil Bulk Density and Porosity

After the maize harvest in 2022 and 2023, in each plot, a soil profile of 0.5 m depth was excavated, and a 100 cm3 volumetric ring was inserted into the soil layers at depths of 0–10 cm, 10–20 cm, 20–30 cm, and 30–40 cm, respectively, to determine the soil bulk density (three replicates were set for each plot). The soil porosity was calculated via the following formula [20]:
S p = 1 B D P D
In the equation, SP represents the soil porosity, BD represents the soil bulk density (g/cm3), and PD represents the soil particle density (2.65 g/cm3).

2.4.2. Soil Moisture Content and Electrical Conductivity (EC)

The soil moisture content was determined via the drying method. During the maize growth stages in 2022 and 2023 (the seedling stage, jointing stage, tasselling stage, grain filling stage, and maturity stage), soil samples were collected via a soil auger at different depths (0–20 cm, 20–40 cm, 60–80 cm, 80–100 cm) and horizontal positions (sampling sites A and B). These samples were then placed in aluminum boxes and dried in an oven at 105 °C until a constant weight was reached to determine the soil moisture content [20]. The soil volumetric moisture content is calculated as the product of the soil moisture content by mass and the soil bulk density.
S W C = G W C × B D
where SWC represents the volumetric water content, GWC represents the gravimetric moisture content, and BD represents the soil bulk density (g/cm3).
Soil electrical conductivity (EC) was measured via a conductivity meter (DDS-307, Rex Electric Chemical, Shanghai, China) with a soil-to-water ratio of 1:5 [19].

2.4.3. Soil Nutrient Content

In 2022 and 2023, prior to maize planting and at harvest, soil samples were collected from three positions within each plot (between mulches, under drip emitters, and at the middle position of the mulch) at a depth of 40 cm. The soil samples from the same plot, different positions, and same depth were then thoroughly mixed, air-dried, and sieved through a 2 mm mesh for further analysis. The soil pH was determined via a pH meter (PHS-2F). Five grams of soil was immersed in 50 cm3 of potassium chloride solution (2 mol/L), shaken for 0.5 h, filtered, and then simultaneously analyzed via an AA3 continuous flow analyzer (Bran+Luebbe, Berlin, Germany) to determine the nitrate–nitrogen and ammonium–nitrogen contents (mg/kg) [6]. The effective phosphorus in the soil is extracted via a 0.5 mol/L sodium bicarbonate solution (pH = 8.5), and its content is determined via the molybdenum antimony colorimetric method [20].

2.4.4. Measurement of Maize Yield

After the maturity stage, the number of maize plants in each plot was counted. In the middle of each plot, 10 representative maize plants with uniform growth and development were selected, placed in mesh bags, numbered, and transferred to a ventilated room for air drying at room temperature. After drying and threshing, the grains were weighed to measure the yield. From the grain samples, subsamples were taken and dried in a constant-temperature oven (DHG-9246A, Shanghai Jinghong, Shanghai, China) via the drying method to determine the moisture content of the grains. The grain weight was subsequently adjusted to yield grain production at 14% moisture content. Each treatment was replicated 3 times. The formula for calculating maize yield is as follows:
Y = F W × S Y × ( 1 G W C ) / ( 1 14 % )
where Y represents the yield (kg/ha), FW represents the fresh weight of the grains (kg), SY represents the seed yield (%), and GWC represents the moisture content of the grains.

2.5. Soil Quality Index (SQI) Evaluation

The soil quality index calculation involves 3 steps: (1) Determining the soil indicators used for the SQI analysis, retaining principal components (PCs) with eigenvalues >1; in each selected PC, only absolute numbers within the top 10% of the maximum loading factor are retained in the MDS. Additionally, if multiple indicators are retained in the PC, the least weighted indicator with a correlation greater than 0.6 is removed from the MDS [13]. (2) Calculating the weights of selected indicators to obtain scores. (3) Selected indicators are integrated to calculate the SQI values [24].

2.5.1. Soil Indicator Scores

After the MDS indicators are selected, the soil properties are transformed into values ranging from 0 to 1 via a nonlinear scoring algorithm [25]. The calculation of crop indicator scores is as follows: Formula (1) represents soil properties that have a beneficial impact on soil quality (such as soil nutrients) “the more, the better”, whereas Formula (2) represents soil properties that have a detrimental impact on soil quality “the less, the better” (such as soil bulk density and salinity).
u = 0   x b   x b a b b < x < a 1   x a
u = 1   x b   a x a b b < x < a 0   x a
where u represents the soil quality score; x represents the value of the crop indicator; and a and b represent the maximum and minimum values of each crop indicator, respectively.

2.5.2. Soil Quality Index (SQI)

The SQI includes the selection of indicators and the calculation of indicator weights. The calculation method for the crop quality index is as follows:
S Q I = i = 1 n ( W i × u i )
where Wi represents the weight of crop indicator i and ui represents the score of crop indicator i.

2.6. Data Processing and Analysis

Excel 2016 was used to statistically organize the data. Multiple comparisons: Least significant differences were determined via SPSS 20.0, and one-way analysis of variance (ANOVA) was used (p < 0.05) to determine significant differences between treatments. The data were plotted with OriginPro 2021.

3. Results and Analysis

3.1. The Impact of Biochar Produced at Different Pyrolysis Temperatures on Soil Properties

3.1.1. The Effects of Biochar Produced at Different Pyrolysis Temperatures on Soil Bulk Density and Porosity

Figure 3 shows the effects of adding biochar produced at different pyrolysis temperatures on the soil bulk density and porosity of the 0–40 cm soil layer over two maize growing seasons. Figure 3 shows that as the pyrolysis temperature of the biochar increased and the amount of biochar applied increased, the soil bulk density gradually decreased, and the soil porosity gradually increased. The application of biochar had a significant effect on the soil bulk density and porosity in the 0–20 cm layer in 2022 and the 0–30 cm layer in 2023. In 2022, compared with the control (CK), the various biochar treatments significantly reduced the soil bulk density by 9.32% to 19.63% and increased the corresponding soil porosity by 11.77% to 21.21% in the 0–20 cm layer. In 2023, compared with the CK treatment, the various biochar treatments significantly reduced the soil bulk density by 7.74% to 21.67% and increased the corresponding soil porosity by 9.49% to 22.97% in the 0–30 cm layer. However, the application of biochar did not have a significant effect on the soil bulk density or porosity in the 20–40 cm layer in 2022 or the 30–40 cm layer in 2023.

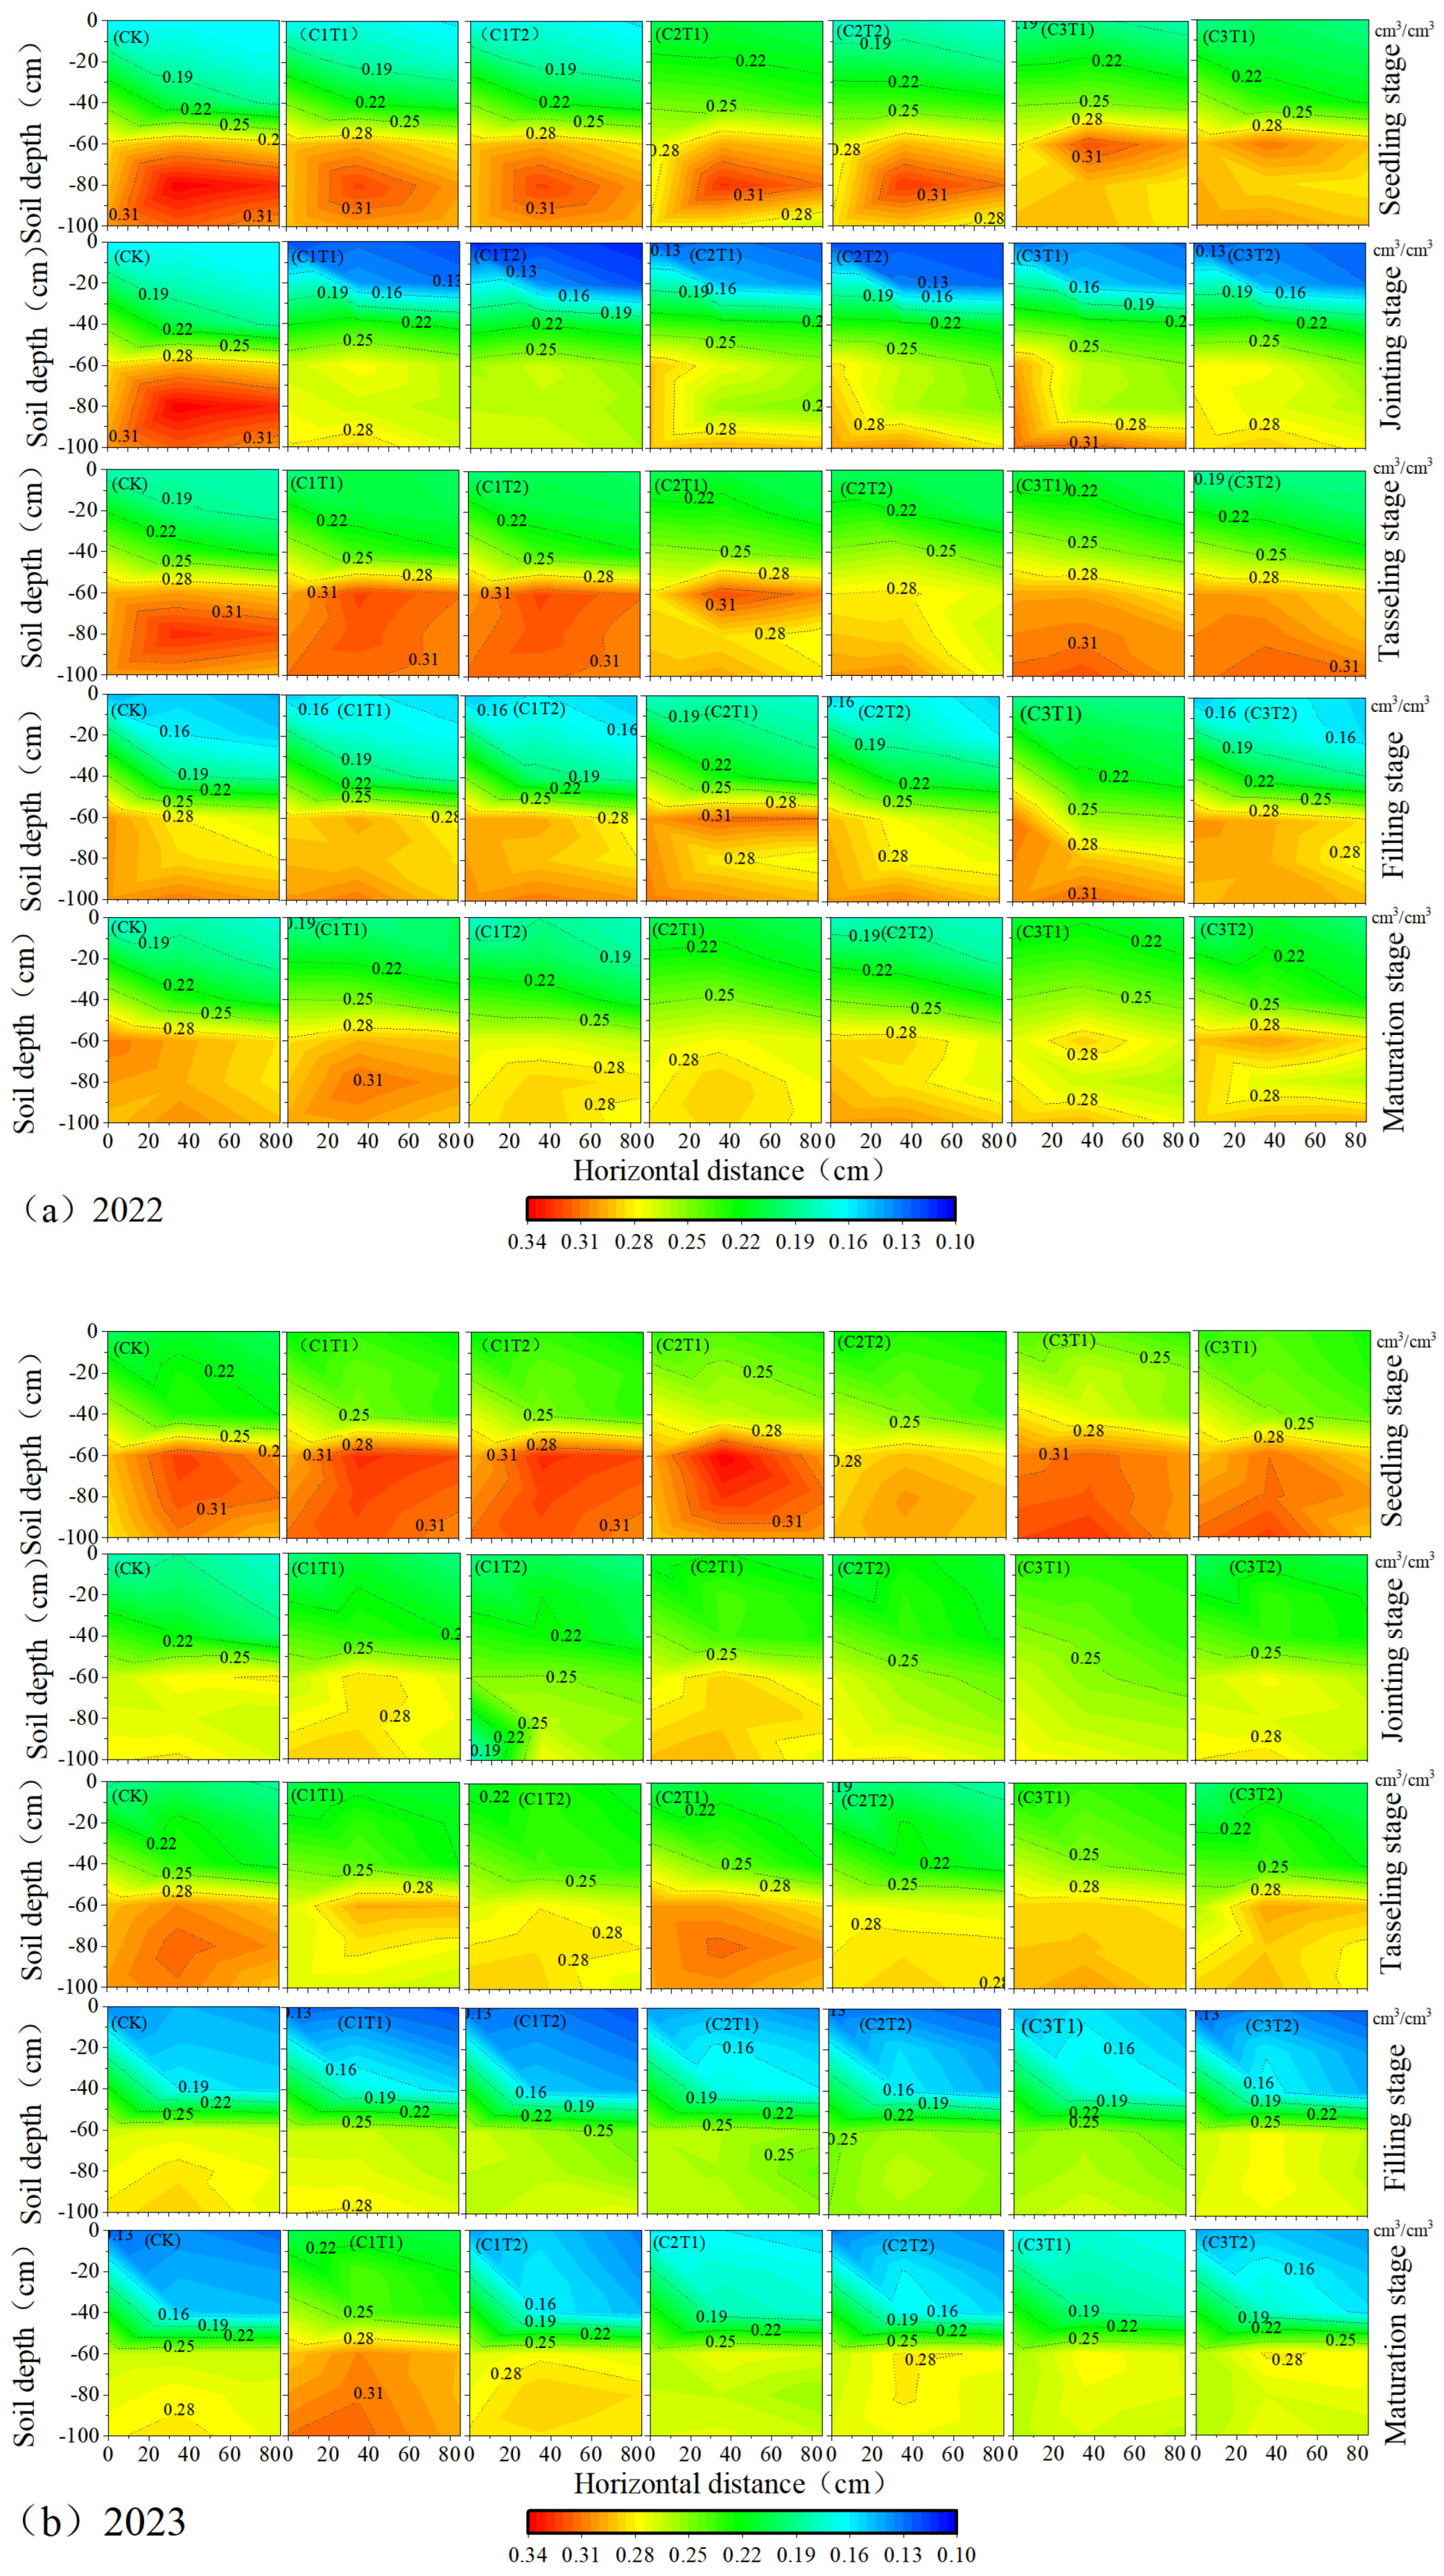
3.1.2. The Impact of Biochar Produced at Different Pyrolysis Temperatures on Soil Moisture

Figure 4 illustrates the impact of applying biochar on the two-dimensional distribution of soil moisture in the 0–100 cm soil profile of maize fields during different growth stages (seedling, tillering, tasselling, grain filling, and maturity) in 2022 and 2023. The figure shows that the soil moisture content at the 0–60 cm depth gradually increased with increasing soil depth under all biochar treatments, but there was no significant variation in the soil moisture content with increasing soil depth in the 60–100 cm soil layer. Horizontally, the soil moisture content under the mulch in all the treatments was significantly greater than that between the mulch types.
Furthermore, the application of biochar had a significant effect on the soil moisture in the 0–40 cm soil layer. The biochar produced at medium to high pyrolysis temperatures (500 °C and 700 °C) led to a relatively high moisture content, with the moisture content observed in the treatment with 10 tons of biochar. However, applying 20 tons of biochar reduces the soil moisture content. Specifically, treatment C3T1 resulted in the highest soil moisture content, which surpassed that of the other treatments by 5.61% to 25.00% (average soil moisture content in the 0–40 cm soil layer during the 2022 and 2023 growing seasons).

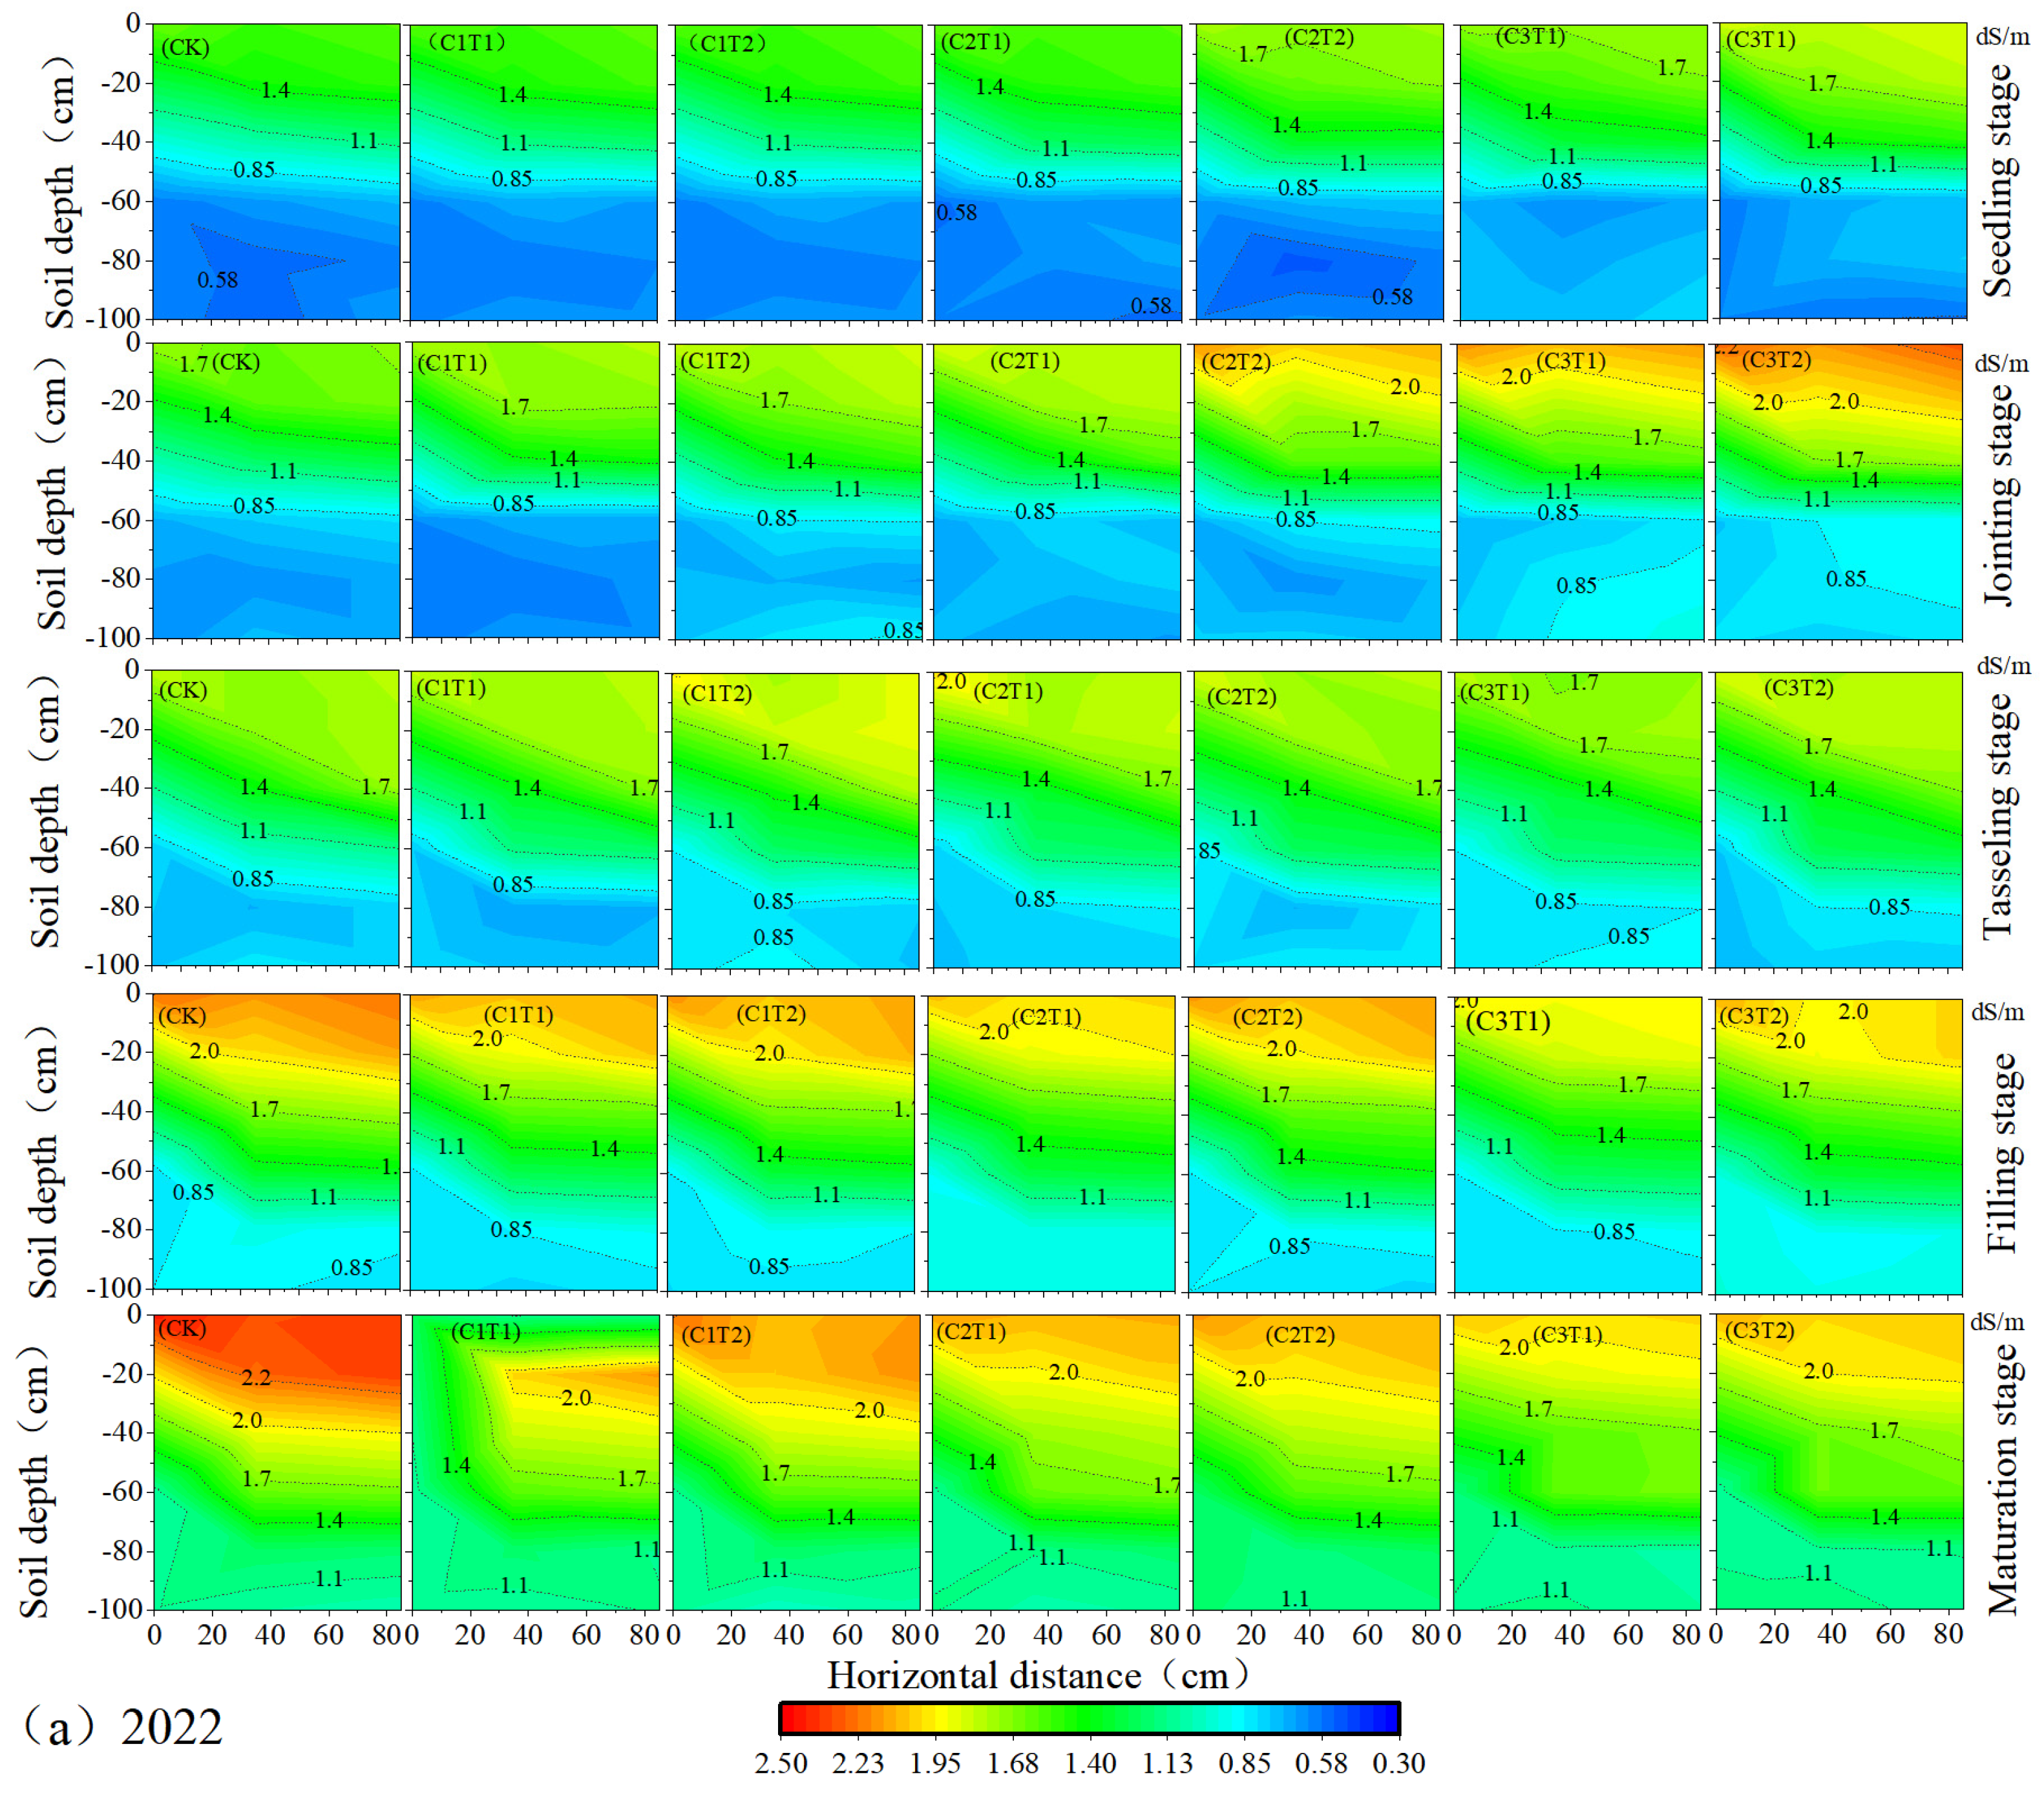
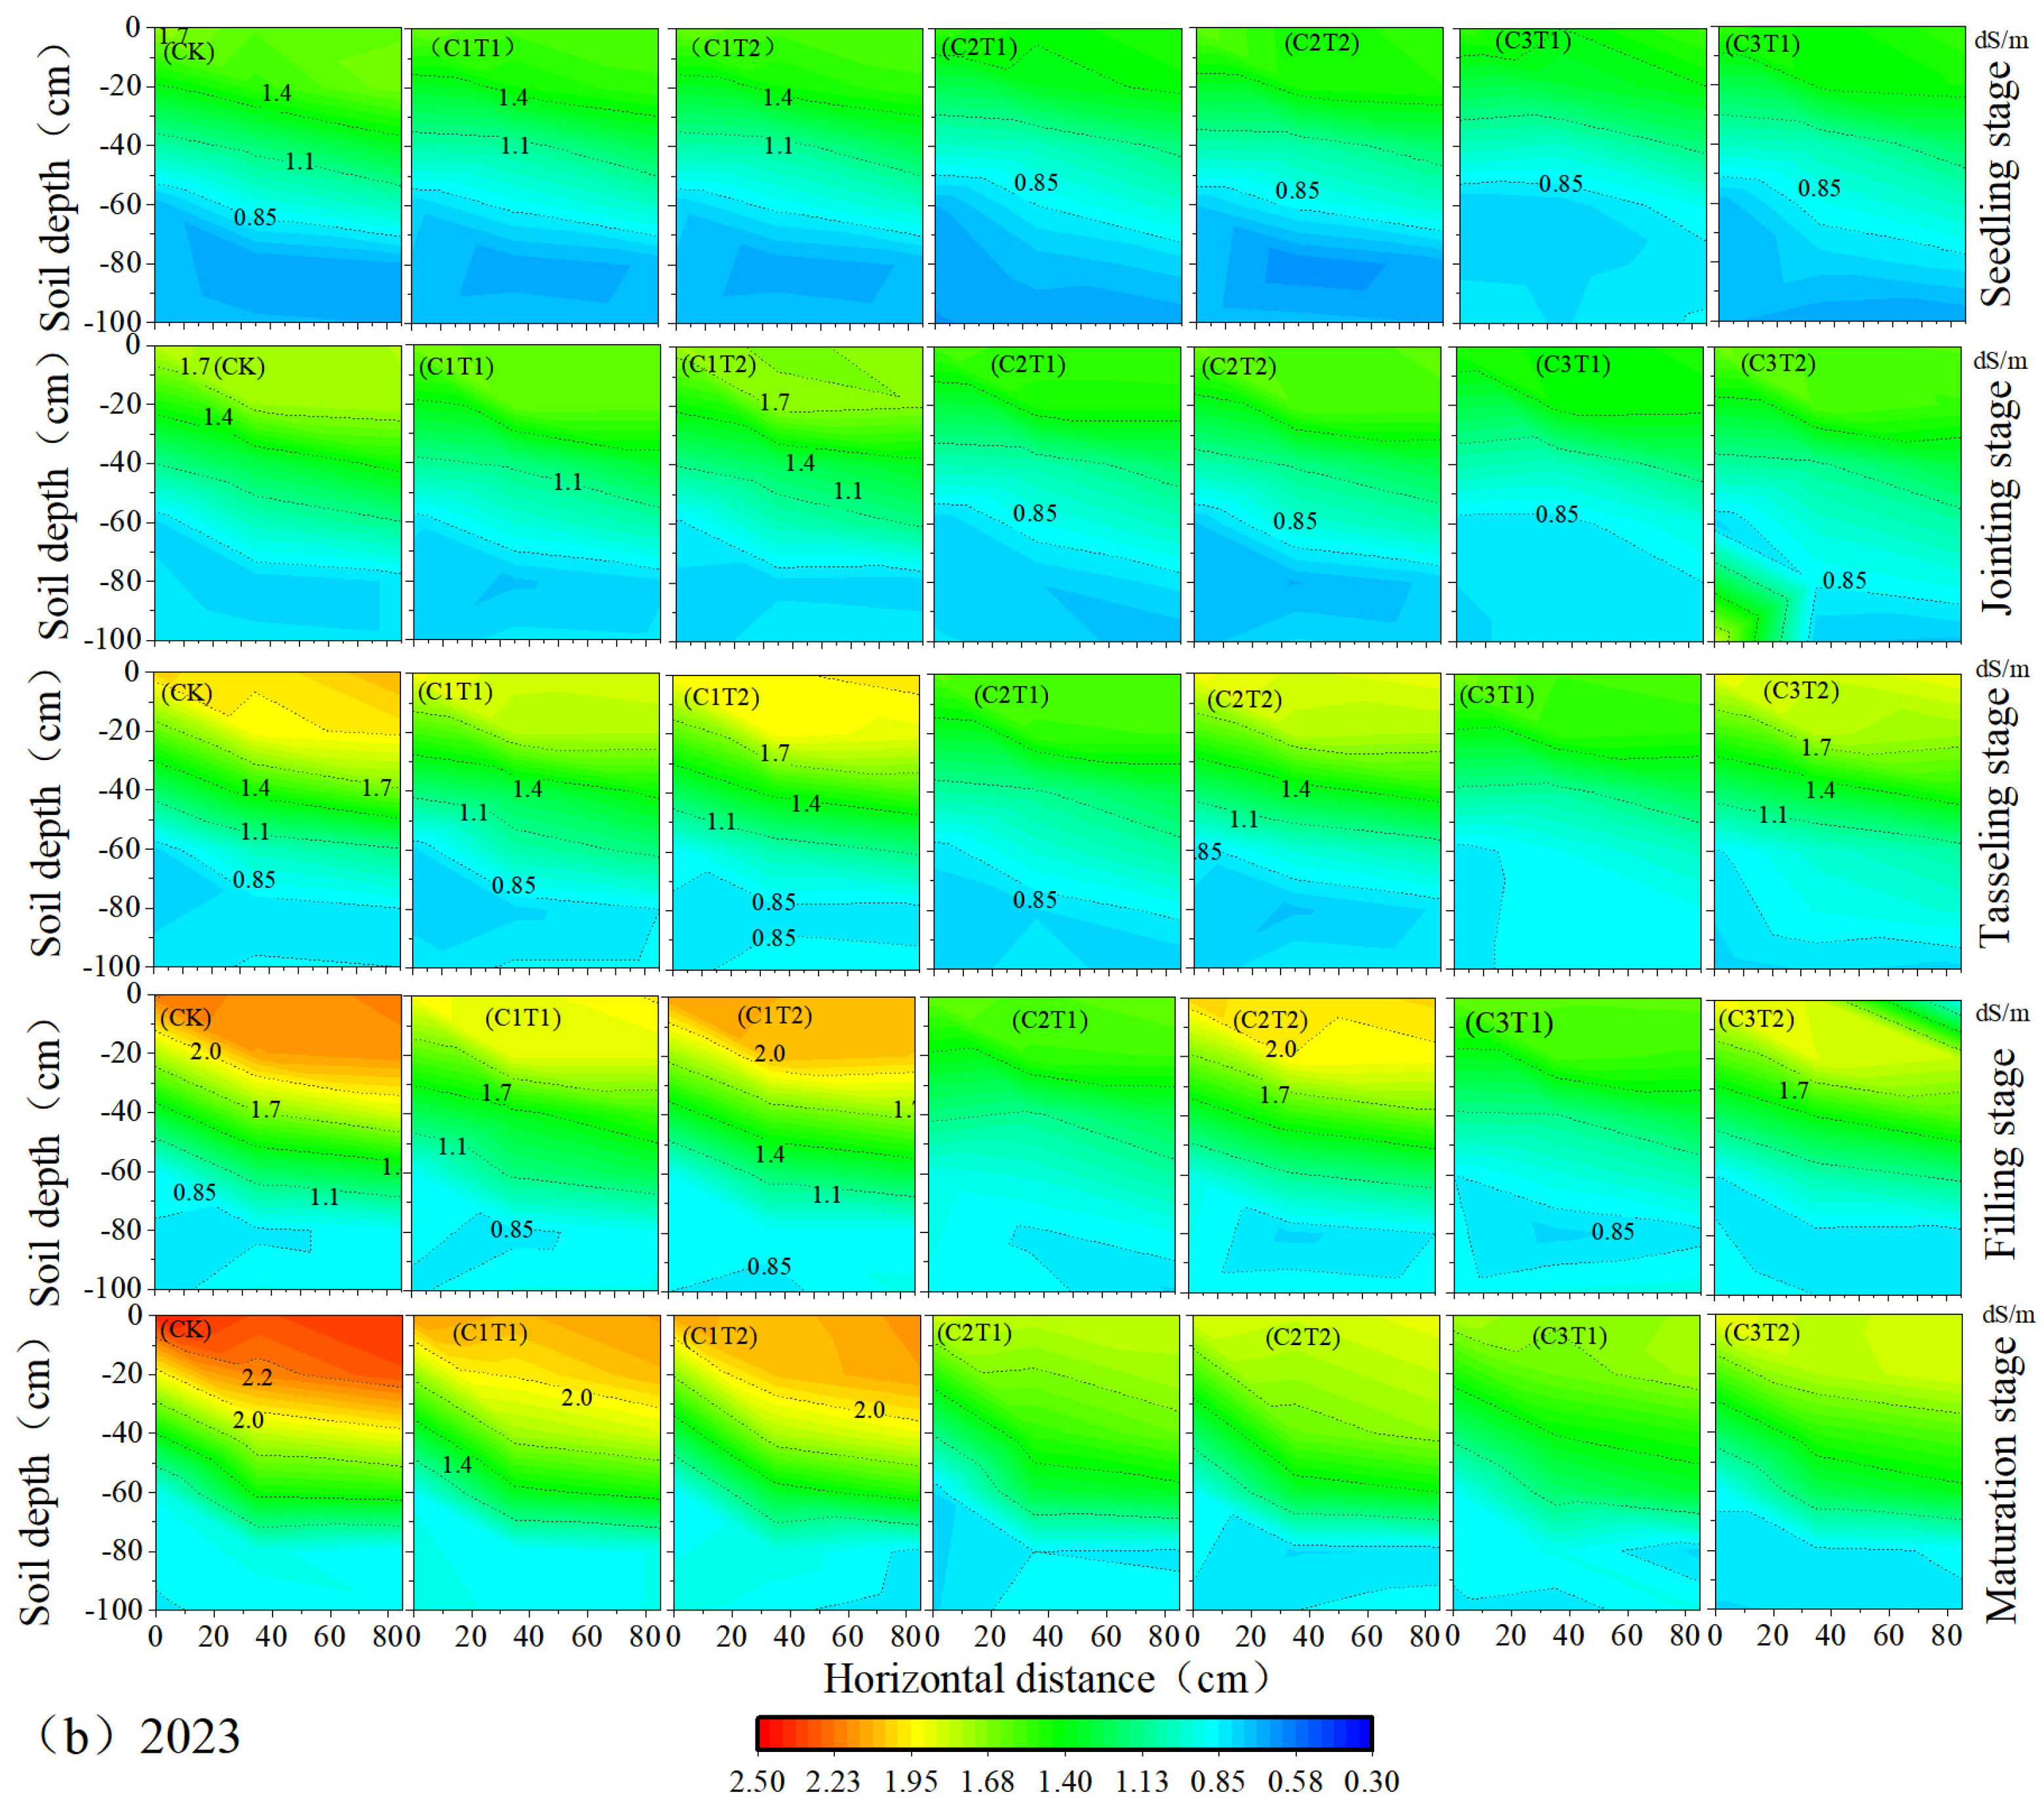
3.1.3. The Impact of Biochar Produced at Different Pyrolysis Temperatures on Soil Salinity

Figure 5 illustrates the impact of biochar produced at different pyrolysis temperatures on the two-dimensional distribution of soil salinity in the 0–100 cm soil profile during different growth stages of maize in fields in 2022 and 2023. Throughout the maize growth stages, the distribution patterns of soil salinity in the field were generally consistent both horizontally and vertically. Vertically, soil salinity decreases gradually with increasing soil depth in the 0–60 cm layer but remains relatively constant in the 60–100 cm layer. Horizontally, the soil salinity is greater between the mulches than under the mulches.
The application of biochar significantly affected the soil salinity in the 0–40 cm soil layer. During the seedling and tillering stages of maize in 2022, soil salinity increases with increasing biochar application rate, and higher pyrolysis temperatures of biochar result in higher soil salinity. However, during the grain filling and maturity stages of maize, lower soil salinity is observed with the application of 10 tons of biochar, especially for biochar produced at medium to high pyrolysis temperatures (500 °C and 700 °C). During the entire growing season of maize in 2023, treatment C3T1 consistently results in lower soil salinity, which is significantly lower than that of the other treatments by 2.91% to 16.94% (with no significant difference compared with treatment C2T1). These findings indicate that soil salinity is regulated by the biochar pyrolysis temperature, application rate, and experimental duration.

3.1.4. The Impact of Biochar Produced at Different Pyrolysis Temperatures on Soil Nutrients

Table 7 presents the effects of biochar treatment at different pyrolysis temperatures on the nutrient contents of saline–alkali soil in 2022 and 2023. The impacts of biochar application on the soil nutrient contents in the 0–20 cm and 20–40 cm soil layers were generally consistent. No significant differences were observed among the treatments in terms of the soil ammonium–nitrogen or available potassium contents in the soil. However, biochar application significantly affected the soil nitrate–nitrogen, organic carbon, and available phosphorus contents.
The analysis indicated that the application of biochar reduced the soil nitrate–nitrogen content during the maize harvest period and that the soil nitrate–nitrogen content was negatively correlated with the pyrolysis temperature and application rate of the biochar. Compared with that under the CK treatment, the soil nitrate–nitrogen content under the different biochar treatments decreased by 7.49% to 53.66% and 6.67% to 120.17% in 2022 and 2023, respectively (average of 0–40 cm). Additionally, the application of biochar increased the soil organic carbon content, which was positively correlated with the pyrolysis temperature and application rate of biochar. Compared with that in the CK treatment, the soil organic carbon content in the 2022 and 2023 treatments increased significantly, from 29.25% to 190.36% and 41.32% to 202.05%, respectively (average of 0–40 cm). Moreover, the application of biochar can significantly increase the soil’s available phosphorus content, which was positively correlated with the application rate of biochar and negatively correlated with the pyrolysis temperature of the biochar. The C1T2 treatment resulted in the highest soil available phosphorus content, which was greater than that of the other treatments by 9.18% to 77.93% and 13.40% to 115.32% in 2022 and 2023, respectively (average of 0–40 cm).

3.2. Soil Quality Evaluation

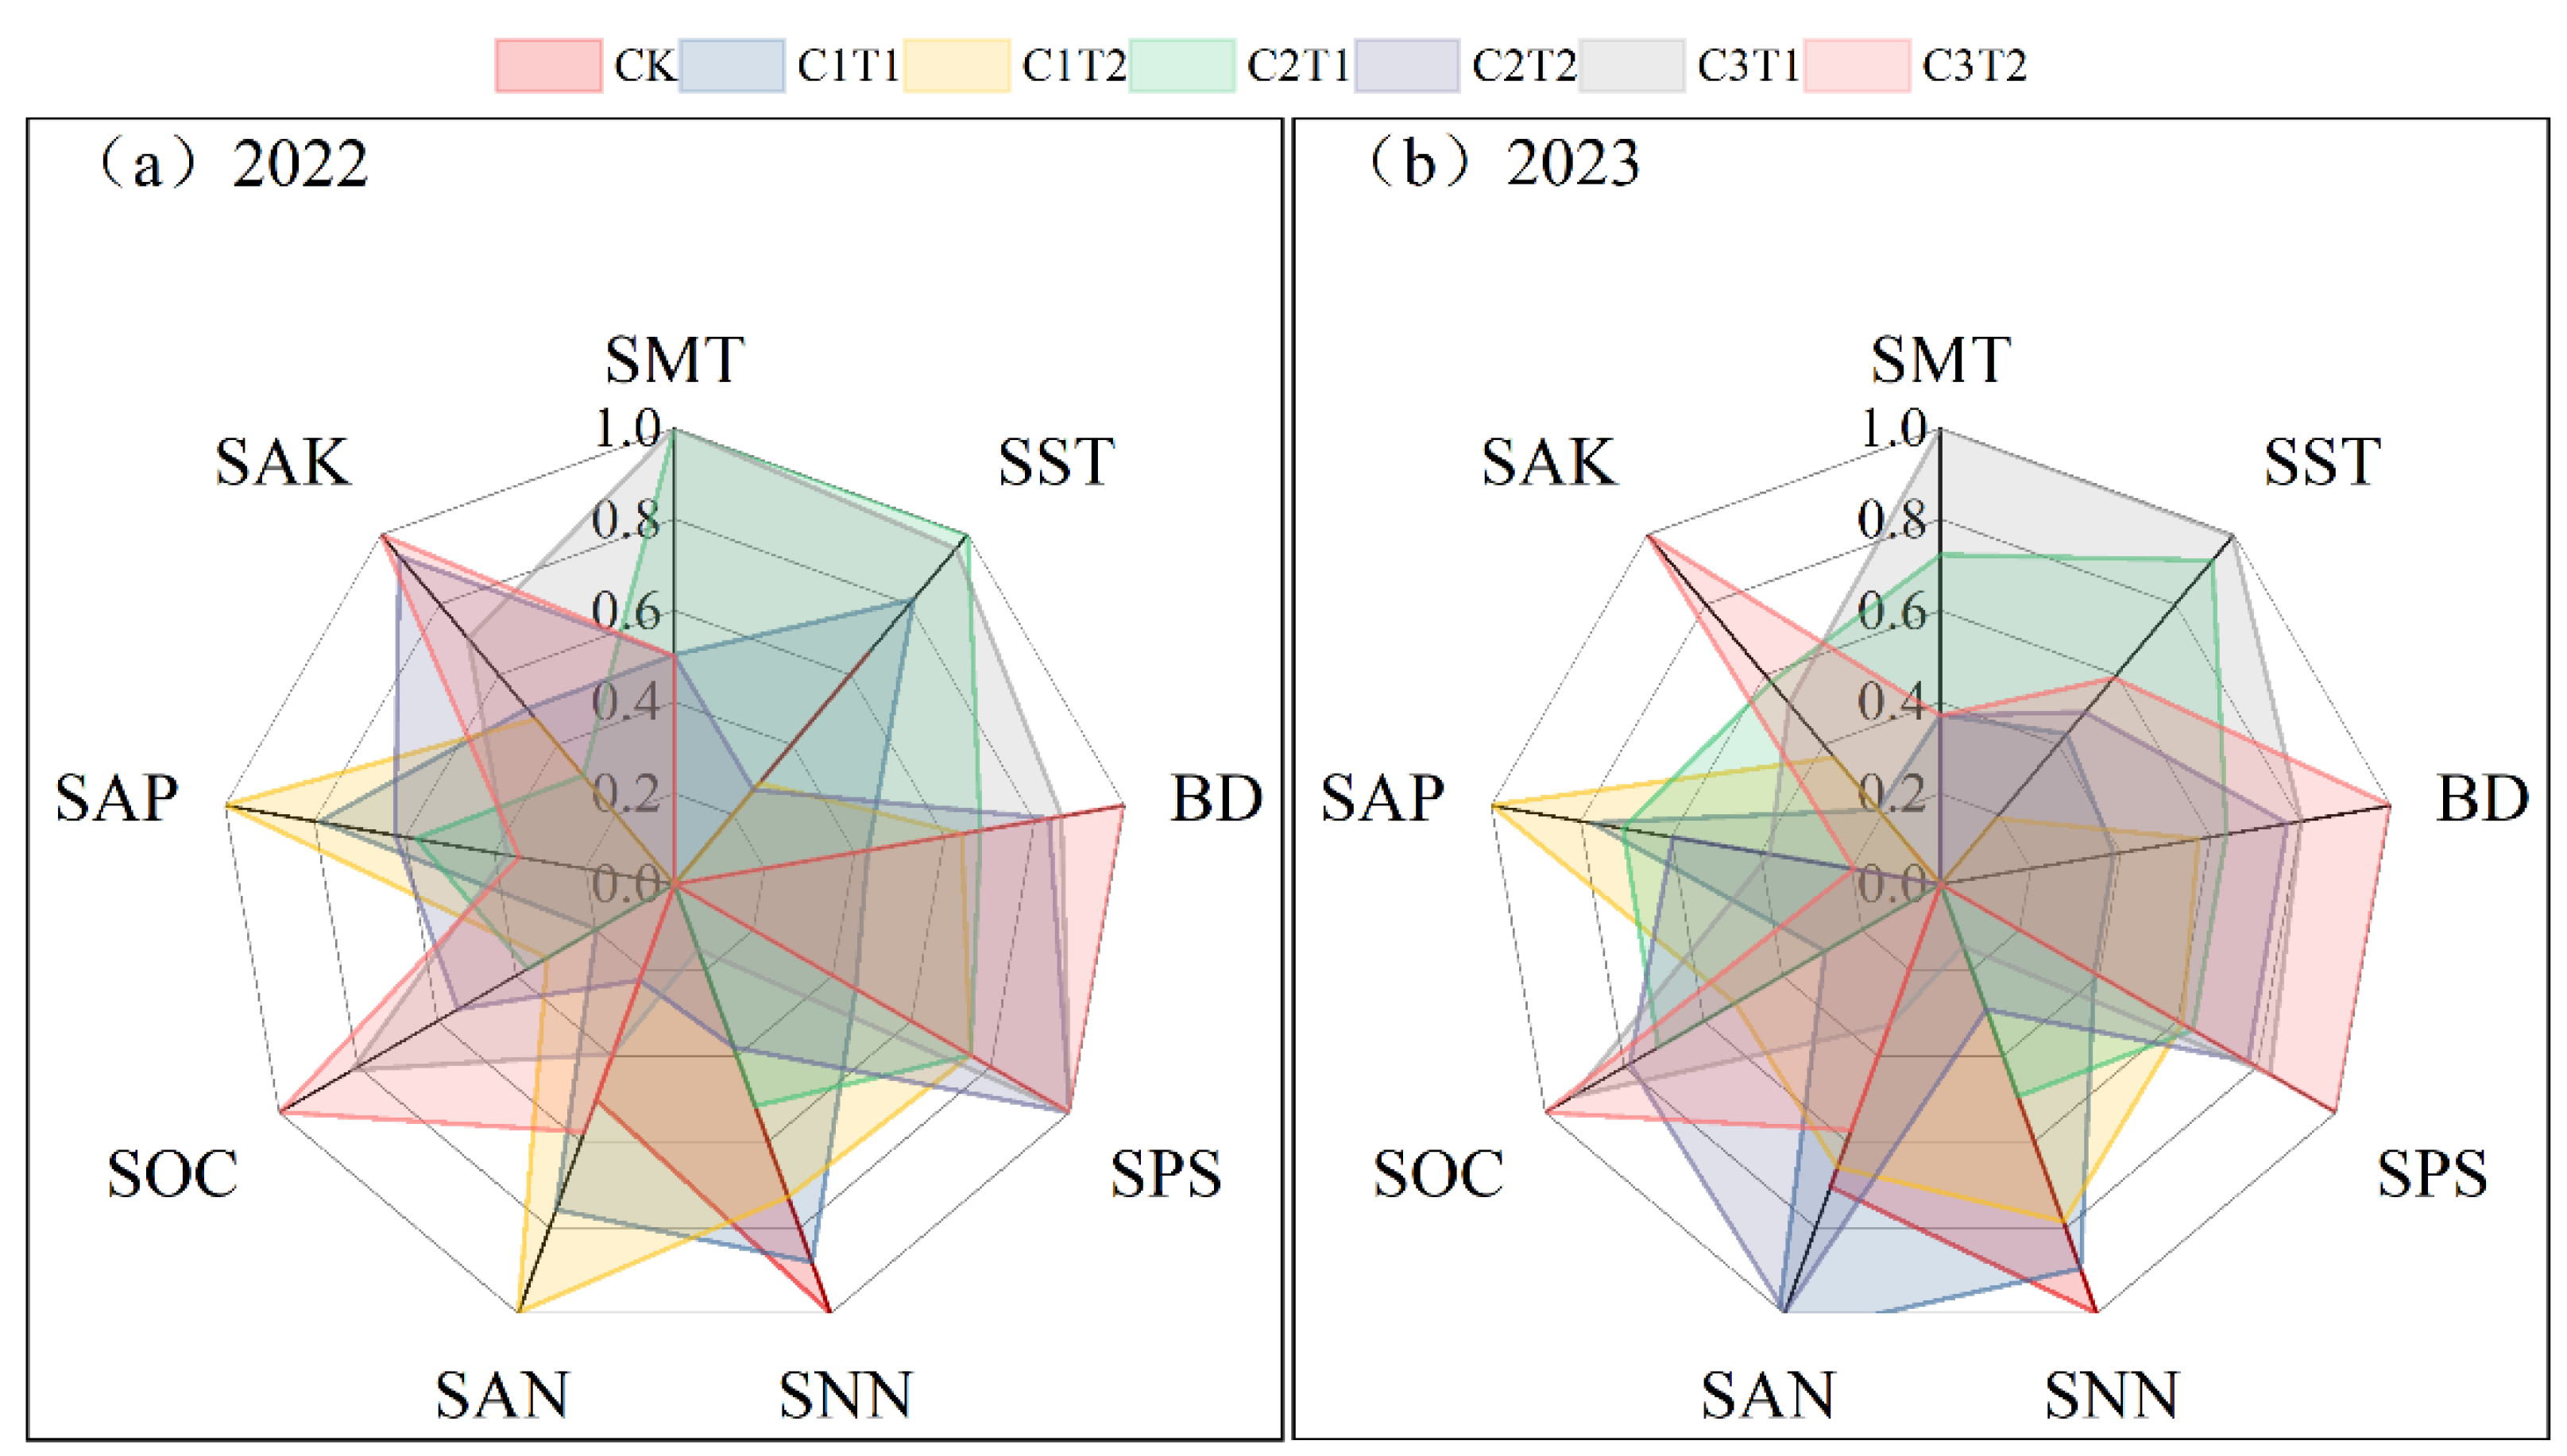
3.2.1. Principal Component Analysis (PCA)

In this study, owing to the similar trends observed in the soil properties between the 0–20 cm and 20–40 cm soil layers under the different treatments, we used the weighted average values of the 0–20 cm and 20–40 cm layers to represent the overall characteristics of the 0–40 cm tillage layer. We selected nine parameters for soil quality assessment, including soil bulk density, porosity, moisture content, salinity, nitrate–nitrogen, ammonium–nitrogen, organic carbon, available phosphorus, and available potassium (Table 8 and Table 9).
After principal component analysis, three principal components (PCs) with eigenvalues greater than those selected for 2022, accounting for a cumulative contribution rate of 78.85% (Table 10). Within PC-1, soil moisture, porosity, and organic carbon were factors with relatively high loadings, with soil moisture having the highest weight (0.912). However, owing to the high correlation between soil moisture and soil porosity, as well as organic carbon (Table 9, r > 0.6), only soil moisture was retained in the MDS. Similarly, in PC-2, electrical conductivity (EC) and soil nitrate–nitrogen were selected, whereas ammonium–nitrogen and available phosphorus were retained in the MDS for PC-3. Overall, the five soil quality indicators retained for 2022 were soil moisture, EC, nitrate–nitrogen, ammonium–nitrogen, and available phosphorus, with weights of 0.525, 0.184, 0.135, 0.133, and 0.023, respectively. In 2023, the MDS retained EC, bulk density, ammonium–nitrogen, and available phosphorus, with weights of 0.652, 0.121, 0.137, and 0.090, respectively.

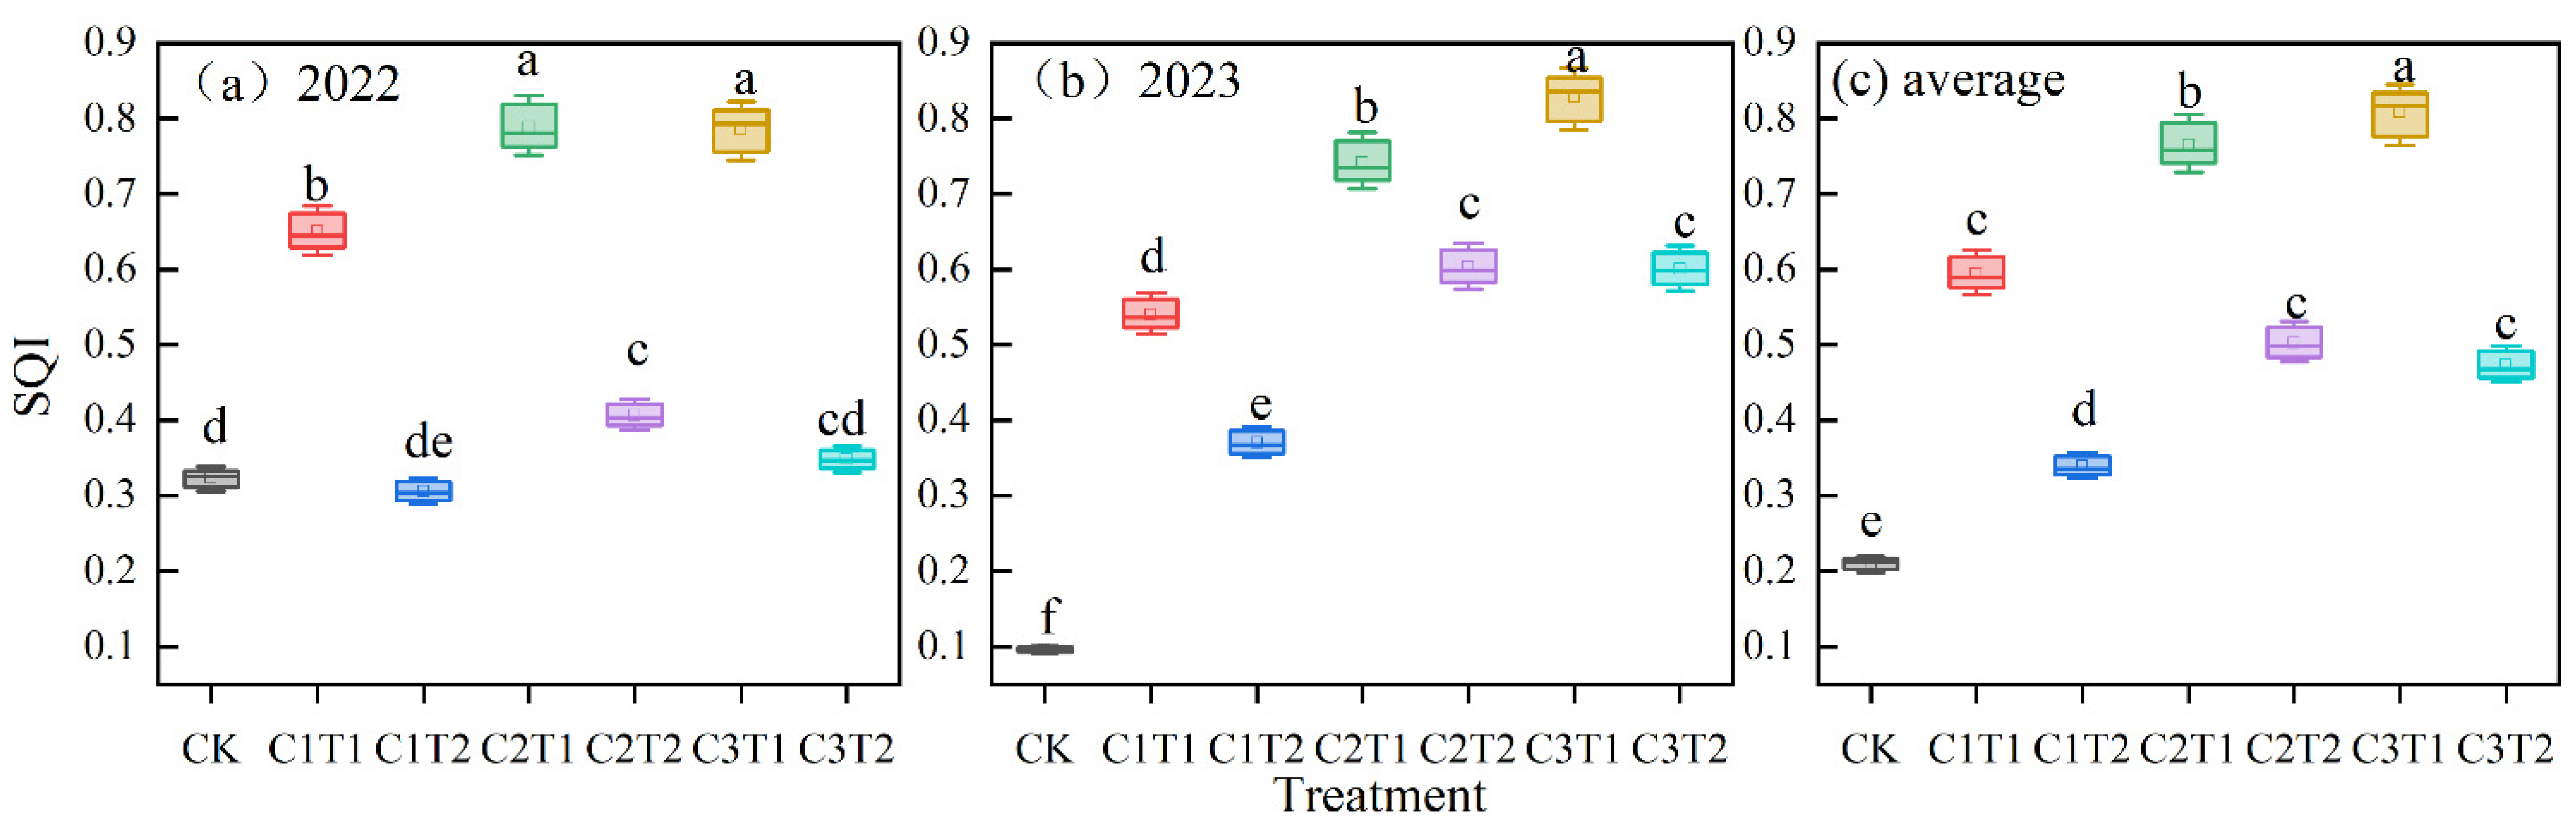
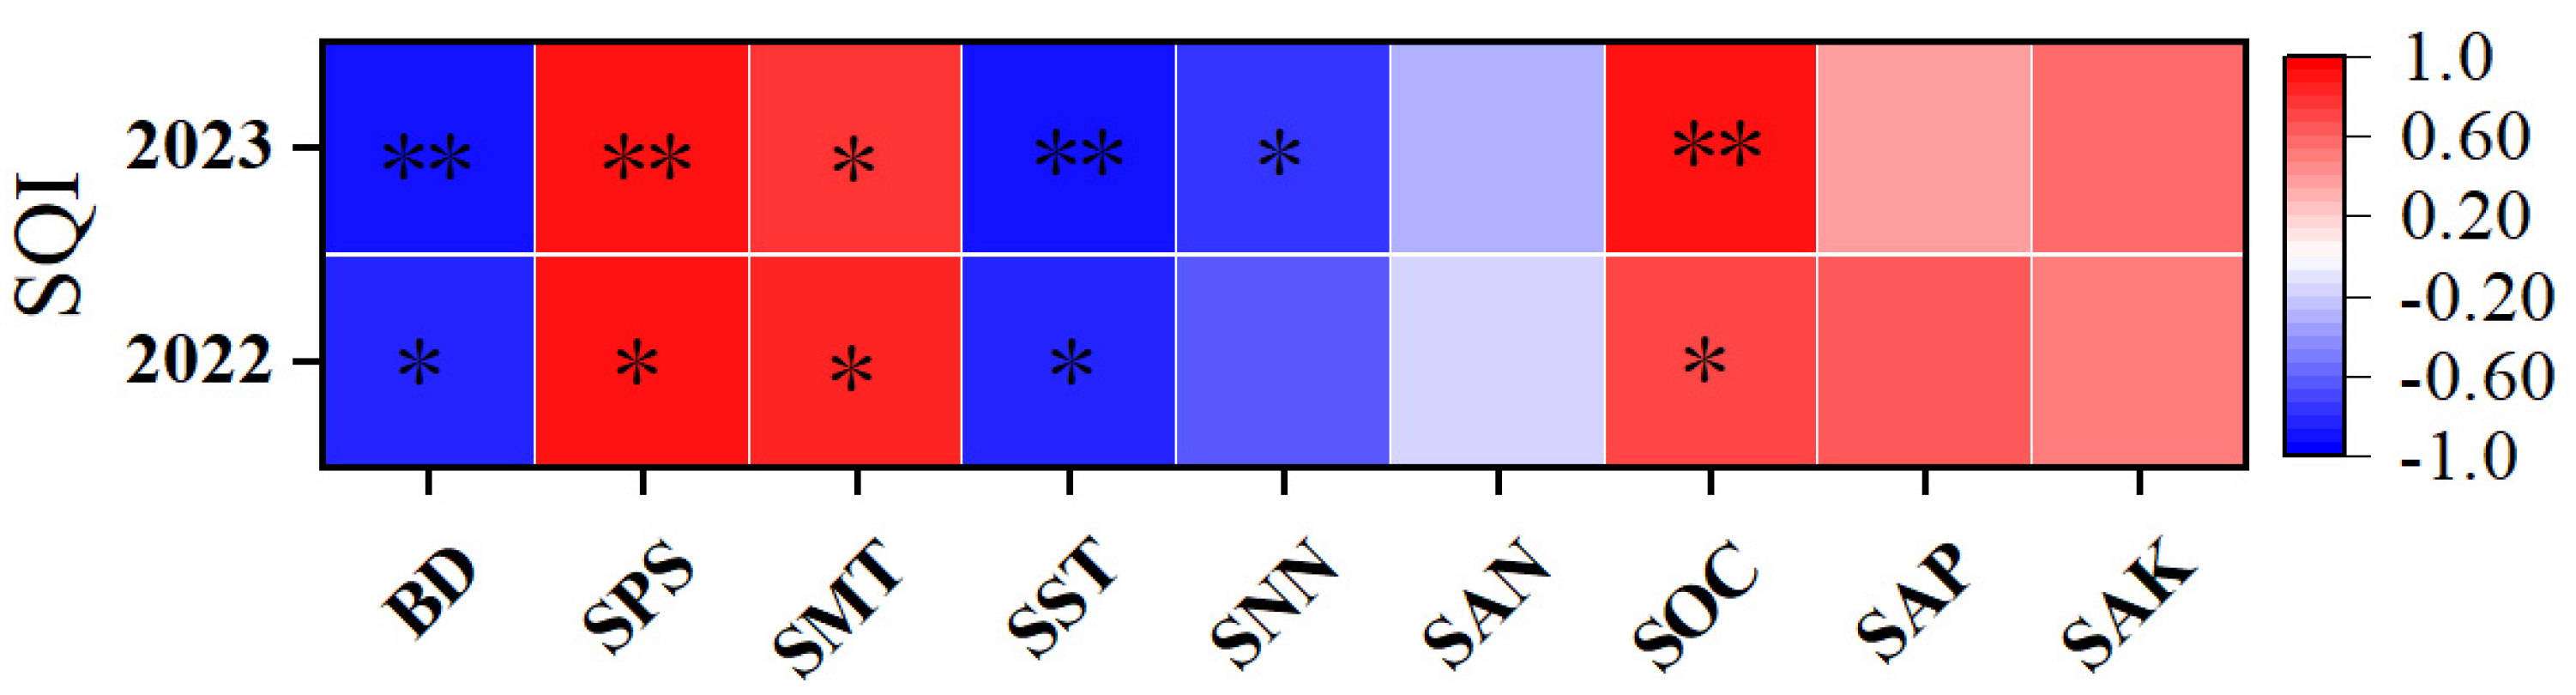
3.2.2. Soil Quality Index (SQI)

The soil quality index (SQI) values are calculated on the basis of the weights of the indicators from the principal component analysis (Table 10), and the scores of the soil indicators (Figure 6) are shown in Figure 7. The SQI values for both 2022 and 2023 range between 0.10 and 0.83. Compared with the CK treatment, the application of biochar significantly increased the SQI values over the two years (2022–2023), increasing from 0.96 to 8.26 times (Figure 7a,b). On average, each treatment increased the SQI values by 1.63 to 3.85 times over the two years compared with those of the control, with treatment C3T1 showing the greatest increase.
Correlation analysis (Figure 8) revealed that from 2022 to 2023, the SQI values were positively correlated with soil porosity, moisture content, and soil organic carbon while negatively correlated with soil bulk density and salinity (p < 0.05). Overall, the improvement in soil physical properties and soil water–salt conditions from 2022 to 2023 directly mediated the increase in the SQI.

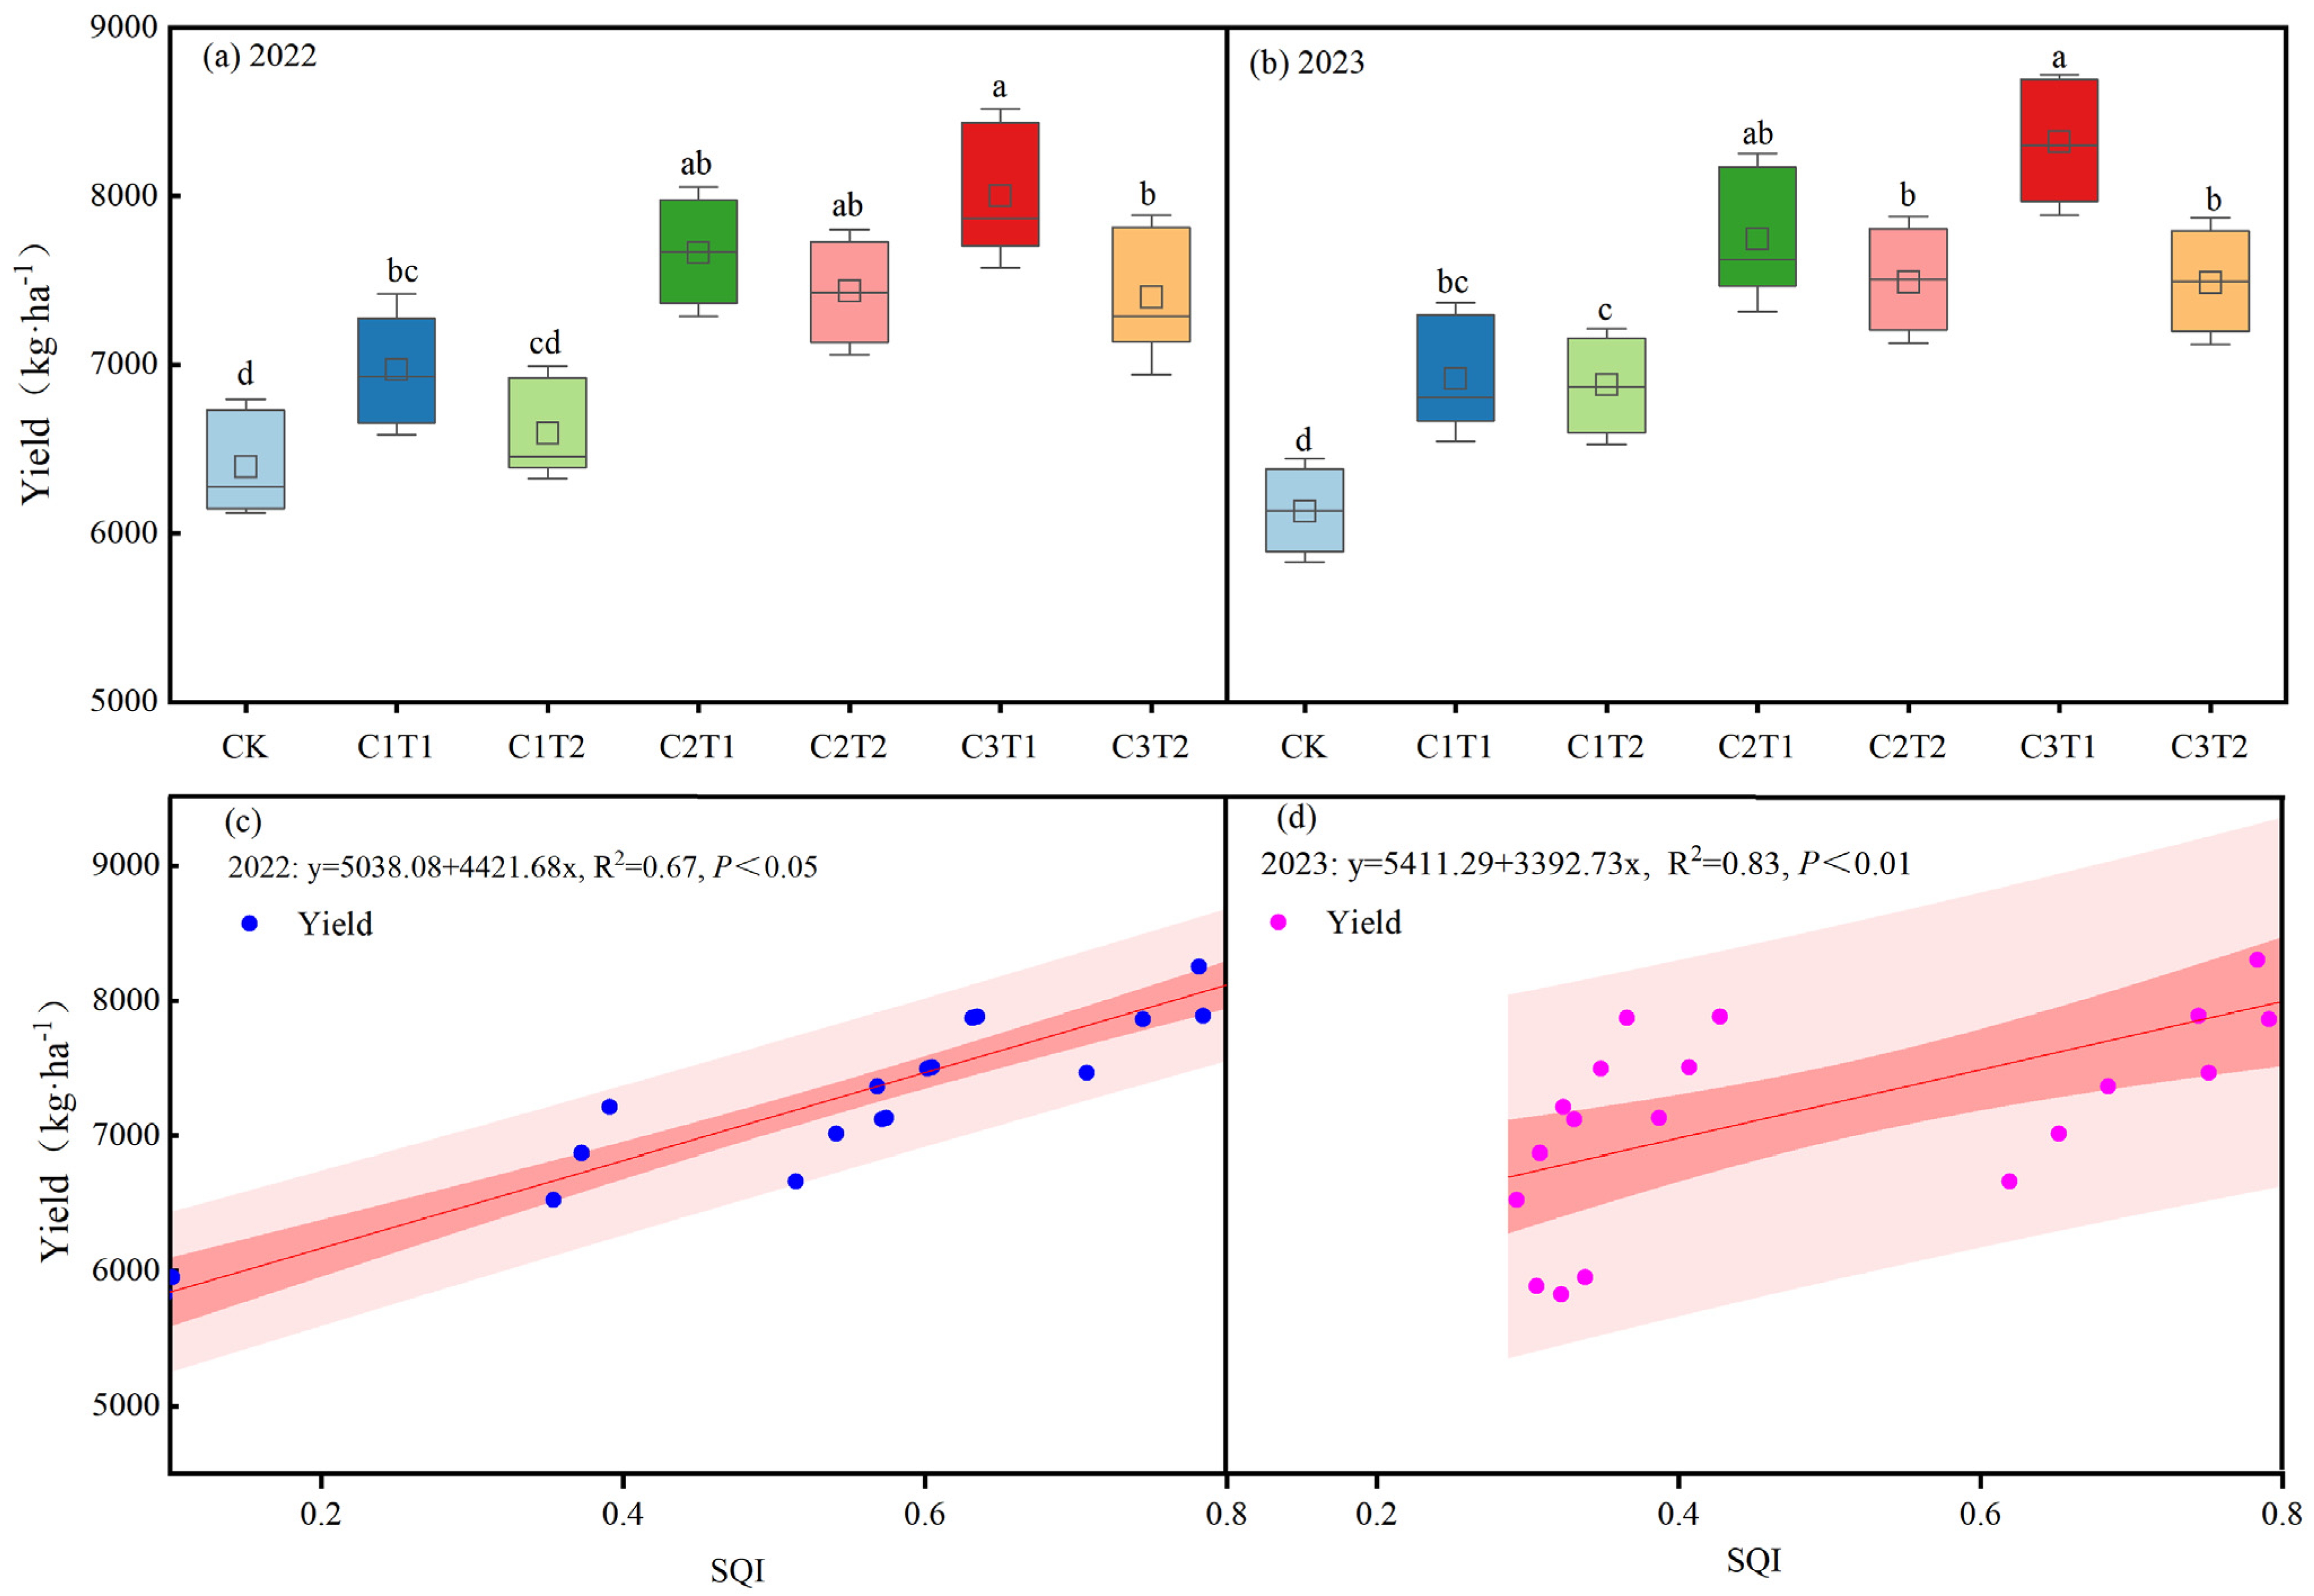
3.3. Corn Yield and Its Relationship with Soil Quality Index

The application of biochar significantly increased the corn yield (Figure 9a,b). In 2022 and 2023, the corn yields under each biochar treatment were 2.84% to 25.32% and 11.97% to 35.31% higher, respectively, than those under the CK treatment, with treatments C2T1 and C3T1, resulting in the highest yields (p < 0.05). Linear regression analysis revealed that the soil quality index (SQI) was significantly positively correlated with corn yield (Figure 9c,d; p < 0.05). The SQI explained 67% and 83% of the variation in corn yield in 2022 and 2023, respectively, and each unit increase in the SQI increased the corn yield by 5038.08 and 5411.29 kg/ha, respectively (Figure 9c,d).

4. Discussion

4.1. Effect of Biochar on Soil Characteristics

4.1.1. Soil Bulk Density and Porosity

Multiple studies have shown that the application of biochar can significantly reduce the bulk density and increase soil porosity [26,27,28]. This study also revealed that higher application rates of biochar can decrease the bulk density in the 0–30 cm soil layer and increase the soil porosity, indicating an improvement in soil aeration with increasing biochar application rates [29]. This is partly due to the high organic matter content in biochar, which can dilute soil mineral components, thereby reducing the soil bulk density [30,31]. Additionally, biochar contains many nanopores and micropores, which can increase the total pore volume in soil [32]. However, some studies have indicated that the application of a large amount of biochar (30 t/ha) can reduce soil porosity [33]. This effect may be attributed to the substantial addition of biochar particles occupying interconnected macropores, thereby decreasing the percentage of connected porosity (%). Furthermore, this study revealed that soil porosity is positively correlated with pyrolysis temperature, whereas soil bulk density is negatively correlated with pyrolysis temperature. This is likely due to the loss of volatile organic molecules at high temperatures, resulting in the formation of well-developed micropores in biochar and contributing to its low weight and density characteristics [34,35]. Furthermore, the study by Blanco-Canquiet et al. [36] indicated that the trends in bulk density and porosity with varying pyrolysis temperatures are not significant. These inconsistent results may be attributed to differences in experimental conditions and biochar characteristics.

4.1.2. Characteristics of Soil Moisture and Salinity Distribution

This study revealed that the soil moisture in each treatment mainly varied within the 0–60 cm depth range. This is primarily because the irrigation depth is typically approximately 60 cm for drip irrigation, which means that each irrigation event affects the soil moisture distribution within the 0–60 cm soil layer. Additionally, in the horizontal direction, the soil moisture content beneath the mulch was significantly greater than that between the mulch layers. This phenomenon can be attributed to the strong evaporation in the Hetao Irrigation District, where bare soil areas between the mulch layers experience significant soil moisture loss. The mulch layer helps reduce soil moisture loss, resulting in the lowest soil moisture content between the mulch layers. This is basically consistent with the findings of Liang et al. [21].
The soil water retention capacity depends on the distribution of soil pores, and biochar can significantly improve the soil pore structure [5,37]. Numerous studies have demonstrated that the application of biochar can effectively improve soil hydraulic properties [36]. For example, biochar application can increase the soil water holding capacity [36]. Similar results were obtained with the application of 10 tons of biochar produced at 500 °C or 700 °C. This may be attributed to the following reasons: (1) biochar produced at moderate pyrolysis temperatures can generate many micropore structures, increasing the number of micropores in the soil, which can accommodate more soil moisture [38]. (2) The specific surface area and pore volume of biochar increase with increasing pyrolysis temperature. Therefore, biochar produced at high temperatures can increase the soil’s water-holding capacity. (3) As the soil texture in this study is loamy sand (fine sandy soil), excessive application of biochar may block soil pores, thereby impeding the infiltration of irrigation water into the soil pores.
In this study, the infiltration depth of subsurface drip irrigation was approximately within the 0–60 cm soil layer. Influenced by soil moisture movement, the vertical distribution of soil salinity primarily occurs within the 0–60 cm soil layer. In the horizontal direction, the arrangement of drip lines determines the distribution of soil salinity, with soil salinity increasing as the distance from the drip lines increases. Particularly in the bare soil areas between the mulch layers, intense evaporation leads to significant water evaporation, resulting in salt accumulation between the mulch layers.
In addition, this study revealed that the application of biochar in 2022 increased soil salinity levels during the early stages of maize growth (the seedling and tillering stages) and that soil salinity increased with increasing biochar application rates and pyrolysis temperatures. This is mainly because the initial salt content of the biochar used in this study is greater than that of the soil, and as the pyrolysis temperature increases, the soluble salt content in the biochar increases while the acidic functional groups decrease, resulting in an increase in the biochar salt content and subsequently increasing the magnitude of soil salinity, similar to results obtained in other studies [21,39]. As the growing season progressed, the soil salinity gradually decreased. This may have occurred because the application of biochar significantly reduced the soil bulk density, increased the soil porosity, and consequently enhanced the soil hydraulic conductivity, which promotes the leaching of salts in the soil with irrigation [9]. Additionally, in the Hetao Irrigation District, large-scale autumn flushing measures are typically carried out to wash out salts. Soil permeability increased with biochar application, and large amounts of salts were washed out by the irrigation water, including those introduced by the biochar, into deeper soil layers, reducing the amount of salt buildup associated with biochar application.
Research indicates that as the pyrolysis temperature increases, the pH of biochar increases, possibly due to the loss of acidic functional groups in the biochar and the formation of Ca, Mg, Na, K oxides, hydroxides, and carbonate minerals [40]. To prevent an increase in pH in saline–alkaline soils, this study adjusted the pH of the biochar produced at three different pyrolysis temperatures to acidic conditions (pH 6.5).

4.1.3. Soil Nutrients

Previous studies have shown that the combined application of biochar and chemical fertilizers can increase soil fertility, thereby improving soil productivity [41]. This study revealed that, compared with the application of nitrogen fertilizer alone, the addition of biochar could increase the soil organic carbon content, as the stable components carried by biochar directly contribute to soil organic matter [42]. The pyrolysis temperature and application rates of biochar are crucial factors influencing its ability to regulate nutrient dynamics in soil, thus determining its suitability for enhancing crop growth and productivity by modulating soil environments [43]. The unstable components of biochar help replenish soil carbon pools in the form of soluble organic matter. Furthermore, under the application of the 10 t and 20 t doses, the soil organic carbon content was highest when biochar was produced at high temperatures (700 °C), indicating its greater potential for carbon sequestration under high-temperature conditions. This is attributed to the lower proportion of unstable carbon in high-temperature biochar than in low-temperature biochar and the longer mean residence time (MRT) due to the greater proportion of aromatic carbon. (It is generally believed that biochar contains an unstable carbon pool, with the MRT representing the average residence time [44].)
Furthermore, the soil NH4+-N content in all the treatments remained relatively low, with no significant differences. This is attributed to the strong nitrification processes in the arid region where the study area is located, resulting in nitrate-N being the predominant form of nitrogen in the soil. The soil NO3-N content decreased with increasing biochar pyrolysis temperature. This occurred because biochar produced at high temperatures has a positive charge and has a relatively large specific surface area and soil porosity, thereby enhancing the adsorption of NO3-N in soil [45]. The availability of phosphorus largely depends on the soil pH and organic matter content. However, in saline–alkali soils, where the pH is high, and the organic matter content is low, the soil phosphorus content is considered a limiting factor for plant growth [46]. This study revealed that the application of biochar increased the soil’s available phosphorus content, indicating that acidified biochar can improve the availability of phosphorus in alkaline soils. Additionally, biochar can serve directly as a phosphorus fertilizer, increasing the effective phosphorus content in saline–alkali soils and thereby increasing phosphorus availability and crop uptake [47]. The study also revealed a decrease in the soil’s available phosphorus with increasing biochar pyrolysis temperature. This is mainly due to the formation of stable aromatic or crystalline insoluble compounds during the pyrolysis process, resulting in a reduced contribution of biochar to the soil’s available phosphorus [48].

4.2. Relationship between Mazie Yield and SQI

Previous meta-analyses have indicated that the application of biochar can significantly increase crop yield, with biochar pyrolysis temperature having a high weight in determining its impact on yield. Compared with biochar produced at higher temperatures (≤400 °C and 401–500 °C), biochar produced at relatively low pyrolysis temperatures has been found to have a more favorable effect on yield [49]. This occurred because biochar produced at low temperatures is more conducive to nitrogen fixation in the soil [50], with fixed nitrogen gradually released into the rhizosphere soil and becoming available for plant uptake [51]. Additionally, biochar produced at low temperatures can increase the effectiveness of soil phosphorus, whereas biochar produced at high temperatures may lead to the formation of calcium phosphate precipitates, which are not readily available for plant uptake [46]. However, research has also suggested that biochar produced at high pyrolysis temperatures (550 °C and above) is a viable amendment for coastal saline–alkali soils, as it results in low toxicity of biochar functional groups to soil biota, thus improving crop growth better than low-temperature biochar (pyrolyzed below 550 °C) [52]. In this study, the soil salinity level was relatively high, and the soil physicochemical properties were poor, resulting in lower crop productivity. The biochar produced at high pyrolysis temperatures not only reduced the soil bulk density and increased the soil porosity, thus decreasing the soil salinity and enhancing the soil water retention capacity, but also increased the soil organic carbon content, thereby increasing the crop yield enhancement. Furthermore, although high-temperature biochar in this study reduced the soil available phosphorus and potassium contents, the baseline levels of soil phosphorus and potassium in the study area were relatively high, mitigating any significant impact on crop yield. Additionally, this study revealed that excessive application of biochar is not conducive to increasing maize yield and increases costs. When the biochar application rate was 10 t/ha, the crop yield benefits were maximized. Therefore, selecting an appropriate biochar pyrolysis temperature and application rate can avoid increased economic costs and promote the commercial production and application of biochar in agriculture.
Previous studies have indicated that the application of biochar improves soil quality, thereby increasing maize yield [52]. In this study, among the different biochar treatments, biochar pyrolyzed at moderate to high temperatures (500 °C and 700 °C) presented similar soil quality index (SQI) values and maize yields under low application rates (10 t), surpassing those of the other biochar treatments. Additionally, there was a significant positive correlation between the SQI values and maize yield, indicating that soil quality significantly influences maize yield [25]. The SQI in this study explained 67% to 83% of the variation in maize yield among the different treatments. However, some studies have shown that the SQI explains only 28% of the yield variation [53], suggesting that soil quality has a more pronounced effect on maize yield in saline–alkali soils.
Compared with that in 2022, the impact of the soil quality index (SQI) on maize yield tended to increase in 2023 (Figure 9d), indicating that as the time since biochar application progressed, the SQI led to a greater increase in maize yield. This is likely because the growth and development of maize are sensitive to soil salinity [54], and the trend of soil salinity after biochar application follows an initial increase followed by a decrease over time, resulting in a relatively small impact of the SQI on maize yield in the first year of biochar application. Therefore, the use of biochar to reduce soil salinity in the root zone is crucial for improving soil quality [55].
Previous studies have shown that straw biochar +70% regular chemical fertilizer increases the contents of available phosphorus (P) and potassium (K) in the soil, significantly improving soil quality [56]. Other studies have shown that an unsuitable ratio of biochar to nitrogen fertilizer can reduce soil microbial biomass carbon and nitrogen [57]. These findings indicate that there is an optimal ratio of biochar to chemical fertilizers that effectively enhances soil quality. This study investigated only the effects of different biochar pyrolysis temperatures and application rates on soil quality under conventional nitrogen application conditions. For the soil conditions in the Hetao irrigation area, adjusting the ratio of biochar to nitrogen fertilizer should be an effective measure to ensure soil fertility and promote crop economic benefits. Moreover, this study used only some soil physical and chemical parameters to assess the SQI, and further research needs to consider other physical parameters (aggregates and mean weight diameter) and biological parameters (microbial community abundance) in the MDS to evaluate the SQI. Additionally, this study only conducted a 2-year experiment, and further research is needed to optimize the beneficial effects of biochar on saline–alkali soils by studying the effective lifespan of biochar at different pyrolysis temperatures.

5. Conclusions

(1)
Biochar produced at medium and high pyrolysis temperatures (500 and 700 °C) effectively alleviated soil compaction, improved the soil water and salt conditions, increased the soil organic carbon content, and increased the crop yield at low application rates (10 t/ha). However, further increasing the application rate of biochar resulted in increased soil salinity and decreased soil water retention capacity, leading to reduced crop yield.
(2)
Compared with the control without biochar application, different pyrolysis temperature biochar treatments significantly increased the soil quality index (SQI), with the greatest increase observed with biochar produced at high pyrolysis temperature (700 °C) under low application rates (10 t/ha). This enhancement is primarily attributed to improvements in soil physical properties and soil water and salt conditions.
(3)
There was a strong correlation between the soil quality index (SQI) and maize yield, which was attributed to the reduction in soil salinity, increased soil moisture, and elevated soil organic carbon content under the biochar treatments. These findings indicate that biochar-induced improvements in soil quality contribute to the increase in maize yield.
The findings of this study suggest that in arid saline–alkali soils of China, the application of high-temperature (700 °C) biochar at a low dosage (10 t/ha) is a suitable strategy for simultaneously improving soil quality and crop yield. This should provide a broad perspective on the use of biochar in agriculture and its environmental benefits and crop improvement.

Author Contributions

H.Z. and J.G. designed the research and prepared the manuscript. The data were prepared by H.Z., Y.W. and H.L.; J.W. and J.G. helped revise the manuscript. The manuscript was checked by J.W., H.L. and Y.W. All authors have read and agreed to the published version of the manuscript.

Funding

This work was supported by the Natural Science Foundation of Inner Mongolia (2024MS05025), the Yinshanbeilu Grassland Eco-hydrology National Observation and Research Station, China Institute of Water Resources and Hydropower Research (MK2023J03).

Data Availability Statement

The data presented in this study are available on request from the corresponding author.

Conflicts of Interest

The authors declare no conflict of interest.

References

  1. Cho, K.H.; Beon, M.S.; Jeong, J.C. Dynamics of soil salinity and vegetation in areclaimed area in Saemangeum, Republic of Korea. Geoderma 2018, 321, 42–51. [Google Scholar] [CrossRef]
  2. Sun, J.; Yang, R.; Li, W.; Pan, Y.; Zheng, M.; Zhang, Z. Effect of biochar amendment on water infiltration in a coastal saline soil. J. Soil. Sediment. 2018, 18, 3271–3279. [Google Scholar] [CrossRef]
  3. Zhou, R.; Li, Y.; Wu, J.; Gao, M.; Wu, X.; Bi, X. Need to link river management with estuarine wetland conservation: A case study in the Yellow River Delta, China. Ocean Coast. Manag. 2017, 146, 43–49. [Google Scholar] [CrossRef]
  4. Nouri, H.; Chavoshi Borujeni, S.; Nirola, R.; Hassanli, A.; Beecham, S.; Alaghmand, S.; Saint, C.; Mulcahy, D. Application of green remediation on soil salinity treatment: A review on halophytoremediation. Process Saf. Environ. Prot. 2017, 107, 94–107. [Google Scholar] [CrossRef]
  5. Amini, S.; Ghadiri, H.; Chen, C.; Marschner, P. Salt-affected soils, reclamation, carbon dynamics, and biochar: A review. J. Soil Sediment. 2016, 16, 939–953. [Google Scholar] [CrossRef]
  6. Zheng, H.; Wang, X.; Chen, L.; Wang, Z.; Xia, Y.; Zhang, Y.; Wang, H.; Luo, X.X.; Xing, B.S. Enhanced growth of halophyte plants in biochar-amended coastal soil: Roles of nutrient availability and rhizosphere microbial modulation. Plant Cell Environ. 2018, 41, 517–532. [Google Scholar] [CrossRef]
  7. Fidel, R.B.; Laird, D.A.; Thompson, M.L.; Lawrinenko, M. Characterization and quantification of biochar alkalinity. Chemosphere 2017, 167, 367–373. [Google Scholar] [CrossRef] [PubMed]
  8. Yuan, J.H.; Xu, R.K.; Zhang, H. The forms of alkalis in the biochar produced from crop residues at different temperatures. Bioresour. Technol. 2011, 102, 3488–3497. [Google Scholar] [CrossRef] [PubMed]
  9. Zhang, J.H.; Bai, Z.G.; Huang, J.; Hussain, S.; Zhao, F.T.; Zhu, C.J.; Zhu, L.F.; Cao, X.C.; Jin, Q.Y. Biochar alleviated the salt stress of induced saline paddy soil and improved the biochemical characteristics of rice seedlings differing in salt tolerance. Soil Tillage Res. 2019, 195, 104372. [Google Scholar] [CrossRef]
  10. Zhang, J.; Liu, J.; Liu, R. Effects of pyrolysis temperature and heating time on biochar obtained from the pyrolysis of straw and lignosulfonate. Bioresour. Technol. 2015, 176, 288–291. [Google Scholar] [CrossRef]
  11. Gell, K.; van Groenigen, J.W.; Cayuela, M.L. Residues of bioenergy production chains as soil amendments: Immediate and temporal phytotoxicity. J. Hazard. Mater. 2011, 186, 2017–2025. [Google Scholar] [CrossRef]
  12. Zhao, L.; Guan, H.; Wang, R.; Wang, H.; Xu, W. Effects of tobacco stem-derived biochar on soil properties and bacterial community structure under continuous cropping of bletilla striata. J. Soil Sci. Plant Nutr. 2021, 21, 1318–1328. [Google Scholar] [CrossRef]
  13. Zhao, W.; Zhou, Q.; Tian, Z.; Cui, Y.; Wang, H. Apply biochar to ameliorate soda saline-alkali land, improve soil function and increase corn nutrient availability in the songnen plain. Sci. Total Environ. 2020, 722, 137428. [Google Scholar] [CrossRef] [PubMed]
  14. Fu, Q.; Zhao, H.; Li, T.; Hou, R.; Liu, D.; Ji, Y.; Zhou, Z.; Yang, L. Effects of biochar addition on soil hydraulic properties before and after freezing-thawing. Catena 2019, 176, 112–124. [Google Scholar] [CrossRef]
  15. Biederman, L.A.; Harpole, W.S. Biochar and its effects on plant productivity and nutrient cycling: A meta-analysis. GCB Bioenergy 2013, 5, 202–214. [Google Scholar] [CrossRef]
  16. Li, C.J.; Xiong, Y.X.; Qu, Z.Y.; Xu, X.; Huang, Q.Z.; Huang, G.H. Impact of biochar addition on soil properties and water-fertilizer productivity of tomato in semi-arid region of Inner Mongolia, China. Geoderma 2018, 331, 100–108. [Google Scholar] [CrossRef]
  17. Wang, L.; Ok, Y.S.; Tsang, D.C.; Alessi, D.S.; Rinklebe, J.; Wang, H.; Hou, D. New trends in biochar pyrolysis and modification strategies: Feedstock, pyrolysis conditions, sustainability concerns and implications for soil amendment. Soil Use Manag. 2020, 36, 358–386. [Google Scholar] [CrossRef]
  18. Wu, Y.; Wang, X.; Zhang, L.; Zheng, Y.; Liu, X.; Zhang, Y. The critical role of biochar to mitigate the adverse impacts of drought and salinity stress in plants. Front. Recent Dev. Plant Sci. 2023, 14, 1163451. [Google Scholar] [CrossRef]
  19. Soil Survey Staff. Keys to Soil Taxonomy; United States Department of Agriculture: New York, NY, USA, 2014; pp. 65–69. [Google Scholar]
  20. Bao, S.D. Soil and Agricultural Chemistry Analysis; China Agriculture Press: Beijing, China, 2000; pp. 151–166. [Google Scholar]
  21. Liang, J.; Li, Y.; Si, B.; Wang, Y.; Biswas, A. Optimizing biochar application to improve soil physical and hydraulic properties in saline-alkali soils. Sci. Total Environ. 2021, 771, 144802. [Google Scholar] [CrossRef]
  22. Zhou, Y.; Berruti, F.; Greenhalf, C.; Tian, X.; Henry, H.A. Increased retention of soil nitrogen over winter by biochar application: Implications of biochar pyrolysis temperature for plant nitrogen availability. Agric. Environ. 2017, 236, 61–68. [Google Scholar] [CrossRef]
  23. Murphy, J.; Riley, J.P. A modified single solution method for the determination of phosphate in natural waters. Anal. Chim. Acta 1962, 27, 31–36. [Google Scholar] [CrossRef]
  24. Shang, Q.; Ling, N.; Feng, X.; Yang, X.; Wu, P.; Zou, J.; Shen, Q.; Guo, S. Soil fertility and its significance to crop productivity and sustainability in typical agroecosystem: A summary of long-term fertilizer experiments in China. Plant Soil 2014, 381, 13–23. [Google Scholar] [CrossRef]
  25. Xu, J.; Han, H.F.; Ning, T.Y.; Li, Z.J.; Lal, R. Long-term effects of tillage and straw management on soil organic carbon, crop yield, and yield stability in a wheat-maize system. Field Crop. Res. 2019, 233, 33–40. [Google Scholar] [CrossRef]
  26. He, K.; He, G.; Wang, C.; Zhang, H.; Xu, Y.; Wang, S.; Hu, R. Biochar amendment ameliorates soil properties and promotes Miscanthus growth in a coastal saline-alkali soil. Appl. Soil Ecol. 2020, 155, 103674. [Google Scholar] [CrossRef]
  27. Koide, R.T.; Nguyen, B.T.; Skinner, R.H.; Dell, C.J.; Peoples, M.S.; Adler, P.R. Biochar amendment of soil improves resilience to climate change. GCB. Bioenergy 2015, 7, 1084–1091. [Google Scholar] [CrossRef]
  28. Trifunovic, B.; Gonzales, H.B.; Ravi, S.; Sharratt, B.S.; Mohanty, S.K. Dynamic effects of biochar concentration and particle size on hydraulic properties of sand. Land Degrad. Dev. 2018, 29, 884–893. [Google Scholar] [CrossRef]
  29. Kumari, K.; Swain, A.A.; Kumar, M.; Bauddh, K. Utilization of Eichhornia crassipes biomass for production of biochar and its feasibility in agroecosystems: A review. Environ Sustain. 2021, 42, 285–297. [Google Scholar] [CrossRef]
  30. Shepherd, M.A.; Harrison, R.; Webb, J. Managing soil organic matter–implications for soil structure on organic farms. Soil Use Manag. 2002, 18, 284–292. [Google Scholar] [CrossRef]
  31. Verheijen, F.G.; Zhuravel, A.; Silva, F.C.; Amaro, A.; Ben-Hur, M.; Keizer, J.J. The influence of biochar particle size and concentration on bulk density and maximum water holding capacity of sandy vs sandy loam soil in a column experiment. Geoderma 2019, 347, 194–202. [Google Scholar] [CrossRef]
  32. Omondi, M.O.; Xia, X.; Nahayo, A.; Liu, X.; Korai, P.K.; Pan, G. Quantification of biochar effects on soil hydrological properties using meta-analysis of literature data. Geoderma 2016, 274, 28–34. [Google Scholar] [CrossRef]
  33. An, N.; Zhang, L.; Liu, Y.; Shen, S.; Li, N.; Wu, Z.; Han, X. Biochar application with reduced chemical fertilizers improves soil pore structure and rice productivity. Chemosphere 2022, 298, 134304. [Google Scholar] [CrossRef] [PubMed]
  34. Saha, R.; Galagedara, L.; Thomas, R.; Nadeem, M.; Hawboldt, K. Investigating the influence of biochar amendment on the physicochemical properties of podzolic soil. Agriculture 2020, 10, 471. [Google Scholar] [CrossRef]
  35. Toková, L.; Igaz, D.; Horák, J.; Aydin, E. Effect of biochar application and re-Application on soil bulk density, porosity, saturated hydraulic conductivity, water content and soil water availability in a silty loam haplic luvisol. Agronomy 2020, 10, 1005. [Google Scholar] [CrossRef]
  36. Blanco-Canqui, H. Biochar and soil physical properties. Soil Sci. Soc. Am. J. 2017, 81, 687–711. [Google Scholar]
  37. Kim, H.S.; Kim, K.R.; Yang, J.E.; Ok, Y.S.; Owens, G.; Nehls, T. Effect of biochar on reclaimed tidal land soil properties and maize (Zea mays L.) response. Chemosphere 2016, 142, 153–159. [Google Scholar] [CrossRef] [PubMed]
  38. Zhang, X.; Zhang, P.; Yuan, X.; Li, Y.; Han, L. Effect of pyrolysis temperature and correlation analysis on the yield and physicochemical properties of crop residue biochar. Bioresour. Technol. 2020, 296, 122318. [Google Scholar] [CrossRef] [PubMed]
  39. Kloss, S.; Zehetner, F.; Dellantonio, A.; Hamid, R.; Ottner, F.; Liedtke, V.; Schwanninger, M. Characterization of slow pyrolysis biochars: Effects of feedstocks and pyrolysis temperature on biochar properties. J. Environ. Qual. 2012, 41, 990. [Google Scholar] [CrossRef] [PubMed]
  40. Novak, J.M.; Lima, I.; Xing, B.; Gaskin, J.W.; Steiner, C.; Ahmedna, M. Characterization of designer biochar produced at different temperatures and their effects on a loamy sand. Ann. Environ. Sci. 2009, 3, 195–206. [Google Scholar]
  41. Wu, J.; Jin, L.; Wang, N.; Wei, D.; Pang, M.; Li, D.; Wang, L. Effects of combined application of chemical fertilizer and biochar on soil physio-biochemical properties and maize yield. Agriculture 2023, 13, 1200. [Google Scholar] [CrossRef]
  42. Plaza, C.; Giannetta, B.; Fernández, J.M.; López-de-Sá, E.G.; Polo, A.; Gascó, G. Response of different soil organic matter pools to biochar and organic fertilizers. Agric. Environ. 2016, 225, 150–159. [Google Scholar] [CrossRef]
  43. Zhao, B.; O’Connor, D.; Zhang, J.; Peng, T.; Shen, Z.; Tsang, D.C.; Hou, D. Effect of pyrolysis temperature, heating rate, and residence time on rapeseed stem derived biochar. J. Cleaner Prod. 2018, 174, 977–987. [Google Scholar] [CrossRef]
  44. Singh, B.P.; Cowie, A.L.; Smernik, R.J. Biochar carbon stability in a clayey soil as a function of feedstock and pyrolysis temperature. Environ. Sci Technol. 2012, 46, 11770–11778. [Google Scholar] [CrossRef] [PubMed]
  45. He, Z.; Wang, C.; Cao, H.; Liang, J.; Pei, S.; Li, Z. Nitrate absorption and desorption by biochar. Agronomy 2023, 13, 2440. [Google Scholar] [CrossRef]
  46. Elgharably, A.G. Nutrient Availability and Wheat Growth as Affected by Plant Residues and Inorganic Fertilizers in Saline Soils. Ph.D. Dissertation, The University of Adelaide, Adelaide, Australia, 2008; pp. 245–248. [Google Scholar]
  47. Lakitan, B.; Alberto, A.; Lindiana, L.; Kartika, K.; Herlinda, S.; Kurnianingsih, A. The benefits of biochar on rice growth and yield in tropical riparian wetland, South Sumatra, Indonesia. Chiang Mai Univ. J. Nat. Sci. 2018, 17, 111–126. [Google Scholar] [CrossRef]
  48. Uchimiya, M.; Hiradate, S.; Antal, M.J. Dissolved phosphorus speciation of flash carbonization, slow pyrolysis, and fast pyrolysis biochars. ACS Sustain. Chem. Eng. 2015, 3, 1642–1649. [Google Scholar] [CrossRef]
  49. Ye, L.; Camps-Arbestain, M.; Shen, Q.; Lehmann, J.; Singh, B.; Sabir, M. Biochar effects on crop yields with and without fertiliser: A meta-analysis of field studies using separate controls. Soil Use Manag. 2020, 36, 2–18. [Google Scholar] [CrossRef]
  50. Nguyen, T.T.N.; Xu, C.Y.; Tahmasbian, I.; Che, R.; Xu, Z.; Zhou, X. Effects of biochar on soil available inorganic nitrogen: A review and meta-analysis. Geoderma 2017, 288, 79–96. [Google Scholar] [CrossRef]
  51. Taghizadeh-Toosi, A.; Clough, T.J.; Sherlock, R.R.; Condron, L.M. Biochar adsorbed ammonia is bioavailable. Plant Soil 2012, 350, 57–69. [Google Scholar] [CrossRef]
  52. Tang, J.; Zhang, S.; Zhang, X.; Chen, J.; Zhang, Q. Effects of pyrolysis temperature on soil-plant-microbe responses to solidago canadensis l.-derived biochar in coastal saline-alkali soil. Sci. Total Environ. 2020, 731, 138938. [Google Scholar] [CrossRef]
  53. Tian, K.; Zhang, B.R.; Zhang, H.D.; Huang, B.; Darilek, J.L.; Zhao, Y.C.; Yang, J.S. Evaluation of soil quality in major grain-producing region of the North China Plain: Integrating minimum data set and established critical limits. Ecol. Indicat. 2020, 117, 106613. [Google Scholar] [CrossRef]
  54. Ye, H.; Roorkiwal, M.; Valliyodan, B.; Zhou, L.; Chen, P.; Varshney, R.K.; Nguyen, H.T. Genetic diversity of root system architecture in response to drought stress in grain legumes. J. Exp. Bot. 2018, 69, 3267–3277. [Google Scholar] [CrossRef] [PubMed]
  55. Chang, F.D.; Zhang, H.Y.; Song, J.S.; Yu, R.; Zhang, X.; Lia, H.R.; Wang, J. Once-middle amount of straw interlayer enhances saline soil quality and sunflower yield in semi-arid regions of China: Evidence from a four-year experiment. J. Environ. Res. Manag. 2023, 334, 118530. [Google Scholar] [CrossRef] [PubMed]
  56. He, L.L.; Zhong, Z.K.; Yang, H.M. Effects on soil quality of biochar and straw amendment in conjunction with chemical fertilizers. Journal of Integrative. Agriculture 2017, 16, 704–712. [Google Scholar]
  57. Durenkamp, M.; Luo, Y.; Brookes, P.C. Impact of black carbon addition to soil on the determination of soil microbial biomass by fumigation extraction. Soil Biol. Biochem. 2010, 42, 2026–2029. [Google Scholar] [CrossRef]
Figure 1. Daily air temperature (a), precipitation (b), wind speed (c), and humidity (d) from 2022 to 2023.
Agronomy 14 01529 g001
Figure 2. Geographical location of the experimental area and example picture of the traditional maize system, and sampling sites (from A to B).
Agronomy 14 01529 g002
Figure 3. Effects of biochar application on soil bulk density and porosity in 2022 and 2023. Different lowercase letters represent significant differences among all the treatments at the 0.05 level. CK = control; C1 = biochar produced at 300 °C; C2 = biochar produced at 500 °C; C3 = biochar produced at 700 °C; T1 = 10 t biochar application; T2 = 20 t biochar application.
Agronomy 14 01529 g003
Figure 4. Effects of biochar application on the two-dimensional distribution of soil water at different growth stages of maize in 2022 and 2023. CK = control; C1 = biochar produced at 300 °C; C2 = biochar produced at 500 °C; C3 = biochar produced at 700 °C; T1 = 10 t biochar application; T2 = 20 t biochar application.
Agronomy 14 01529 g004
Figure 5. Effects of biochar application on the two-dimensional distribution of soil salt at different growth stages of maize in 2022 and 2023. CK = control; C1 = biochar produced at 300 °C; C2 = biochar produced at 500 °C; C3 = biochar produced at 700 °C; T1 = 10 t biochar application; T2 = 20 t biochar application.
Agronomy 14 01529 g005aAgronomy 14 01529 g005b
Figure 6. Radar graph for the soil indicator scores under different treatments from 2022 to 2023. BD, bulk density; SPS, soil porosity; SMT, soil moisture; SST, soil salt; SNN, soil nitrate–nitrogen; SAN, soil ammonium–nitrogen; SOC, soil organic carbon; SAP, soil available P; SAK, soil available K. CK = control; C1 = biochar produced at 300 °C; C2 = biochar produced at 500 °C; C3 = biochar produced at 700 °C; T1 = 10 t biochar application; T2 = 20 t biochar application.
Agronomy 14 01529 g006
Figure 7. Impacts of biochar application on the soil quality index (SQI) from 2022 (a) to 2023 (b) and on average (c). The values are the means ± standard errors (n = 3). Lowercase letters indicate significant differences at p < 0.05. The solid line and square frame correspond to the median and mean values, respectively. CK = control; C1 = biochar produced at 300 °C; C2 = biochar produced at 500 °C; C3 = biochar produced at 700 °C; T1 = 10 t biochar application; T2 = 20 t biochar application.
Agronomy 14 01529 g007
Figure 8. Pearson correlation analysis of soil properties and the SQI from 2022 to 2023. BD, bulk density; SPS, soil porosity; SMT, soil moisture; SST, soil salt; SNN, soil nitrate–nitrogen; SAN, soil ammonium–nitrogen; SOC, soil organic carbon; SAP, soil available P; SAK, soil available K; * and ** represent p < 0.05 and p < 0.01.
Agronomy 14 01529 g008
Figure 9. Impact of biochar application on maize yield from 2022 (a) to 2023 (b) and relationships between the SQI and maize yield from 2022 (c) to 2023 (d). The values are the means ± standard errors (n = 3). Lowercase letters indicate significant differences at p < 0.05. The solid line and square frame correspond to the median and mean values, respectively. CK = control; C1 = biochar produced at 300 °C; C2 = biochar produced at 500 °C; C3 = biochar produced at 700 °C; T1 = 10 t biochar application; T2 = 20 t biochar application.
Agronomy 14 01529 g009
Table 1. Physical and chemical properties of the experimental soils in 0–100 cm soil layer.
Soil LayerBDSandSiltClayFCθsSoil Texture
(cm)(g/cm3)(2–0.05 mm)(0.05–0.002 mm)(<0.002 mm)(cm3/cm3)(cm3/cm3)
0–201.5223.2072.304.500.2350.320SCL
20–401.5515.1962.1322.680.2530.345SCL
40–601.5925.1270.254.630.2730.368SCL
60–801.6048.5435.1216.340.2920.393SL
80–1001.6152.3640.327.320.2850.386SL
SCL represents silt clay loam; SL represents sandy loam soil; BD represents bulk density; θs represents saturated soil water content; FC represents field capacity.
Table 2. Soil chemical properties of the experimental site.
Soil Layer
(cm)
Ion Content (g/kg)Soil Salt Content
(g/kg)
Na+Mg2+Ca2+ClSO42−HCO3
0–200.1270.0400.0920.1840.500.3601.59
20–400.1060.0510.0850.1430.320.3721.21
40–600.0830.0490.0730.1220.210.4110.88
60–1000.0590.0370.0700.1030.210.3510.76
Table 3. Basic properties of the tested soils.
Soil Layer
(cm)
Organic Matter
(g/kg)
Total N
(g/kg)
Alkaline Hydrolysis N
(mg/kg)
Available P
(mg/kg)
Available K
(mg/kg)
EC
(dS/m)
pH
0–208.260.9133.2626.32152.391.598.2
20–402.580.2510.528.5955.251.218.2
40–601.660.095.365.2530.250.888.0
60–1000.180.041.992.3915.540.767.9
Table 4. Selected physicochemical characteristics of biochars produced at different pyrolysis temperatures.
PropertyBC300BC500BC700
EC4.52 ± 0.05 c5.21 ± 0.22 b6.65 ± 0.96 a
pH7.8 ± 0.1 c9.0 ± 0.1 b10.0 ± 0.1 a
productivity (%)48.56 ± 1.6 a33.25 ± 1.2 b29.14 ± 0.9 c
C (%)62.17 ± 0.3 c65.36 ± 0.2 b71.25 ± 0.1 a
H (%)4.15 ± 0.05 a3.33 ± 0.15 b2.12 ± 0.09 c
N (%)1.99 ± 0.12 a0.52 ± 0.05 b-
O (%)21.02 ± 1.02 a15.26 ± 0.82 b8.68 ± 0.09 c
H/C0.76 ± 0.01 a0.51 ± 0.01 b0.50 ± 0.02 b
O/C0.20 ± 0.01 a0.14 ± 0.03 b0.08 ± 0.03 c
(O + N)/C0.22 ± 0.01 a0.14 ± 0.01 b0.08 ± 0.01 c
TOC (g/kg)417.79 ± 1.5 b430.08 ± 1.3 b518.93 ± 2.69 a
Total P (g/kg)3.94 ± 0.09 a2.57 ± 0.06 b1.61 ± 0.03 c
Total K (g/kg)54.15 ± 0.25 a42.15 ± 0.69 b38.25 ± 0.52 b
Different lowercase letters indicate significant differences among all the treatments at the 0.05 level.
Table 5. Experimental Design.
TreatmentBiochar Pyrolysis Temperature (°C)Biochar Application Rate (t/ha)
CK--
C1T130010
C1T230020
C2T150010
C2T250020
C3T170010
C3T270020
CK = control; C1 = biochar produced at 300 °C; C2 = biochar produced at 500 °C; C3 = biochar produced at 700 °C; T1 = 10 t biochar application; T2 = 20 t biochar application.
Table 6. Irrigation and fertilization system.
Growth Stage of Maize2022Irrigation Water Amount2023Irrigation Water AmountFertilizer Application Amount (kg/ha)
(mm)(mm)NPK
Sowing date5 May-10 May-60200150
Seedling stage25 May22.527 May22.5---
11 June22.513 June22.590--
Jointing stage25 June22.529 June22.5---
10 July22.515 July22.5---
Tasselling stage23 July22.527 July22.590--
2 August22.59 August22.5---
Filling stage17 August22.521 August22.560--
30 August22.52 September22.5---
Table 7. Soil nutrient contents under different treatments from 2022 to 2023.
YearsTreatmentsAmmonium–Nitrogen (mg/kg)Nitrate–Nitrogen (mg/kg)Organic Carbon (g/kg)Available P (mg/kg)Available K (mg/kg)
0–20 cm20–40 cm0–20 cm20–40 cm0–20 cm20–40 cm0–20 cm20–40 cm0–20 cm20–40 cm
2022CK9.98 a 2.13 a26.03 a 7.25 a3.05 e0.45 f10.88 e4.55 d147.25 a50.24 a
C1T110.35 a 2.25 a25.25 ab6.48 ab4.36 d0.52 e18.15 b7.23 a146.36 a53.14 a
C1T210.23 a 2.76 a23.54 b6.2 bc5.15 c0.61 d20.33 a7.69 a149.25 a49.85 a
C2T19.65 a 1.55 a21.21 c5.77 c5.48 c0.62 d16.36 c6.32 b146.25 a50.58 a
C2T29.88 a1.62 a19.98 c5.21 d6.59 b0.74 c17.35 bc5.91 b150.341 a55.24 a
C3T19.78 a 1.71 a17.191 d5.025 d8.31 ab0.9 b15.11 d5.02 c152.45 a49.85 a
C3T210.10 a 2.05 a15.54 d4.67 e9.24 a1.25 a14.89 d4.9 c155.21 a51.22 a
2023CK9.15 a1.85 a27.17 a 8.05 a3.16 f0.51 f8.65 f3.11 f145.12 a48.73 a
C1T110.32 a 2.01 a25.67 ab7.49 ab5.09 e0.62 e15.85 b6.11 b146.26 a52.14 a
C1T29.06 a1.77 a23.98 b7.01 b6.39 d0.9 d17.92 a6.95 a148.21 a49.25 a
C2T110.09 a1.23 a19.28 c5.91 c7.52 c1.12 c15.01 b6.02 b147.25 a53.18 a
C2T210.13 a1.98 a16.1 d5.06 d7.99 bc1.15 c14.12 c5.46 c142.21 a50.25 a
C3T19.12 a1.45 a13.99 e4.25 e8.65 ab1.48 b11.69 d5.06 d150.32 a49.25 a
C3T29.45 a2.05 a11.34 e4.01 e8.99 a1.63 a10.11 e4.18 e151.23 a55.01 a
The values are the means ± SEs (n = 3). Different lowercase letters indicate significant differences between treatments in the same year (p < 0.05); CK = control; C1 = biochar produced at 300 °C; C2 = biochar produced at 500 °C; C3 = biochar produced at 700 °C; T1 = 10 t biochar application; T2 = 20 t biochar application.
Table 8. Correlation coefficients for highly weighted variables of 2023.
IndexSoil Moisture
Content
ECPorosityNitrate
Nitrogen
Ammonium
Nitrogen
Organic
Carbon
EC−0.482 *
Porosity0.703 **0.241
Nitrate–nitrogen−0.693 **−0.263–0.880 **
Ammonium–nitrogen−0.570 *0.523 *−0.1770.323
Organic carbon0.622 **0.3450.881 **−0.991 **−0.165
Available phosphorus0.0800.0650.3720.1100.390−0.060
* and ** represent p < 0.05 and p < 0.01, respectively.
Table 9. Correlation coefficients for highly weighted variables of 2024.
IndexECBulk DensityPorosityNitrate–NitrogenAmmonium–NitrogenOrganic CarbonAvailable Phosphorus
EC−0.973 **
Bulk density−0.598 *0.672 **
Porosity0.588 *−0.655 **−0.999 **
Nitrate–nitrogen−0.626 **0.700 **0.921 **−0.921 **
Ammonium–nitrogen−0.648 **0.628 **0.253−0.2560.324
Organic carbon0.691 **−0.758 **−0.983 **0.981 **−0.955 **−0.381
Available phosphorus0.091−0.095−0.1520.1410.2160.073 **0.071 **
* and ** represent p < 0.05 and p < 0.01, respectively.
Table 10. Results of the principal component analysis of the soil quality indicators and the communality and weighted values of each soil quality indicator.
Year 20222023
Principal ComponentsPC1PC2PC3PC1PC2PC3
Soil moisture content0.912−0.001 −0.290 0.9020.386 −0.092
EC0.250 0.8550.034 −0.9190.335 −0.067
Bulk density−0.025 0.260 −0.725 −0.320 0.862−0.232
Porosity0.8550.121 0.082 0.8950.339 0.079
Nitrate–nitrogen−0.292 0.756−0.224 −0.438 0.8550.133
Ammonium–nitrogen−0.045 0.739 0.741−0.229 0.7920.232
Organic carbon0.832−0.225 0.215 0.8770.035 0.077
Available phosphorus0.105 0.255 0.8150.024 0.188 0.893
Available potassium0.172 0.423 −0.065 0.200 0.588 −0.230
eigenvalue8.320 2.380 1.530 6.883 2.360 1.130
Proportion explained59.68%10.91%8.26%56.60%11.91%10.06%
Bold values signify factors with absolute values within 10% of the highest factor loading. The bold underlined values represent the factors retained in MDS.
Disclaimer/Publisher’s Note: The statements, opinions and data contained in all publications are solely those of the individual author(s) and contributor(s) and not of MDPI and/or the editor(s). MDPI and/or the editor(s) disclaim responsibility for any injury to people or property resulting from any ideas, methods, instructions or products referred to in the content.

