Abstract
Potato production systems present various phytosanitary problems. Among these, potato early dying (PED) caused by Verticillium spp. is a disease that is difficult to detect in its early stages and whose expression occurs in critical growing phases of the crop, such as tuber filling, generating a high economic impact. The objective of this work was to use spectral data to classify potato plants and identify the degree of severity of PED using spectral signatures and multispectral images captured on potato plants under greenhouse and commercial production conditions. Methods such as principal component analysis (PCA), random forest (RF), support vector machine (SVM), and artificial neural network (ANN) algorithms were implemented. All algorithms performed well; however, the RF was more accurate after iteration. The RF had a good capacity for indirect detection of PED, with an average accuracy of 60.9%. The wavelengths related to the red and red edges, especially from 710 to 735 nm, proved to be highly informative. As a result of the congruence between field and greenhouse data, the RECI, NDRE, VWI, and GRVI spectral indices were consistent with the discrimination of symptoms and PED severity levels. Identified wavelengths can be applied in the design of optical sensors that, together with the use of ML algorithms, can be implemented in the remote detection of early death in potato crops.
1. Introduction
After rice and wheat, potato (Solanum tuberosum L.) is the third most important food crop worldwide [1]. About 1.4 billion people consume this tuber as a staple food and its annual production exceeds 300 million tons [2]. However, the yield, quality, productivity, and sustainability of this crop have been reduced by the presence of various alterations, including the disease known as potato early dying (PED), caused by Verticillium spp. [3]. PED has been reported to cause yield losses of up to 50% [4,5]. The disease causes vascular bundle plugging, wilting, chlorosis, necrosis of leaves, and finally the early death of plants [4].
The health status of plants has been associated with measurable morphological, physiological, biochemical, structural, or phenological characteristics, which are considered indicators of the response of the plant to biotic or abiotic stress factors [6]. The monitoring of these traits has been used to alert against this type of event [7]. In this regard, spectral techniques, thermography, and fluorescence images are alternatives that have been used for the detection and indirect monitoring of the phytosanitary status of a crop [8,9]. This is due to their ability to detect changes in plant characteristics in response to different types of stress [10,11].
Usually, the detection of diseases in plants is carried out based on visual evaluations that identify changes in the color of the leaves and the pattern and distribution of lesions in the leaf, stem, and plant [12]. However, these evaluations can be influenced by the observer’s knowledge, making them subjective [13]. In addition to this, when other alterations are present, detection can be limited due to the lack of differentiation between the symptoms associated with each alteration [14,15]. Meanwhile, molecular and biochemical techniques are quite sensitive and can accurately detect diseases in plants; however, they are destructive methodologies that consume a considerable amount of time, require trained personnel, and often have a high cost [10,16]. On the other hand, observation of changes in spectral responses could allow for the rapid and indirect detection of in vivo samples [11,17].
In the case of disease detection using spectral data, two data sources are commonly used individually, spectral signatures and multispectral images [13,18]. Regarding the first, detection methods have focused on the identification of bands that are more significant and related to the evaluated disease [11,19]. On the other hand, from multispectral images, information is generated per pixel, which can in turn be transformed into indices (vegetation, disease, and others), heat maps, and false color maps. Furthermore, it is also possible to identify spectral areas associated with reflectances that can be related to the presence and quantification of certain alterations [20]. Given the relative strengths and weaknesses of the two types of spectral data sources, their joint use is not common in the detection of plant diseases; however, it is evident that their joint use is advantageous, as it provides greater recognition accuracy, less susceptibility to environmental factors [21], and greater applicability under field conditions. However, a volume of high-dimensional data is generated, which poses a challenge when performing analyses that allow for the identification of informative wavelengths that are directly related to the health status of plants [22].
A commonly used method in the analysis of spectral data to detect changes in plants is vegetation indices (VIs) [23]. However, although positive relationships have been found between the evaluated phenomena and VIs, they have been shown to have low sensitivity and specificity to identify problems in plants that present similar symptoms and changes [11]. For this reason, it has been decided to develop indices from spectral areas identified by different methods, which are directly related to the evaluated alteration [22].
To identify spectral bands and informative indices, extraction and feature/band selection methods are used for dimensional reduction and the elimination of spectral redundancy [24]. An example of such methods is principal component analysis (PCA) [22]. In recent years, the use of machine learning (ML) methods for the selection of bands and subsequent prediction and classification of different alterations in crops has increased [22,24]. One of the advantages of these methods is that they allow the spectral significance of the selected wavelengths to be preserved [22,24]. Various ML techniques have been used for this purpose, due to the high recognition rate and accuracy of the results they produce, their robustness, and their non-parametric perspective [22,25]. The most significant of these include support vector machines (SVMs) [22,26], random forest (RF) [14,23,27], and artificial neural networks (ANNs) [19].
However, the use of indirect detection tools for plant diseases has focused on two alternatives, each independently used for controlled or field trials. The use of spectral signatures obtained from fixed or mobile spectroradiometers has been geared towards more controlled trials and those at the plant level. Meanwhile, under field conditions, drone-mounted spectral cameras have been used, targeting plants or groups of plants, with the aim of identifying differences based on vegetation indices. These situations have led to the two evaluation methods being viewed as independent of each other, resulting in the loss of valuable information and integration processes between the approaches that could allow for a better approximation to indirect detection using spectral response methods, regardless of the equipment and conditions of the crops used.
Based on the above and considering the limited number of investigations that use spectral data to analyze and indirectly detect PED [14,28,29], the objective of this work was to use traditional methods such as PCA and ML to identify contrasting wavelengths between healthy and symptomatic plants and to determine the severity levels of PED from two sources of spectral data (hyperspectral and multispectral). On the basis of the above, our objectives were (i) to compare the performance of different PCA and ML methods in the classification of healthy and symptomatic potato plants and the severity of PED; (ii) to identify wavelengths by their capacity to identify symptomatic plants using different analysis methods; (iii) to develop disease spectral indices from informative wavelengths; and (iv) to compare the classification results of different levels of PED from spectral signature data and multispectral imaging.
2. Materials and Methods
2.1. Location of the Greenhouse and Field for Experiments
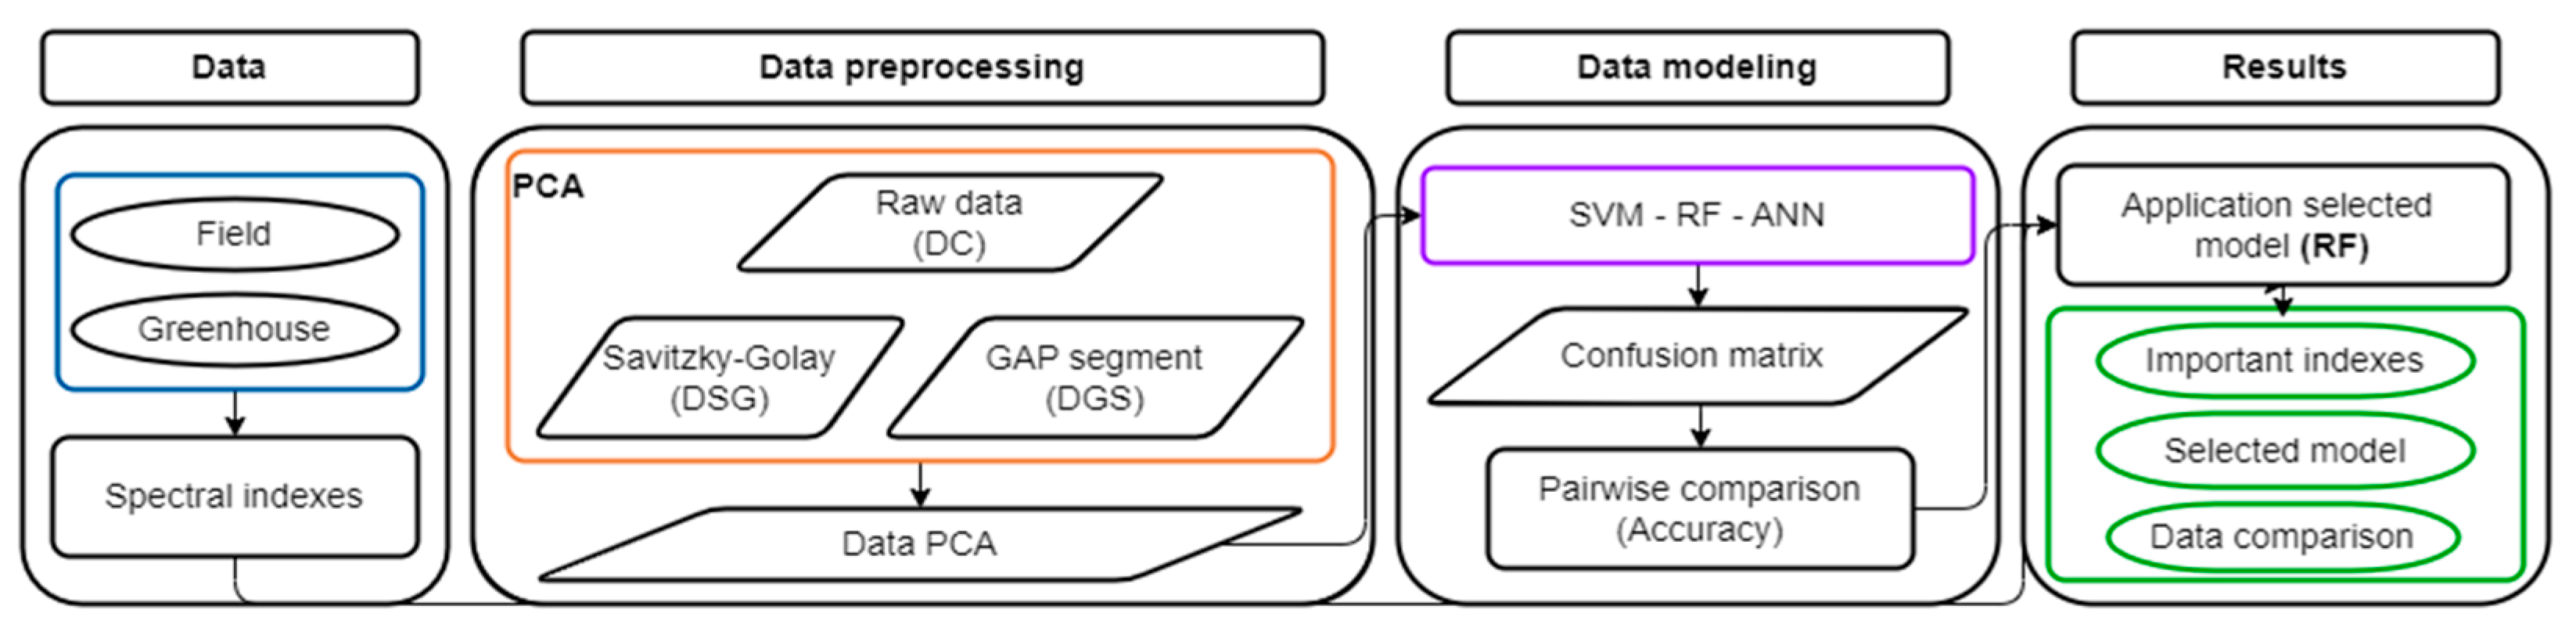
Data were obtained from potato plants grown under two contrasting conditions: (i) semi-controlled conditions (greenhouse) and (ii) commercial production crops (Figure A1). In the first case, Diacol Capiro cultivar seed tubers were seeded in 5 kg soil pots in a greenhouse located at the Facultad de Ciencias Agrarias de la Universidad Nacional de Colombia in Bogotá (4°38′12.58″ N, 74°5′18.12″ W). The soil was maintained in field capacity by constant irrigation according to the requirements of the plants, and the management was carried out according to the stage of development of the crop. During the experiment, the average temperature was 15.1 °C and the relative humidity ranged between 80 and 85%. Two isolates previously identified as belonging to the Verticillium genus and pathogenic in potatoes were used for the inoculation of the potato plants. The first isolate of the pathogen was a strain characterized as Verticillium albo-atrum, provided by the Corporacion Colombiana de Investigacion Agropecuaria-Agrosavia in Mosquera. The second was isolated from Diacol Capiro plants affected by PED from the municipality of Funza, Cundinamarca. The pathogen isolation was carried out according to the protocol of the plant health laboratory of the Facultad de Ciencias Agrarias de la Universidad Nacional de Colombia in Bogotá. The data acquisition and management scheme and the methodological processes are described in Figure 1.
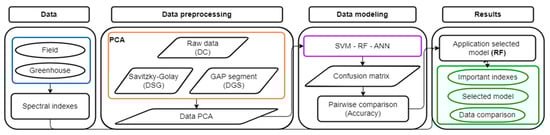
Figure 1.
Workflow used to determine contrasting bands and spectral indices in potato ED detection.
Multiplication of the pathogen inoculum in the laboratory was carried out in sterile cooked rice at 21 °C according to the laboratory’s own protocol. The conidia of each isolate were collected in sterile distilled water eight days after incubation and a suspension of 1 × 10⁷ conidia mL−1 was prepared [30]. Certified potato seed tubers sown in previously autoclaved soil were used. Fifteen tubers were planted, one per pot, to ensure the presence of plants with different levels of severity of the disease. Of the total number of plants evaluated, six were inoculated by drench 49 days after sowing (das), and the remaining six were inoculated at the time of sowing, placing the substrate (rice) with the pathogen around the seed tuber. Three uninoculated plants were used as controls.
For the study under field conditions, plants of the same variety as above were evaluated in two commercial production lots located in the municipalities of Subachoque (4°57′44.52″ N, 74°8′14.44″ W) and Mosquera (4°39′40.58″ N, 74°14′53.46″ W) (Cundinamarca). The lots have average temperatures ranging between 12 and 15 °C and an accumulated annual rainfall that varies between 600 and 1000 mm, with a bimodal rainfall distribution. The relative humidity ranges between 80% and 85%. In addition, they are located at altitudes ranging from 2550 to 2750 m above sea level. The source of inoculum for field conditions corresponded to the natural presence of the pathogen in the soil of the plots selected for the study, in which PED caused by Verticillium was reported in previous crop cycles. Furthermore, in this case, the presence of the pathogen was confirmed following the protocol of the plant health laboratory of the Facultad de Ciencias Agrarias de la Universidad Nacional de Colombia in Bogotá.
2.2. Data Acquisition
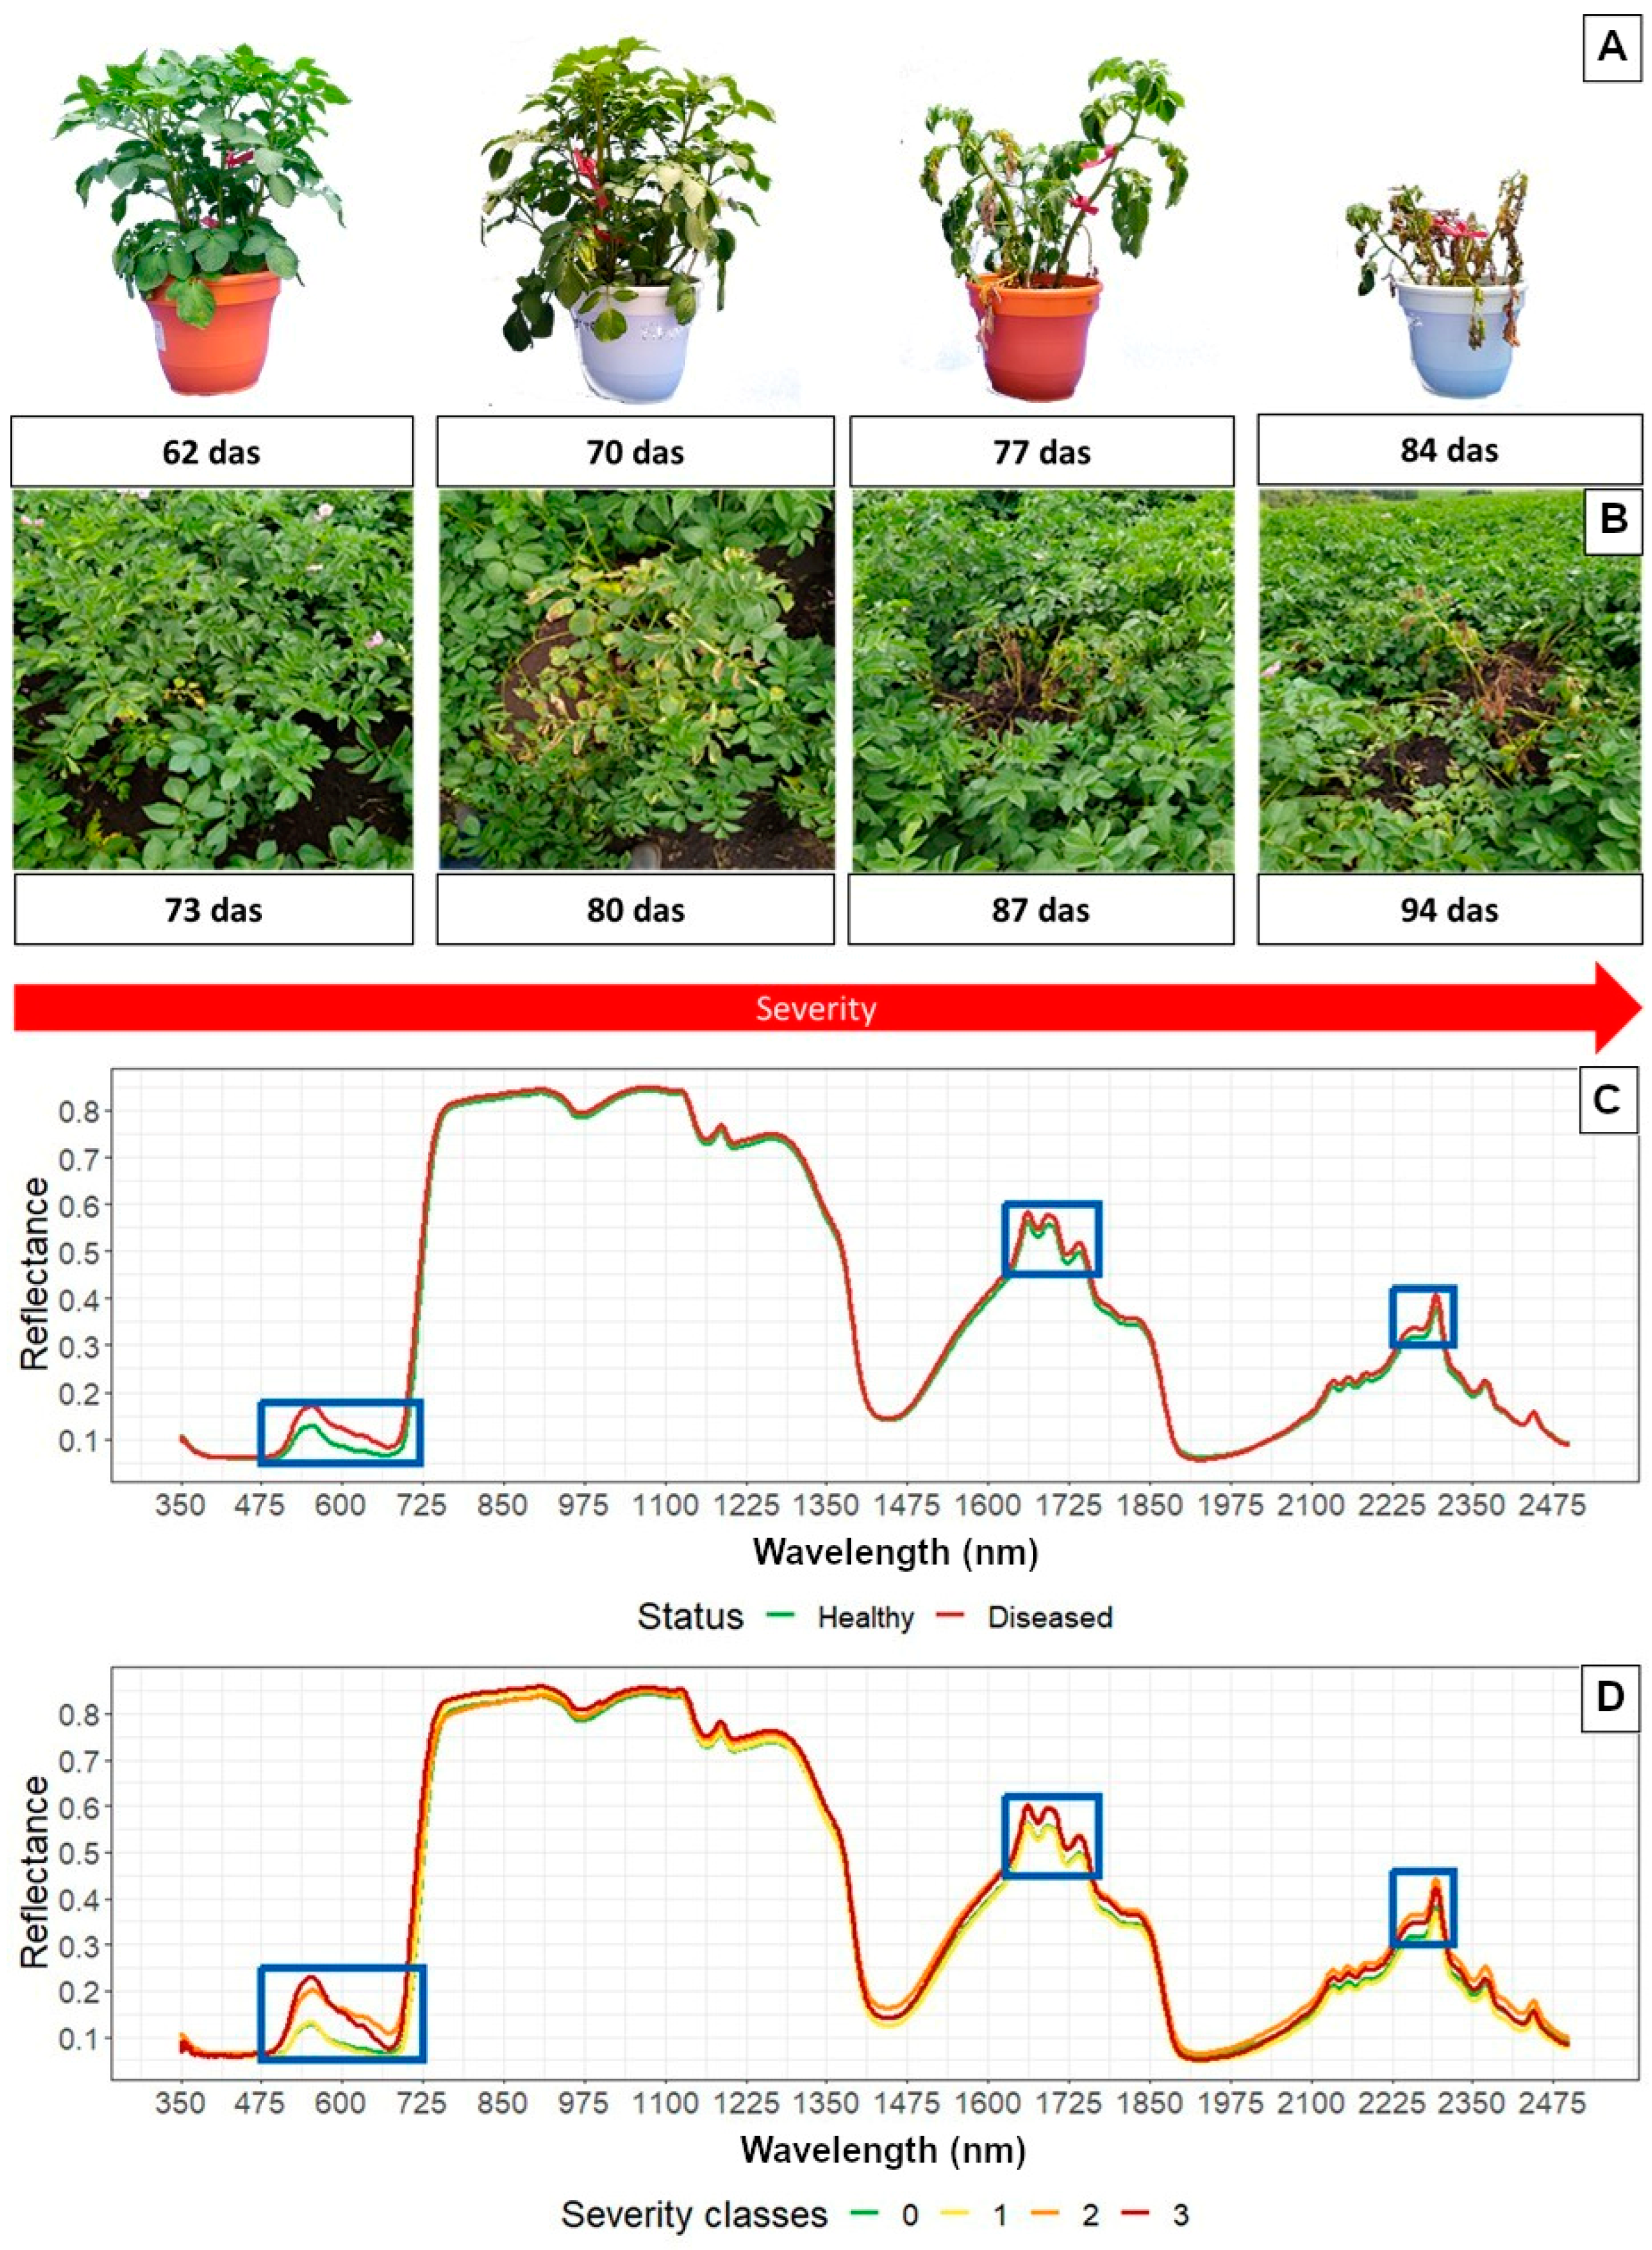
In greenhouse and field locations, the severity of the disease was visually evaluated using a descriptive scale proposed by Hunter et al. [31]. This consists of five levels, corresponding to 0: no symptoms; 1: interveinal chlorosis in lower leaves; 2: moderate necrosis and defoliation of lower leaves; 3: severe leaf necrosis and defoliation; and 4: severe defoliation accompanied by pronounced atrophy, chlorosis, and necrosis of the remaining leaves and dead plant (Figure 2A,B). Under greenhouse and field conditions, spectral evaluations were conducted after 60 das, based on our previous work, where we found out that under natural (field) and artificial (greenhouse) infection, PED symptoms appear around 70 days. Subsequent evaluations were conducted every 8 days, since the disease may become severe in short periods of time with rapid growth rates. Therefore, PED assessment required evaluations at short intervals no longer than 7 days.
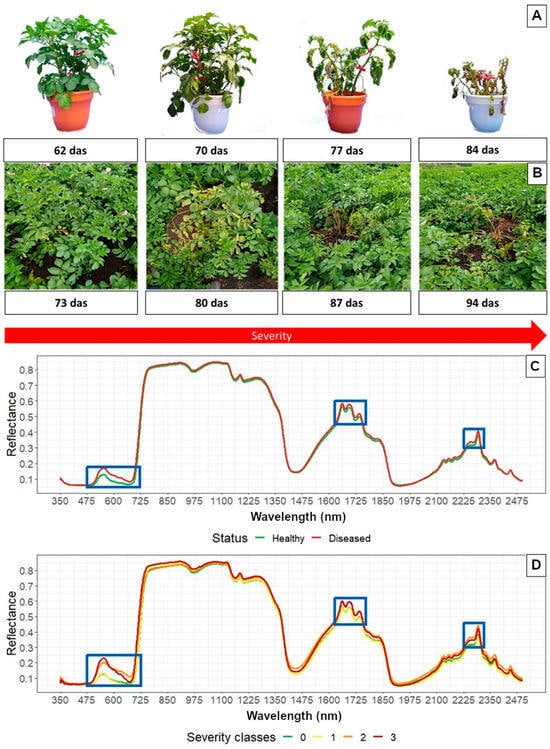
Figure 2.
Development of PED symptoms in Var. Diacol Capiro with different degrees of severity. (A) Plants inoculated with Verticillium spp. under greenhouse conditions. (B) Plants in a commercial crop located in Subachoque-Cundinamarca. Comparison of the mean reflectance values of the spectral signatures captured in Var. Diacol Capiro potato plants inoculated with Verticillium and early dying symptoms under greenhouse conditions. Blue squares represent areas of the spectrum identified as having high potential for visual differentiation. (C) Healthy and diseased plants. (D) Levels of severity of the disease.
2.2.1. Greenhouse Controlled Conditions
Three samplings were carried out on all plants every 8 days, starting from 62 das. Spectral signatures were captured in each plant using a FieldSpec 4 Standard-Res® fixed spectroradiometer (Analytical Spectral Devices Inc., Boulder, CO, USA), with an evaluation range between 350 and 2500 nm; 3 nm spectral resolution from 350 to 700 nm; 10 nm spectral resolution between 1400 and 2100 nm; 1.4 nm sampling interval from 350 to 1050 nm; 2 nm sampling interval from 1000 to 2500 nm; and an integration time of 34 ms.
In healthy and inoculated plants, reflectance measurements were made at 62, 70, and 77 das in the lateral leaflets of fully expanded leaves, numbering four [32] and seven (Figure 2C,D), which corresponded to the upper third (UT) and middle (MT) of the plant. At each evaluation time, five spectral signatures per leaflet were taken, each corresponding to 24 averages for a total of 120. Data were obtained using a leaf clip in five parts of each leaflet, with the upper part of the leaf facing the light source. After the capture of each 100 signatures, the equipment was calibrated with a 99% reflectance polytetrafluoroethylene panel (Analytical Spectral Devices Inc., Boulder, CO, USA). It was ensured that the evaluated experimental units presented different levels of disease severity to compare the changes in the affected leaf area for each of the leaves selected for the capture of spectral signatures.
2.2.2. Field Conditions
For the evaluation of the disease in the field, seven measurements throughout the potato growing cycle were taken every 8 days between 60 das and 115 das. In each of them, 30 sites were selected for sampling, evaluating 15 plants at each site, for a total of 450 individuals. The type of sampling and the spatial distribution of the points to be sampled were determined based on a systematic grid of 15 × 20 m, distributed in one hectare of the lot without including the edges. To ensure the evaluation of the same plants over time, each of the plants was georeferenced using a GPS Reach RS2® device (EMLID, Budapest, Hungary) and marked with colored tape. In each of the batches, the incidence of PED, determined as the number of diseased plants divided by the total number of plants, was evaluated. Furthermore, the severity of PED was determined for each plant according to the scale of Hunter et al. [31] described above. From the values obtained, any number greater than 0 was taken as a positive case for subsequent algorithm training.
In the two selected lots, multispectral data were captured at four moments every 8 days from 77 das, which included the flowering phase of the crop and the filling of the tuber. The flights were made with a DJI Phantom 4 drone to which the Parrot Sequoia (Parrot®, Paris, France) multispectral sensor was attached, with an integrated GPS and reflectance panel. The images were captured at a height of 27 m, with an overlap greater than 70%. Data were obtained in the green-G bands (550 nm center, 40 nm bandwidth); red-R (660 nm center, 40 nm bandwidth); red edge-RE (735 nm center, 10 nm bandwidth); and near-infrared-NIR (790 nm center, 40 nm bandwidth), with a pixel size of 2.8 cm. To radiometrically correct the images, data were captured on a calibration panel at the beginning and end of each flight. For post-processing of the data and the generation of orthomosaics, Agisoft MetaShape 1.6.1 (Agisoft™) was used.
2.3. Data Analysis
Data analysis was carried out using the free software R (version 4.1.2). All models produced were compared with each other in terms of their classification performance according to the different data sources, the developmental stage of the PED symptoms present in the potato plants based on the severity scale used, and the signatures and spectral images captured.
The data analysis process was divided into three parts: (i) comparison of classifications in terms of the spectral signatures captured in different leaves of the plant, in order to elucidate their ability to discern symptoms and identify the algorithm with the best performance classification, which would be used in subsequent analyses; (ii) identification of contrasting bands regarding the classification of healthy and diseased plants; and (iii) the generation of spectral and disease indices for subsequent classification regarding their use as predictor variables with the two captured data sources. For the first of these parts, the RF, SVM (linear basis: SVMl; radial: SVMr), and ANN models were used. For the results of the comparison of classification rates for the analyses in the second two parts, RF was used because it showed less variability in the classification rates for the L4 data, which favored the comparability of the comparison in subsequent processes.
In the first stage, with the aim of evaluating the behavior of different ML algorithms, three approaches were used. The first of these was RF using ensemble learning [33], the second was SVM using split hyperplanes [34], and the third was ANN using the traditional neural network approach [35]. For evaluation, spectral data sets were used. These were divided into training and test groups based on a 70:30 ratio, since this generates a data set large enough to train the model and a test data set large enough to evaluate its performance, allowing for the results to be generalized [36]. The algorithms were optimized with internal fitting parameters (RF = mtry, SVM = cost and loss, ANN = size and decay). The caret library (classification and regression training) was used for the training and prediction of the generated models [37].
The performance of the models was evaluated at two moments. In the training phase, a 10-fold cross-validation was used for each classification model. Subsequently, the performance of each model in classifying the presence and severity classes was compared, using the classification accuracy as a comparison metric of the models in the non-parametric tests. Furthermore, the sensitivity and specificity metrics were compared in a confusion matrix (calculated with the confusion matrix function of the R caret package [37]). In addition to this, all models were tested in a pairwise comparison (metric: accuracy) using t-tests with Bonferroni correction (confidence level α = 0.95) and the diff function in the R caret package [37].
The generated files from the spectroradiometer were exported in .asd format, and the version of the asdreader library (0.1–3) was used for their subsequent reading. Each file was organized according to the plant number to assign the level of severity of the disease, based on the evaluations of the symptoms carried out in each of the samplings.
The first phase of the analysis involves comparing the capacity of the generated models to predict healthy and diseased plants, using the spectral bands as predictor variables. For this process, a multistage analysis was used, using raw and pre-processed data. Three databases were generated: (i) raw data (RD); (ii) data pre-processed using the Savitzky–Golay filter [38], second derivative (SGD) with a bandwidth of thirteen units, a polynomial of the third degree, and a derivative of the second degree, respectively; and (iii) data with a Gap segment filter [39] and second derivative (GSD) with a bandwidth of thirteen units, a gap interval of ten units, and a derivative of second degree. Data sets were processed with the prospectr library [40].
Each data set was subjected to a principal component analysis (PCA) using the FactorMineR library [41]. The generated components were used as predictor variables to optimize the modeling process and the initial comparison of the classification rate. This allowed for the determination of the algorithm and data set to be used for the selection of the most important wavelengths, which were subsequently applied in the calculation of spectral indices. Subsequently, models were generated to identify the most important wavelengths and compare the classification rate of healthy and diseased plants with respect to the leaf in which the measurements were made. The algorithm applied was RF (according to the results of the previous stage), using the GSD set divided with respect to the measured leaf, and using the optimization parameters and the comparison metrics described previously.
Based on the identification of the bands with discriminant capacity obtained in the previous phase, and to establish a contrast relationship between the data generated in the spectral signatures under greenhouse conditions and multispectral images acquired in the field, the mean of the reflectance values obtained in the spectral signatures using the RD data set was calculated. The reason for this is that the reflectance values were not modified in the capture intervals of the multispectral camera bands based on their specific variation (bandwidth). Various combinations of values associated with the NIR, R, and RE bands were generated to assess their predictive capacity with respect to the presence of ED symptoms, selecting the index named the Verticillium Wilt Index (VWI) as in Equation (1) (for more details review Table A1).
The values of the pixels associated with each plant were extracted from the multispectral images captured and the sampling points for each of the data points obtained in the field phase. This generated a set of four bands and the values associated with the evaluation of the symptoms of the disease. A total of 13 indices, presented in Table A1, were calculated with the values of the bands from the multispectral camera and the mean values of the spectral areas obtained from the spectral signatures. Subsequently, classification models regarding incidence and severity were generated using the RF algorithm under the parameterizations described above for both data sets. Finally, pairwise comparisons of the different models developed from the two spectral sources used were generated following the evaluation flow presented above.
3. Results
3.1. Symptoms under Greenhouse and Field Conditions Associated with PED
Under greenhouse conditions, potato plants inoculated with the two Verticillium isolates developed early dying symptoms. The first symptoms, corresponding to a loss of turgor and discoloration of the lower leaves, were observed between 60 and 65 das. Subsequently, chlorosis, necrosis, and wilting of the leaves were observed; finally, the wilted leaves remained attached to the stem (Figure 2A). Under commercial conditions on the Mosquera and Subachoque plots, symptoms associated with PED were found around 70 das. The symptoms corresponded to interveinal chlorosis, necrosis, and wilting of the leaves, which remained attached to the stems (Figure 2B). The symptoms observed in the field matched those found in plants inoculated under greenhouse conditions and the disease symptoms reported in potatoes [4,31].
From the spectral signatures captured under greenhouse conditions, we identified differences between the spectral behavior of plants with symptoms associated with PED and control (healthy) plants. Differential behavior based on visual inspection of the spectral signatures was observed in the spectrum regions located between 475 and 725, 1625 and 1770, and 2225 and 2320 nm (Figure 2C). In these regions, healthy plants had lower reflectance than diseased plants, and reflectance levels varied according to severity. However, it is evident that the first level of the scale (lowest severity) tends to have a behavior like that of plants reported as healthy (Figure 2D).
3.2. Analysis of Spectral Signatures Obtained in Plants Subjected to Artificial Infection in a Greenhouse
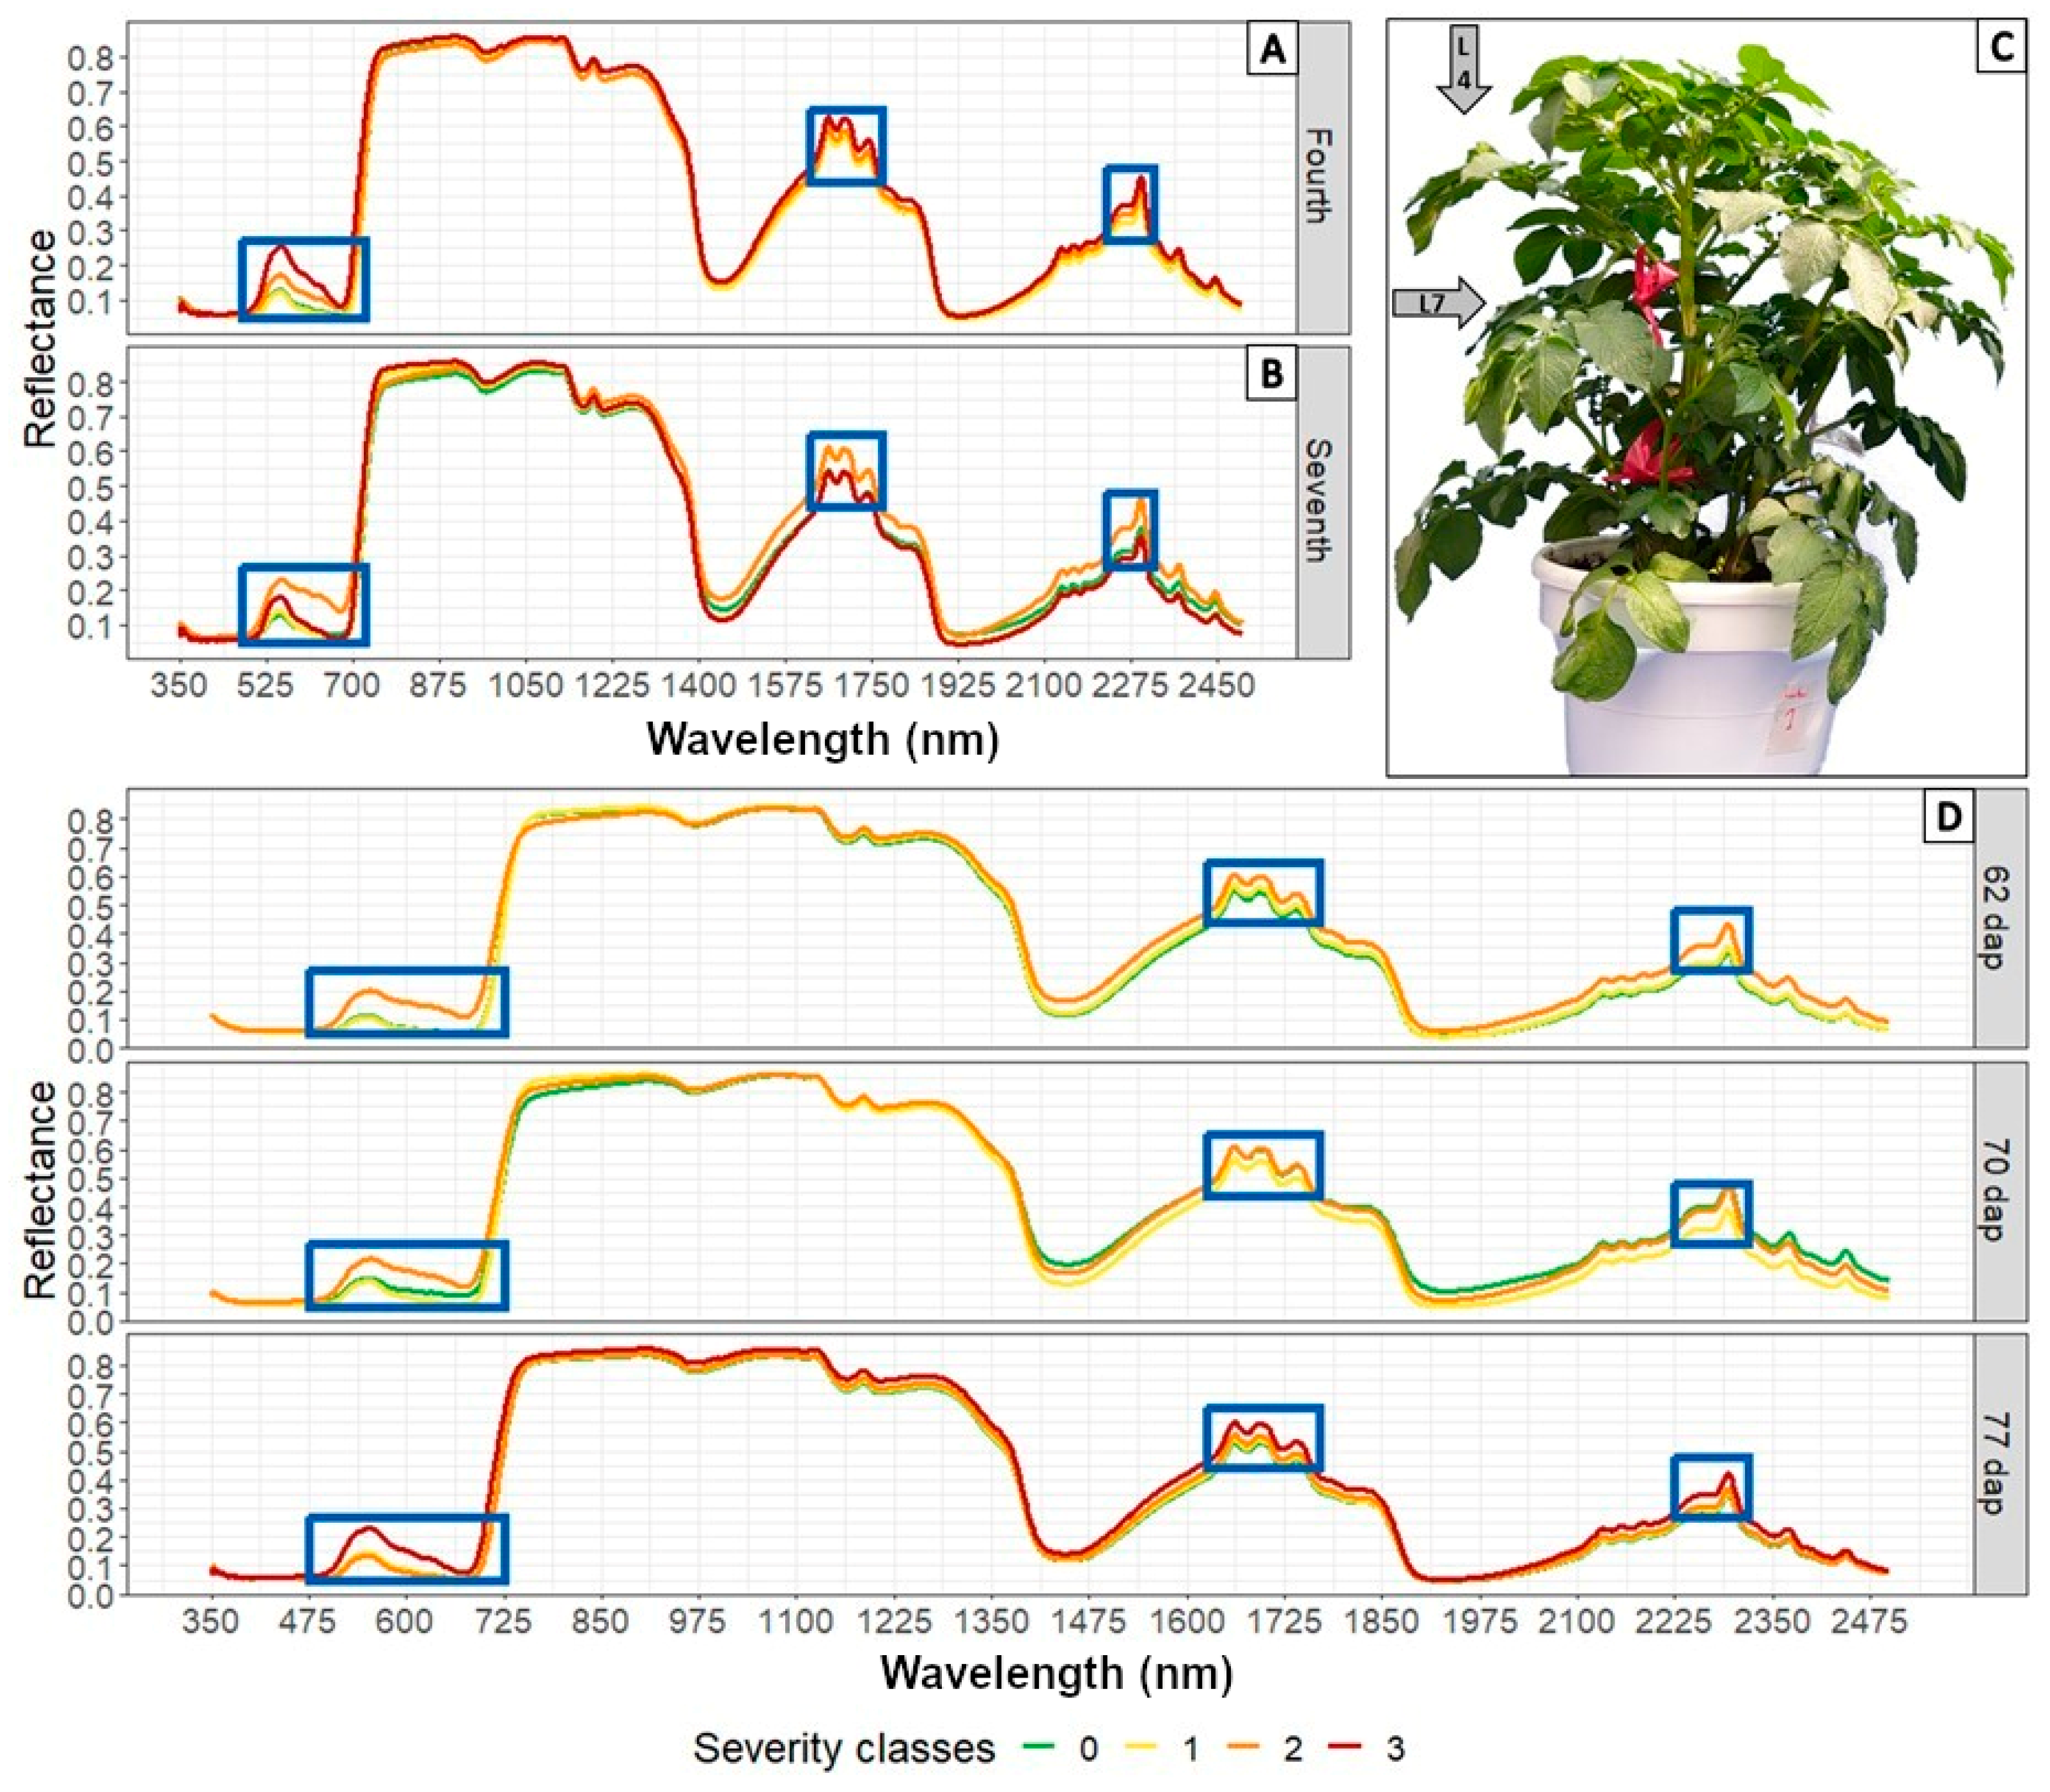
Regarding the leaves of the plant in which the spectral signature was taken (Figure 3C), we observed that in leaf four (Figure 3A) and seven (Figure 3B), similar spectral behavior was present with respect to the different levels of severity of the disease. However, we found a variation in the behavior of the signatures with severity level 3 in leaf seven, in which the reflectance decreases relative to the other levels of the disease. Regarding the moment of evaluation (Figure 3D), we observed an increase in reflectance in plants with high severity (level 3) as the infection time progressed. We found that the differentiation of the signatures of plants with initial levels of the disease (severity levels 1 and 2) in the range of 500 to 750 nm becomes difficult at 77 das. In contrast, at wavelengths greater than 750 nm, there is a notable difference between the reflectance values of healthy plants and those with some level of severity of the disease for the same evaluation moment.
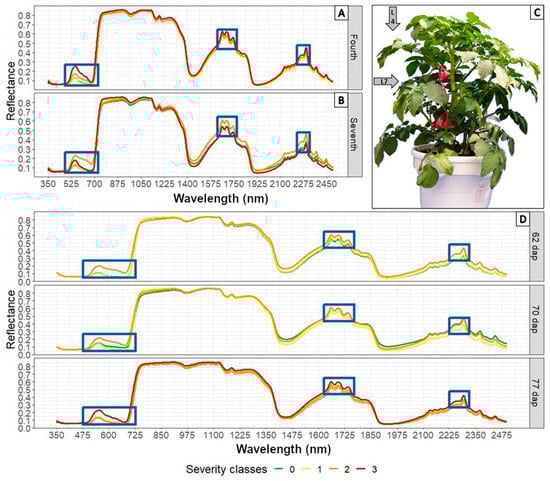
Figure 3.
Comparison of mean values of spectral signatures at different levels of disease captured in Var. Diacol Capiro inoculated with Verticillium spp. in different leaves and stages of plant development. (A) Leaf four (L4). (B) Leaf seven (L7). (C) Location of the plant leaf where the spectral signature is captured. (D) Spectral signatures at different stages of plant development by severity level.
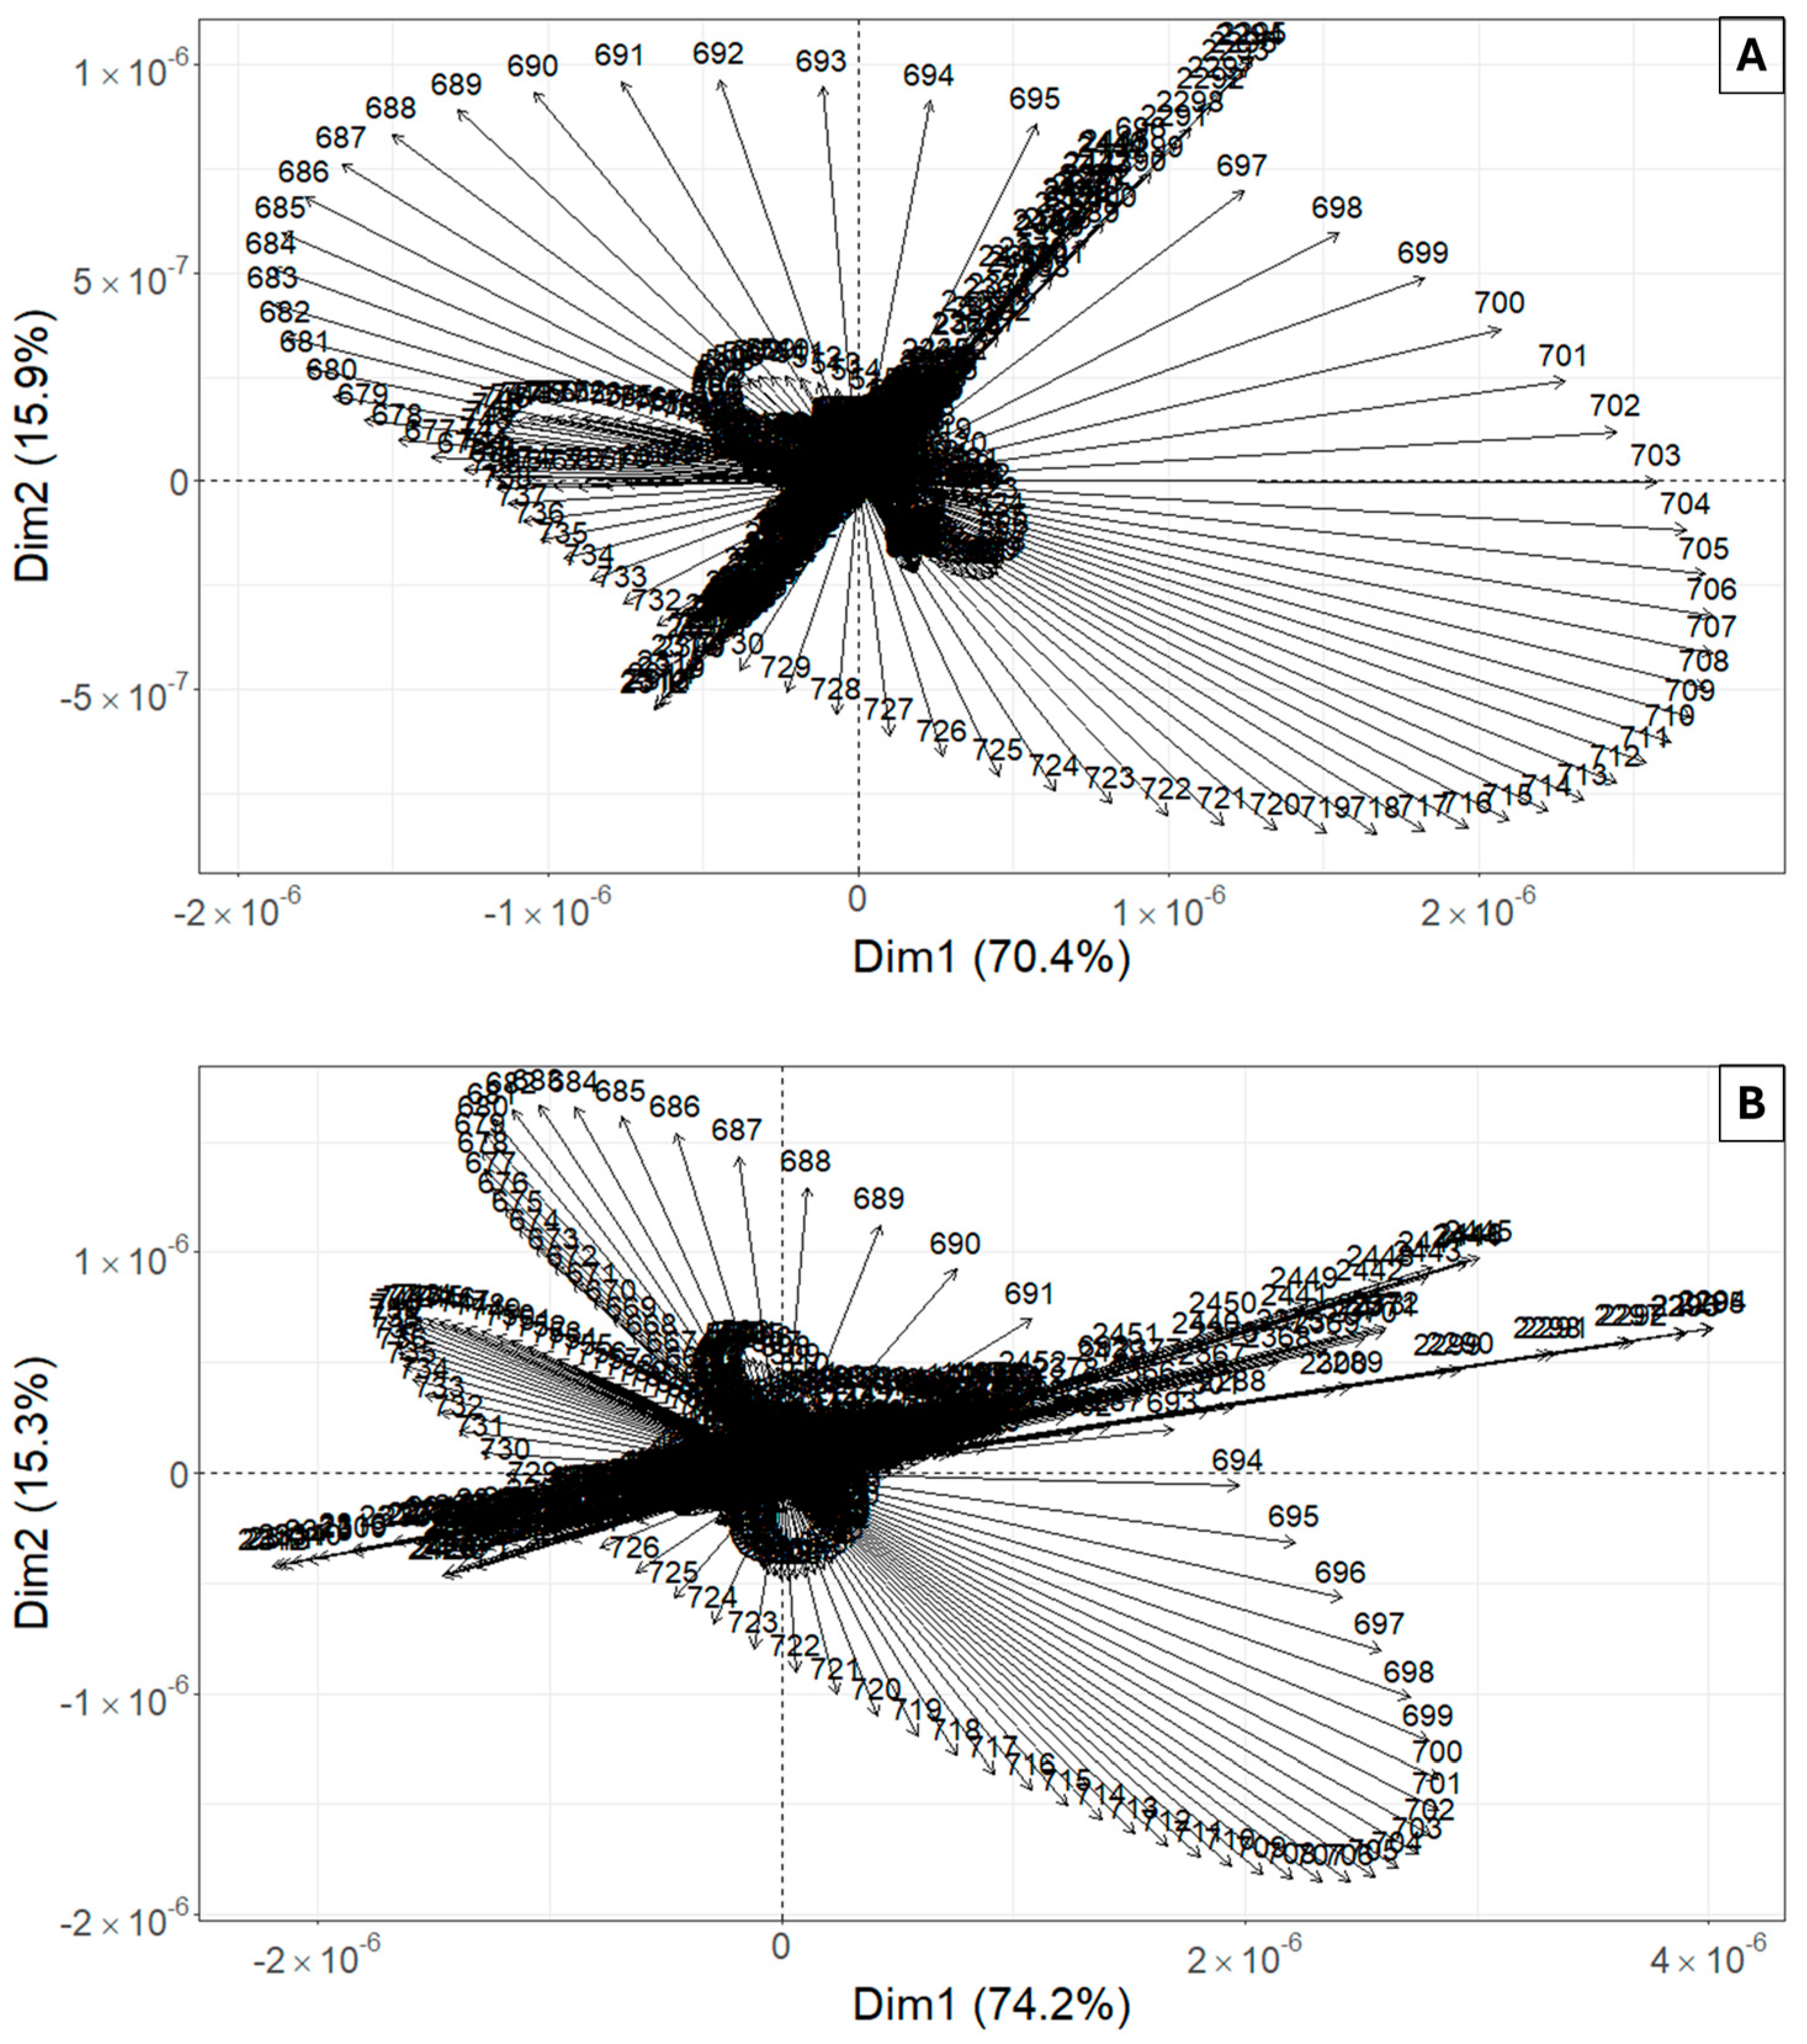
From the PCA-based analysis applied to the different data sets obtained after preprocessing, it was found that the best fit was achieved with the GSD set, since it best expresses the contribution of the generated vectors. Meanwhile, the explanation of the variation in dimensions was best when using the GSD set for leaf four, which achieved a value of 78.3% in the first dimension (Figure 4A). However, the percentage explanation was similar for all data sets evaluated using two dimensions. For leaf seven (Figure 4B), the use of data from the RD set had the greatest capacity to explain the variance (87.2%), with the best differentiation of the spectral responses in the lower third of the plants. In both cases, the generated vectors show that the greatest ability to identify the presence of symptoms of ED occurs in the range of 680 to 740 nm. Regarding the severity of the disease, a contribution of some vectors located in the region of 2300 to 2450 nm is observed.
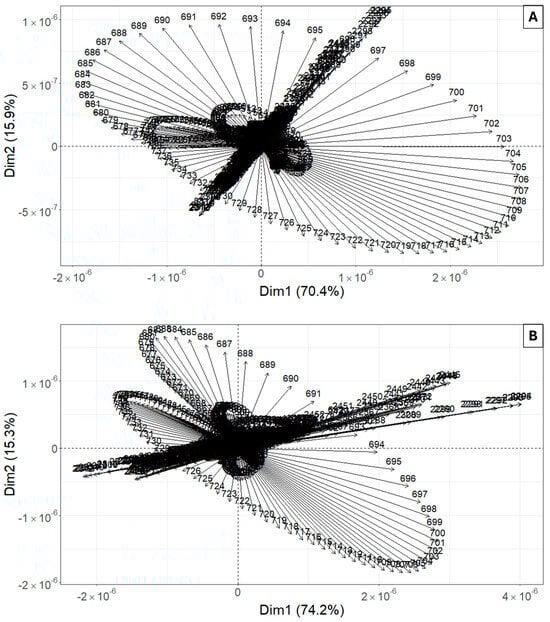
Figure 4.
Results of the PCA analysis applied to preprocessed data sets from the spectral signatures of potato plants affected by PED. (A) Leaf four (L4:UT)–GSD (B) Leaf seven (L7:MT)–GSD.
The classification results using the three data sets show that, based on the mean accuracy values of the data captured on leaf four (L4: UT), the highest classification rate was obtained using the RF algorithm with the GSD set (60.9%). However, there are no statistical differences between the classification rates of the models used (p-value = 0.8128). On the contrary, for leaf seven (L7:MT), the mean values show that the highest classification rate was achieved by applying the SVMl model with the RD set (72.2%). Furthermore, regarding the statistical differences between the classifiers (p-value = 1.4727 × 10⁻¹⁰), which could be separated into three groups, it should be noted that RF did not have statistical differences in terms of the classification rate presented by SVM/RD in any data set. Since the RF was stable in both cases, it was selected as the algorithm to be used in subsequent processes.
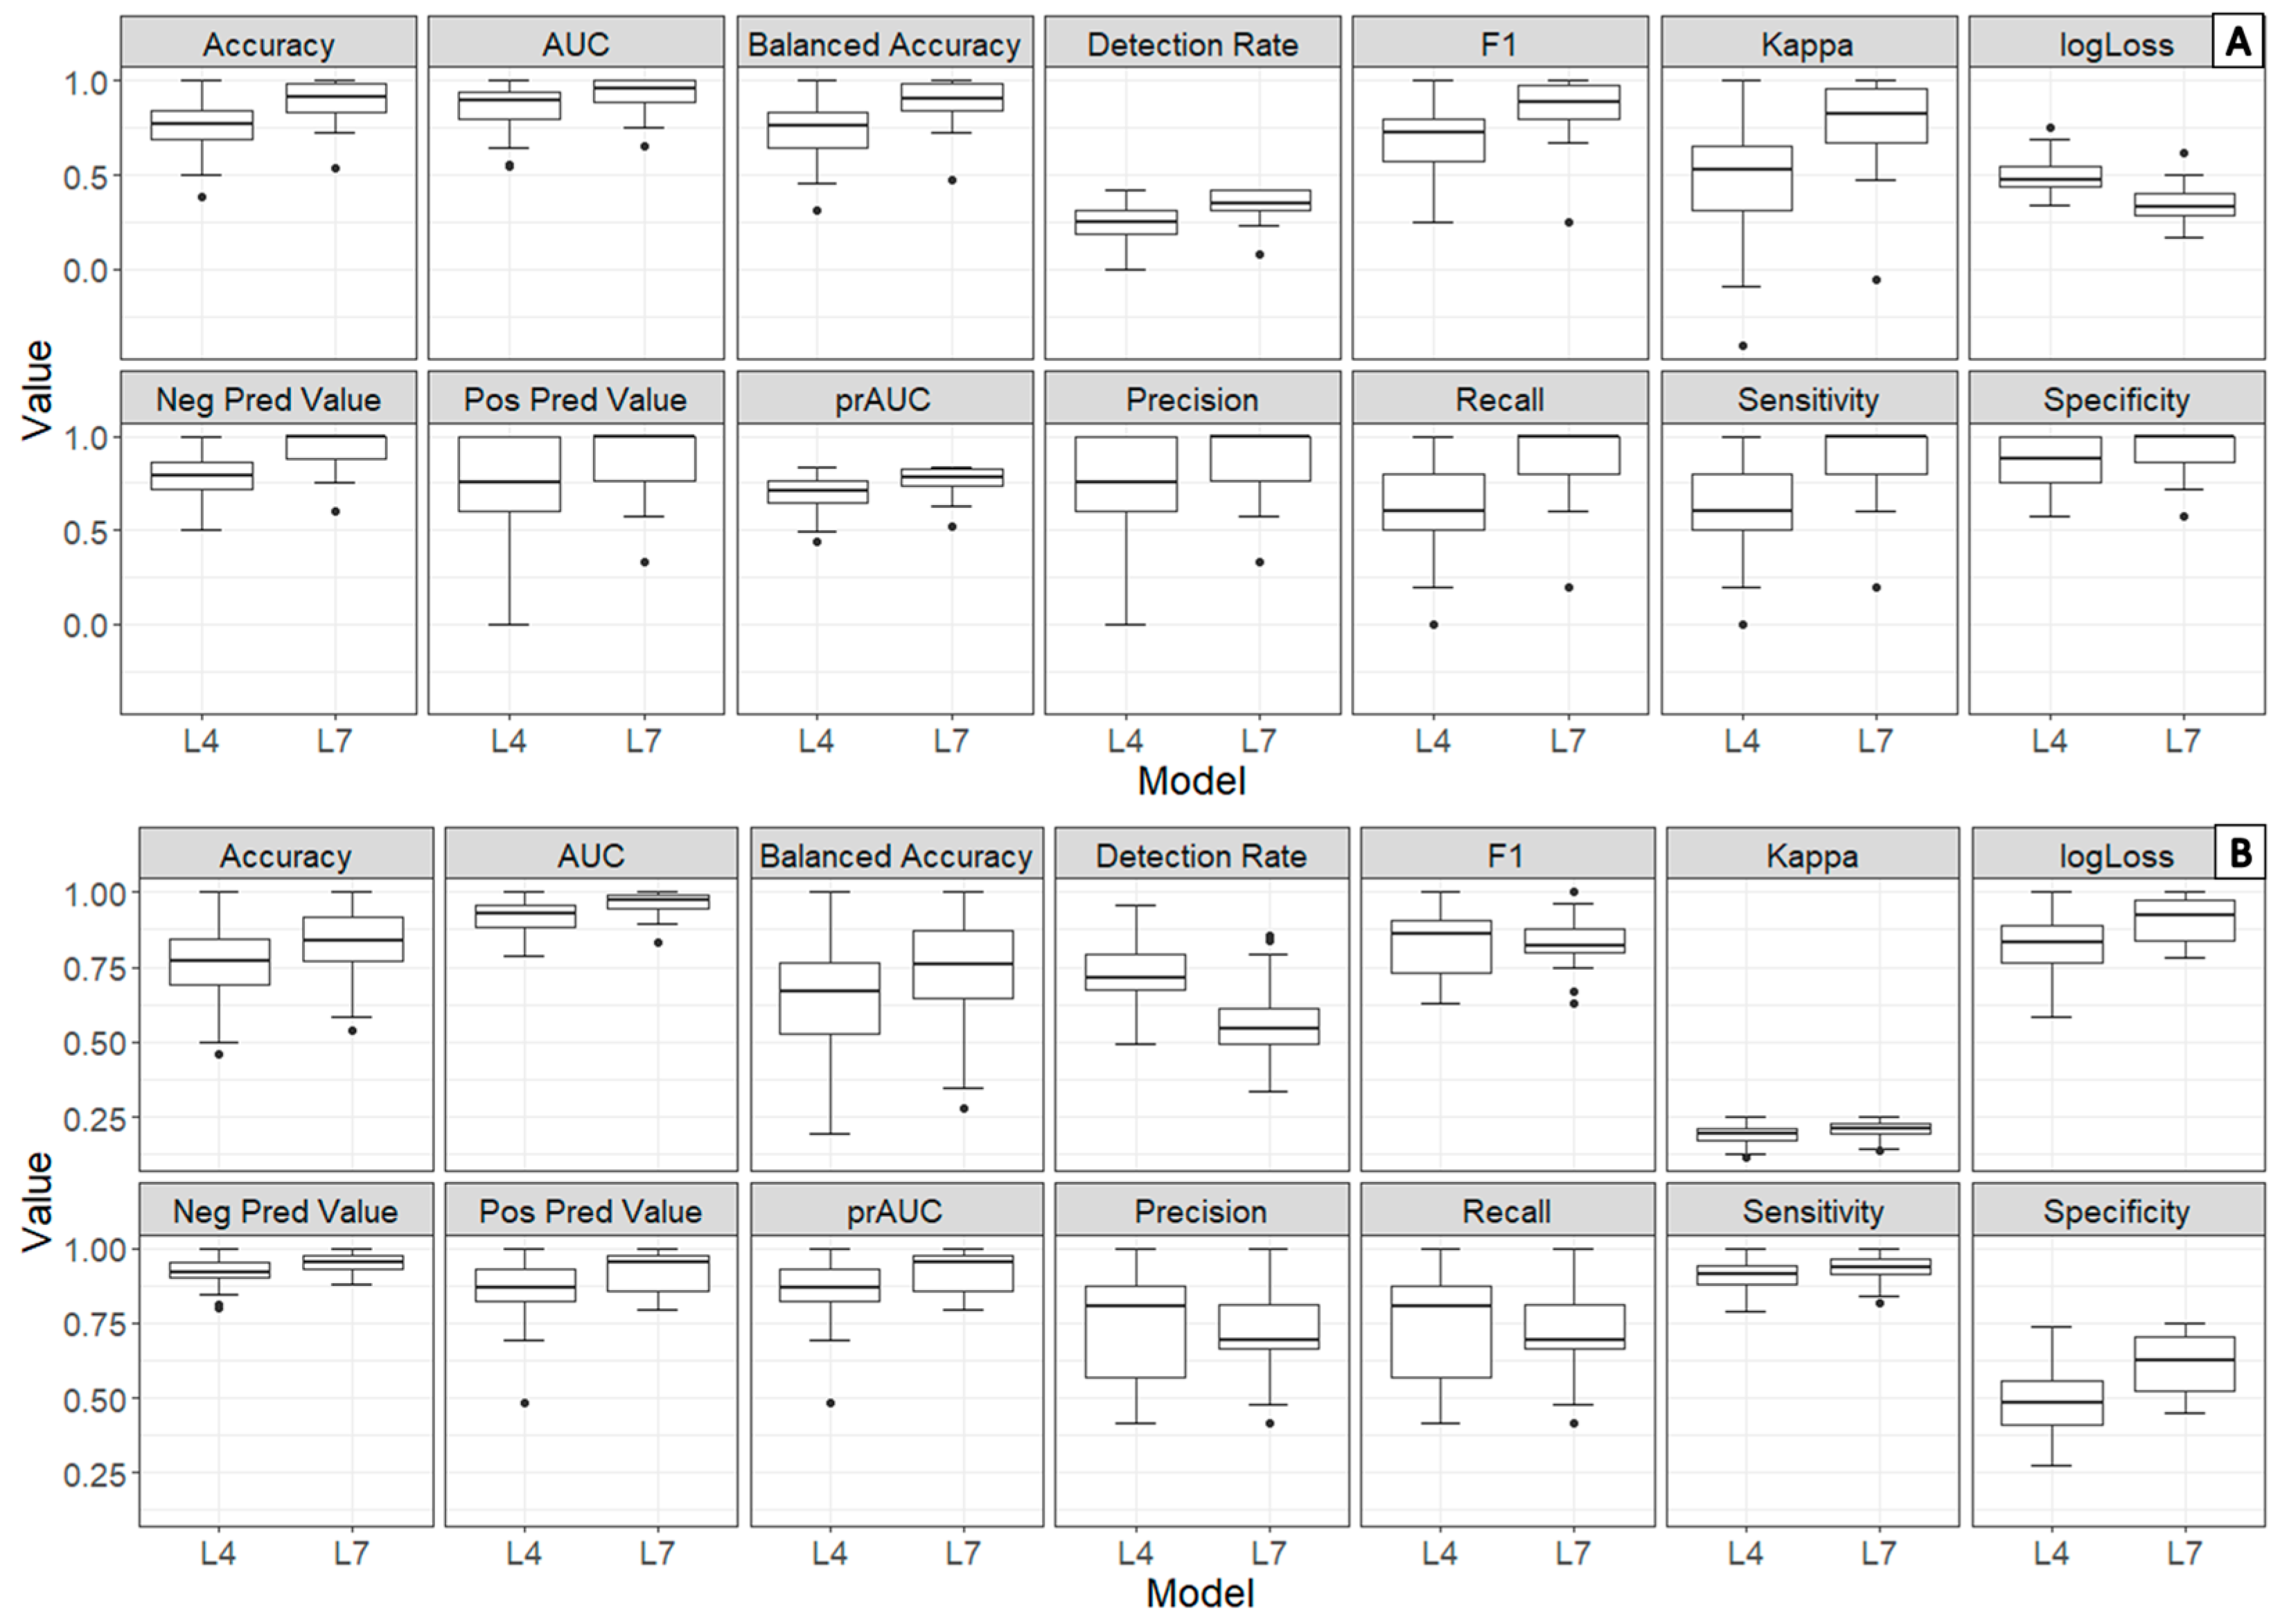
RF presents a similar behavior with respect to its classification rate using the GSD sets obtained in the different leaves of the evaluated plant. For this reason, models were generated using this algorithm, from which it was found that there are differences between the classification rates of the models generated for the presence (Figure 5A) and severity (Figure 5B) of the disease according to the leaf in which the spectral signatures were found. The models present statistical differences, given that the p values are close to zero (p-value presence = 1.535795 × 10⁻⁶; p-value severity = 0.002841602). For presence, we obtained models with an average accuracy of 75.3% and 89.3% for leaves four and seven, respectively, the data for leaf seven being more sensitive and specific. Regarding severity, the behavior was similar, although the average accuracy decreased by 6% for leaf seven.
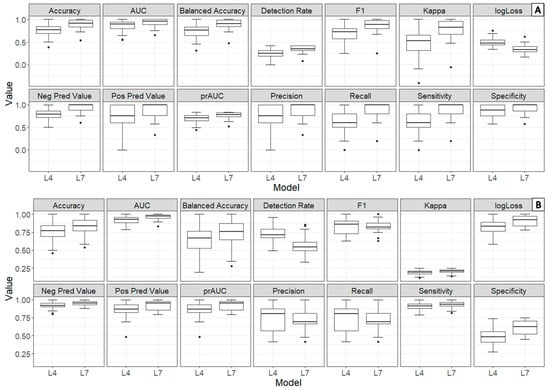
Figure 5.
Results of model evaluation metrics generated from spectral signature data captured on different leaves of potato plants (L4:UT, L7:MT). (A) RF—presence of ED—GSD set. (B) RF—severity of ED—set of GSD.
3.3. Determination of Informative Bands to Discriminate between Healthy and Diseased Plants
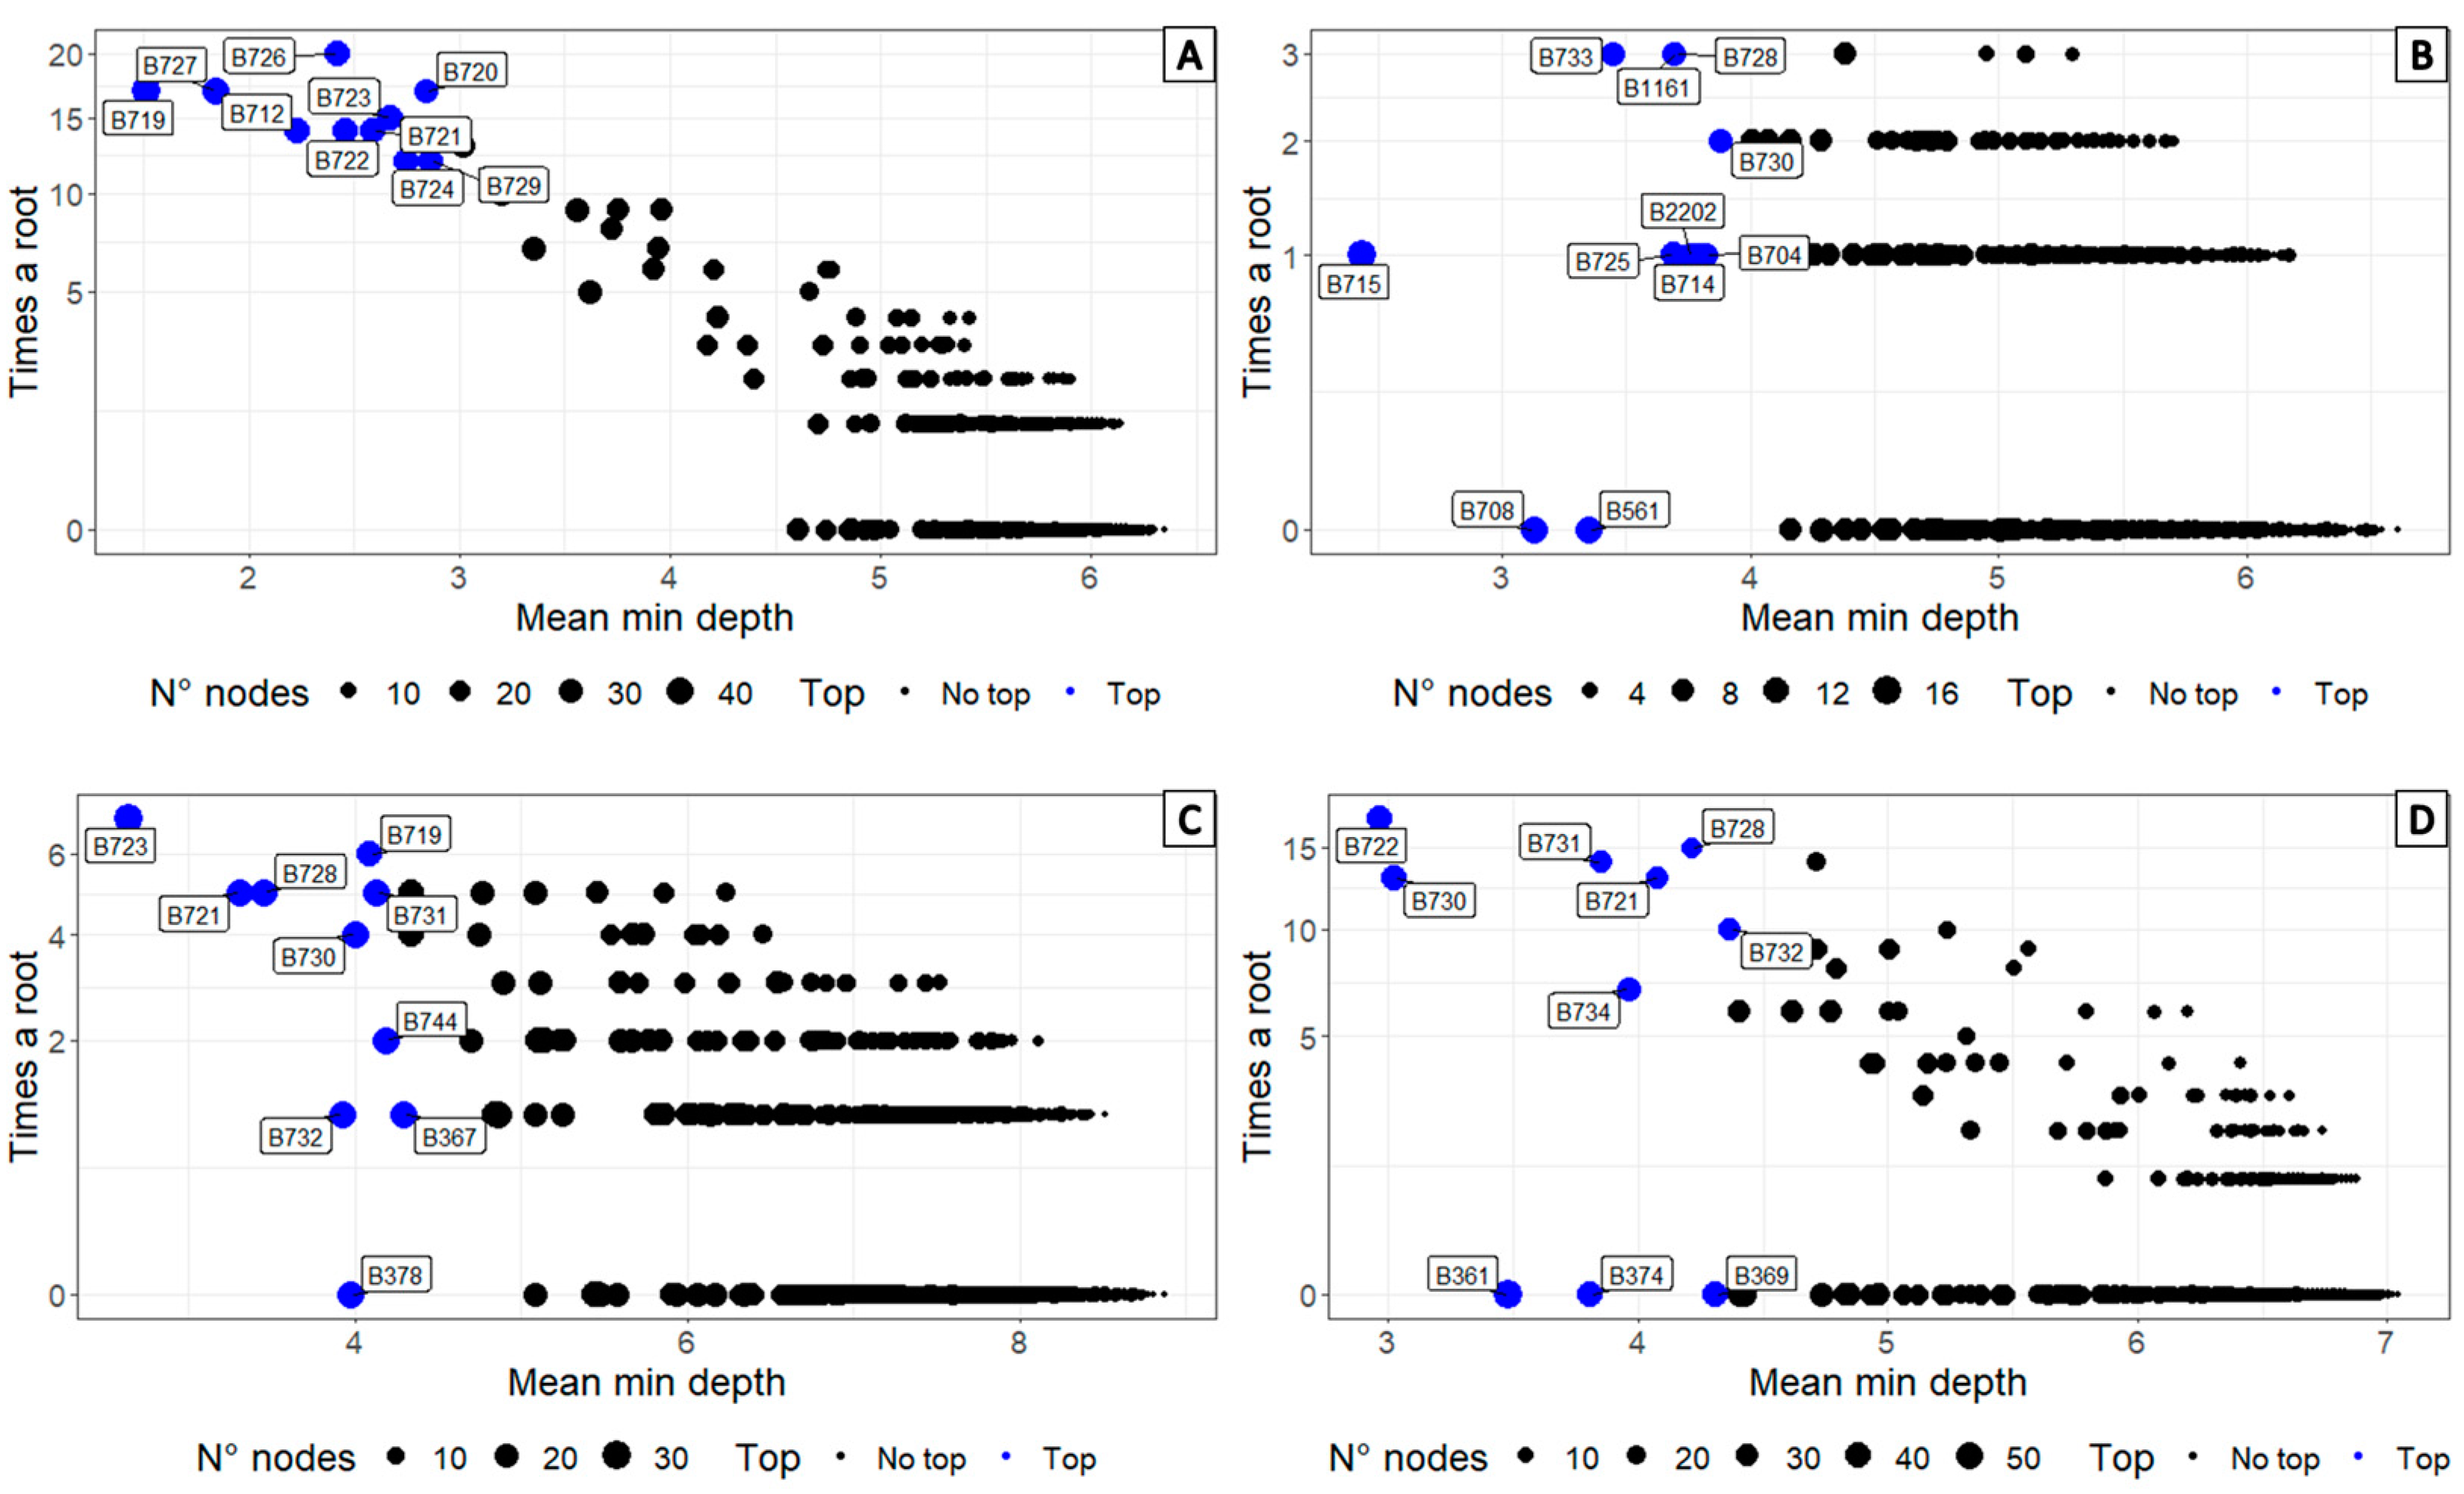
Based on the results of the models generated for the RD set, we identified the spectral bands that have a greater capacity to discriminate between healthy potato plants and those affected by PED (Figure 6), and between the severity levels of the scale used. For the data captured in leaf four, the region corresponding to the visible spectrum (380–780 nm) contains the most important bands, especially the area corresponding to red (650 to 740 nm). For the classification of the presence of PED, bands 712, 719, 722, 726, and 727 nm stand out; while for severity, bands 710, 721, 723, 728, and 730 are of greater importance, which is consistent with the results of the PCA analysis described above. By comparing the important bands per leaf, we established that the most important spectral areas are common, showing a higher discrimination capacity in the region from 710 to 735 nm between signatures from healthy plants and those with some level of disease. Furthermore, bands of great importance (Figure 6B) were identified in the ranges between 1200 and 1600 and 2300 and 2450 nm.
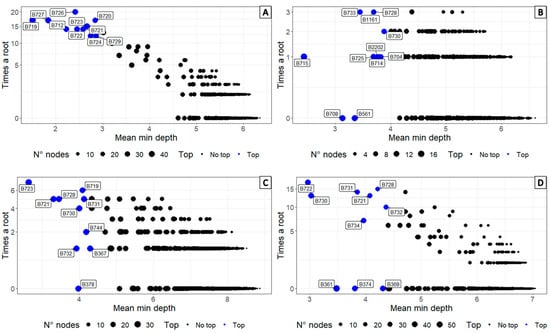
Figure 6.
Importance of multi-way classification variables applying RF to the GSD set. (A) Presence of PED—leaf four (UT). (B) Presence of PED on leaf seven (MT). (C) Severity of PED—leaf four (UT). (D) Severity of PED—leaf seven (MT).
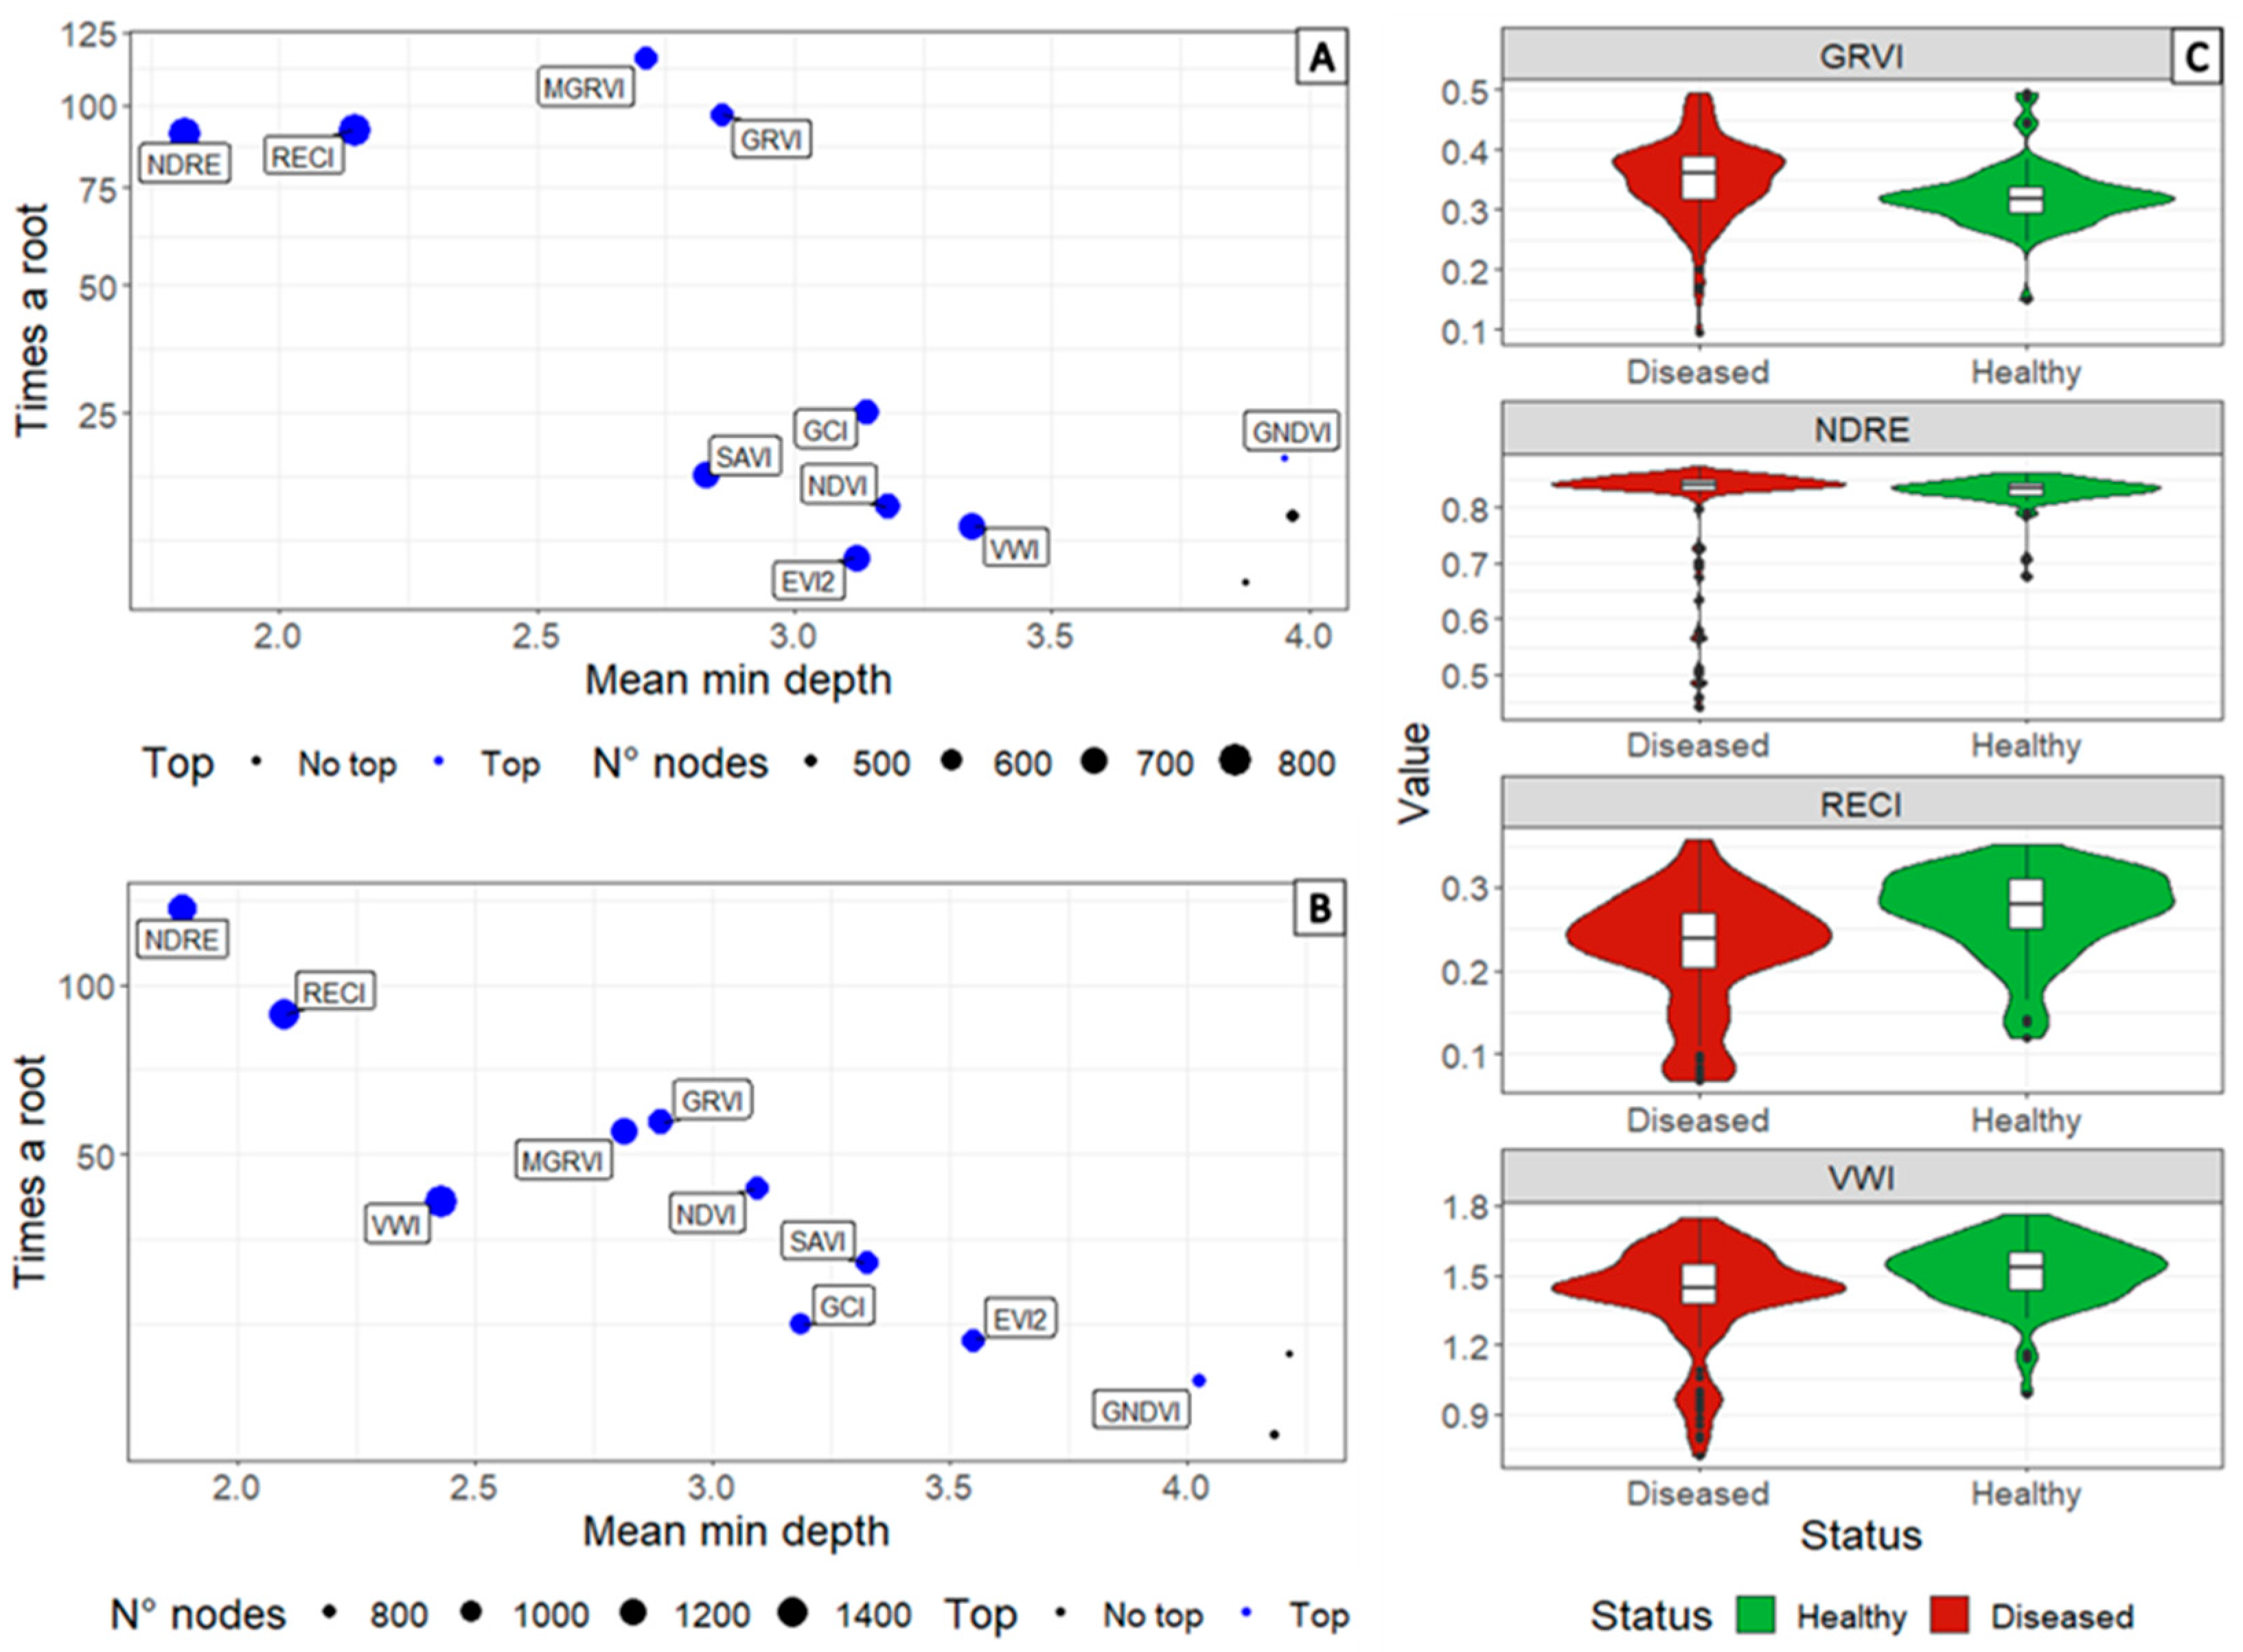
The results of the models generated from the indices calculated with the spectral signature data show classification rates of 74 and 64.8% for the presence and level of severity of ED in potatoes, respectively. This indicates that they are similar with respect to the analysis of principal components when RF is used. We identified some spectral indices with greater differentiation capacity, among which RECI, NDRE, and GRVI are notable. We found that the bands in the visible spectrum areas and the red edge were the most informative for this disease, as shown in Figure 7. The proposed VWI had an acceptable importance in the classification of presence (Figure 7A) and severity of the disease (Figure 7B) showing its potential as an estimation tool when using other means of data capture. The most informative indices with respect to spectral signature data showed a high variation between healthy and diseased plants. GRVI values in plants with the presence of symptoms of PED tend to have higher index values, while for RECI and NDRE, diseased plants tend to have lower values (Figure 7C). Regarding the VWI generated, we determined that the values associated with diseased plants tend to be lower than those of the others.
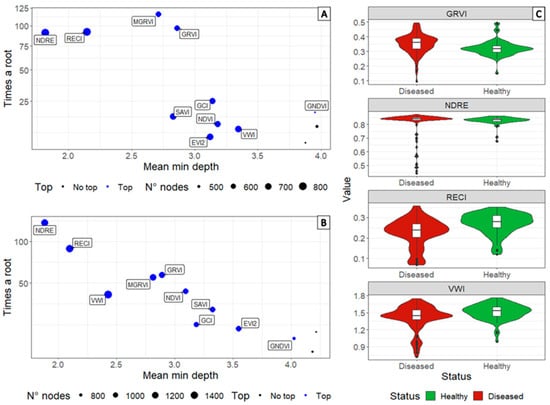
Figure 7.
Importance of classification variables using RF applied to the vegetation index data set calculated from spectral signatures captured on leaf four (UT) of plant (A) Presence of PED. (B) Severity of PED. (C) Behavior of important spectral indices in the presence of early death symptoms from Verticillium in potato plants.
3.4. Comparison of Spectral Signatures and Multispectral Camera Data Obtained in Commercial Crops
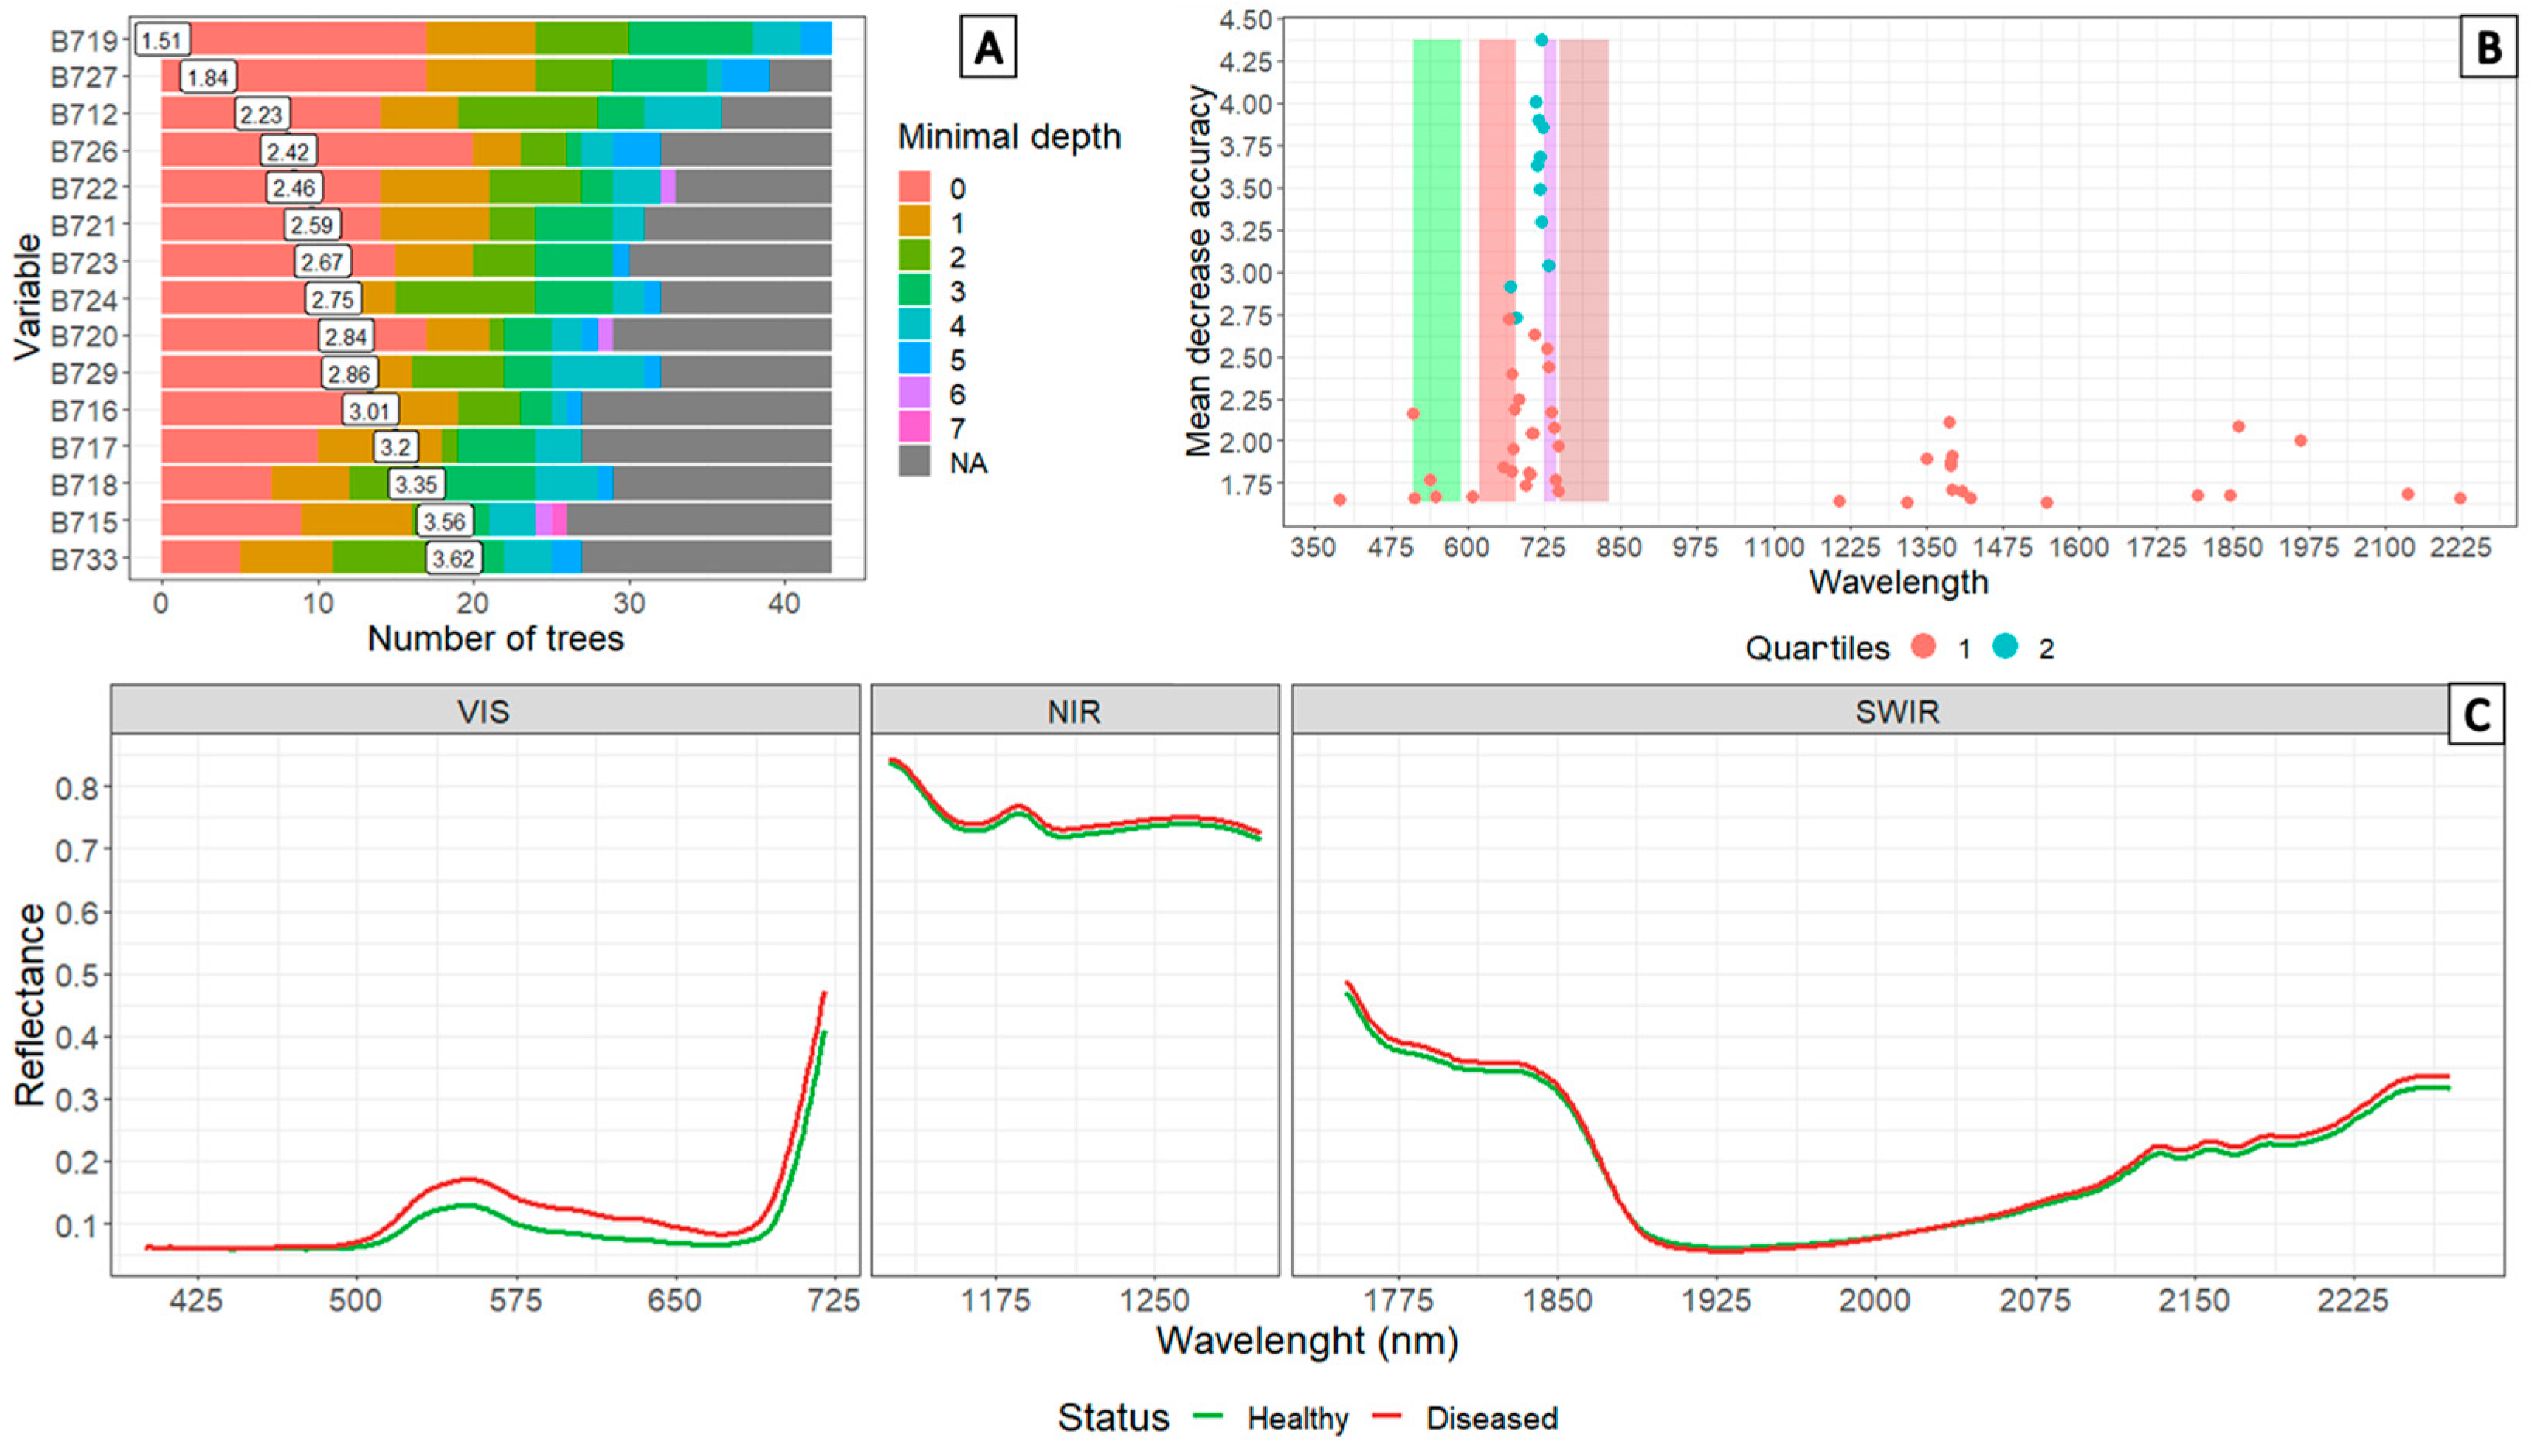
The results show that the region corresponding to the visible spectrum (380–780 nm) contains the most important bands found by the RF algorithm. Within these, the area corresponding to red includes the bands with the highest discrimination capacity (710 to 740 nm) (Figure 8A). The comparison of the multispectral camera bands with the most important bands in the spectral signatures is presented in Figure 8B. The data indicate that 18 of the informative bands found in the modeling of the spectral signatures that are in the first quartile, in terms of their importance, coincide with the regions captured by the multispectral camera, 4 corresponding to the green region, 7 to the red, and 7 to the red edge (Figure 8C).
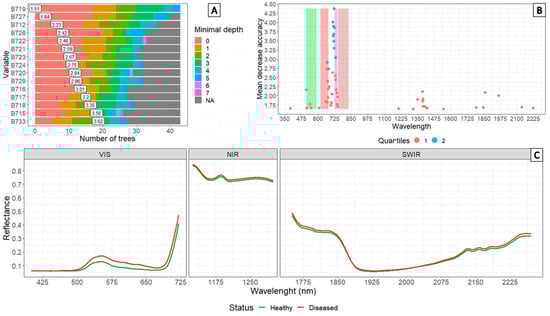
Figure 8.
Informative bands on the classification made using RF for the spectral signatures of healthy Var. Diacol Capiro potato plants and those with symptoms of early dying. (A) Bands with significance. (B) Comparison of important bands with respect to the spectra of the Parrot Sequoia camera. (C) Spectral behavior in areas of importance for the discrimination of PED symptoms in potato plants.
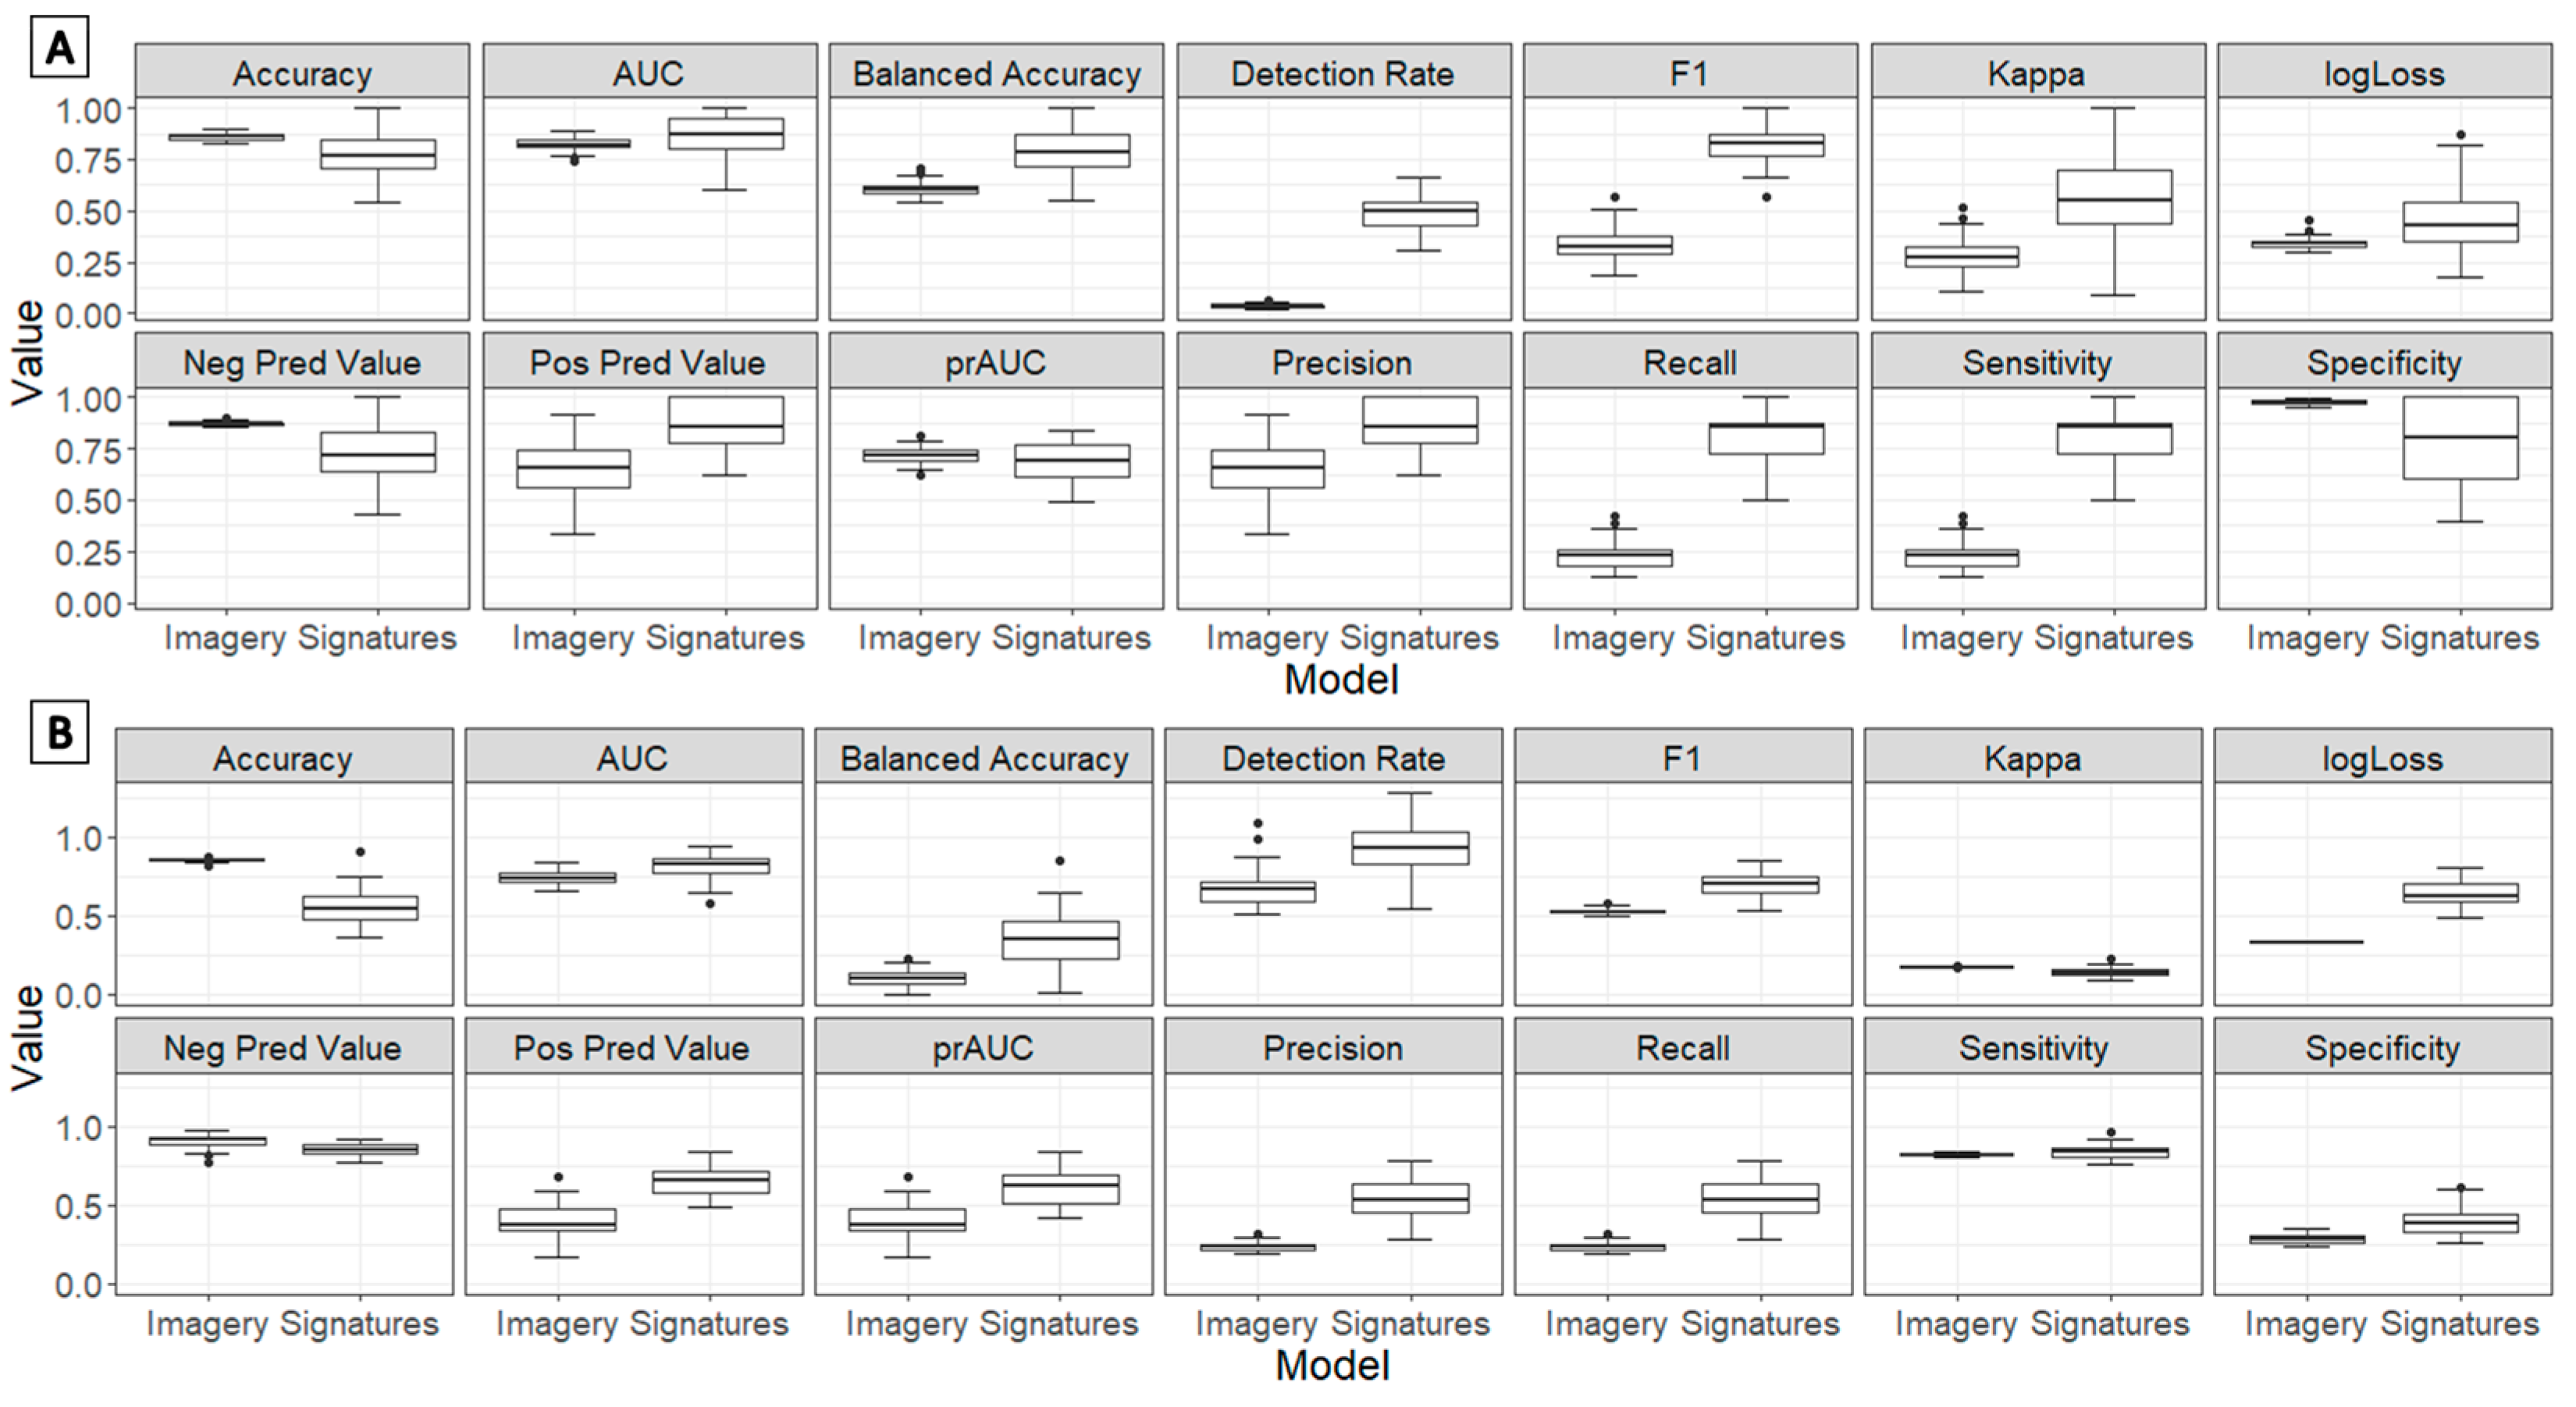
The results indicate that the models generated from the two data sources have quite acceptable classification accuracy rates. This is represented by accuracy values greater than 80% for the classification of the presence of disease symptoms. On the contrary, for severity, the rates were 84% with data extracted from images and 56% for spectral signatures (Figure 9). Despite this, the average sensitivity and specificity decreased by approximately 30% for the classification of the presence and severity of MT compared to the indices calculated from the multispectral imaging data (Figure 9B). In the models evaluated, significant differences (p-value = 0.00232086) were found between the accuracy of the classifications made (Figure 9A). Regarding the classification of the different levels of severity of the disease (Figure 9B), there were differences between the generated models (p-value = 8.269619 × 10⁻¹⁰).
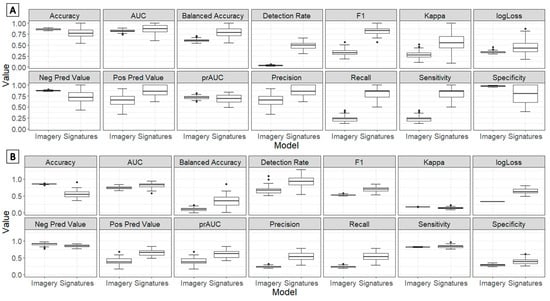
Figure 9.
Results of the evaluation metrics of the models generated for the presence and severity of ED from the indices calculated with spectral data. (A) Presence. (B) Severity.
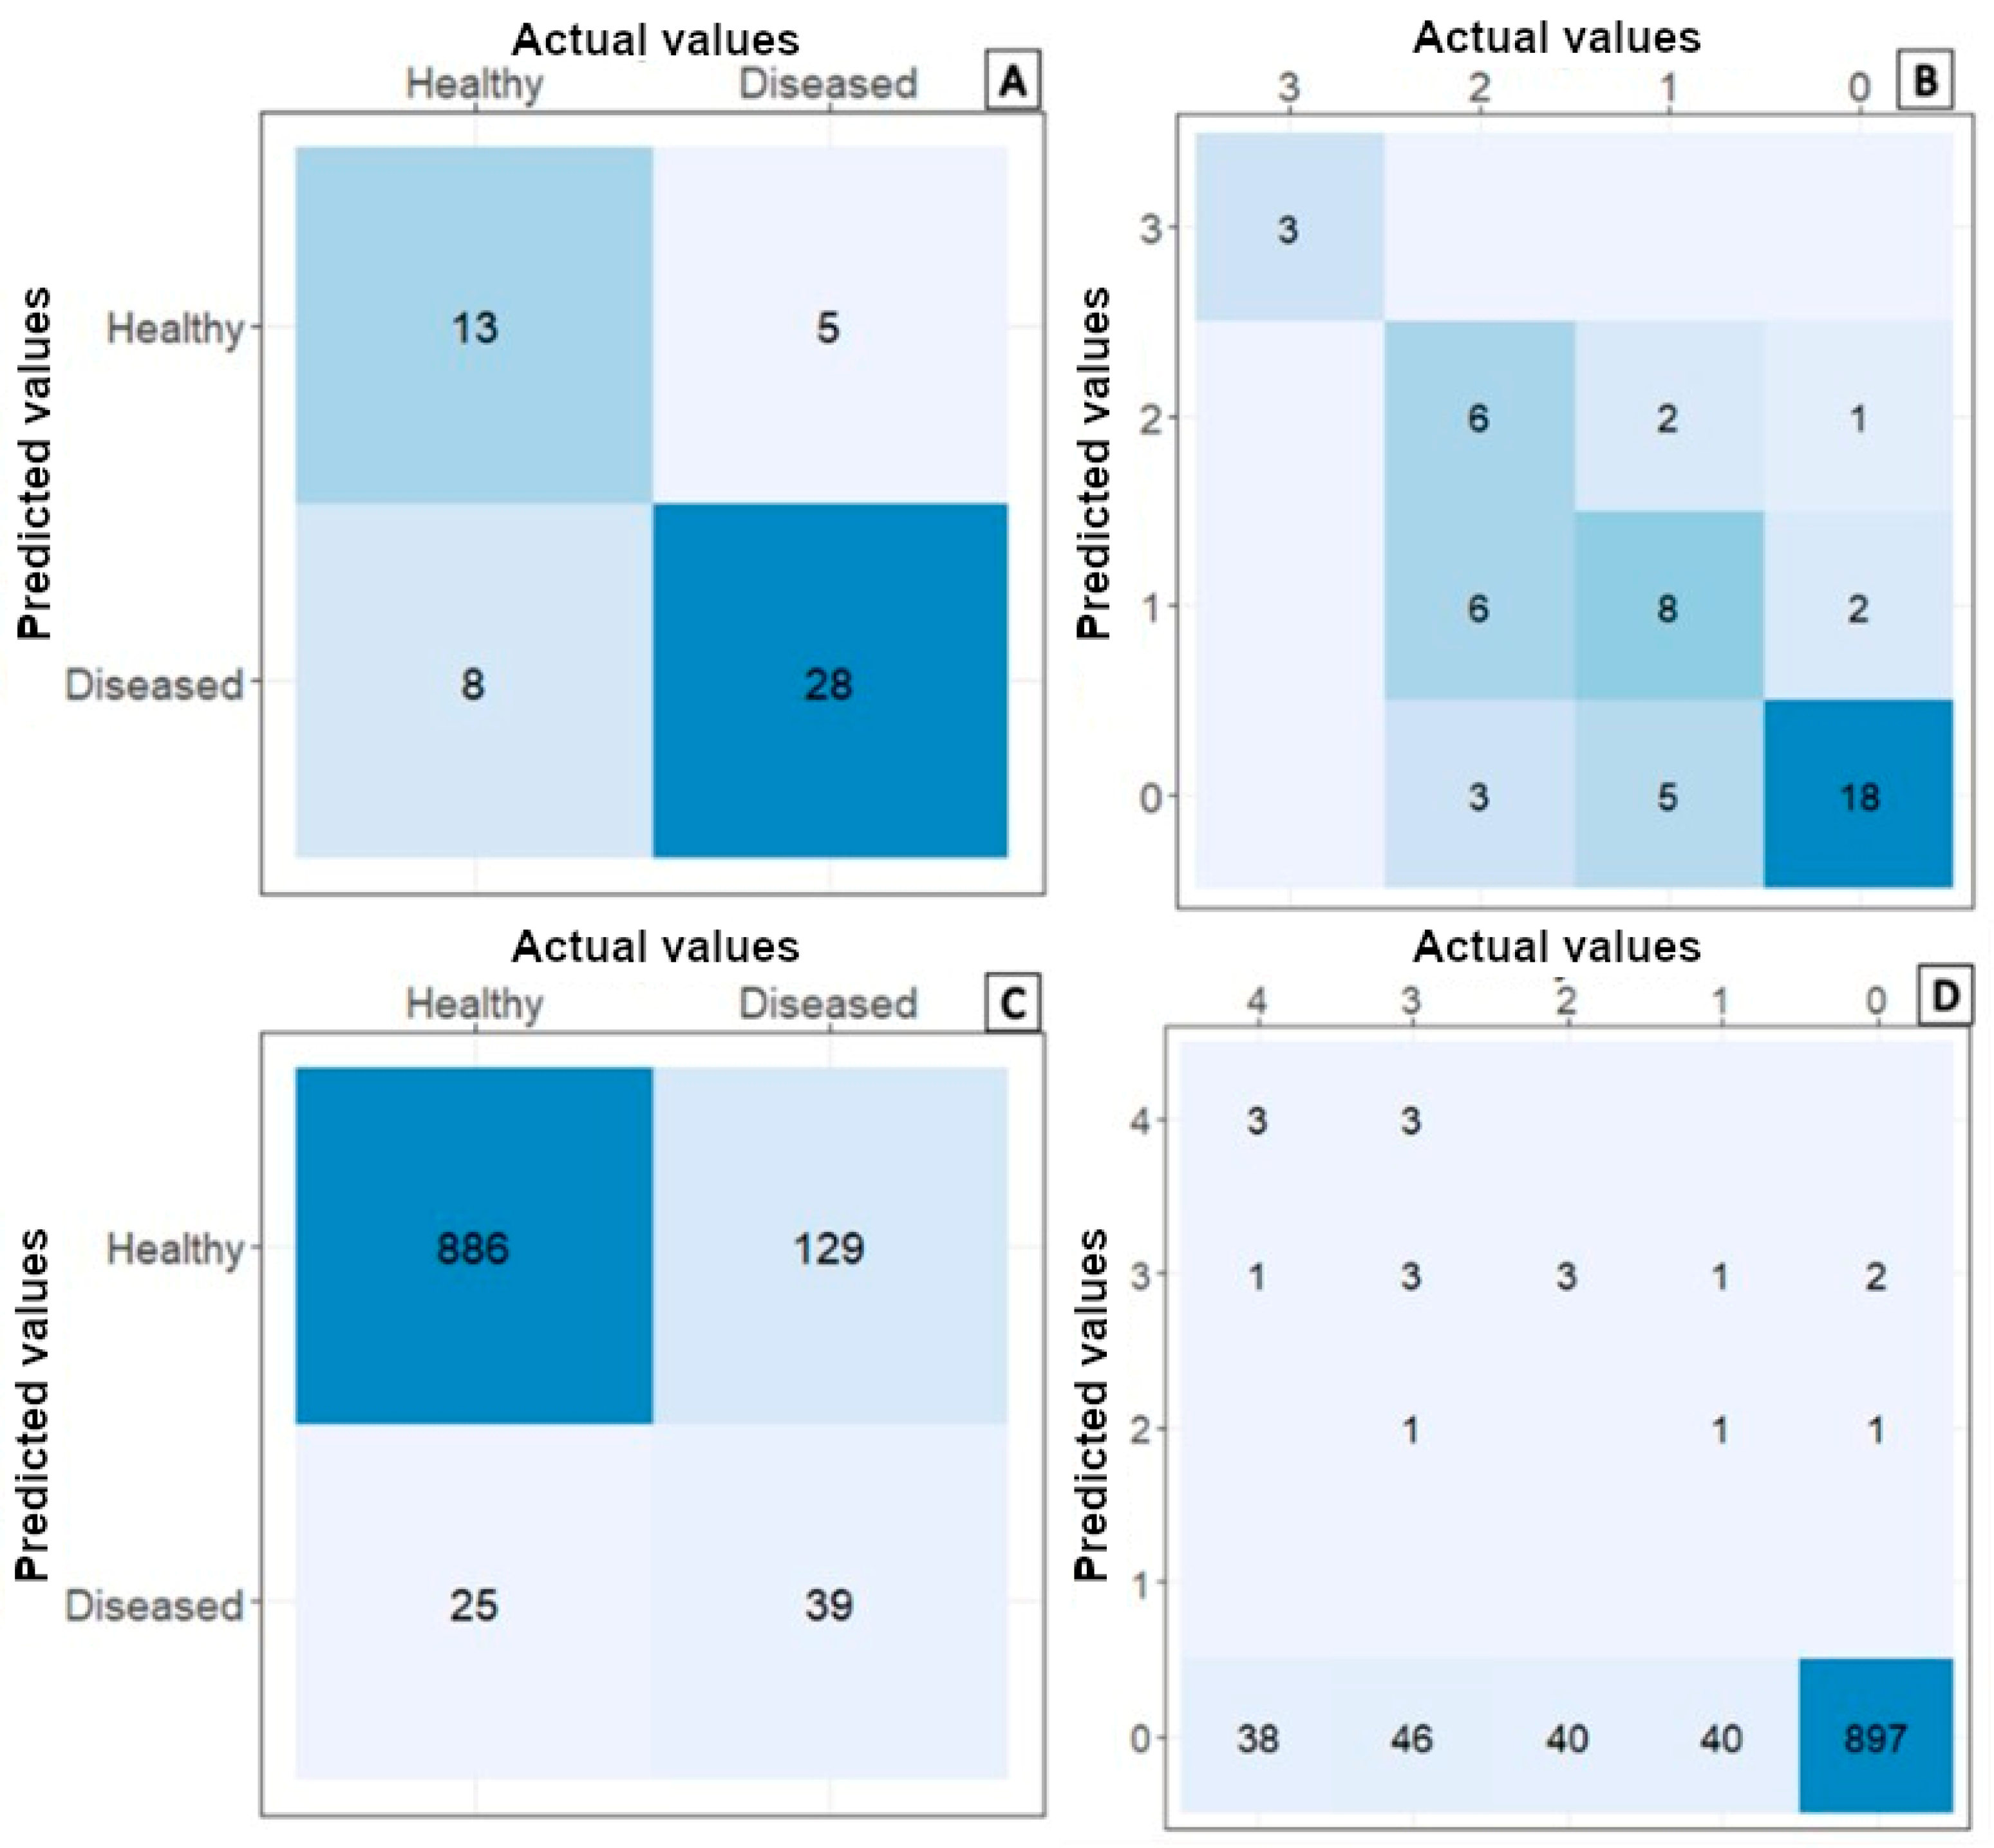
Regarding the classification results for the presence and severity of the disease from the spectral indices (Figure 10A), we found that high sensitivity and specificity are obtained for the presence of symptoms from the spectral signatures, with the spectral indices showing a high differentiation capacity between healthy and diseased plants. This is represented in the differentiation capacity of different levels of severity in plants. We determined that classifications are sensitive but have limited specificity, showing that the initial stages (levels 1 and 2) of the disease are difficult to differentiate (Figure 10B). In the case of the indices calculated from multispectral images, we observed a similar behavior for the presence of the disease with respect to the spectral signatures; however, the classification is less specific (Figure 10C). However, when classifying the severity of PED, we were able to identify a greater capacity to differentiate high levels of the disease (levels 3 and 4), but the models were found to have low specificity (Figure 10D).

Figure 10.
Confusion matrices of the presence and severity classifications of PED from indices calculated with spectral data. (A) Presence—spectral signatures. (B) Severity—spectral Signatures. (C) Presence—multispectral images. (D) Severity—multispectral images.
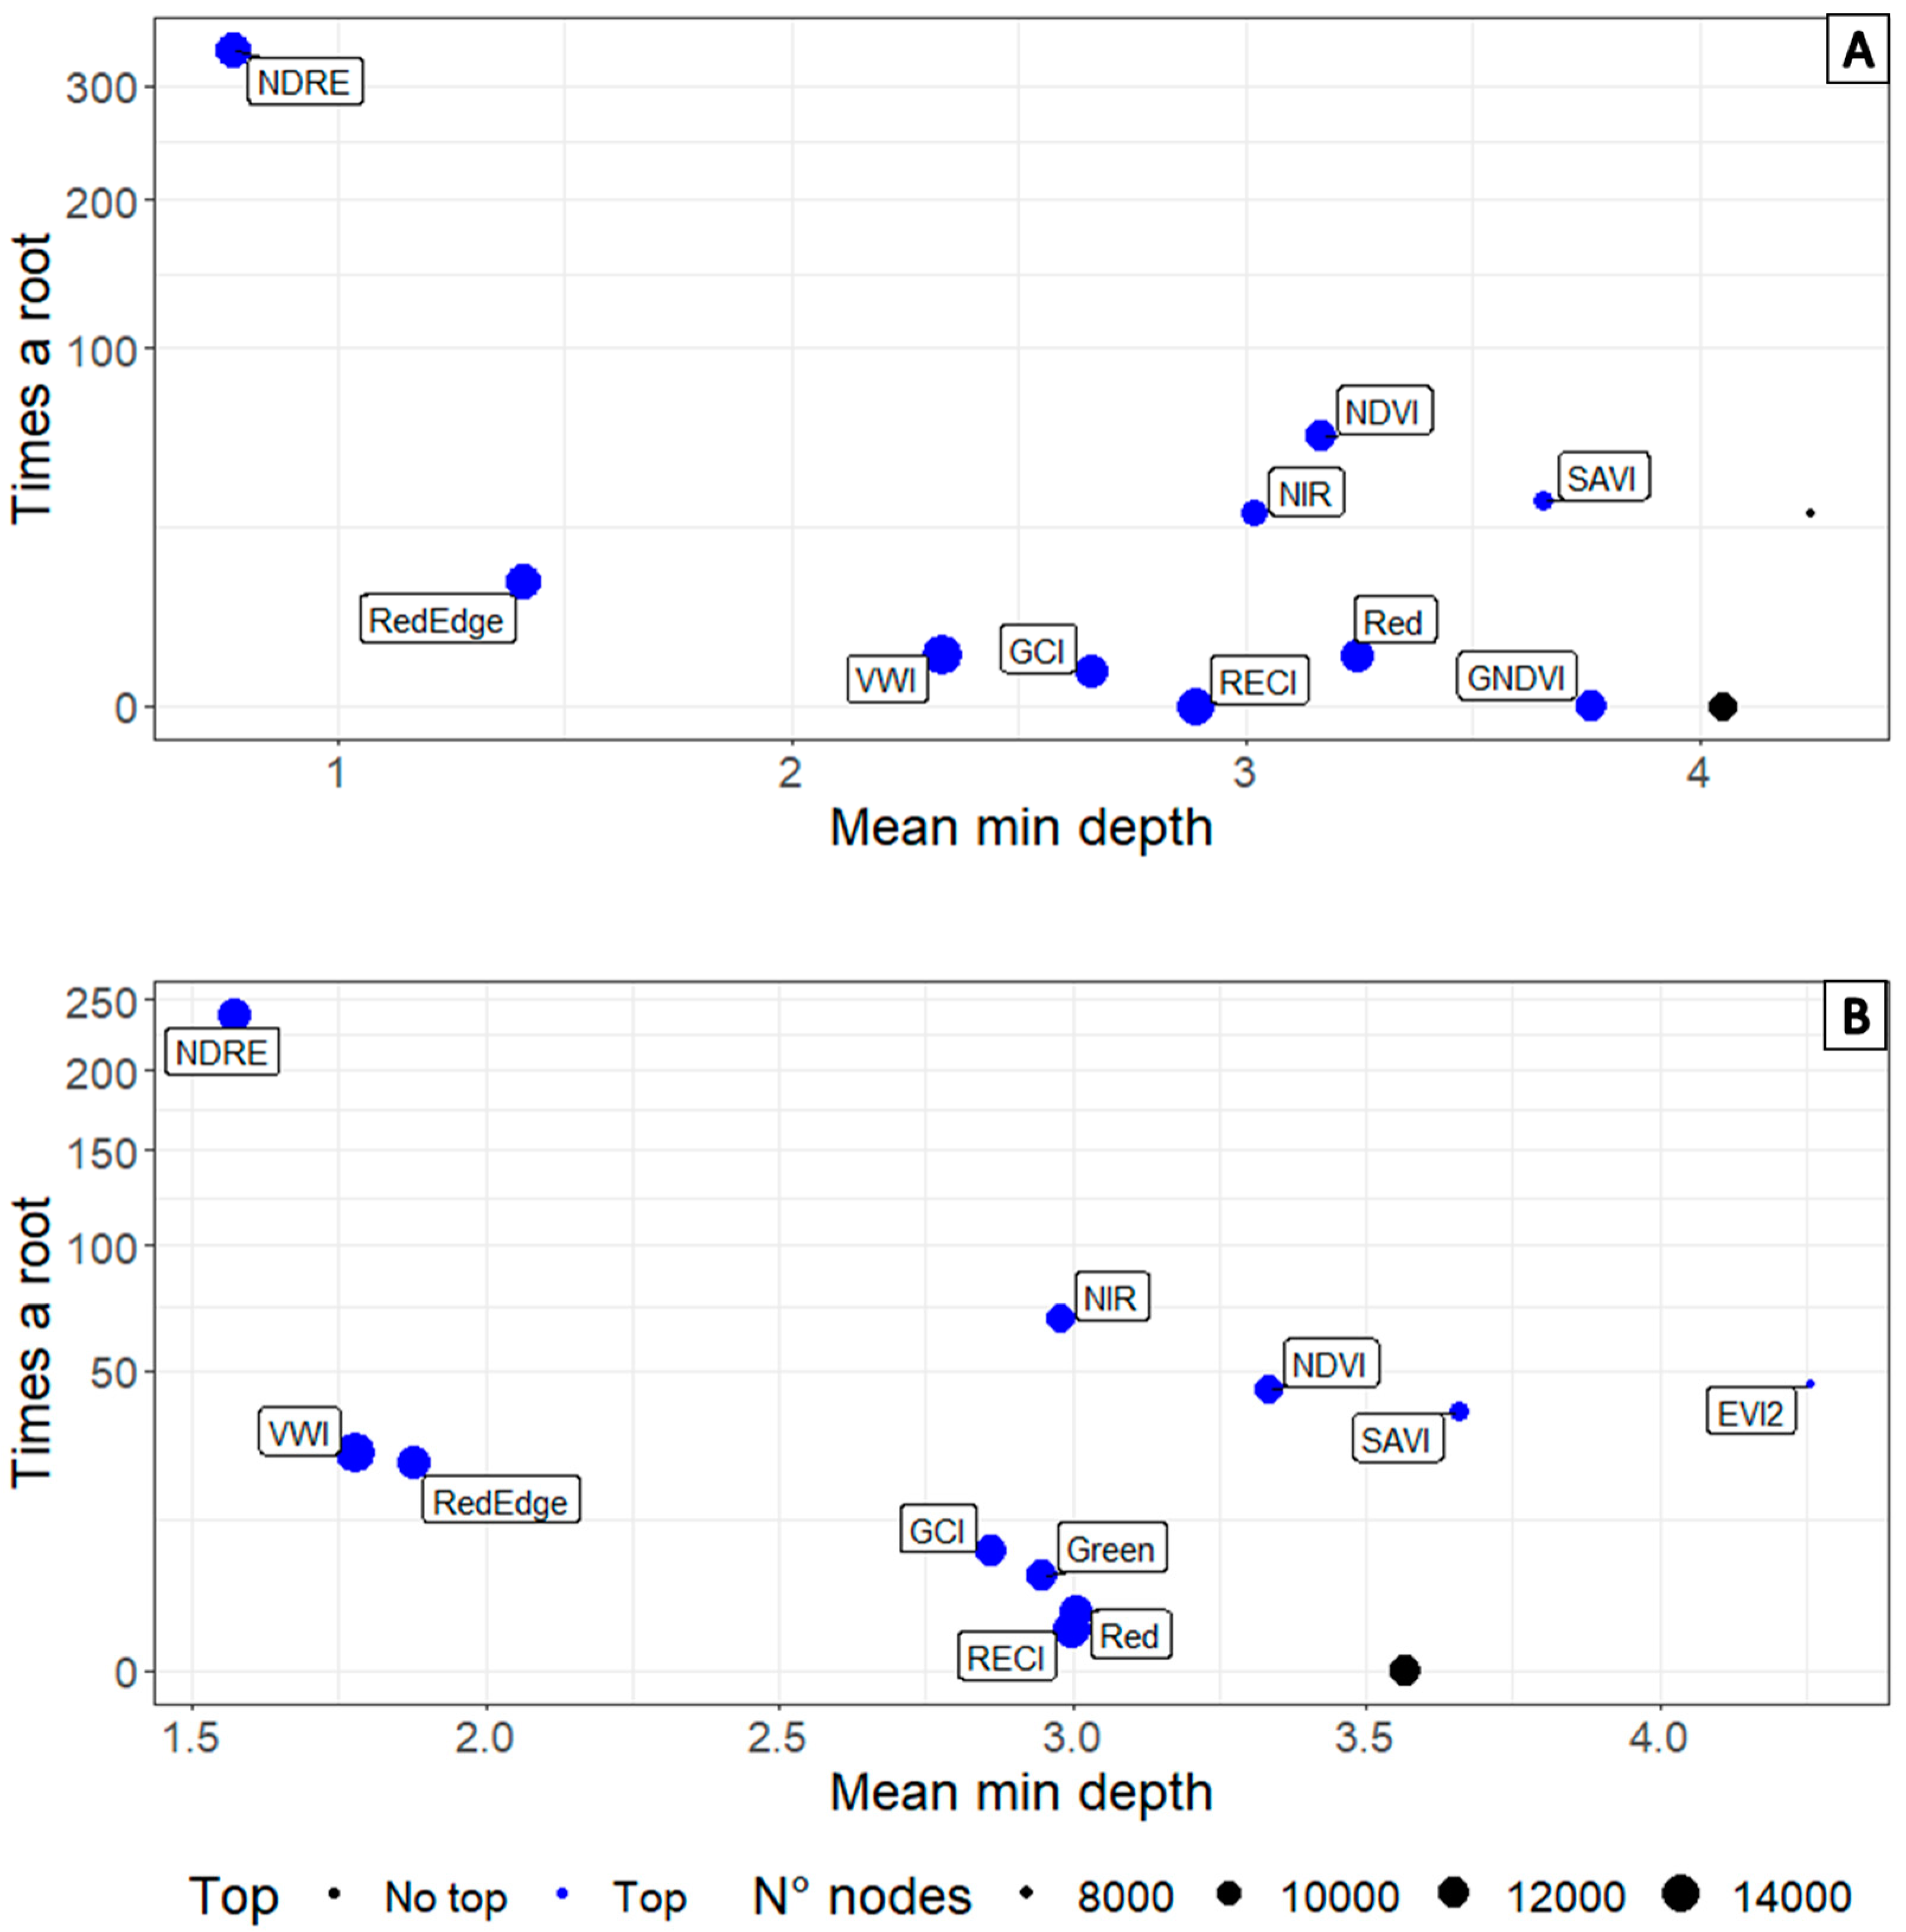
We determined that the banded indices in the visible spectrum and the red edges were the most informative in terms of discrimination regardless of the source of the data (Figure 11). The most important indices were the RECI, NDRE, and GRVI obtained from the spectral signatures and the NDRE, RECI, VWI, and GCI obtained with the multispectral images. However, the camera bands (red, green, red edge, and NIR) were observed to be important as predictor variables in the models. Meanwhile, the proposed index (VWI) is of high importance for presence and severity, with better behavior in the indices calculated for multispectral images.
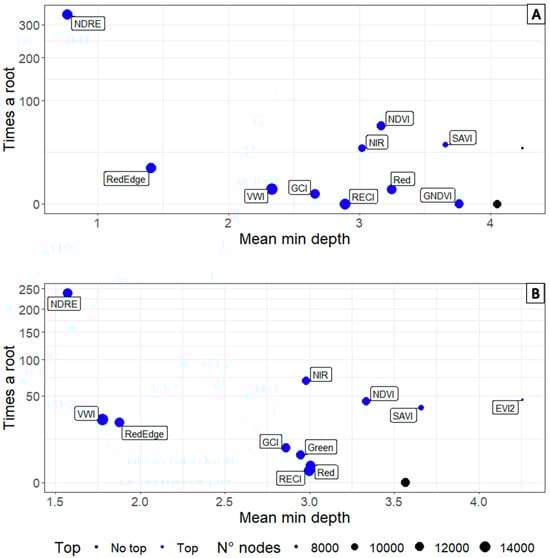
Figure 11.
Spectral information indices regarding healthy Var. Diacol Capiro potato plants and those with early dying symptoms, using the RF algorithm. (A) Indices calculated from the mean values of the spectral areas. (B) Indices made from multispectral images.
4. Discussion
Recent studies related to the field of geospatial data classification and analysis have used approaches that focus on the use of spectral signature data or multispectral imagery independently [21]. However, in this study, we found that the comparison of data generated from spectral signatures and multispectral images can provide significant benefits and improve classification accuracy, as it allows for the appropriate selection of variables of interest for disease research.
Several algorithms were compared to classify potato plants with different degrees of early dying under two conditions (artificial and natural inoculation) using signatures and spectral images, with the aim of establishing a method of classification and evaluation of the importance of variables that allow for the differentiation of plants with PED under two levels of spectral detail. Regarding the spectral signatures, all algorithms had a similar average accuracy, so there were no statistical differences, allowing the use of RF in most of the processes performed. However, the severity classification rate was negatively affected at low levels of the scale used (1 and 2). Despite this, it is observed that the algorithms used have classification approaches that are sensitive and specific enough to classify the different levels of the severity scale, showing their potential use in the detection of pathogens in plants.
Regarding the classification of the presence of PED, the algorithms (RF, SVM, and ANN) did not differ statistically in terms of accuracy. This shows that although these are different approaches, they are all capable of using the spectral variations presented by plants as discriminants [22,29,42], making them effective tools for the identification of differential bands between diseased and healthy plants and variations in severity. The generated models showed a tendency to obtain the same spectral areas as important variables in their predictions [22], indicating that these predictors may be the key to the detection of PED in plants.
The prior treatment of the spectral signature data improves the results when using the PCA discrimination method [22]. In this case, the GAP segment showed a high potential since it allowed for a greater differentiation of the spectral areas evaluated in addition to reducing the variability in the accuracy of the models generated. However, the use of multiple feature selection methods or a suite of multiple methods on the spectral data is recommended. This is because the selected wavelengths are individually identified, establishing areas with a high classification potential [22,43], allowing higher accuracy rates to be obtained with the algorithms.
Shin et al. [29] also reported classification rates greater than 80%, which shows the consistency of the results obtained in this investigation. The regions of the spectrum (710, 721, 723, 728, and 730) identified in this study may facilitate their use at other scales, since most multispectral sensors are focused in the red and near-infrared regions. The finding in this study that the 710 to 750 nm region is highly significant coincides with that reported by Haagsma et al. 2023 in the wheat mosaic of olive crops; this region has not been reported in relation to ED and could be used for future research. The bands identified in this study have been reported in different crops, notably potatoes [29,42], peanuts [22], tomatoes [17], and olives [44]. These bands are related to the decrease in pigments such as chlorophyll and carotenoids, the water content, and the accumulation of sugars. In the case of ED, these spectral changes may be due to the plugging and vascular damage caused by this disease.
According to the identified spectral areas, the increase in the visible spectrum region (400 to 700 nm) in diseased plants suggests a decrease in pigments such as chlorophyll and carotenoids in potato leaves [17]. The reflection around 680 nm is controlled only by chlorophyll a [45], an area that had a different behavior between plants in the presence of PED symptoms. The increase in reflectance in the bands from 1500 nm, mainly in the severity classification of the leaves of plants affected by PED, shows a possible effect on the water content of the evaluated plants. Some bands identified as important are in regions related to leaf structure (780 to 1450 nm), water content, and sugar and starch (>1500 nm) [29,46]. Furthermore, wavelengths of 1660 and 2200 nm are associated with phenolic compounds that can accumulate in the cell in response to attack by pathogens [25,29]. The 1596–2396 nm region was evaluated by Shin et al. [29], who found similar results, where the early detection of potato plants with symptoms related to PED was achieved using these spectral areas.
Compared to foliar pathogens, which have a direct interaction with the leaves of the plant, soil pathogen infection first affects the root or vascular system of the plants before inducing any foliar symptoms [22]. Therefore, the symptoms observed in the aerial part of the plant are advanced expressions of the disease, limiting the scope of tools for the detection of alterations in the initial stages of infection [14,28,29]. For this reason, the evaluation of the third medium leaf (L7: MT) carried out in this investigation may have a great potential to identify symptoms in the initial stages of the development of this disease in potato plants.
The spectral indices related to the red and near-infrared regions were the most relevant in the discrimination of healthy and diseased plants and severity levels of PED. This was evidenced in the significance comparison performed for the models generated from the data from both sensors (spectroradiometer and multispectral camera). Of these indices, two (NDRE and RECI) take into account a red edge band related to chlorophyll absorption, which means that their values are more affected by changes in chlorophyll content within plants [47]. This is related to the chlorosis symptoms found in the leaves of plants affected by PED. In this study, the mean GRVI values of the diseased plants were found to be close to each other, which has been associated with the change in leaf greenness and senescence [48]. These spectral indices can be used as early detection tools at different levels of proximity (near and remote sensors), which is a basis for the implementation of crop management strategies based on elements of targeted or site-specific strategies (delimitation of outbreaks, eradication, and the potential use of fungicides, among others).
Traditionally, analyses assessing the spectral response of plants to different causal agents of disease in plants are carried out under controlled conditions or in the field. Various types of equipment are used, ranging from manual spectroradiometers to fixed devices and spectral cameras mounted on drones. These approaches have typically been conducted in isolation, resulting in incomparable and inconclusive results. In this regard, our work represents a methodological advancement in data analysis and proposes an index that integrates spectral responses to plant disease under both controlled conditions and field settings using multiple spectral sensors.
In future studies aimed at the early detection of diseases in plants, particularly those caused by vascular pathogens such as PED, it is suggested that the evaluation of changes generated by the development of symptoms in physicochemical terms in infected plants incorporates visual evaluations that generate qualitative or quantitative variables [29]. These evaluations can include, for example, the measurement of chlorophyll concentration or the detection of changes in cell structure, allowing for the creation of indicators of the initial states of infection in the evaluated plants. In this way, accurate and objective data can be obtained related to the development of pathogen infection in plants, which is essential in order to conduct a proper comparison of variables captured with proximal and remote sensors in commercial crops.
Our findings present a range of alternatives with potential applications in field production systems for the implementation of indirect detection tools for a late-expression disease such as PED. The ability to deploy rapid tools could facilitate their inclusion into an integrated disease management program, focusing on early, quick, and accurate diagnosis. Furthermore, the identification of informative spectral regions for direct PED detection could guide the development of low-cost sensors suitable for field conditions.
5. Conclusions
In conclusion, the proposed use of spectral signature data and multispectral images used in this research is an initial step that should be considered for the effective application of detection approaches in the field, since by considering spectral information at different levels, such as contextual and spatial, we can obtain more reliable and robust results in the analysis of the disease. The capacity and potential of spectral data in the detection of potato plants infected with early death caused by Verticillium spp. in various stages of disease development were demonstrated. The different regions of the spectrum (710–735/1200–1600/2300–2450 nm) identified play a crucial role in the identification of symptoms of PED, with the 710–750 nm range being particularly relevant. These regions can be exploited in the creation and implementation of multispectral sensors that, together with spectral indices such as RECI, NDRE, VWI, and GRVI, and ML algorithms such as RF, become essential components in the development of methods for the indirect detection of the disease in potato crops.
Author Contributions
Data capture: W.A.L.-R. and L.A.M.-V. Conceptualization and Methodology: W.A.L.-R., S.G.-C., C.A.L.-S. and J.G.R.-G. Investigation: W.A.L.-R., L.A.M.-V., S.G.-C. and J.G.R.-G. Validation and Data curation: W.A.L.-R. Software: W.A.L.-R. Writing and Review: W.A.L.-R., L.A.M.-V., S.G.-C., C.A.L.-S. and J.G.R.-G. Funding acquisition: S.G.-C. and J.G.R.-G. All authors have read and agreed to the published version of the manuscript.
Funding
This research was developed within the framework of the project “Study of Verticillium and a pathology of unknown origin in potato: Approach to detection, epidemiology, management and economic importance”, code HERMES 49825, funded by the Universidad Nacional de Colombia (UNAL) and the Fondo Nacional de Fomento de la Papa (FNFP), administered by FEDEPAPA.
Data Availability Statement
The data associated with this study have not been deposited in a publicly available repository. Data will be available upon request.
Acknowledgments
We would like to thank the Colombian potato sector represented by the Fondo Nacional de Fomento de la Papa (FNFP), administered by FEDEPAPA, for the funding and intention to promote the development of potato crop research.
Conflicts of Interest
The authors declare that they have no known competing financial interests or personal relationships that could appear to influence the work reported in this paper.
Appendix A
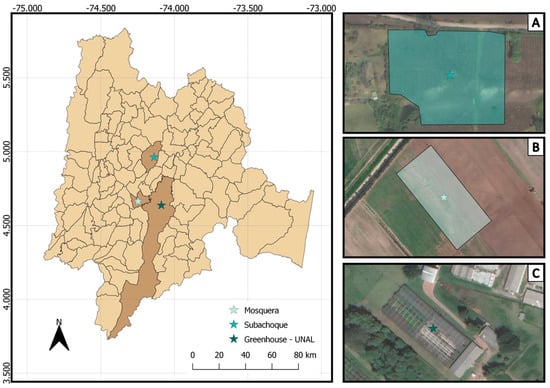
Figure A1.
Location of study areas, two experimental plots developed in potato-producing areas in Cundinamarca, and a greenhouse trial located in Bogotá DC, the capital of Colombia. (A) Field—Subachoque. (B) Field—Mosquera. (C) Greenhouse—UNAL.
Figure A1.
Location of study areas, two experimental plots developed in potato-producing areas in Cundinamarca, and a greenhouse trial located in Bogotá DC, the capital of Colombia. (A) Field—Subachoque. (B) Field—Mosquera. (C) Greenhouse—UNAL.
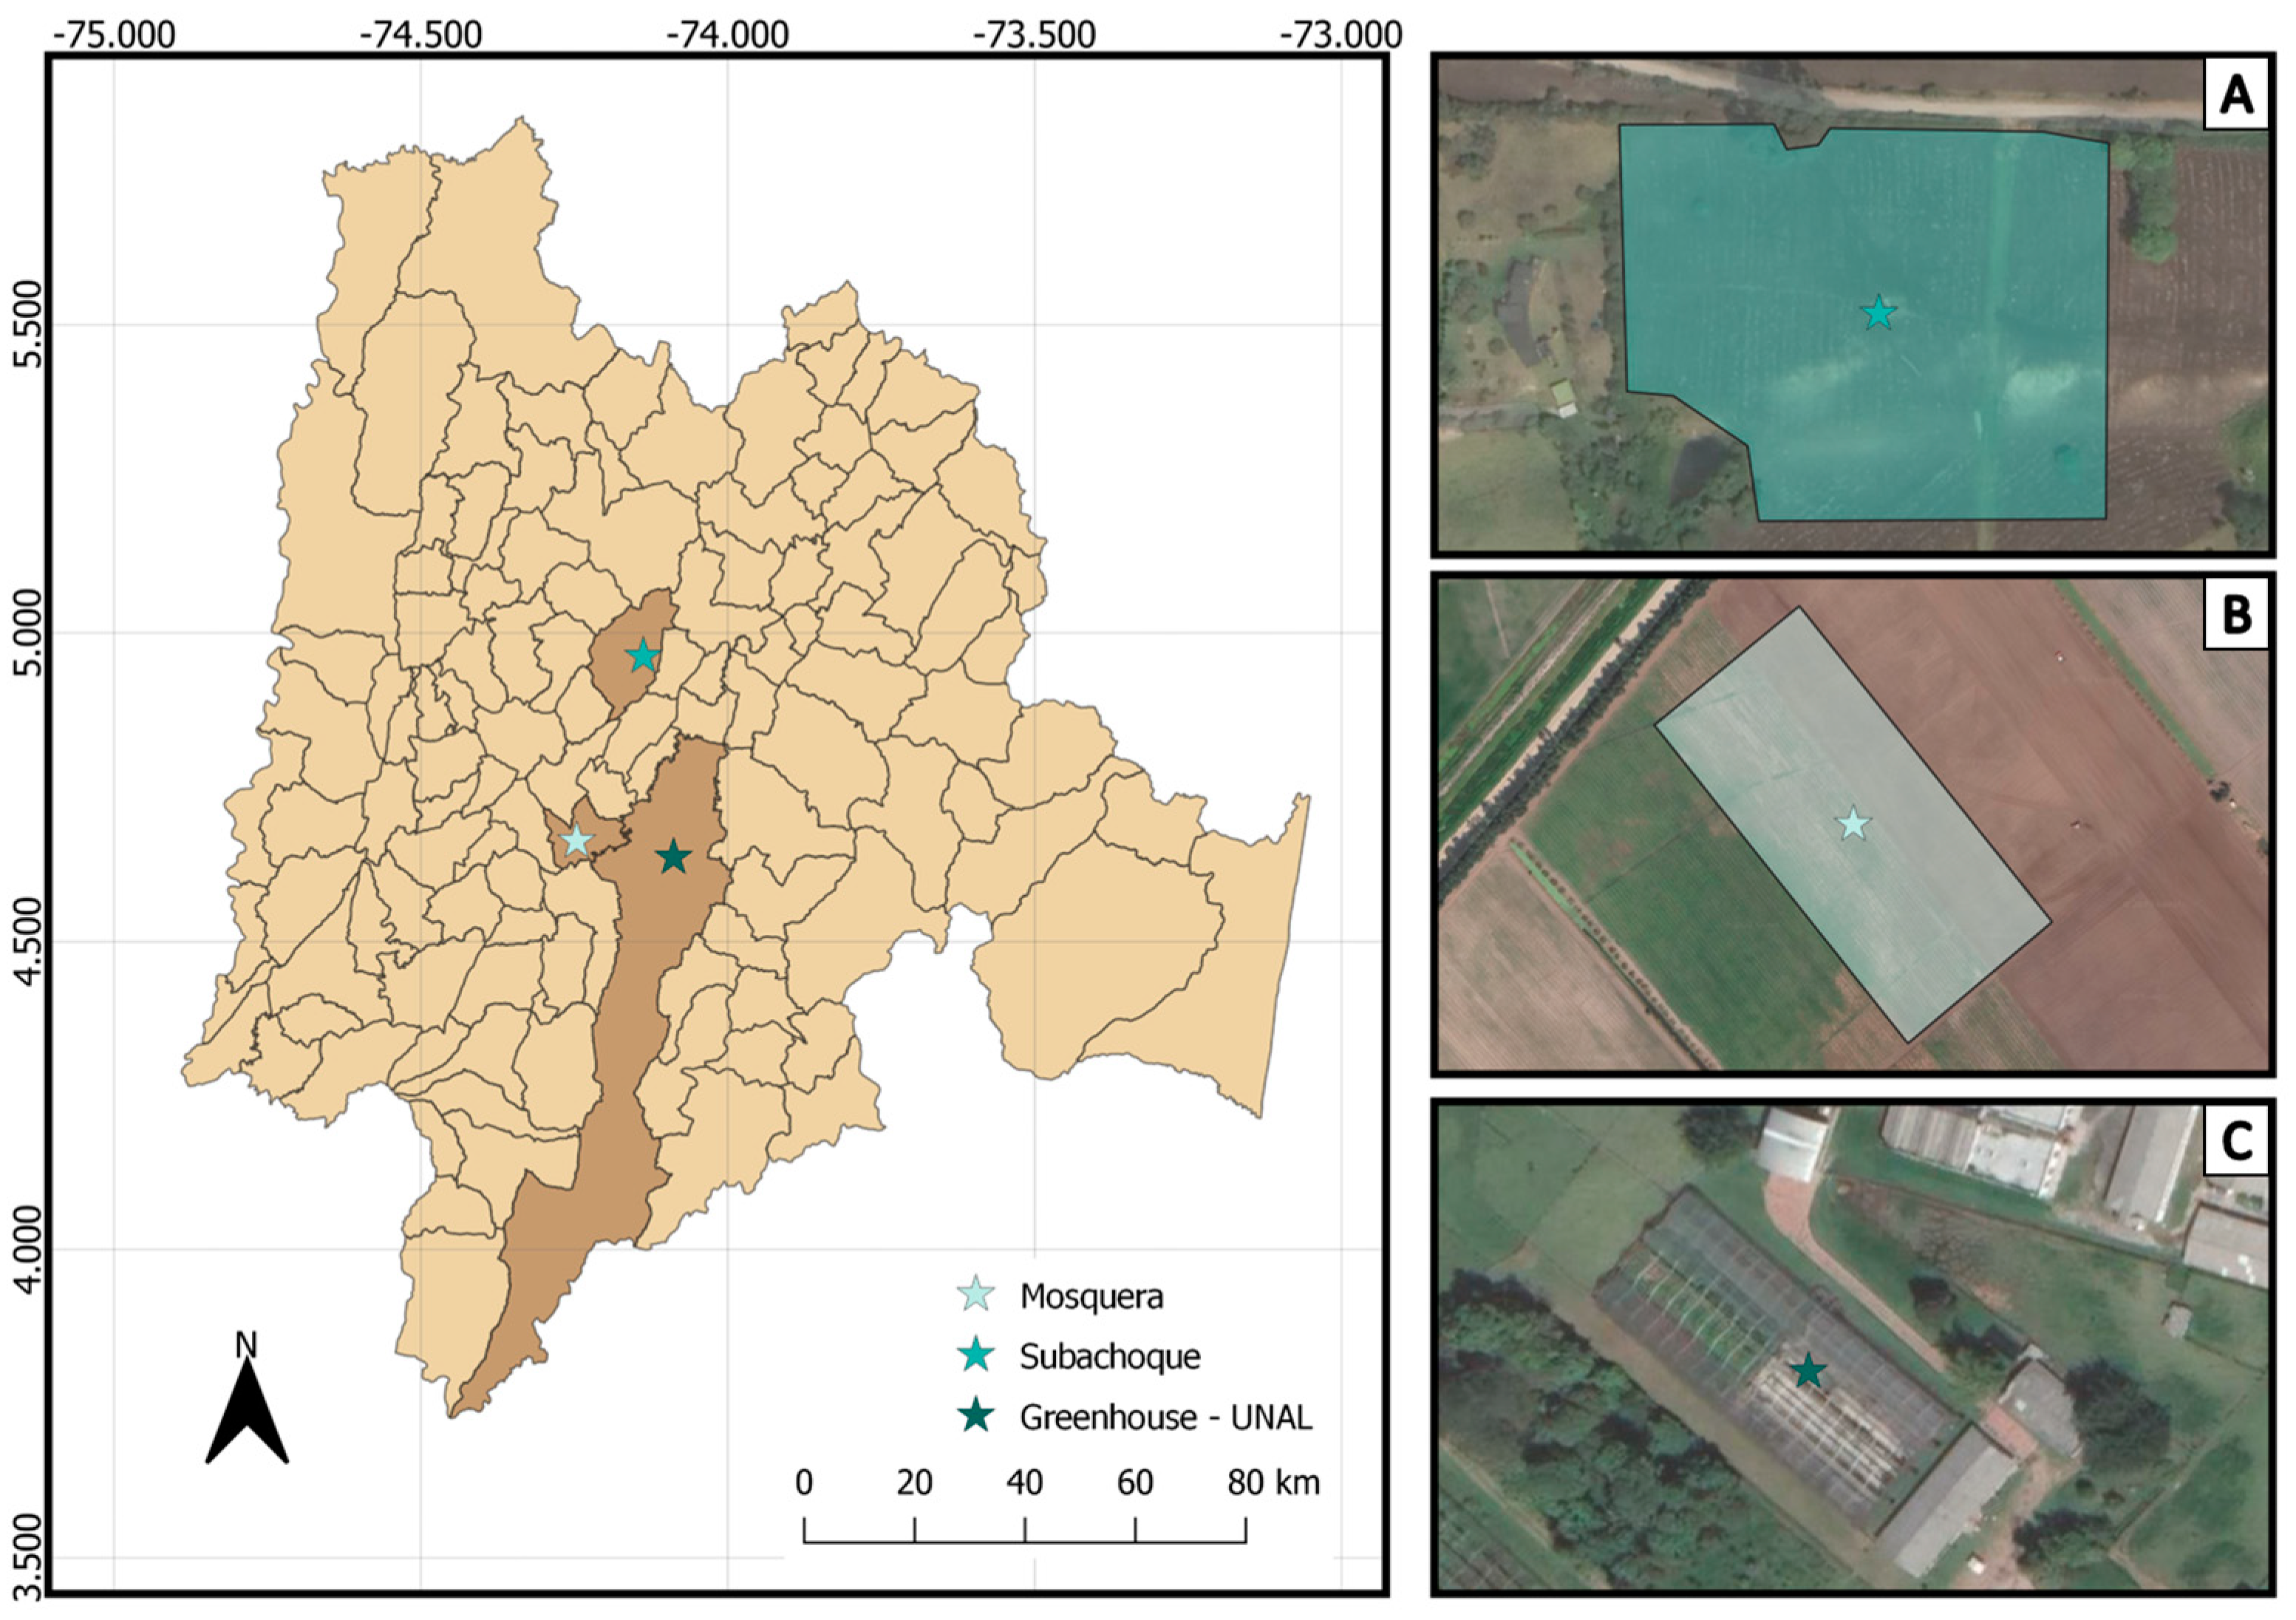

Table A1.
Vegetation indices used as training variables for the models generated from the two data sources used in this study.
Table A1.
Vegetation indices used as training variables for the models generated from the two data sources used in this study.
| Index | Equation | References |
|---|---|---|
| Verticillium Wilt Index (VWI) | (A1) | Proposed Index |
| Soil Adjusted Vegetation Index (SAVI) * | (A2) | [49] |
| Enhanced Vegetation Index (EVI2) ** | (A3) | [49] |
| Green Normalized Difference Vegetation Index (GNDVI) | (A4) | [50] |
| Green–Red Vegetation Index (GRVI) | (A5) | [48,51] |
| Modified Green–Red Vegetation Index (MGRVI) | (A6) | [51] |
| Green Chlorophyll Index (GCI) | (A7) | [47] |
| Red Edge Chlorophyll Index (RECI) | (A8) | [47] |
| Normalized Difference Red Edge Index (NDRE) | (A9) | [51] |
| Chlorophyll Index Green (CIGreen) | (A10) | [52] |
| Anthocyanin Reflectance Index (ARI) | (A11) | [45] |
| Anthocyanin Reflectance Index (CARI) | (A12) | [53] |
| Normalized Difference Vegetation Index (NDVI) | (A13) | [54] |
* Correction factor for the brightness of the ground = 0.5. ** G: constant = 2.5; C: atmospheric drag coefficients (C1 = 2.4); L: adjust background = 1.
References
- Del Mar Martínez-Prada, M.; Curtin, S.J.; Gutiérrez-González, J.J. Potato improvement through genetic engineering. GM Crop. Food 2022, 12, 479–496. [Google Scholar] [CrossRef] [PubMed]
- FAOSTAT FAOSTAT: Statistical Database. Available online: https://www.fao.org/faostat/es/#home (accessed on 17 April 2022).
- Li, H.; Wang, Z.; Hu, X.; Shang, W.; Shen, R.; Guo, C.; Guo, Q.; Subbarao, K.V. Assessment of Resistance in Potato Cultivars to Verticillium Wilt Caused by Verticillium Dahliae and Verticillium Nonalfalfae. Plant Dis. 2019, 103, 1357–1362. [Google Scholar] [CrossRef] [PubMed]
- Johnson, D.A.; Jeremiah, K.; Dung, S. Verticillium Wilt of Potato—The Pathogen, Disease and Management. Can. J. Plant Pathol. 2010, 32, 58–67. [Google Scholar] [CrossRef]
- Shattock, R. Compendium of Potato Diseases, Second Edition. W.R. Stevenson. Plant Pathol. 2002, 51, 520. [Google Scholar] [CrossRef]
- Ramegowda, V.; Senthil-Kumar, M. The Interactive Effects of Simultaneous Biotic and Abiotic Stresses on Plants: Mechanistic Understanding from Drought and Pathogen Combination. J. Plant Physiol. 2015, 176, 47–54. [Google Scholar] [CrossRef] [PubMed]
- Kollist, H.; Zandalinas, S.I.; Sengupta, S.; Nuhkat, M.; Kangasjärvi, J.; Mittler, R. Rapid Responses to Abiotic Stress: Priming the Landscape for the Signal Transduction Network. Trends Plant Sci. 2019, 24, 25–37. [Google Scholar] [CrossRef]
- Galieni, A.; D’Ascenzo, N.; Stagnari, F.; Pagnani, G.; Xie, Q.; Pisante, M. Past and Future of Plant Stress Detection: An Overview From Remote Sensing to Positron Emission Tomography. Front. Plant Sci. 2021, 11, 1975. [Google Scholar] [CrossRef] [PubMed]
- Oerke, E.C. Remote Sensing of Diseases. Annu. Rev. Phytopathol. 2020, 58, 225–252. [Google Scholar] [CrossRef] [PubMed]
- Buja, I.; Sabella, E.; Monteduro, A.G.; Chiriacò, M.S.; De Bellis, L.; Luvisi, A.; Maruccio, G. Advances in Plant Disease Detection and Monitoring: From Traditional Assays to In-Field Diagnostics. Sensors 2021, 21, 2129. [Google Scholar] [CrossRef]
- Mahlein, A.K. Plant Disease Detection by Imaging Sensors—Parallels and Specific Demands for Precision Agriculture and Plant Phenotyping. Plant Dis. 2016, 100, 241–254. [Google Scholar] [CrossRef]
- Liu, L.; Dong, Y.; Huang, W.; Du, X.; Ren, B.; Huang, L.; Zheng, Q.; Ma, H. A Disease Index for Efficiently Detecting Wheat Fusarium Head Blight Using Sentinel-2 Multispectral Imagery. IEEE Access 2020, 8, 52181–52191. [Google Scholar] [CrossRef]
- Singh, V.; Sharma, N.; Singh, S. A Review of Imaging Techniques for Plant Disease Detection. Artif. Intell. Agric. 2020, 4, 229–242. [Google Scholar] [CrossRef]
- León-Rueda, W.A.; León, C.; Caro, S.G.; Ramírez-Gil, J.G. Identification of Diseases and Physiological Disorders in Potato via Multispectral Drone Imagery Using Machine Learning Tools. Trop. Plant Pathol. 2022, 47, 152–167. [Google Scholar] [CrossRef]
- Ramesh Reddy, D.; Naga Santhosh, K.; Kodali, P. Convolutional Neural Networks for the Intuitive Identification of Plant Diseases. In Proceedings of the 5th International Conference on Inventive Computation Technologies, ICICT 2022—Proceedings, Lalitpur, Nepal, 20–22 July 2022; Volume 10, p. 941. [Google Scholar]
- Baldi, P.; La Porta, N. Molecular Approaches for Low-Cost Point-of-Care Pathogen Detection in Agriculture and Forestry. Front. Plant Sci. 2020, 11, 570862. [Google Scholar] [CrossRef] [PubMed]
- Marín-Ortiz, J.C.; Gutierrez-Toro, N.; Botero-Fernández, V.; Hoyos-Carvajal, L.M. Linking Physiological Parameters with Visible/near-Infrared Leaf Reflectance in the Incubation Period of Vascular Wilt Disease. Saudi J. Biol. Sci. 2020, 27, 88. [Google Scholar] [CrossRef] [PubMed]
- Couture, J.J.; Singh, A.; Charkowski, A.O.; Groves, R.L.; Gray, S.M.; Bethke, P.C.; Townsend, P.A. Integrating Spectroscopy with Potato Disease Management. Plant Dis. 2018, 102, 2233–2240. [Google Scholar] [CrossRef] [PubMed]
- Imanian, K.; Pourdarbani, R.; Sabzi, S.; García-Mateos, G.; Arribas, J.I.; Molina-Martínez, J.M. Identification of Internal Defects in Potato Using Spectroscopy and Computational Intelligence Based on Majority Voting Techniques. Foods 2021, 10, 982. [Google Scholar] [CrossRef]
- Agilandeeswari, L.; Prabukumar, M.; Radhesyam, V.; Phaneendra, K.L.N.B.; Farhan, A. Crop Classification for Agricultural Applications in Hyperspectral Remote Sensing Images. Appl. Sci. 2022, 12, 1670. [Google Scholar] [CrossRef]
- Moshou, D.; Bravo, C.; Oberti, R.; West, J.S.; Ramon, H.; Vougioukas, S.; Bochtis, D. Intelligent Multi-Sensor System for the Detection and Treatment of Fungal Diseases in Arable Crops. Biosyst. Eng. 2011, 108, 311–321. [Google Scholar] [CrossRef]
- Wei, X.; Johnson, M.A.; Langston, D.B.; Mehl, H.L.; Li, S. Identifying Optimal Wavelengths as Disease Signatures Using Hyperspectral Sensor and Machine Learning. Remote Sens. 2021, 13, 2833. [Google Scholar] [CrossRef]
- Meng, R.; Lv, Z.; Yan, J.; Chen, G.; Zhao, F.; Zeng, L.; Xu, B. Development of Spectral Disease Indices for Southern Corn Rust Detection and Severity Classification. Remote Sens. 2020, 12, 3233. [Google Scholar] [CrossRef]
- Sun, W.; Du, Q. Hyperspectral Band Selection: A Review. IEEE Geosci. Remote Sens. Mag. 2019, 7, 118–139. [Google Scholar] [CrossRef]
- Junges, A.H.; Almança, M.A.K.; Fajardo, T.V.M.; Ducati, J.R. Leaf Hyperspectral Reflectance as a Potential Tool to Detect Diseases Associated with Vineyard Decline. Trop. Plant Pathol. 2020, 45, 522–533. [Google Scholar] [CrossRef]
- Mountrakis, G.; Im, J.; Ogole, C. Support Vector Machines in Remote Sensing: A Review. ISPRS J. Photogramm. Remote Sens. 2011, 66, 247–259. [Google Scholar] [CrossRef]
- Rodríguez, J.; Lizarazo, I.; Prieto, F.; Angulo-Morales, V. Assessment of Potato Late Blight from UAV-Based Multispectral Imagery. Comput. Electron. Agric. 2021, 184, 106061. [Google Scholar] [CrossRef]
- Lizarazo, I.; Rodriguez, J.L.; Cristancho, O.; Olaya, F.; Duarte, M.; Prieto, F. Identification of Symptoms Related to Potato Verticillium Wilt from UAV-Based Multispectral Imagery Using an Ensemble of Gradient Boosting Machines. Smart Agric. Technol. 2023, 3, 100138. [Google Scholar] [CrossRef]
- Shin, M.Y.; Gonzalez Viejo, C.; Tongson, E.; Wiechel, T.; Taylor, P.W.J.; Fuentes, S. Early Detection of Verticillium Wilt of Potatoes Using Near-Infrared Spectroscopy and Machine Learning Modeling. Comput. Electron. Agric. 2023, 204, 107567. [Google Scholar] [CrossRef]
- Ashraf, A.; Rauf, A.; Fahim Abbas, M.; Rehman, R. Isolation and Identification of Verticillium Dahliae Causing Wilt on Potato in Pakistan. J. Phytopathol. 2012, 24, 112–116. [Google Scholar]
- Hunter, D.E.; Darling, H.M.; Stevenson, F.J.; Cunningham, C.E. Inheritance of Resistance to Verticillium Wilt in Wisconsin. Am. Potato J. 1968, 45, 72–78. [Google Scholar] [CrossRef]
- Mauromicale, G.; Ierna, A.; Marchese, M. Chlorophyll Fluorescence and Chlorophyll Content in Field-Grown Potato as Affected by Nitrogen Supply, Genotype, and Plant Age. Photosynthetica 2006, 44, 76–82. [Google Scholar] [CrossRef]
- Ren, Y.; Zhang, L.; Suganthan, P.N. Ensemble Classification and Regression-Recent Developments, Applications and Future Directions [Review Article]. IEEE Comput. Intell. Mag. 2016, 11, 41–53. [Google Scholar] [CrossRef]
- Gholami, R.; Fakhari, N. Support Vector Machine: Principles, Parameters, and Applications. In Handbook of Neural Computation; Elsevier Inc.: Amsterdam, The Netherlands, 2017; pp. 515–535. ISBN 9780128113196. [Google Scholar]
- Wang, J.; Lu, S.; Wang, S.H.; Zhang, Y.D. A Review on Extreme Learning Machine. Multimed. Tools Appl. 2021, 81, 41611–41660. [Google Scholar] [CrossRef]
- Gupta, S.; Saluja, K.; Goyal, A.; Vajpayee, A.; Tiwari, V. Comparing the Performance of Machine Learning Algorithms Using Estimated Accuracy. Meas. Sens. 2022, 24, 100432. [Google Scholar] [CrossRef]
- Kuhn, M. Building Predictive Models in R Using the Caret Package. J. Stat. Softw. 2008, 28, 1–26. [Google Scholar] [CrossRef]
- Savitzky, A.; Golay, M.J.E. Smoothing and Differentiation of Data by Simplified Least Squares Procedures. Anal. Chem. 1964, 36, 1627–1639. [Google Scholar] [CrossRef]
- Hopkins, D.W. What Is a Norris Derivative? NIR News 2001, 12, 3–5. [Google Scholar] [CrossRef]
- Stevens, A.; Ramirez Lopez, L. R Package Vignette, Report No.: R Package, Version 0.1. In An Introduction to the Prospectr Package; 2014; Volume 3, pp. 1–22. Available online: https://www.researchgate.net/publication/255941339_An_introduction_to_the_prospectr_package (accessed on 15 July 2024).
- Lê, S.; Josse, J.; Husson, F. FactoMineR: An R Package for Multivariate Analysis. J. Stat. Softw. 2008, 25, 1–18. [Google Scholar] [CrossRef]
- Gold, K.M.; Townsend, P.A.; Chlus, A.; Herrmann, I.; Couture, J.J.; Larson, E.R.; Gevens, A.J. Hyperspectral Measurements Enable Pre-Symptomatic Detection and Differentiation of Contrasting Physiological Effects of Late Blight and Early Blight in Potato. Remote Sens. 2020, 12, 286. [Google Scholar] [CrossRef]
- Singh, A.; Kaur, H. Potato Plant Leaves Disease Detection and Classification Using Machine Learning Methodologies. IOP Conf. Ser. Mater. Sci. Eng. 2021, 1022, 012121. [Google Scholar] [CrossRef]
- Calderón, R.; Navas-Cortés, J.A.; Zarco-Tejada, P.J. Early Detection and Quantification of Verticillium Wilt in Olive Using Hyperspectral and Thermal Imagery over Large Areas. Remote Sens. 2015, 7, 5584–5610. [Google Scholar] [CrossRef]
- Gitelson, A.A.; Merzlyak, M.N.; Chivkunova, O.B. Optical Properties and Nondestructive Estimation of Anthocyanin Content in Plant Leaves. Photochem. Photobiol. 2001, 74, 38. [Google Scholar] [CrossRef]
- Li, H.; Yang, W.; Lei, J.; She, J.; Zhou, X. Estimation of Leaf Water Content from Hyperspectral Data of Different Plant Species by Using Three New Spectral Absorption Indices. PLoS ONE 2021, 16, e0249351. [Google Scholar] [CrossRef] [PubMed]
- Gitelson, A.A.; Gritz, Y.; Merzlyak, M.N. Relationships between Leaf Chlorophyll Content and Spectral Reflectance and Algorithms for Non-Destructive Chlorophyll Assessment in Higher Plant Leaves. J. Plant Physiol. 2003, 160, 271–282. [Google Scholar] [CrossRef] [PubMed]
- Motohka, T.; Nasahara, K.N.; Oguma, H.; Tsuchida, S. Applicability of Green-Red Vegetation Index for Remote Sensing of Vegetation Phenology. Remote Sens. 2010, 2, 2369–2387. [Google Scholar] [CrossRef]
- Jiang, Z.; Huete, A.R.; Didan, K.; Miura, T. Development of a Two-Band Enhanced Vegetation Index without a Blue Band. Remote Sens. Environ. 2008, 112, 3833–3845. [Google Scholar] [CrossRef]
- Yang, C.M.; Cheng, C.H.; Chen, R.K. Changes in Spectral Characteristics of Rice Canopy Infested with Brown Planthopper and Leaffolder. Crop Sci. 2007, 47, 329–335. [Google Scholar] [CrossRef]
- Yeom, J.; Jung, J.; Chang, A.; Ashapure, A.; Maeda, M.; Maeda, A.; Landivar, J. Comparison of Vegetation Indices Derived from UAV Data for Differentiation of Tillage Effects in Agriculture. Remote Sens. 2019, 11, 1548. [Google Scholar] [CrossRef]
- Xie, Q.; Dash, J.; Huang, W.; Peng, D.; Qin, Q.; Mortimer, H.; Casa, R.; Pignatti, S.; Laneve, G.; Pascucci, S.; et al. Vegetation Indices Combining the Red and Red-Edge Spectral Information for Leaf Area Index Retrieval. IEEE J. Sel. Top. Appl. Earth Obs. Remote Sens. 2018, 11, 1482–1492. [Google Scholar] [CrossRef]
- Zhou, X.; Huang, W.; Zhang, J.; Kong, W.; Casa, R.; Huang, Y. A Novel Combined Spectral Index for Estimating the Ratio of Carotenoid to Chlorophyll Content to Monitor Crop Physiological and Phenological Status. Int. J. Appl. Earth Obs. Geoinf. 2019, 76, 128–142. [Google Scholar] [CrossRef]
- Rouse, J.W.; Haas, R.H.; Schell, J.A.; Deering, D.W. Monitoring Vegetation Systems in the Great Plains with ERTS. NASA Spec. Publ. 1973, 351, 309. [Google Scholar]
Disclaimer/Publisher’s Note: The statements, opinions and data contained in all publications are solely those of the individual author(s) and contributor(s) and not of MDPI and/or the editor(s). MDPI and/or the editor(s) disclaim responsibility for any injury to people or property resulting from any ideas, methods, instructions or products referred to in the content. |
© 2024 by the authors. Licensee MDPI, Basel, Switzerland. This article is an open access article distributed under the terms and conditions of the Creative Commons Attribution (CC BY) license (https://creativecommons.org/licenses/by/4.0/).