Article

Molecular Mechanism of Pyrroloquinoline Quinone-Mediated Rice Tolerance to Imidazolinone Herbicide Imazamox

1
Institute of Plant Protection, Hunan Academy of Agricultural Sciences, Changsha 410125, China
2
Huangpu Research Institute of Longping Agricultural Science and Technology, Guangzhou 510715, China
3
State Key Laboratory of Hybrid Rice, Hunan Hybrid Rice Research Center, Changsha 410125, China
4
College of Plant Protection, Hunan Agricultural University, Changsha 410128, China
*
Authors to whom correspondence should be addressed.
These authors contributed equally to this work.
Agronomy 2024, 14(7), 1572; https://doi.org/10.3390/agronomy14071572
Submission received: 29 May 2024 / Revised: 11 July 2024 / Accepted: 17 July 2024 / Published: 19 July 2024
(This article belongs to the Section Weed Science and Weed Management)

Abstract

:
The Clearfield® technology is an useful tool for controlling weedy rice due to the effectiveness of imazamox and the cultivation of rice varieties resistant to imidazolines. However, residual imazamox in the soil probably causes phytotoxicity to subsequent non-resistant rice crops. We previously found that pyrroloquinoline quinone (PQQ), a bioactive elicitor, can enhance rice tolerance to imazamox. In this study, we explored the molecular mechanism of PQQ-mediated rice tolerance to imazamox by RNA-seq analysis, real-time quantitative PCR (RT-qPCR) assay, and enzyme activity assay. The results indicated that compared to imazamox at 66.7 mg a.i./L (IMA) alone, rice plants treated with imazamox at 66.7 mg a.i./L and PQQ at 0.66 mg a.i./L (IMA + PQQ) exhibited significantly reduced sensitivity to imazamox. Seven days post-treatment, IMA + PQQ-treated rice plants showed partial chlorosis and leaf curling, but IMA-treated rice plants had severe wilting and died. The fresh weight inhibition rate was 29.3% in the IMA + PQQ group, significantly lower than that of 56.6% in the IMA group alone. RNA-seq analysis showed differentially expressed genes were mainly involved in phenylpropanoid biosynthesis, diterpenoid biosynthesis, and MAPK signaling pathways in response to IMA + PQQ treatment. Both RNA-seq analysis and RT-qPCR assay showed that the expression of OsCATB gene in the catalase (CAT) gene family was upregulated at 12 h, the expression of OsGSTU1 gene was upregulated at 12, 24, and 48 h, while the expressions of OsABCB2, OsABCB11, and OsABCG11 genes were upregulated at 24 and 48 h. Enzyme activity assays revealed that the activity of superoxide dismutase in the IMA + PQQ group was increased by 47.45~120.31% during 12~72 h, compared to that in the IMA group. CAT activity in the IMA + PQQ group was increased by 123.72 and 59.04% at 12 and 48 h, respectively. Moreover, malondialdehyde levels indicative of oxidative damage were consistently lower in IMA + PQQ-treated plants, with a reduction of 46.29, 11.37, and 14.50% at 12, 36, and 72 h, respectively. Overall, these findings discover that PQQ has potential in reducing imazamox phytotoxicity in rice by enhancing antioxidant enzyme activities and regulating oxidative stress responses. They will provide valuable strategies for improving imazamox tolerance in crops.

1. Introduction

Weedy rice (Oryza sativa f. spontanea), a conspecific weed of cultivated rice, poses a significant global threat to rice production, particularly in direct-seeded rice cropping systems [1]. It produces fewer grains and competes aggressively with crop cultivars due to its early vigor, greater tillering, and increased plant height [2]. Yield losses attributable to weedy rice vary based on factors such as season, weed species, weed density, rice cultivar, and the growth rates and densities of both weeds and rice. For instance, a 35% infestation of weedy rice can result in approximately 60% yield loss, with severe infestations leading to losses as high as 74% [3]. Its high productivity and competitive nature allow it to spread widely, causing substantial economic damage [4,5].
The herbicide-resistant Clearfield rice technology offers a viable solution for controlling weedy rice applied by imidazolinone herbicides, specifically imazethapyr in rice fields [6,7]. Given the severity of the weedy rice problem in Malaysia, Clearfield rice received governmental support for commercialization in 2010 [1]. Imidazolinones effectively manage a broad spectrum of grass and broadleaf weeds in imidazolinone-tolerant crops, including weeds closely related to the crop and weedy rice [8]. Imidazolinones, as acetolactate synthase (ALS) inhibitors, including imazamox (developed by BASF Corporation, USA), imazapyr, imazapic, imazethapyr, imazamethabenz, and imazaquin, belong to the major class of Group 2 herbicides according to the Herbicide Resistance Action Committee (https://hracglobal.com/ (accessed on 29 May 2024)) and are commonly used in soybean and pulse cultivation. However, crops such as rice, maize, wheat, oilseed rape, and sunflower are highly sensitive to imidazolinones, limiting their application in these crops [8,9]. We previously found that when different rice varieties were sown at 30 and 60 d after being sprayed with imazamox at 75 and 150 g a.i./ha in soil, respectively, the germination rate and plant height of rice plants were significantly suppressed, possibly due to the phytotoxicity of residual imazamox in the soil.
A coenzyme, pyrroloquinoline quinone (PQQ), which is initially isolated from Deinococcus radiodurans, serves as a pivotal antioxidant [10]. It was the first quinone cofactor described, and requires the biosynthesis of the PQQ operon, which encodes six gene products (PQQ A-F) [11,12]. Acting as a redox cofactor for bacterial dehydrogenases, PQQ facilitates electron transfer to ubiquinone and can interact with cytochrome c and flavin adenine dinucleotide (FAD) [13]. As a powerful antioxidant, PQQ scavenges reactive oxygen species (ROS) and inhibits apoptosis. Its antioxidant properties are concentration-dependent, with low concentrations promoting plant growth by mitigating oxidative stress [14,15,16,17,18].
In response to the issue of potential phytotoxicity in rice caused by the cross-crop application of herbicides, our previous results of many pre-experiments found that compared to imazamox treatment alone, the inhibition of shoot and root growth were significantly reduced when rice seeds were soaked with PQQ before imazamox exposure, and the inhibition of fresh weight was effectively decreased when rice plants were applied by foliar spray of PQQ at 24 h before imazamox exposure. These findings demonstrated that PQQ can mediate rice tolerance to imidazolinones. However, little information is available on the molecular mechanism of PQQ-mediated rice tolerance to imazamox.
In this study, rice plants were first hydroponically cultivated. Subsequently, appropriate concentrations of imazamox and PQQ were selected on the basis of the results of pre-experiments. Transcriptome sequencing of rice leaves after treatment only with imazamox at 66.7 mg a.i./L (IMA) and imazamox at 66.7 mg a.i./L mixed with PQQ at 0.66 mg a.i./L (IMA + PQQ) was then conducted. Data were used to identify candidate genes by gene ontology (GO) enrichment analysis, the Kyoto Encyclopedia of Genes and Genomes (KEGG) pathway database, and weighted gene co-expression network analysis (WGCNA). The differential expression of these genes was validated using real-time quantitative PCR (RT-qPCR) assay. Enzymatic activities associated with oxidation-reduction after IMA and IMA + PQQ treatments were also determined. These findings provide crucial insights into the role of PQQ-increased rice tolerance to imazamox, and a theoretical foundation for developing new inducers to support imidazolinone application in rice production.

2. Materials and Methods

2.1. Rice Variety and Chemicals

The tested rice variety of Huanghuazhan developed by Rice Research Institute of Guangdong Academy of Agricultural Sciences is sensitive to imidazolinones. Imazamox 4% aqueous solution was provided by Weifang Xianda Chemical Co., Ltd., Weifang, China. PQQ (a.i. ≥ 98%) was provided by Shanghai Medical Life Science Research Center.

2.2. Rice Cultivation and Experimental Treatment Design

A select group of 400 rice seeds were sterilized by soaking in 1% sodium hypochlorite solution for 20 min, which was washed out, soaked for 12 h, and then germinated for 36 h at 30 °C in deionized water. The germinated seeds were chosen and sown into nine 96-well plates, with 24 germinated seeds per plate. The rice plants were cultivated hydroponically using Yoshida rice nutrient solution powder (Beijing Coolabor Science and Technology Co., Ltd., Beijing, China), which was diluted to a working concentration of 460.8 mg/L with a pH of 5.5~5.8, and replaced every 3 days. All experimental procedures were conducted in an illuminated incubator (RDN-1000E-4, Ningbo Dongnan Instrument Co., Ltd., Ningbo, China) with controlled conditions: temperature at 30/28 °C, relative humidity at 80/90%, and light intensity at 20,000/0 Lux for light/dark with a photoperiod of 14 h light/10 h dark, respectively.
The rice plants were cultured until the 3~4 leaf stage. Then vigorously healthy seedlings were selected and transferred into conical flasks containing a 60 mL solution of various tested reagents. Three treatments were set as follows: deionized water as the control (CK), IMA, and IMA + PQQ. To eliminate potential interference from other factors, rice plants were grown exclusively in deionized water without the addition of Yoshida rice nutrient solution powder in conical flasks. The conical flasks were sealed with Parafilm to prevent excessive evaporation of the reagents. Each treatment with three seedlings per flask was replicated three times.

2.3. Transcriptome Sequencing

At 12, 24, 36, and 48 h post-treatment, rice leaves were harvested and weighed to obtain 100 mg per sample. They were placed into RNase-free centrifuge tubes, immediately frozen in liquid nitrogen, and then stored at −80 °C. Transcriptome sequencing, de novo assembly, evaluation, and functional annotation were performed by Oebiotech Biomedical Technology Co., Ltd., Shanghai, China. Twenty-four cDNA samples representing IMA and IMA + PQQ treatments were sequenced using the Illumina Novaseq 6000 platform (Illumina, Inc., San Diego, CA, USA). Clean reads were aligned to the reference genome and filtered using Pearson correlation coefficients. Based on these results, protein-coding gene expression levels and identified differentially expressed genes (DEGs) were analyzed using the criteria of p-value < 0.05 and |log2FC| > 1.0. The functional roles of DEGs were explored via GO enrichment analysis (50 terms, lowest p-value), followed by pathway analysis (top 20 pathways) using the KEGG pathway database. Additionally, WGCNA identified optimal power (1–30), constructing co-expression networks correlating with resistance traits (correlation coefficients (CC) ≥ 0.3, p-value < 0.5).

2.4. Validation of the DEGs by RT-qPCR

Based on RNA-seq data, several upregulated genes including crucial antioxidant genes, glutathione S-transferases (GSTs), cytochrome P450 (P450), and ATP-binding cassette (ABC) transporter gene families, from key gene families involved in herbicide detoxification metabolism, were selected for further validation by RT-qPCR assay. Approximately 100 mg of tender rice leaves was bruised completely, and total RNA was extracted by the RNA Extraction Kit (GenStar Biotechnology Co., Ltd., Beijing, China), according to the manufactory instruction. The extracted total RNA was then reverse transcribed into cDNA using the StarScript Pro All-in-one RT Mix with gDNA Remover cDNA synthesis kit (GenStar Biotechnology Co., Ltd.). The synthesized cDNA was stored at −20 °C. CDS sequences of candidate genes were downloaded from the China Rice Data Center (https://www.ricedata.cn/gene/ (accessed on 29 May 2024)) and primers were designed using Primer3Plus (https://www.primer3plus.com/ (accessed on 29 May 2024)) with the parameters as follows: primer length of 18~27 bp, melting temperature (Tm) of 55~60 °C, GC content of 40~60%, and PCR product length of 80~250 bp, as detailed in Table S1. The RT-qPCR assay was performed on ABI QuantStudio3 (Thermo Fisher Scientific Inc., Pittsburgh, PA, USA) in a reaction volume of 10 μL including 2.5 μL 25-fold dilution of cDNA as a template, 1.25 μL forward and reverse primers (0.5 μmol/L), and 5.0 μL 2× RealStar Fast SYBR qPCR Mix (GenStar Biotechnology Co., Ltd.). The thermal cycling procedure was as follows: 95 °C for 2 min, followed by 40 cycles of 95 °C for 15 s and 60 °C for 15 s, and 72 °C for 30 s. The average threshold cycle (CT) value was used to calculate the relative expression levels of genes in different samples, analyzed using the 2−ΔΔCT comparative CT method. Each treatment was triplicated with two technological replicates. The experiment was replicated two times.

2.5. Determination of Enzymatic Activity Indicators

Rice plants were grown until the 3~4 leaf stage, and vigorous seedlings were selected for treatment with IMA or IMA + PQQ. Leaf samples of 100 mg for each were collected at 12, 24, 36, 48, 60, and 72 h post-treatment, with three samples per time point per treatment. These samples were rapidly frozen in liquid nitrogen and stored at −80 °C until analysis. The activities of superoxide dismutase (SOD), catalase (CAT), and peroxidase (POD), as well as the content of malondialdehyde (MDA) of rice leaves were measured in the IMA and IMA + PQQ groups. Additionally, the levels of reduced glutathione (GSH) and oxidized glutathione (GSSG), associated with herbicide detoxification, were also measured in the IMA and IMA + PQQ groups. Enzymatic activity assays were conducted using commercially available kits (Solarbio Science & Technology Co., Ltd., Beijing, China) on the harvested rice leaves at each time point.
These indicators were assessed using an enzyme-linked immunosorbent assay (ELISA) reader (PerkinElmer EnSpire™ Multilabel Reader 2300, Waltham, MA, USA) employing the microplate method. SOD activity was calculated based on absorbance at 450 nm (OD450) after incubation at 37 °C for 30 min. CAT activity was determined by comparing initial and 1 min absorbance values at 240 nm (OD240). POD activity was calculated based on 30 s and 90 s absorbance values at 470 nm (OD470). MDA content was determined according to absorbance values at 532 nm (OD532) and 600 nm (OD600). GSH and GSSG levels were assessed according to the absorbance value at 412 nm (OD412).

2.6. Data Analyses

The results of RT-qPCR and enzymatic activity assays were analyzed using SPSS Version 22 software (SPSS Inc., Chicago, IL, USA). t-tests were conducted, where p-values less than 0.05 were denoted as *, and less than 0.01 as **. Graphical representations of candidate gene expression levels and enzymatic activities were generated using GraphPad Prism 8.0.1 software (GraphPad Software, San Diego, CA, USA).

3. Results

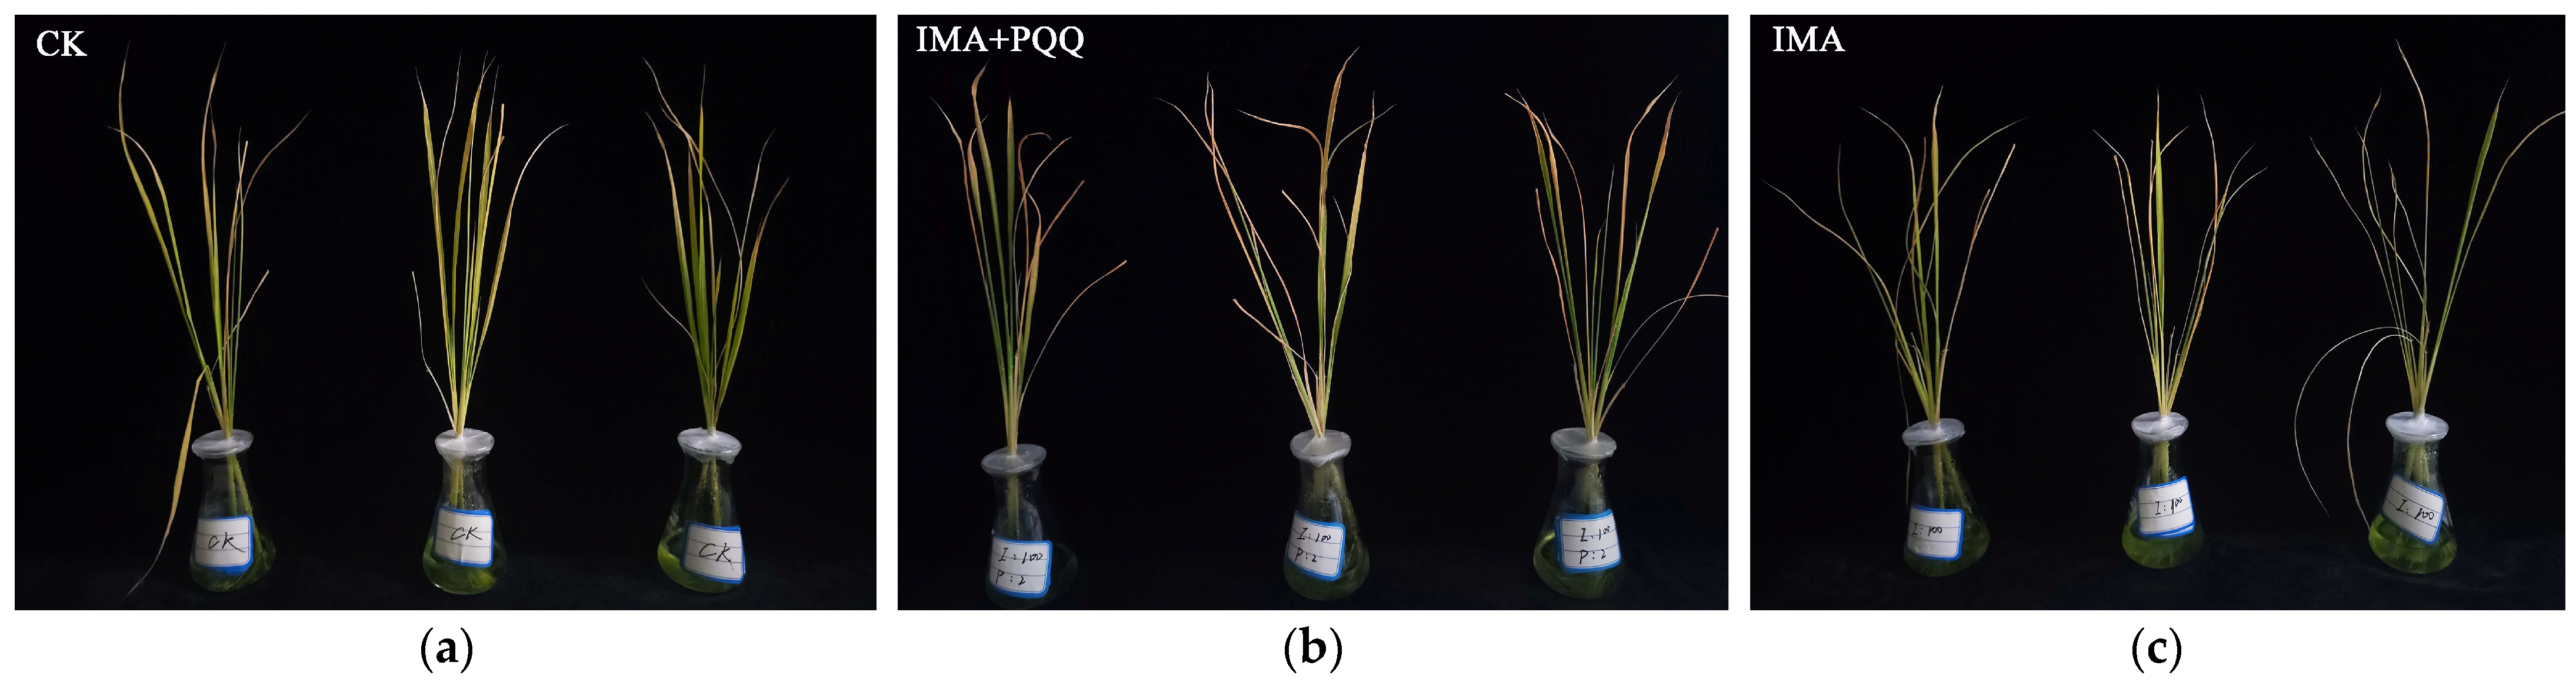
3.1. PQQ-Induced Rice Tolerance to Imazamox

Consequently, after 7 days of cultivation, some leaves in the CK group became chlorotic due to the lack of essential nutrients such as nitrogen (N), phosphorus (P), and potassium (K) (Figure 1a). In addition, there was a significant difference in sensitivity to imazamox between the IMI + PQQ and IMI treatments. Rice plants in the IMI + PQQ treatment exhibited only partial chlorosis and leaf curling, whereas rice plants in the IMI treatment showed extensive withering and death (Figure 1b,c). The average fresh weight (AFW) of each rice plant except roots in the IMI + PQQ treatment was 1.40 g and significantly lower than 1.98 g in the CK treatment, with an inhibition rate of 29.3%. In contrast, AFW in the IMA treatment was 0.86 g with a high inhibition rate of 56.6%, compared to that in the CK treatment.

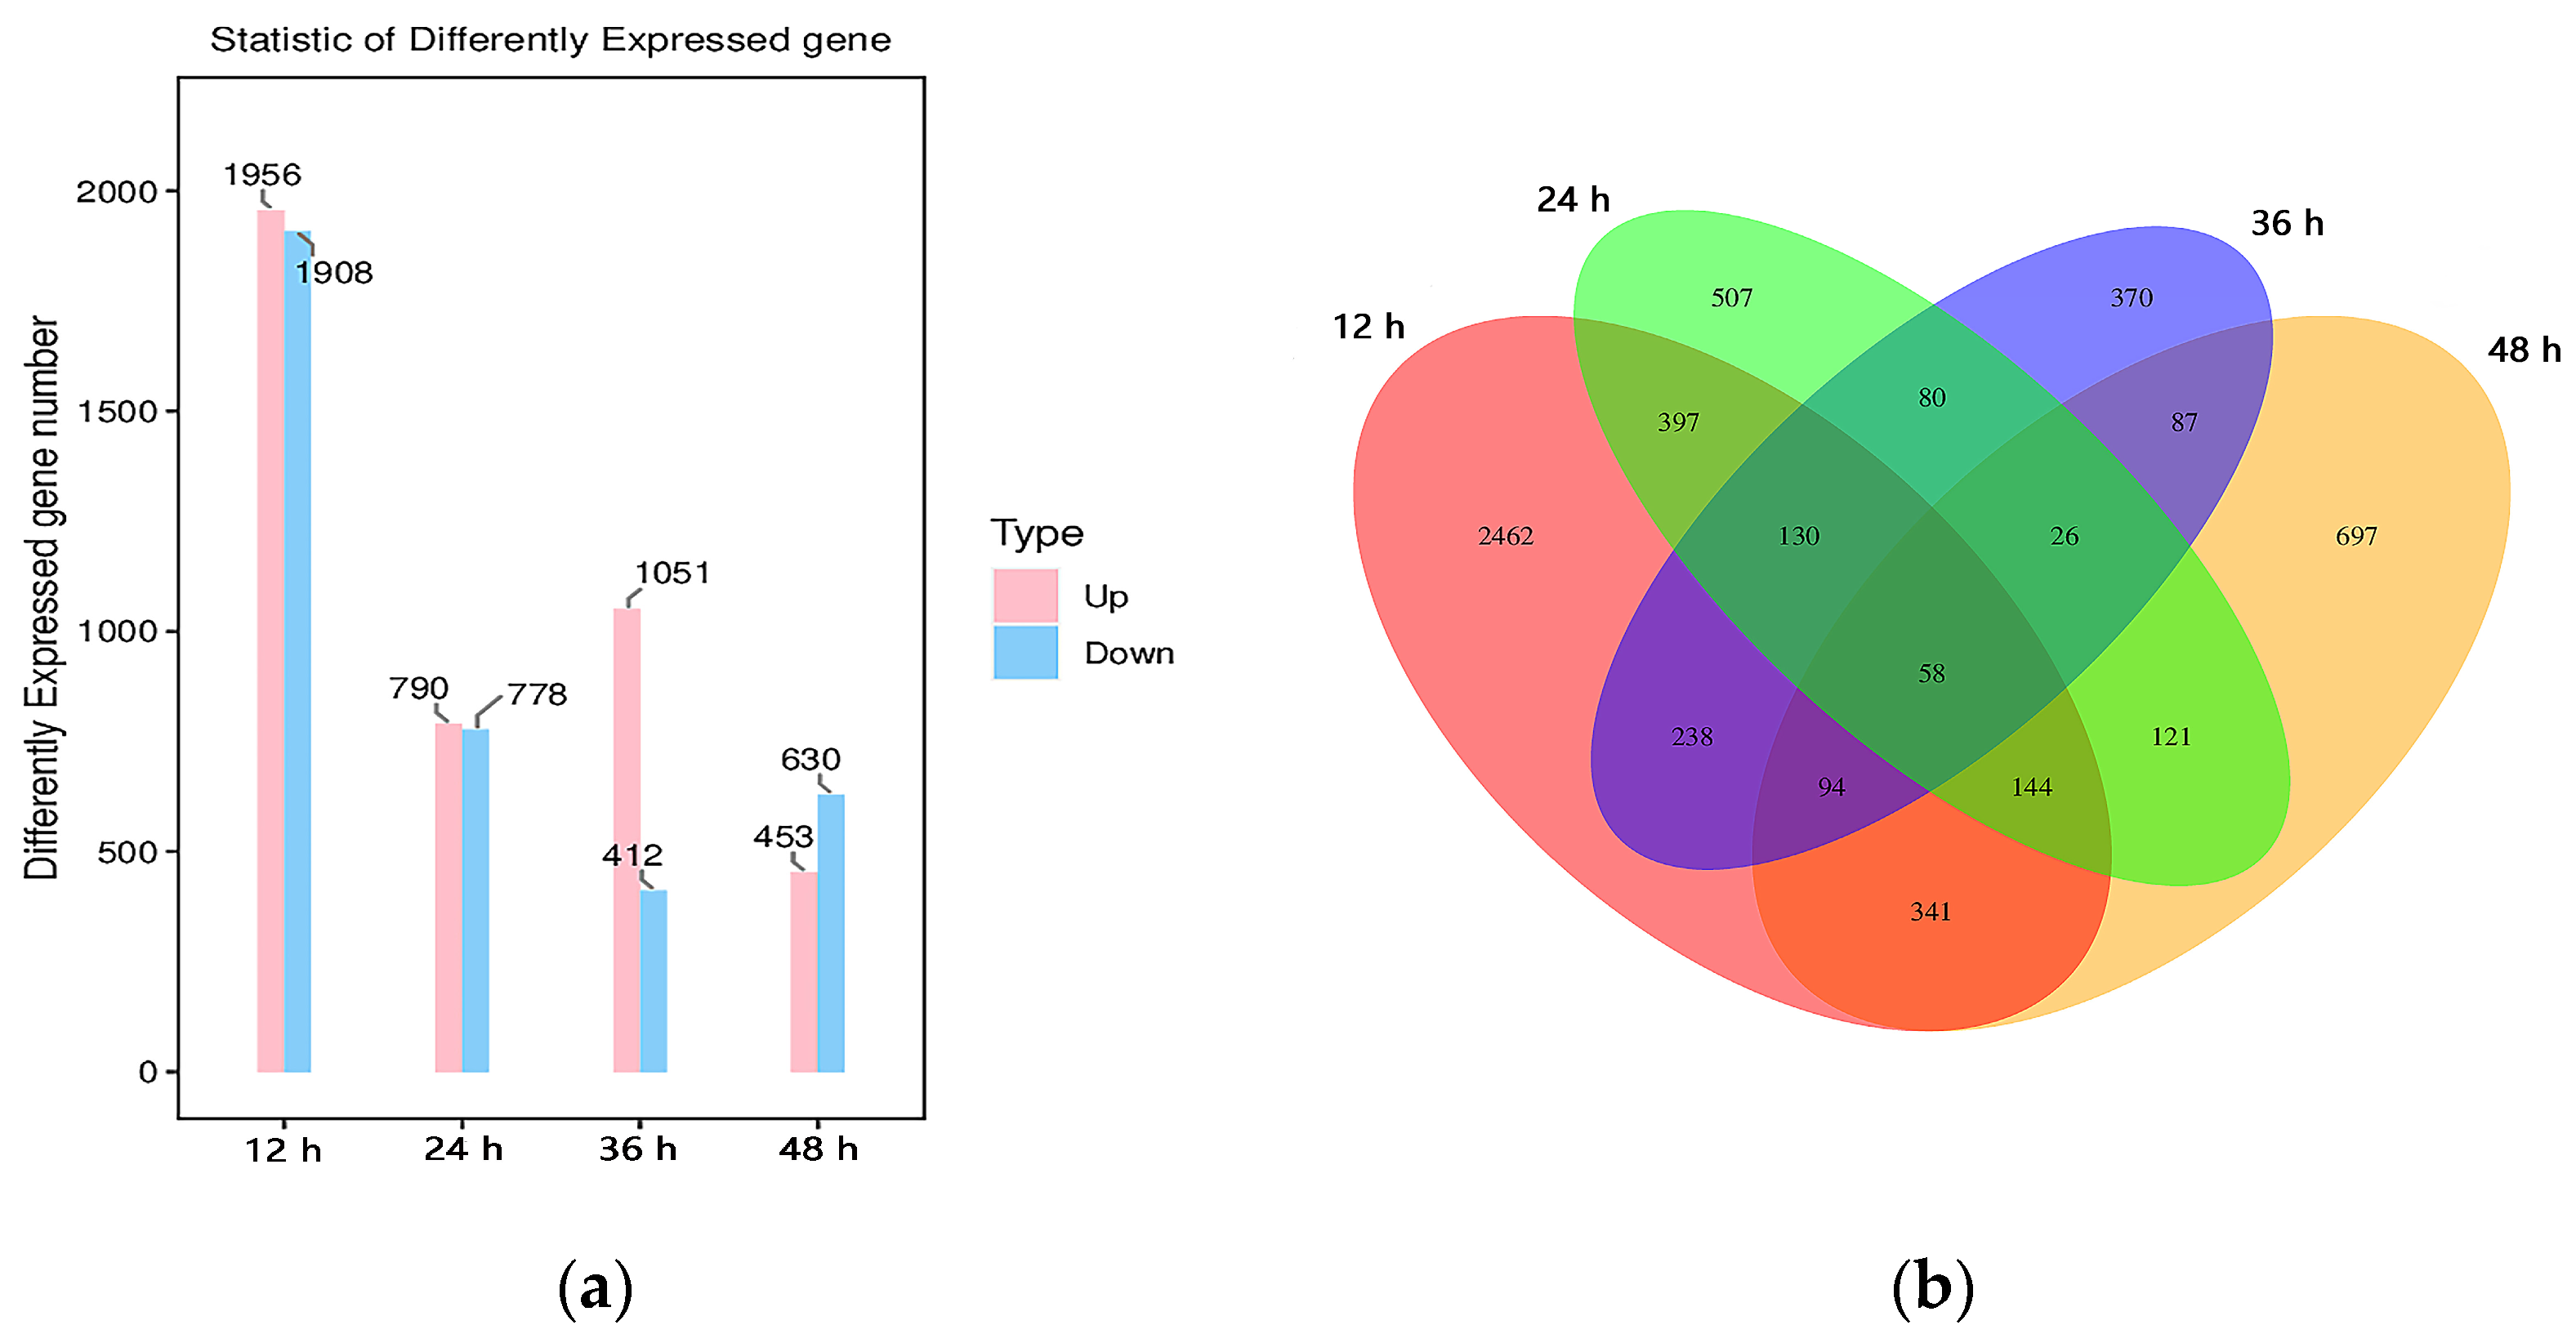
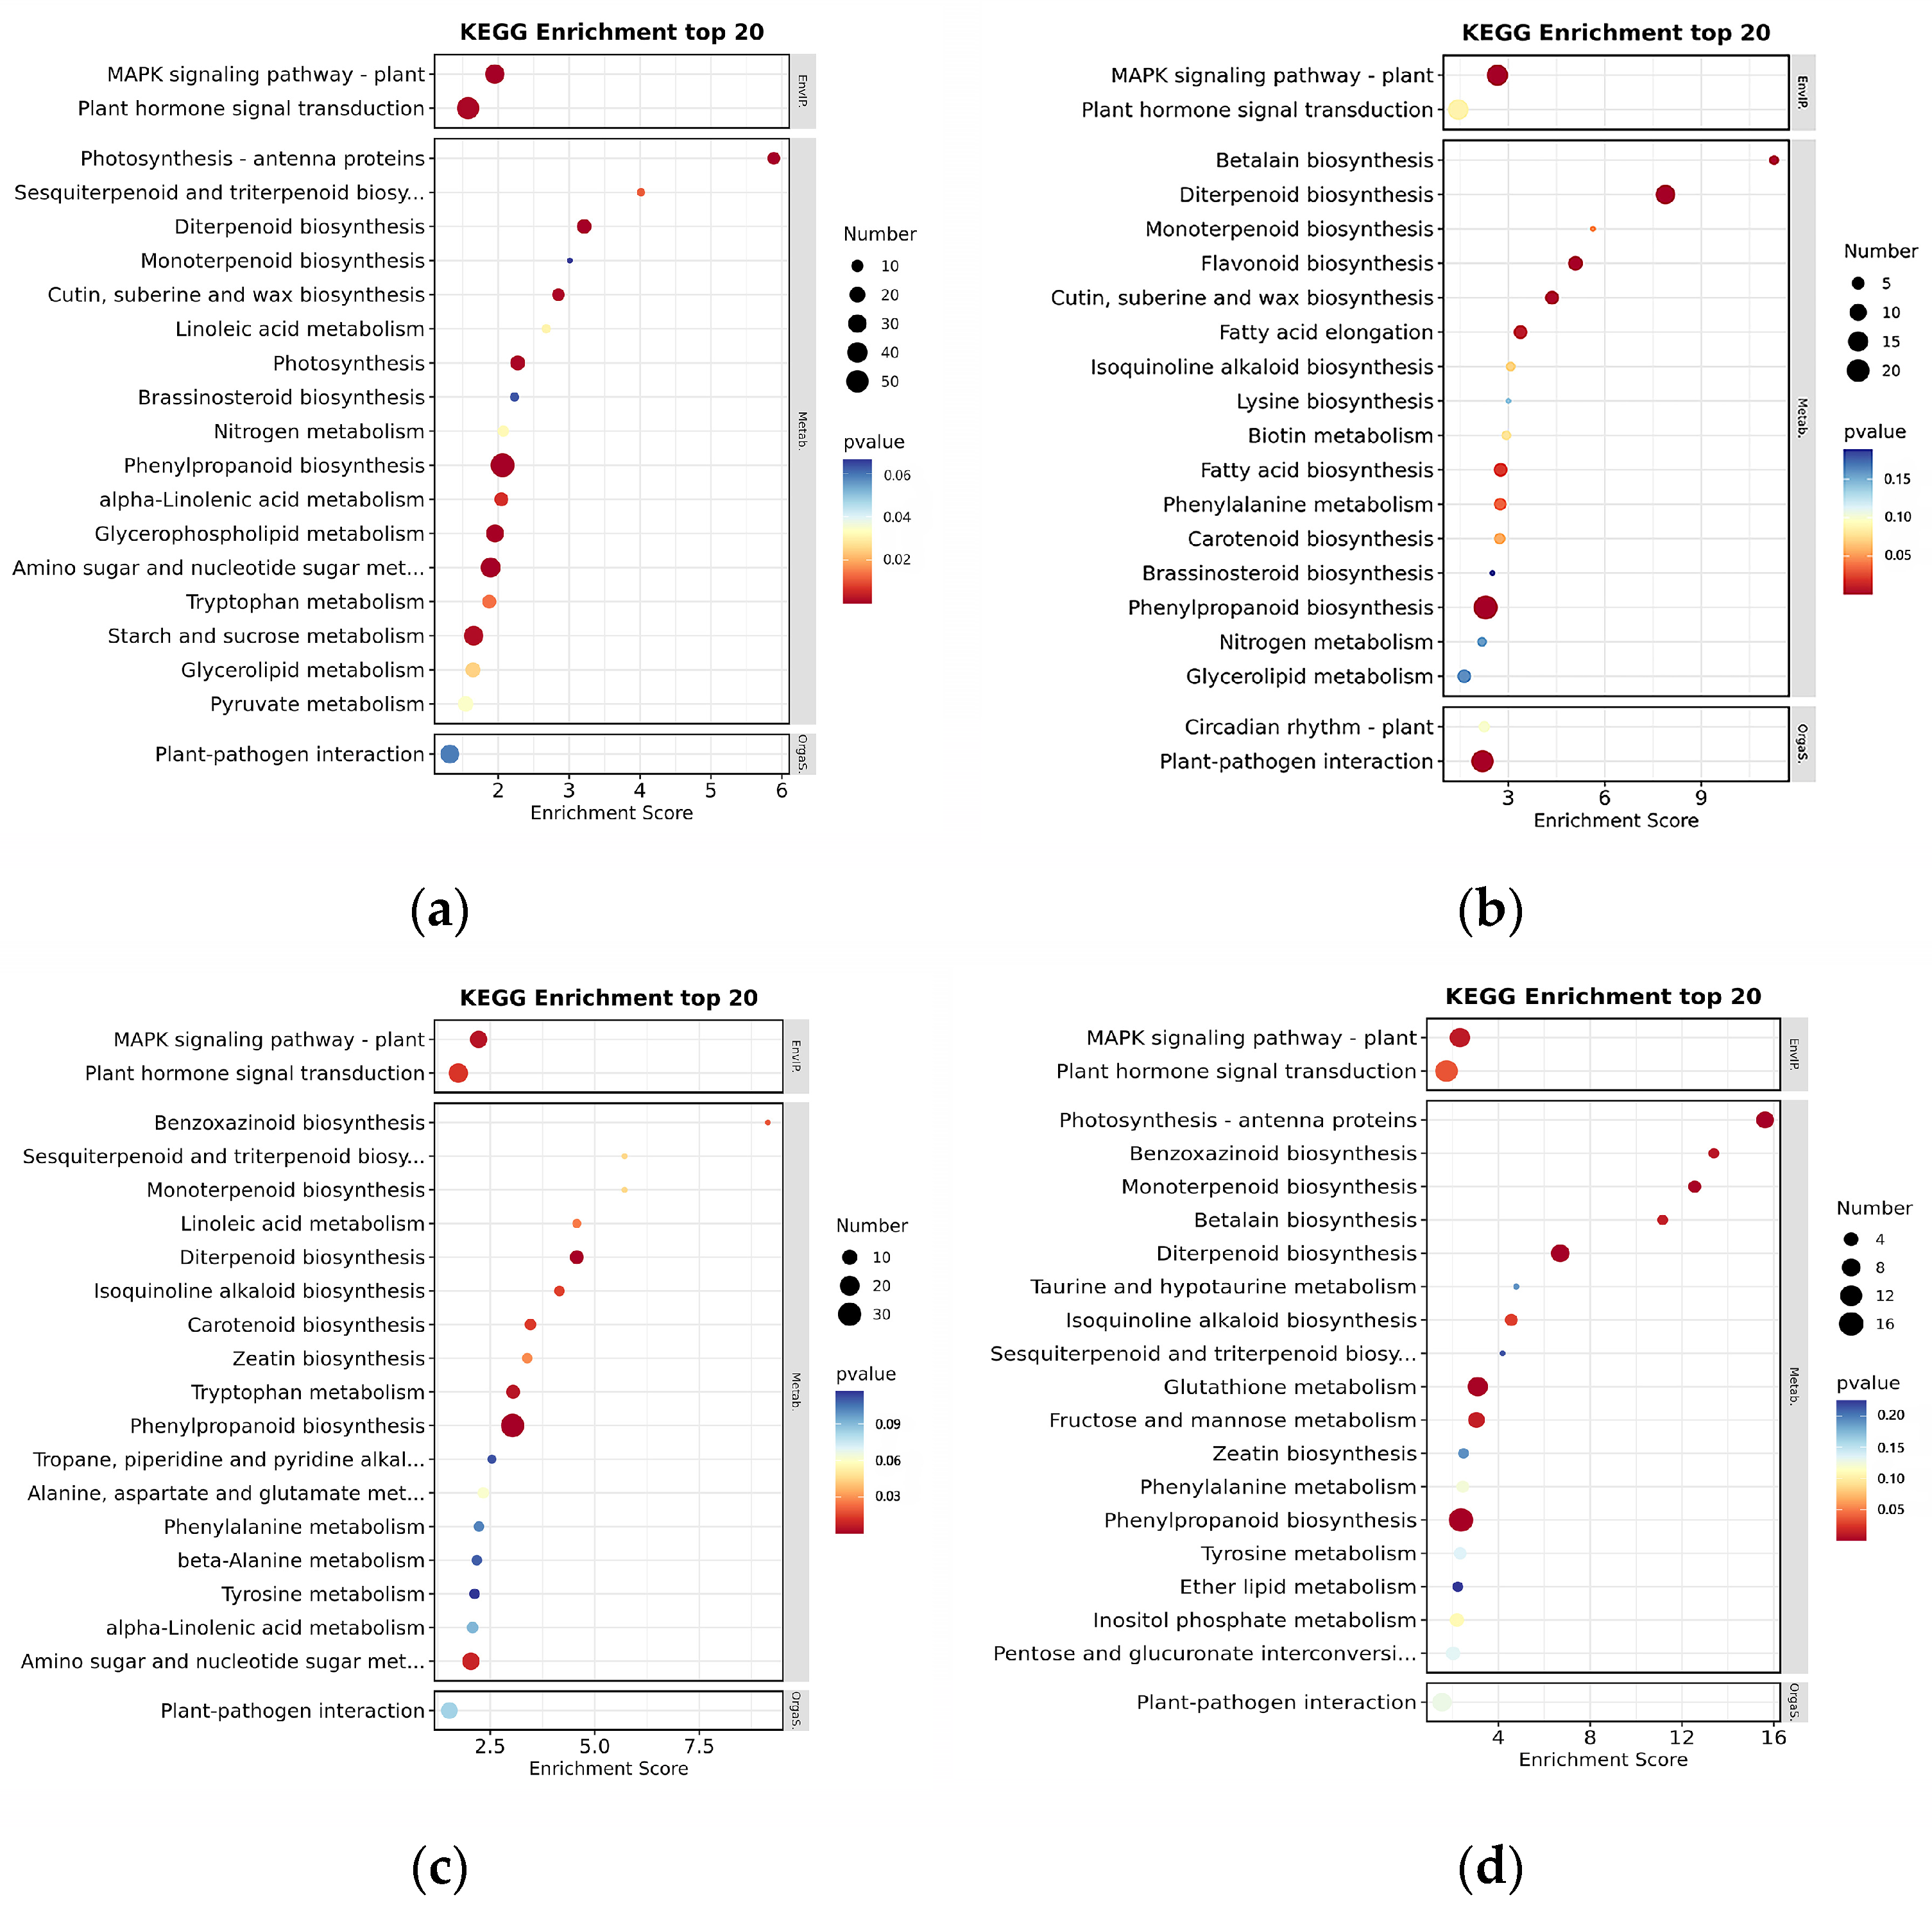
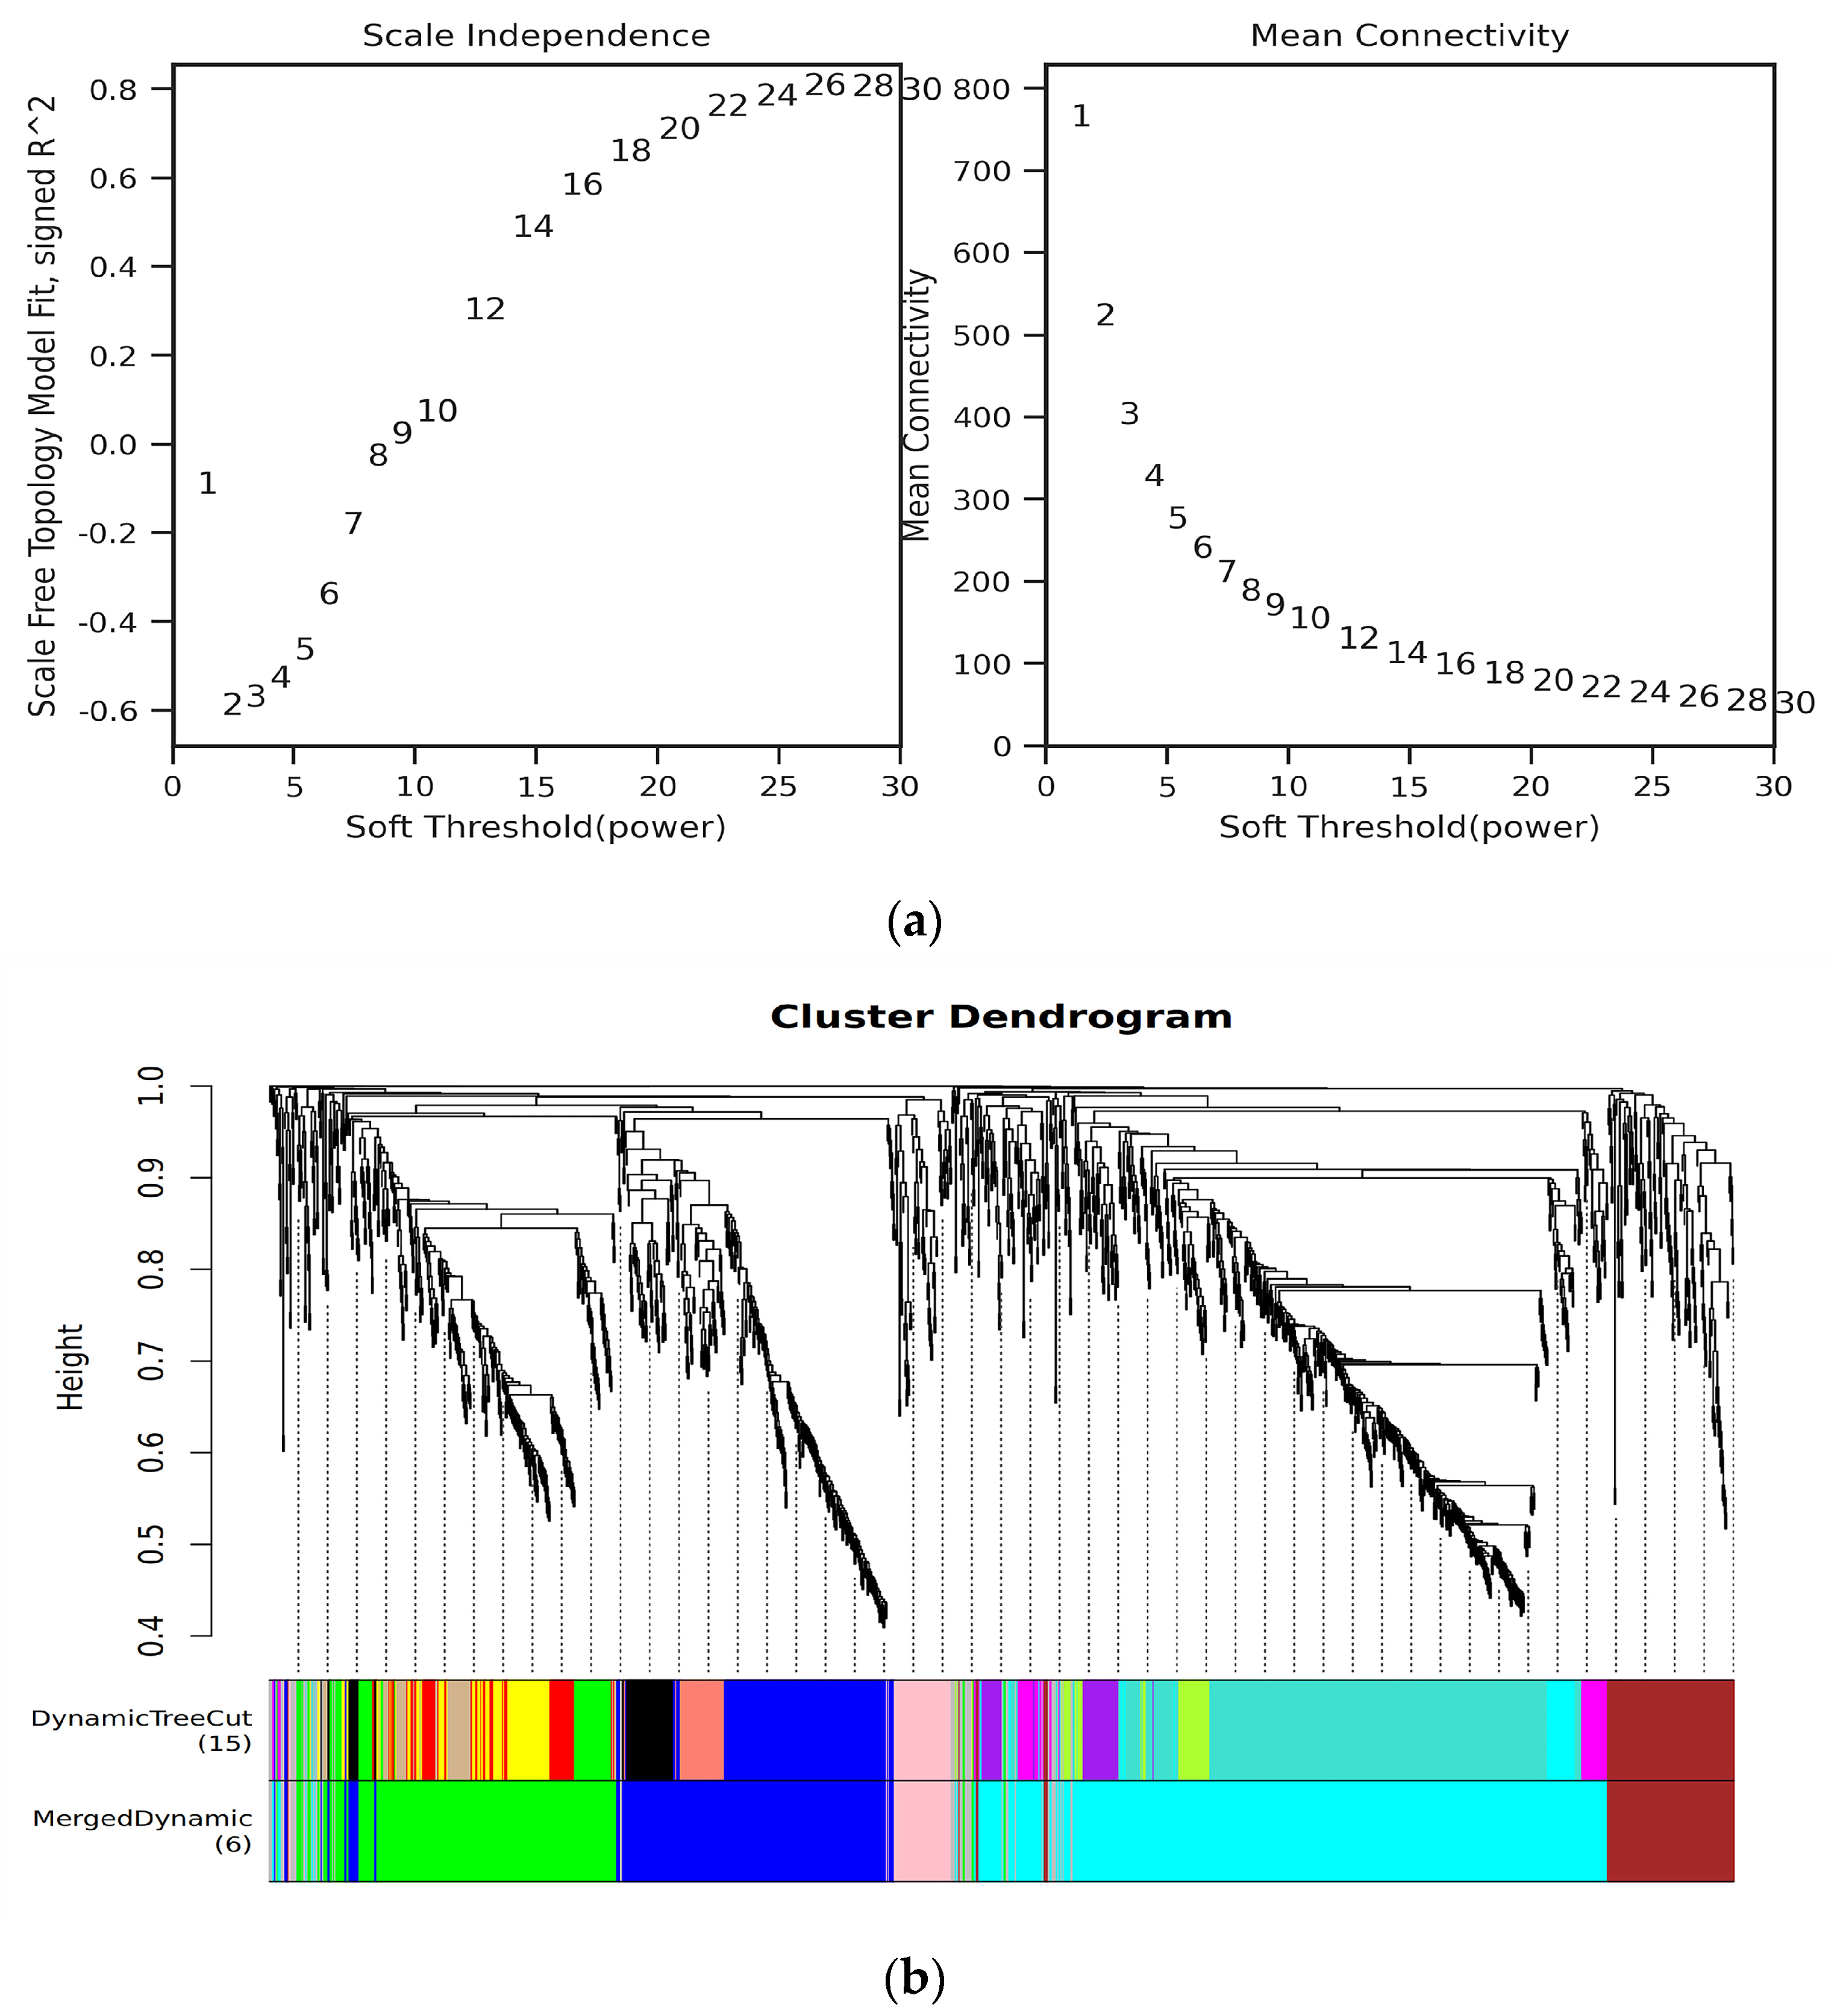
3.2. Analysis of DEGs by RNA-Seq

A total of 5752 genes exhibited differential expression at one or more time points. Specifically, comparing with IMA treatment, 3864 DEGs (1956 upregulated, 1908 downregulated) in IMA + PQQ treatment were identified at 12 h, 1568 (790 upregulated, 778 downregulated) at 24 h, 1463 (1051 upregulated, 412 downregulated) at 36 h, and 1083 (453 upregulated, 630 downregulated) at 48 h (Figure 2a). Notably, the number of DEGs decreased as treatment time increased. Comparative analysis of the Venn diagram among the four time points revealed 58 shared DEGs (Figure 2b), but no genes were consistently upregulated or downregulated.
In GO enrichment analysis, DEGs were enriched in various terms across all four time points, including heme binding, DNA-binding transcription factor activity, iron ion binding, response to abscisic acid, monooxygenase activity, apoplast, and extracellular region. Specifically, at 12 h post-treatment, DEGs were mainly enriched in GO terms related to cell wall organization, anchored component of membrane, and anchored component of plasma membrane (Figure 3a). At 24 h, the enrichment shifted to GO terms associated with the response to biotic stimulus, flavonoid biosynthetic process, and gibberellin 2-beta-dioxygenase activity (Figure 3b). At 36 h, DEGs were primarily enriched in GO terms related to the cell wall, xyloglucan:xyloglucosyl transferase activity, and hydrolase activity: hydrolyzing O-glycosyl compounds (Figure 3c). At 48 h, the predominant enrichment was observed in GO terms such as RNA polymerase II proximal promoter sequence-specific DNA binding, sequence-specific DNA binding, and positive regulation of transcription from RNA polymerase II promoter in response to heat stress (Figure 3d).
Regarding reactive oxygen species, 10 DEGs were enriched in the response to hydrogen peroxide at 24 h, while 57 and 32 DEGs were enriched in the response to oxidative stress at 12 and 36 h, respectively. Additionally, 41 and 19 DEGs were enriched in oxidoreductase activity (acting on paired donors with incorporation or reduction in molecular oxygen) at 12 and 24 h, respectively, and 31, 17, and 15 DEGs were enriched in oxidoreductase activity (acting on paired donors with incorporation or reduction of molecular oxygen, NAD(P)H as one donor, and incorporation of one atom of oxygen) at 12, 24, and 48 h, respectively. At 12, 36, and 48 h, 44, 25, and 14 DEGs were enriched in the hydrogen peroxide catabolic process, respectively, and 46, 25, and 15 genes were enriched in peroxidase activity. At 36 h, 86 and 12 DEGs were enriched in the defense response and glutathione transferase activity, respectively, while nine DEGs were enriched in the glutathione metabolic process at 48 h. At 12 and 36 h, 25 and 13 DEGs were enriched in UDP-glycosyltransferase activity, respectively; five and three DEGs were enriched in detoxification at 36 and 48 h, respectively.
The results of KEGG pathway analysis revealed that these transcriptional products were predominantly concentrated in the metabolic pathways, with a few enriched in environmental information processing and organismal systems. DEGs were mainly involved in phenylpropanoid biosynthesis, diterpenoid biosynthesis, and the MAPK signaling pathway-plant. Additionally, across all four time points, DEGs were enriched in pathways such as photosynthesis-antenna proteins, plant hormone signal transduction, and monoterpenoid biosynthesis. Specifically, DEGs were significantly enriched in amino sugar and nucleotide sugar metabolism, glycerophospholipid metabolism, and photosynthesis at 12 h (Figure 4a). At 24 h, DEGs were significantly enriched in flavonoid biosynthesis, betalain biosynthesis, and cutin, suberine, and wax biosynthesis (Figure 4b). At 36 h, significant enrichment was observed in tryptophan metabolism, amino sugar and nucleotide sugar metabolism, and carotenoid biosynthesis (Figure 4c). At 48 h, DEGs were significantly enriched in glutathione metabolism, benzoxazinoid biosynthesis, and betalain biosynthesis (Figure 4d).
Among the modules, the cyan module contained the most genes with 619 genes, while the grey and pink modules contained the fewest genes, with 62 genes for each module. A total of 38,339 genes were identified from IMA and IMA + PQQ treatments. Genes showing low expression variability (standard deviation ≤ 0.75) were filtered, resulting in 1466 genes. The optimal power value calculated was 26, which was used to construct a weighted co-expression network model (Figure 5a). Modular clustering identified six distinct modules: cyan, blue, green, brown, pink, and grey. The grey module represents genes that did not belong to any specific module and were deemed non-informative. Among these modules, the cyan module contained the highest number of genes (619), followed by the blue module (295), green module (293), brown module (135), and the grey and pink modules with the fewest genes (62 each) (Figure 5b).
Among the five modules excluding the grey module, the green and brown modules had an absolute CC of 0.41 and 0.43, respectively. The eigengenes of these modules were significantly correlated with resistance traits, with the green module showing a positive correlation and the brown module showing a negative correlation (Figure 6a). Subsequently, the correlation between the gene expression levels within the green and brown modules and the corresponding traits (gene significance, GS), as well as the correlation between the gene expression levels and the module eigengenes were calculated. Scatter plots depicting the relationship between resistance traits and module genes showed that genes within these modules exhibited a high correlation with both the traits and the module eigengenes. This indicates that the differentially expressed genes in the green and brown modules may be associated with rice tolerance to IMA (Figure 6b).

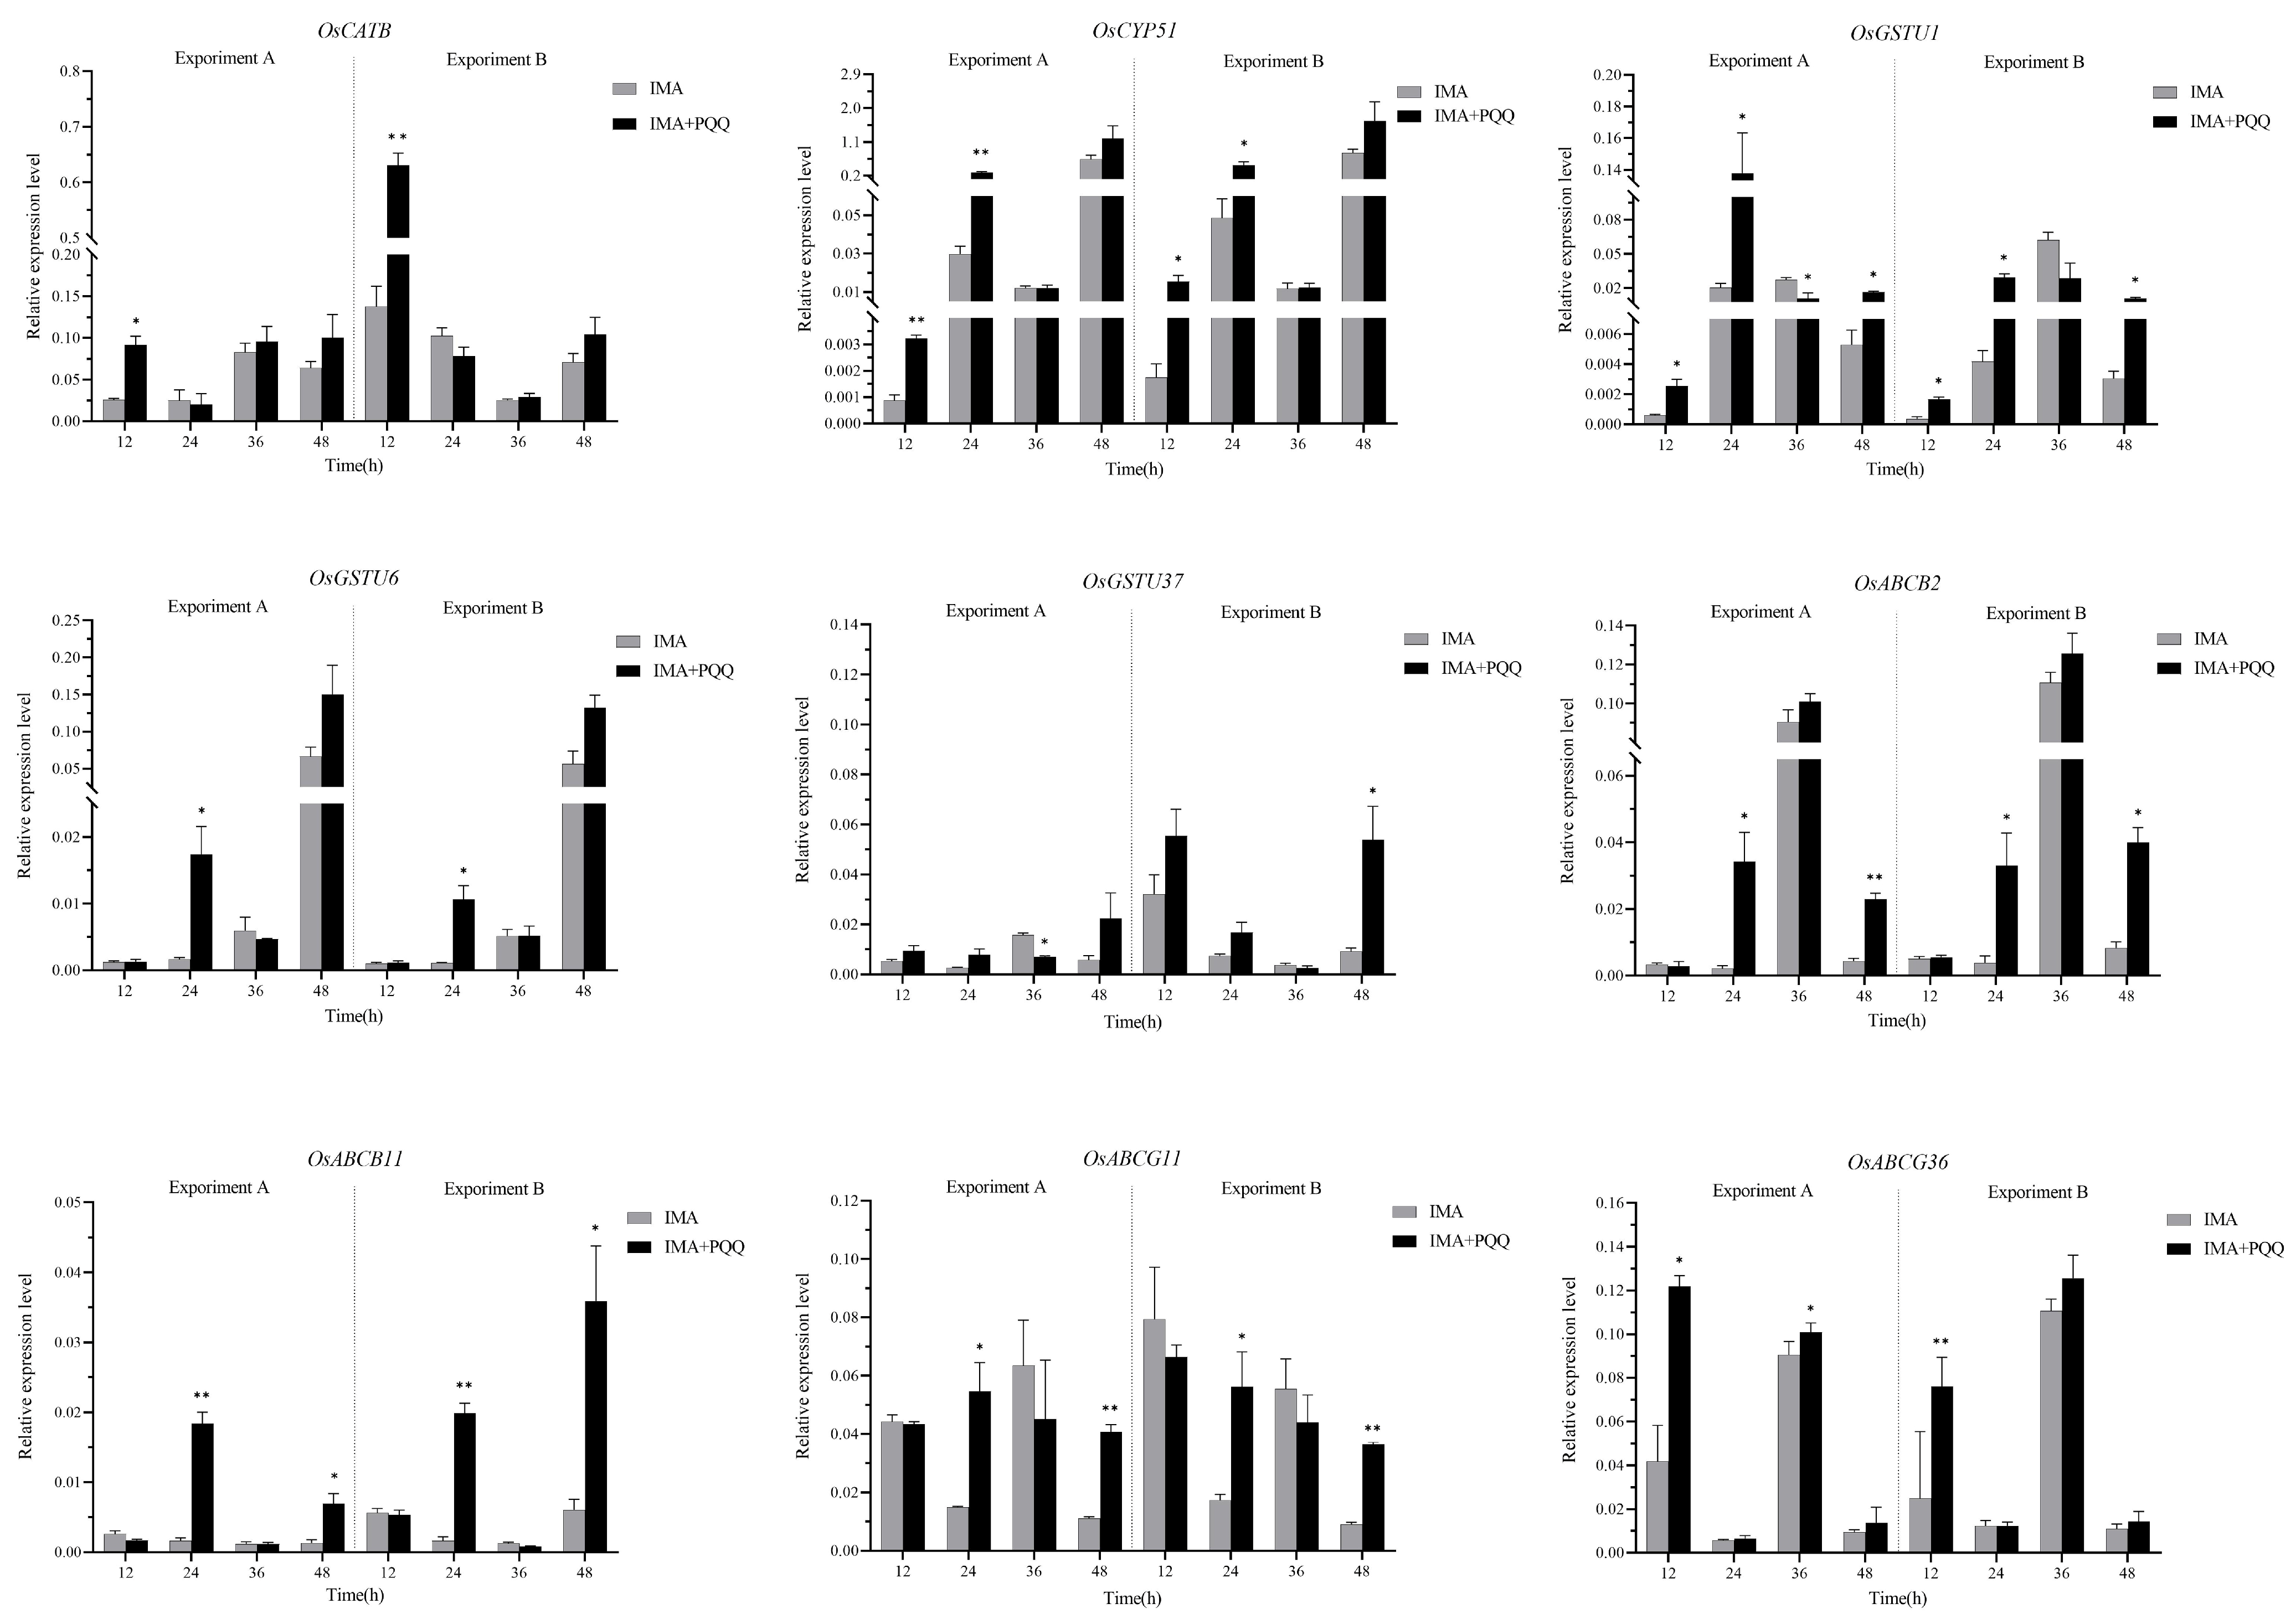
3.3. Verification of the DEGs by RT-qPCR Assay

RT-qPCR analysis was performed on selected candidate genes including OsCATB, OsGSTU1, OsGSTU6, OsGSTU37, OsCYP51, OsABCB2, OsABCB11, OsABCG11, and OsABCG36. These genes met the criteria of p-value < 0.05 and |log2FC| > 1.0 at 12, 24, 36, and 48 h post-treatment for evaluation. For leaf samples in the IMA + PQQ and IMA treatments at 12, 24, and 48 h, RT-qPCR analysis showed that OsCATB, OsGSTU1, OsCYP51, and OsABCG36 were significantly upregulated at 12 h. OsGSTU1, OsGSTU6, OsCYP51, OsABCB2, OsABCB11, and OsABCG11 were significantly upregulated at 24 h. OsGSTU1, OsABCB2, OsABCB11, and OsABCG11 were significantly upregulated at 48 h. Notably, OsGSTU1 was upregulated at 12, 24, and 48 h, and OsABCB11 showed significantly higher FC values of 11.08 (Experiment A) and 12.12 (Experiment B) at 24 h, and 5.19 (Experiment A) and 5.92 (Experiment B) at 48 h, respectively, compared to eight other genes at 24 and 48 h (Figure 7).

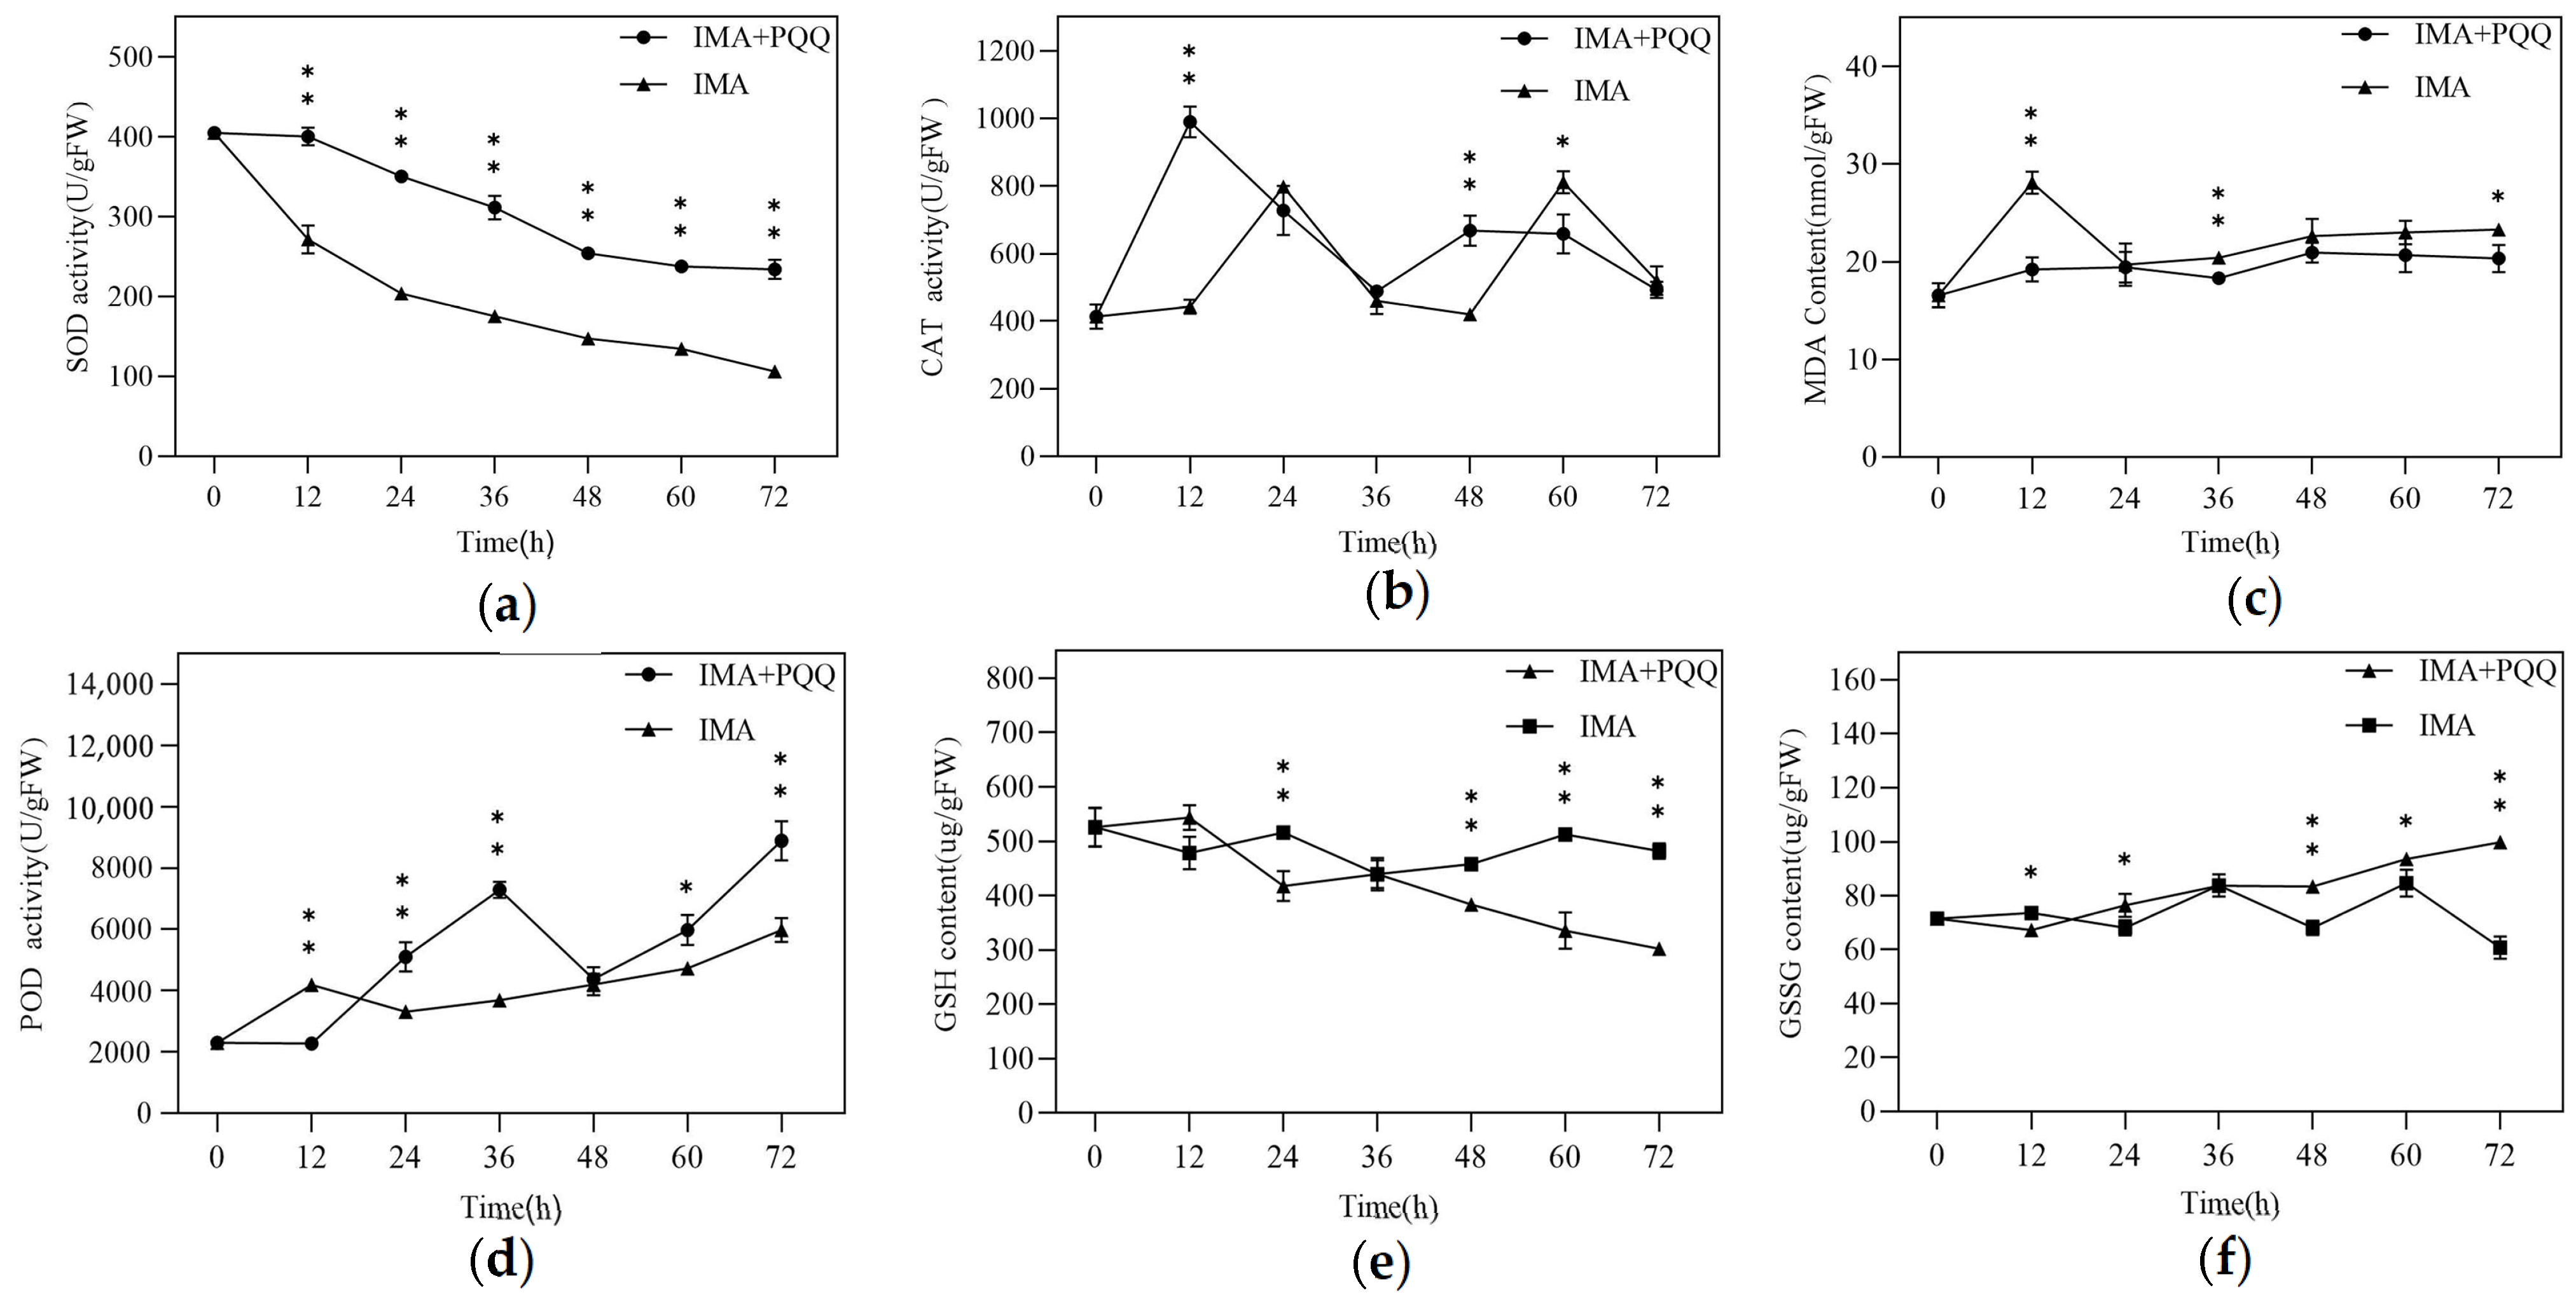
3.4. Key Indicators of Enzyme Activity in Redox Processes and Related Detoxification Enzymes

The results indicated a downward trend in SOD activity in both groups at all time points, with the IMA + PQQ group consistently showing higher activity than the IMA group. Specifically, at 12, 24, 36, 48, 60, and 72 h, SOD activity in the IMA + PQQ group was significantly increased by 47.45, 72.07, 77.58, 72.94, 76.60, and 120.31%, respectively, suggesting that PQQ treatment may enhance SOD activity in rice plants (Figure 8a). The CAT activity in the IMA + PQQ group was also significantly higher than that in the IMA group, with an increase of 123.72 and 59.04% at 12 and 48 h, respectively (Figure 8b). Furthermore, the oxidative damage indicator MDA was significantly higher than that in the IMA group, with an increase of 46.29, 11.37, and 14.50% at 12, 36, and 72 h, respectively. This indicates greater oxidative damage in the IMA group, resulting in elevated MDA levels. In contrast, MDA levels in the IMA + PQQ group remained relatively stable, suggesting that PQQ treatment enhanced CAT activity and antioxidant capacity, thereby reducing oxidative damage in rice (Figure 8c). Although POD activity in the IMA + PQQ group was lower than in the IMA group at 12 h, it was higher during 24~72 h, with significant increases of 54.22, 97.65, 26.33, and 48.54% at 24, 36, 60, and 72 h, respectively (Figure 8d). These results indicate that PQQ treatment can increase rice resistance to IMA by enhancing CAT and POD activities, thus improving antioxidant capacity.
Additionally, the levels of reduced GSH and GSSG were measured. In the IMI + PQQ group, GSH levels initially increased and then decreased, while GSSG levels exhibited the opposite trend. In the IMA group, GSH and GSSG levels fluctuated within a certain range, however the GSH levels in the IMA + PQQ group were significantly increased by 19.07, 16.21, 34.55, and 37.32% at 24, 48, 60, and 72 h, respectively. Conversely, the GSSG levels in the IMI + PQQ group were significantly decreased by 12.10, 22.44, 10.63, and 64.55% at the same time points (Figure 8e,f). These results suggest that PQQ treatment may enhance the binding affinity of GSH to toxic substances such as herbicides or ROS, thereby reducing plant damage and conferring tolerance to imazamox in rice.

4. Discussion

The application of herbicides to crops often triggers an oxidative burst, leading to the accumulation of ROS and consequent crop damage. Antioxidant enzymes play a crucial role in mitigating such stress by scavenging ROS and thereby reducing the detrimental effects of herbicides on plants. Previous research showed that rice and Brassica napus exhibited increased levels of ROS after exposure of oxyfluorfen and paraquat, and metazachlor, respectively [19,20]. This oxidative stress response was accompanied by a concomitant increase in CAT activity, which helped to alleviate plant damage [19,20]. Zhang et al. investigated the response of Capsella bursa-pastoris to tribenuron-methyl using RNA-seq analysis and RT-qPCR assay. They identified upregulation of POD31 and POD42 in POD family in resistant populations, suggesting a possible link to tribenuron-methyl resistance [21]. Similarly, after treatment with mesosulfuron-methyl, resistant populations of Beckmannia syzigachne exhibited significantly higher CAT and POD enzyme activities compared to sensitive populations [22]. RNA-seq and RT-qPCR validation further revealed the upregulation of CAT1, POD2, and POD12 in the resistant populations. These findings implied that antioxidant enzymes, particularly CAT and POD, were involved in the resistance mechanism of B. syzigachne to mesosulfuron-methyl [22]. In this study, significant differences in the physiological responses of rice plants treated with IMA + PQQ were observed compared to those treated with IMA alone. For example, in the IMA + PQQ treated rice plants, CAT enzyme activity was significantly increased at 12 and 48 h, and OsCATB expression was notably upregulated at 12 h. These results indicated that PQQ treatment significantly reduced oxidative damage in rice plants under imazamox stress, possibly through the increased activity of CAT and the upregulated expression of OsCATB. In addition, MDA levels, a marker of lipid peroxidation and oxidative stress, in rice plants treated with IMA + PQQ were significantly lower than those in rice plants treated with IMA only, indicating PQQ probably reduced cellular damage.
In the metabolic detoxification of herbicides, P450s play a crucial role in the initial phase by transforming herbicide molecules into more metabolizable compounds within the plant. However, these transformed compounds may still retain some herbicidal activity [23,24]. The results of RNA-seq analysis and RT-qPCR assay in this study showed that the expression levels of a P450 gene OsCYP51 were significantly upregulated. Pan et al. (2022) also confirmed that the upregulation of the CYP81A68 gene, which belongs to the P450 gene family in Echinochloa crus-galli, endows generalist metabolic resistance to commonly used ALS- and ACCase-inhibiting herbicides in rice fields and epigenetic regulation may play a role in the resistance evolution [25]. The second phase involves conjugating herbicides or their major degradation products with common plant metabolites such as glutathione, sugars, and amino acids, rendering these intermediates water-soluble and non-herbicidal [26]. Crops like wheat (Triticum aestivum), maize (Zea mays), and sorghum (Sorghum bicolor) exhibit high GST activity, which contributes to herbicide selectivity [27]. For example, maize with high GST activity is generally tolerant to atrazine, a systemic selective herbicide [28,29]. The results of RNA-seq and RT-qPCR analyses revealed that the expression levels of GSTU1 and GSTU6 were significantly upregulated in the present study. Zhao et al. (2019) also confirmed that GSTU1 and GSTU6 are key genes involved in the metabolism of mesosulfuron-methyl, an ALS inhibitor, in Alopecurus aequalis [30]. The third phase involves sequestering the metabolites into plant cellular “warehouses,” such as vacuoles or cell walls, where they exhibit minimal movement and lose their ability to bind to target enzymes. A crucial group of substances responsible for transporting these metabolites into vacuoles are the ABC transporters [31,32]. In this study, the results revealed that the expression levels of OsABCB2, OsABCB11, OsABCG11, and OsABCG36 were significantly upregulated. OsABCB11 exhibited the highest expression at 24 and 48 h after IMA + PQQ treatment, suggesting that OsABCB11 may play a crucial role in enhancing PQQ-induced the tolerance of rice to imazamox.
The ABC transporters constitute a large family of proteins found widely in animals, plants, and microorganisms, maintaining a similar structure across these species. Most of these proteins are localized to the membranes of chloroplasts and mitochondria [33,34,35,36,37]. Despite the identification of numerous ABC protein-encoding sequences, only a few have clearly defined their functions. Qi et al. (2022) demonstrated that ABC transporters regulate auxin accumulation, mediating E. crus-galli resistance to quinclorac [38]. Ethylene inhibits photosynthesis and generates H2O2 and reactive oxygen species, causing plant death. Upon quinclorac treatment, the expression of EcABCB4 (auxin influx) was increased in sensitive populations, while the expressions of EcABCB1 (auxin efflux) and EcABCB19 (basal transport) were decreased, leading to the accumulation of IAA at the root tips and stimulating ethylene biosynthesis. In resistant populations, the expressions of EcABCB1 and EcABCB19 were increased, while the expression of EcABCB4 was decreased maintaining a normal IAA concentration gradient and preventing ethylene biosynthesis stimulation [38]. ABC proteins also sequester and detoxify xenobiotics. For instance, metabolites of the chloroacetamide herbicide alachlor and the sulfonylurea herbicide chlorsulfuron, conjugated with glutathione, are transported into the vacuoles of mung bean (Vigna radiata), barley (Hordeum vulgare), and sugar beet (Beta vulgaris) in a Mg2+-ATP-dependent manner [39,40]. Similarly, the expressions of A. thaliana ABC transporters (AtMPR1 and AtMPR2) in yeast were associated with the transport of met-GS and DNP-GS into vacuoles [41,42]. Pan et al. (2021) found that EcABCC8 in E. crus-galli expels glyphosate from plant cells, contributing to glyphosate resistance. Subcellular localization analysis and glyphosate content measurement in ABCC8 transgenic rice protoplasts, along with structural modeling, supported that EcABCC8 is a plasma membrane-localized transporter, extruding glyphosate from the cytoplasm to the apoplast, reducing intracellular glyphosate concentration and its toxicity [43]. Our results indicated that these genes of OsABCB2, OsABCB11, OsABCG11, and OsABCG36 were significantly upregulated in IMA + PQQ-treated rice leaves. These genes are likely involved in the transport of herbicides, potentially sequestering them into vacuoles or exporting them out of the cytoplasm to reduce their toxicity. This upregulated expression suggests that PQQ treatment enhances the expression of transport proteins, which play a crucial role in herbicide detoxification by compartmentalizing and effluxing harmful compounds.
Research on the role of ABC transporters in herbicide resistance is relatively limited compared to GSTs and P450s. In future, a specific gene like OsABCB11 will be focused on to elucidate the detoxification mechanisms for imidazolinones. The function of this gene can be explored using CRISPR/Cas9 gene editing, transgenic technology, eukaryotic expression, subcellular localization, and molecular docking. This comprehensive study will aid in the development of herbicide-tolerant or -resistant rice varieties, and will provide a theoretical basis for the management of resistant weeds.

5. Conclusions

In summary, RNA-seq analysis revealed that DEGs were primarily enriched in the phenylpropanoid biosynthesis, diterpenoid biosynthesis, and MAPK signaling pathways in rice plants at 12, 24, 36, and 48 h, with additional enrichment in photosynthesis-antenna proteins, plant hormone signal transduction, and monoterpenoid biosynthesis pathways. RT-qPCR assays demonstrated the upregulation of OsGSTU1 with 4.49, 7.06, and 3.58 times at 12, 24, and 48 h post-treatment, respectively, while OsABCB11 showed the highest upregulation at 24 and 48 h, which was 12.12 and 5.92 times, respectively. These findings indicated a close association between OsABCB11 and rice tolerance to imazamox. Compared to IMA treatment, SOD activity was increased by 47.45~120.31% in IMA + PQQ treatment during 12~72 h, CAT activity and MDA content were increased by 123.72 and 46.29% in IMA + PQQ treatment at 12 h, respectively, and POD activity was increased by 26.33~97.65% in IMA + PQQ treatment during 24~72 h. These results suggested that PQQ treatment potentially enhanced the antioxidant capacity of rice plants by the increased activities of CAT, POD, and SOD, thereby conferring resistance to oxidative stress. Moreover, PQQ treatment might enhance the binding affinity of GSH with toxic substances, such as herbicides or ROS, reducing rice plant damage and enhancing tolerance to injury. Collectively, these results demonstrated that PQQ significantly induced rice tolerance to imazamox. This study provides guidance for reducing imazamox damage and ensuring the safe application of imazamox in rice production, and offers valuable candidate genes for breeding rice varieties tolerant to imidazolinones.

Supplementary Materials

The following supporting information can be downloaded at: https://www.mdpi.com/article/10.3390/agronomy14071572/s1, Table S1: Primers used in RT-qPCR assay.

Author Contributions

L.B. and Y.Z. designed the study; S.L., S.H. and K.L. performed experiments; S.L. and S.H. analyzed data; S.L., S.H. and T.T. wrote the original draft.; G.M., D.L., Y.P. and Y.L. reviewed and edited the manuscript. All authors have read and agreed to the published version of the manuscript.

Funding

This research was supported by the National Key Research and Development Program of China (No. 2023YFD1401100), the National Natural Science Foundation of China (No. 32102239), and the Science and Technology Talent Support Project of Hunan Province (No. 2023TJ-N11).

Data Availability Statement

The datasets generated for this study can be found in the online repositories. The names of the repository/repositories and accession number(s) can be found below: https://www.ncbi.nlm.nih.gov/ (accessed on 19 May 2024), PRJNA1112594.

Acknowledgments

The authors are grateful to the State Key Laboratory of Hybrid Rice for providing the experimental site and related equipment for this study.

Conflicts of Interest

All other authors declare no conflicts of interest.

References

  1. Burgos, N.R.; Singh, V.; Tseng, T.M.; Black, H.; Young, N.D.; Huang, Z.; Hyma, K.E.; Caicedo, A.L.; Gealy, D.R. The impact of herbicide-resistant rice technology on phenotypic diversity and population structure of United States weedy rice. Plant Physiol. 2014, 166, 1208–1220. [Google Scholar] [CrossRef] [PubMed]
  2. Han, B.; Ma, X.; Cui, D.; Wang, Y.; Geng, L.; Cao, G.; Zhang, H.; Han, L. Comprehensive evaluation and analysis of the mechanism of cold tolerance based on the transcriptome of weedy rice seedlings. Rice 2020, 13, 12. [Google Scholar] [CrossRef] [PubMed]
  3. Watanabe, H. Weedy rice complexes: Case studies from Malaysia, Vietnam, and Surinam. In Proceedings of the Wild and Weedy Rice in Rice Ecosystems in Asia—A Review (Ho Chi Minh City, Vietnam, 10–11 August 1998); International Rice Research Institute: Laguna, Philippines, 2000; pp. 25–34. [Google Scholar]
  4. Zhang, Y.; Fang, J.; Wu, X.; Dong, L. Na+/K+ balance and transport regulatory mechanisms in weedy and cultivated rice (Oryza sativa L.) under salt stress. BMC Plant Biol. 2018, 18, 375. [Google Scholar] [CrossRef] [PubMed]
  5. Baek, J.S.; Chung, N.J. Seed wintering and deterioration characteristics between weedy and cultivated rice. Rice 2012, 5, 21. [Google Scholar] [CrossRef] [PubMed]
  6. Sudianto, E.; Beng-Kah, S.; Ting-Xiang, N.; Saldain, N.E.; Scott, R.C.; Burgos, N.R. Clearfield rice: Its development, success, and key challenges on a global perspective. Crop Prot. 2013, 49, 40–51. [Google Scholar] [CrossRef]
  7. de Avila, L.A.; Marchesan, E.; Camargo, E.R.; Merotto, A.; da Rosa Ulguim, A.; Noldin, J.A.; Andres, A.; Mariot, C.H.; Agostinetto, D.; Dornelles, S.H.; et al. Eighteen years of Clearfield™ rice in Brazil: What have we learned? Weed Sci. 2021, 69, 585–597. [Google Scholar] [CrossRef]
  8. Grover, N.; Kumar, A.; Yadav, A.K.; Gopala Krishnan, S.; Ellur, R.K.; Bhowmick, P.K.; Vinod, K.K.; Bollinedi, H.; Nagarajan, M.; Viswanathan, C.; et al. Marker assisted development and characterization of herbicide tolerant near isogenic lines of a Mega Basmati rice variety, “Pusa Basmati 1121”. Rice 2020, 13, 68. [Google Scholar] [CrossRef] [PubMed]
  9. Shoba, D.; Raveendran, M.; Manonmani, S.; Utharasu, S.; Dhivyapriya, D.; Subhasini, G.; Ramchandar, S.; Valarmathi, R.; Grover, N.; Krishnan, S.G.; et al. Development and genetic characterization of a novel herbicide (imazethapyr) tolerant mutant in rice (Oryza sativa L.). Rice 2017, 10, 10. [Google Scholar] [CrossRef] [PubMed]
  10. Maqbool, I.; Sudharsan, M.; Kanimozhi, G.; Alrashood, S.T.; Khan, H.A.; Prasad, N.R. Crude cell-free extract from Deinococcus radiodurans exhibit anticancer activity by inducing apoptosis in triple-negative breast cancer cells. Front. Cell Dev. Biol. 2020, 8, 707. [Google Scholar] [CrossRef]
  11. Broderick, J.B.; Duffus, B.R.; Duschene, K.S.; Shepard, E.M. Radical S-adenosylmethionine enzymes. Chem. Rev. 2014, 114, 4229–4317. [Google Scholar] [CrossRef]
  12. Campillo-Brocal, J.C.; Lucas-Elio, P.; Sanchez-Amat, A. Identification in M arinomonas mediterranea of a novel quinoprotein with glycine oxidase activity. Microbiologyopen 2013, 2, 684–694. [Google Scholar] [CrossRef] [PubMed]
  13. Richhardt, J.; Luchterhand, B.; Bringer, S.; Büchs, J.; Bott, M. Evidence for a key role of cytochrome bo3 oxidase in respiratory energy metabolism of Gluconobacter oxydans. J. Bacteriol. 2013, 195, 4210–4220. [Google Scholar] [CrossRef] [PubMed]
  14. Zhang, F.; Zhao, X.; Shen, H.; Zhang, C. Molecular mechanisms of cell death in intervertebral disc degeneration (Review). Int. J. Mol. Med. 2016, 37, 1439–1448. [Google Scholar] [CrossRef] [PubMed]
  15. Feng, C.; Yang, M.; Lan, M.; Liu, C.; Zhang, Y.; Huang, B.; Liu, H.; Zhou, Y. ROS: Crucial intermediators in the pathogenesis of intervertebral disc degeneration. Oxid. Med. Cell. Longev. 2017, 1, 5601593. [Google Scholar] [CrossRef] [PubMed]
  16. Medina, M.; Rizo, A.; Dinh, D.; Chau, B.; Omidvar, M.; Juarez, A.; Ngo, J.; Johnson, H.A. MopA, the Mn oxidizing protein from Erythrobacter sp. SD-21, requires Heme and NAD+ for Mn(II) oxidation. Front. Microbiol. 2018, 9, 2671. [Google Scholar] [CrossRef] [PubMed]
  17. Rajpurohit, Y.S.; Gopalakrishnan, R.; Misra, H.S. Involvement of a protein kinase activity inducer in DNA double strand break repair and radioresistance of Deinococcus radiodurans. J. Bacteriol. 2008, 190, 3948–3954. [Google Scholar] [CrossRef] [PubMed]
  18. Choi, O.; Kim, J.; Kim, J.G.; Jeong, Y.; Moon, J.S.; Park, C.S.; Hwang, I. Pyrroloquinoline quinone is a plant growth promotion factor produced by Pseudomonas fluorescens B16. Plant Physiol. 2008, 146, 657. [Google Scholar] [CrossRef]
  19. Kim, J.G.; Jung, S. Differential antioxidant mechanisms of rice plants in response to oxyfluorfen and paraquat. Weed Turfgrass Sci. 2013, 2, 254–259. [Google Scholar] [CrossRef]
  20. Vercampt, H.; Koleva, L.; Vassilev, A.; Vangronsveld, J.; Cuypers, A. Short-term phytotoxicity in Brassica napus (L.) in response to pre-emergently applied metazachlor: A microcosm study. Environ. Toxicol. Chem. 2017, 6, 59–70. [Google Scholar] [CrossRef]
  21. Zhang, X.; Wang, H.; Bei, F.; Wu, C.; Zhang, L.; Jia, S.; Wang, J.; Liu, W. Investigating the mechanism of metabolic resistance to tribenuron-methyl in Capsella bursa-pastoris (L.) Medik. by full-length transcriptome assembly combined with RNA-Seq. J. Agric. Food Chem. 2021, 69, 3692–3701. [Google Scholar] [CrossRef]
  22. Wang, J.; Cao, W.; Guo, Q.; Yang, Y.; Bai, L.; Pan, L. Resistance to mesosulfuron-methyl in Beckmannia syzigachne may involve ROS burst and non-target-site resistance mechanisms. Ecotoxicol. Environ. Saf. 2022, 229, 113072. [Google Scholar] [CrossRef] [PubMed]
  23. Busi, R.; Vila-Aiub, M.M.; Powles, S.B. Genetic control of a cytochrome P450 metabolism-based herbicide resistance mechanism in Lolium rigidum. Heredity 2011, 106, 817–824. [Google Scholar] [CrossRef] [PubMed]
  24. Iwakami, S.; Endo, M.; Saika, H.; Okuno, J.; Nakamura, N.; Yokoyama, M.; Watanabe, H.; Toki, S.; Uchino, A.; Inamura, T. Cytochrome P450 CYP81A12 and CYP81A21 are associated with resistance to two acetolactate synthase inhibitors in Echinochloa phyllopogon. Plant Physiol. 2014, 165, 618–629. [Google Scholar] [CrossRef] [PubMed]
  25. Pan, L.; Guo, Q.; Wang, J.; Shi, L.; Yang, X.; Zhou, Y.; Yu, Q.; Bai, L. CYP81A68 confers metabolic resistance to ALS and ACCase-inhibiting herbicides and its epigenetic regulation in Echinochloa crus-galli. J. Hazard. Mater. 2022, 428, 128225. [Google Scholar] [CrossRef] [PubMed]
  26. Edwards, R.; Buono, D.D.; Fordham, M.; Skipsey, M.; Brazier, M.; Dixon, D.P.; Cummins, I. Differential induction of glutathione transferases and glucosyltransferases in wheat, maize and Arabidopsis thaliana by herbicide safeners. Z. Naturforsch. C 2005, 60, 307–316. [Google Scholar] [CrossRef] [PubMed]
  27. Evans, A.F., Jr.; O’Brien, S.R.; Ma, R.; Hager, A.G.; Riggins, C.W.; Lambert, K.N.; Riechers, D.E. Biochemical characterization of metabolism-based atrazine resistance in Amaranthus tuberculatus and identification of an expressed GST associated with resistance. Plant Biotechnol. J. 2017, 15, 1238–1249. [Google Scholar] [CrossRef] [PubMed]
  28. Dücker, R.; Zöllner, P.; Lümmen, P.; Ries, S.; Collavo, A.; Beffa, R. Glutathione transferase plays a major role in flufenacet resistance of ryegrass (Lolium spp.) field populations. Pest Manag. Sci. 2019, 75, 3084–3092. [Google Scholar] [CrossRef] [PubMed]
  29. Licciardello, C.; D’Agostino, N.; Traini, A.; Recupero, G.R.; Frusciante, L.; Chiusano, M.L. Characterization of the glutathione S-transferase gene family through ESTs and expression analyses within common and pigmented cultivars of Citrus sinensis (L.) Osbeck. BMC Plant Biol. 2014, 14, 39. [Google Scholar] [CrossRef] [PubMed]
  30. Zhao, N.; Yan, Y.; Luo, Y.; Zou, N.; Liu, W.; Wan, J. Unravelling mesosulfuron-methyl phytotoxicity and metabolism-based herbicide resistance in Alopecurus aequalis: Insight into regulatory mechanisms using proteomics. Sci. Total Environ. 2019, 670, 486–497. [Google Scholar] [CrossRef]
  31. Jugulam, M.; Shyam, C. Non-target-site resistance to herbicides: Recent developments. Plants 2019, 8, 417. [Google Scholar] [CrossRef]
  32. Moretti, M.L.; Alárcon-Reverte, R.; Pearce, S.; Morran, S.; Hanson, B.D. Transcription of putative tonoplast transporters in response to glyphosate and paraquat stress in Conyza bonariensis and Conyza canadensis and selection of reference genes for qRT-PCR. PLoS ONE 2017, 12, e0180794. [Google Scholar] [CrossRef]
  33. Zhu, L.; Xu, J.; Zhang, D.B. Molecular evolution, expression and functional network prediction analysis of ABC transporter gene family in Arabidopsis thaliana. Plant Physiol. J. 2012, 48, 1151–1166. [Google Scholar] [CrossRef]
  34. Thomas, C.; Tampé, R. Structural and mechanistic principles of ABC transporters. Ann. Rev. Biochem. 2020, 89, 605–636. [Google Scholar] [CrossRef] [PubMed]
  35. Wilkens, S. Structure and mechanism of ABC transporters. F1000prime Rep. 2015, 7, 14. [Google Scholar] [CrossRef] [PubMed]
  36. Biemans-Oldehinkel, E.; Doeven, M.K.; Poolman, B. ABC transporter architecture and regulatory roles of accessory domains. FEBS Lett. 2006, 580, 1023–1035. [Google Scholar] [CrossRef] [PubMed]
  37. Dean, M.; Annilo, T. Evolution of the ATP-binding cassette (ABC) transporter superfamily in vertebrates. Annu. Rev. Genom. Hum. Genet. 2005, 6, 123–142. [Google Scholar] [CrossRef] [PubMed]
  38. Qi, Y.; Guo, Y.; Liu, X.; Gao, Y.; Sun, Y.; Dong, L.; Li, J. Potential roles of three ABCB genes in quinclorac resistance identified in Echinochloa crus-galli var. zelayensis. Agronomy 2022, 12, 1961. [Google Scholar] [CrossRef]
  39. Liu, G.; Sánchez-Fernández, R.; Li, Z.S.; Rea, P.A. Enhanced multispecificity of Arabidopsis vacuolar multidrug resistance-associated protein-type ATP-binding cassette transporter, AtMRP2. J. Biol. Chem. 2001, 276, 8648–8656. [Google Scholar] [CrossRef] [PubMed]
  40. Bartholomew, D.M.; Van Dyk, D.E.; Lau, S.M.; O’Keefe, D.P.; Rea, P.A.; Viitanen, P.V. Alternate energy-dependent pathways for the vacuolar uptake of glucose and glutathione conjugates. Plant Physiol. 2002, 130, 1562–1572. [Google Scholar] [CrossRef]
  41. Lu, Y.P.; Li, Z.S.; Rea, P.A. AtMRP1 gene of Arabidopsis encodes a glutathione S-conjugate pump: Isolation and functional definition of a plant ATP-binding cassette transporter gene. Proc. Nat. Acad. Sci. USA 1997, 94, 8243–8248. [Google Scholar] [CrossRef]
  42. Lu, Y.P.; Li, Z.S.; Drozdowicz, Y.M.; Hortensteiner, S.; Martinoia, E.; Rea, P.A. AtMRP2, an Arabidopsis ATP binding cassette transporter able to transport glutathione S-conjugates and chlorophyll catabolites: Functional comparisons with AtMRP1. Plant Cell. 1998, 10, 267–282. [Google Scholar] [CrossRef] [PubMed]
  43. Pan, L.; Yu, Q.; Wang, J.; Han, H.; Mao, L.; Nyporko, A.; Maguza, A.; Fan, L.; Bai, L.; Powles, S. An ABCC-type transporter endowing glyphosate resistance in plants. Proc. Nat. Acad. Sci. USA 2021, 118, e2100136118. [Google Scholar] [CrossRef] [PubMed]
Figure 1. Phenotype of rice after 7 d of treatment with CK, IMA + PQQ, and IMA. (a) CK, cultured using only deionized water. (b) Deionized water added IMA + PQQ. (c) Deionized water added IMA only. In (b), label “P: 2” indicates 2 μL PQQ of a stock solution at 60 mmol/L added to 60 mL of deionized water, resulting in a final concentration of 2 μmol/L, converted to 0.66 mg a.i./L. In (b,c), label “I: 100” indicates 100 μL of imazamox 4% aqueous solutions added to 60 mL of deionized water, resulting in a final concentration of 66.7 mg a.i./L.
Agronomy 14 01572 g001
Figure 2. Transcriptome sequencing results of treatment with IMA + PQQ and IMA. (a) Bar chart of differentially expressed genes, showing the number of upregulated and downregulated genes at 12, 24, 36, and 48 h after treatment. (b) Venn diagram of shared and unique DEGs at different time points.
Agronomy 14 01572 g002
Figure 3. GO enrichment analysis of DEGs at various time points in rice treated with IMA + PQQ and IMA. The 50 terms with the lowest p-values were selected for the enrichment analysis results. GO enrichment analysis of DEGs at 12 (a), 24 (b), 36 (c), and 48 h (d) after treatment.
Agronomy 14 01572 g003
Figure 4. KEGG enrichment analysis of DEGs at various time points for rice treated with IMA + PQQ and IMA. KEGG enrichment analysis of DEGs at 12 (a), 24 (b), 36 (c), and 48 h (d) after treatment. The top 20 pathways were selected based on KEGG enrichment analysis (filtered for pathway entries with PopHits ≥ 5 and sorted by descending -log10p-value). The enrichment score represents the enrichment value, with larger bubbles indicating a greater number of differentially expressed genes. The bubble color gradient from blue to red indicates increasing significance, with red representing a smaller p-value and thus greater significance.
Agronomy 14 01572 g004
Figure 5. WGCNA network construction parameters and gene clustering and module segmentation. (a) Calculation results of power values for the scale-free network linear model correspond to the network connectivity at the same soft threshold. The higher the correlation coefficient, the closer the network is to a scale-free network distribution, while ensuring a certain level of gene connectivity. (b) Gene co-expression network gene clustering and module segmentation. The upper part shows the gene clustering tree constructed from the dissTOM matrix based on the weighted correlation coefficients. The lower part shows the distribution of genes that are closer to each other in a total 15 modules, which in the same module are represented by the same color. The similar modules are merged to six modules as follows: cyan, blue, green, brown, pink, and gray. Among them, the gray module does not belong to a specific module in which genes are meaningless.
Agronomy 14 01572 g005
Figure 6. Module-phenotype correlation analysis and scatter plots. (a) Module-phenotype correlation analysis. Correlation coefficients and corresponding p-values are indicated in rectangles and parentheses, respectively. (b) Scatter plot for the green module, showing a positive correlation between module genes and resistance traits. (c) Scatter plot for the brown module, showing a negative correlation between module genes and resistance traits.
Agronomy 14 01572 g006
Figure 7. The relative expression levels of differentially overexpressed genes at 0, 12, 24, 36, and 48 h for IMA + PQQ and IMA treatments. The experiment was conducted with three biological replicates, each consisting of two technical replicates. Average values were first calculated for the two technical replicates and then for the three biological replicates. The values shown in the figure represent the mean ± standard error (SE) of the three biological replicates. Asterisks indicate significant differences between treatments (* p < 0.05, ** p < 0.01).
Agronomy 14 01572 g007
Figure 8. Changes in redox-related enzyme activities and GSH/GSSG levels at 0, 12, 24, 36, 48, 60, and 72 h for IMA + PQQ and IMA treatments. (a) SOD activity, (b) CAT activity, (c) MDA content, (d) POD activity, (e) GSH content, (f) GSSG content. The values shown are the means ± standard errors (SE) of three biological replicates. Asterisks indicate significant differences between treatments (* p < 0.05, ** p < 0.01).
Agronomy 14 01572 g008
Disclaimer/Publisher’s Note: The statements, opinions and data contained in all publications are solely those of the individual author(s) and contributor(s) and not of MDPI and/or the editor(s). MDPI and/or the editor(s) disclaim responsibility for any injury to people or property resulting from any ideas, methods, instructions or products referred to in the content.

