Article

Spatial Heterogeneity Analysis and Risk Assessment of Potentially Toxic Elements in Soils of Typical Green Tea Plantations

1
College of Environment and Resources, College of Carbon Neutrality, Zhejiang A&F University, Hangzhou 311300, China
2
Land Survey and Mapping Team of Shangyu Branch of Shaoxing Municipal Bureau of Natural Resources and Planning, Shaoxing 312300, China
3
The Institute of Computer Sciences, The University of Agriculture Peshawar, Peshawar 25000, Pakistan
4
Institute of Agricultural Resources and Environment, Sichuan Academy of Agricultural Sciences, Chengdu 610066, China
*
Authors to whom correspondence should be addressed.
These authors contributed equally to this work.
Agronomy 2024, 14(8), 1599; https://doi.org/10.3390/agronomy14081599
Submission received: 11 June 2024 / Revised: 11 July 2024 / Accepted: 18 July 2024 / Published: 23 July 2024
(This article belongs to the Section Soil and Plant Nutrition)

Abstract

:
The spatial heterogeneity of potentially toxic elements (PTEs) in a typical green tea-producing area in Zhejiang was investigated with application of geostatistics. The positive matrix factorization (PMF) was conducted for analysis of pollution sources and risk assessment of the soil of the tea garden. The results revealed that 93.52% of the study area did not exceed the PTEs risk screening value in the soil pollution risk control standard of agricultural land. The results of the spatial heterogeneity analysis showed that Cd and Pb had moderate spatial auto-correlation, exhibiting similar spatial distribution patterns. The high-value locations were distributed in the southeast of the study area, while low-value locations were distributed in the southwest of the study area. The Cr, As, and Hg had strong spatial auto-correlation, while Cr and As had similar spatial distribution patterns whose high-value areas and low-value areas were concentrated in the west and center of the study area, respectively. The Cd, Pb, and As originated from the agricultural source, transportation source, and industrial source, respectively, while Cr and Hg were from the natural source on the basis of the results of the PMF model. The results of a potential ecological risk assessment revealed that five PTEs in the study area were of low potential risk. The single-factor ecological risk ranking was Cd > As > Hg > Cr > Pb. The overall ecological risk in the study area was slight. The human health risk model indicates that there was a non-carcinogenic risk for children in the study area, and the high-value area was concentrated in the northwest of the study area. It is concluded that emphasis shall be given to excessive Cd caused by agricultural sources in the southeast of the study area, and control and monitoring will be strengthened in the northwestern part of the study area. The relevant measures for prevention of soil pollution must be conducted.

Graphical Abstract

1. Introduction

In recent years, rapid industrial and agricultural development has introduced potentially toxic elements (PTEs) into soils through various pathways such as industrial activities, agriculture, and transportation, posing direct or indirect threats to both ecosystems and human health [1,2]. It has been reported that cadmium (Cd) exposure can damage the kidneys, liver, and immune system [3]; long-term exposure to chromium (Cr) can induce skin eruptions, ulceration, bronchitis, asthma, gastric disturbances, genetic mutations, hepatic damage, kidney failure, and lung cancer [4]. Lead (Pb) can disrupt the hematopoietic system and cause anemia [5]; mercury (Hg) exerts strong teratogenic, neurotoxic, genotoxic, and bioaccumulative effects [6]; and arsenic (As) can cause bladder cancer and skin cancer, among other ailments [7]. Consequently, to stop the entry of PTEs into the food chain, scientists have emphasized their research on soil pollution with PTEs.
The current research on soil PTEs has primarily focused on spatial variation, risk assessment, and source identification [8,9]. The methodologies, such as geostatistics and multivariate statistics, which reveal the spatial characteristics of soil PTEs, has become a priority area of research. For example, the positive definite matrix factorization (PMF) model, potential ecological risk and human health risk assessment model, and the comprehensive source risk method were used to conduct resource allocation and risk assessment in the densely populated area of molybdenum tailings in Qinling, China [10]. Geostatistical methods, multivariate statistical methods, and PMF models were used to assess and analyze the PTE risk and pollution source allocation in farmland soil in Puning, China [11]. Moreover, geostatistical methods were also used to investigate the spatial distribution characteristics of potential toxic elements in soils near oil production plants in central China, and their potential risks were further analyzed by using potential ecological risk and human health risk assessment models [12]. However, limited research has emphasized soil of tea crops compared to soil of other agricultural crops. As an international tea producer and exporter, China has a profound history and culture of tea production and trade. The Zhejiang Province is a major tea-producing and exporting province in China due to its favorable environment for tea plant growth. Tea plants, which prefer acidic and high-fertility soils, can mobilize PTEs in soils and increase their bioavailability [13]. Additionally, as perennial evergreen plants, tea leaves can adsorb and deposit more pollutants from air compared to annual plants. Furthermore, the soil quality directly affects the growth of tea trees and the quality of tea leaves [14]. Growing tea plants in PTE-contaminated soils transports PTEs from soils to tea leaves, which further enter into the human body through the food chain, posing potential health risks to humans [15].
This study emphasizes the evaluation of Cd, Cr, Hg, Pb, and As content in the soil of a typical tea plantation town in Zhejiang Province The objectives of our research study were to (1) explore the sources and spatial heterogeneity of soil PTEs in the study area through geostatistical and source analysis methods and (2) evaluate the risk of PTEs in tea plantation soil on human health. This research will generate new ideas and theoretical support for the prevention and control of PTE pollution in tea plantation soil and for the protection of agricultural ecological environments.

2. Materials and Methods

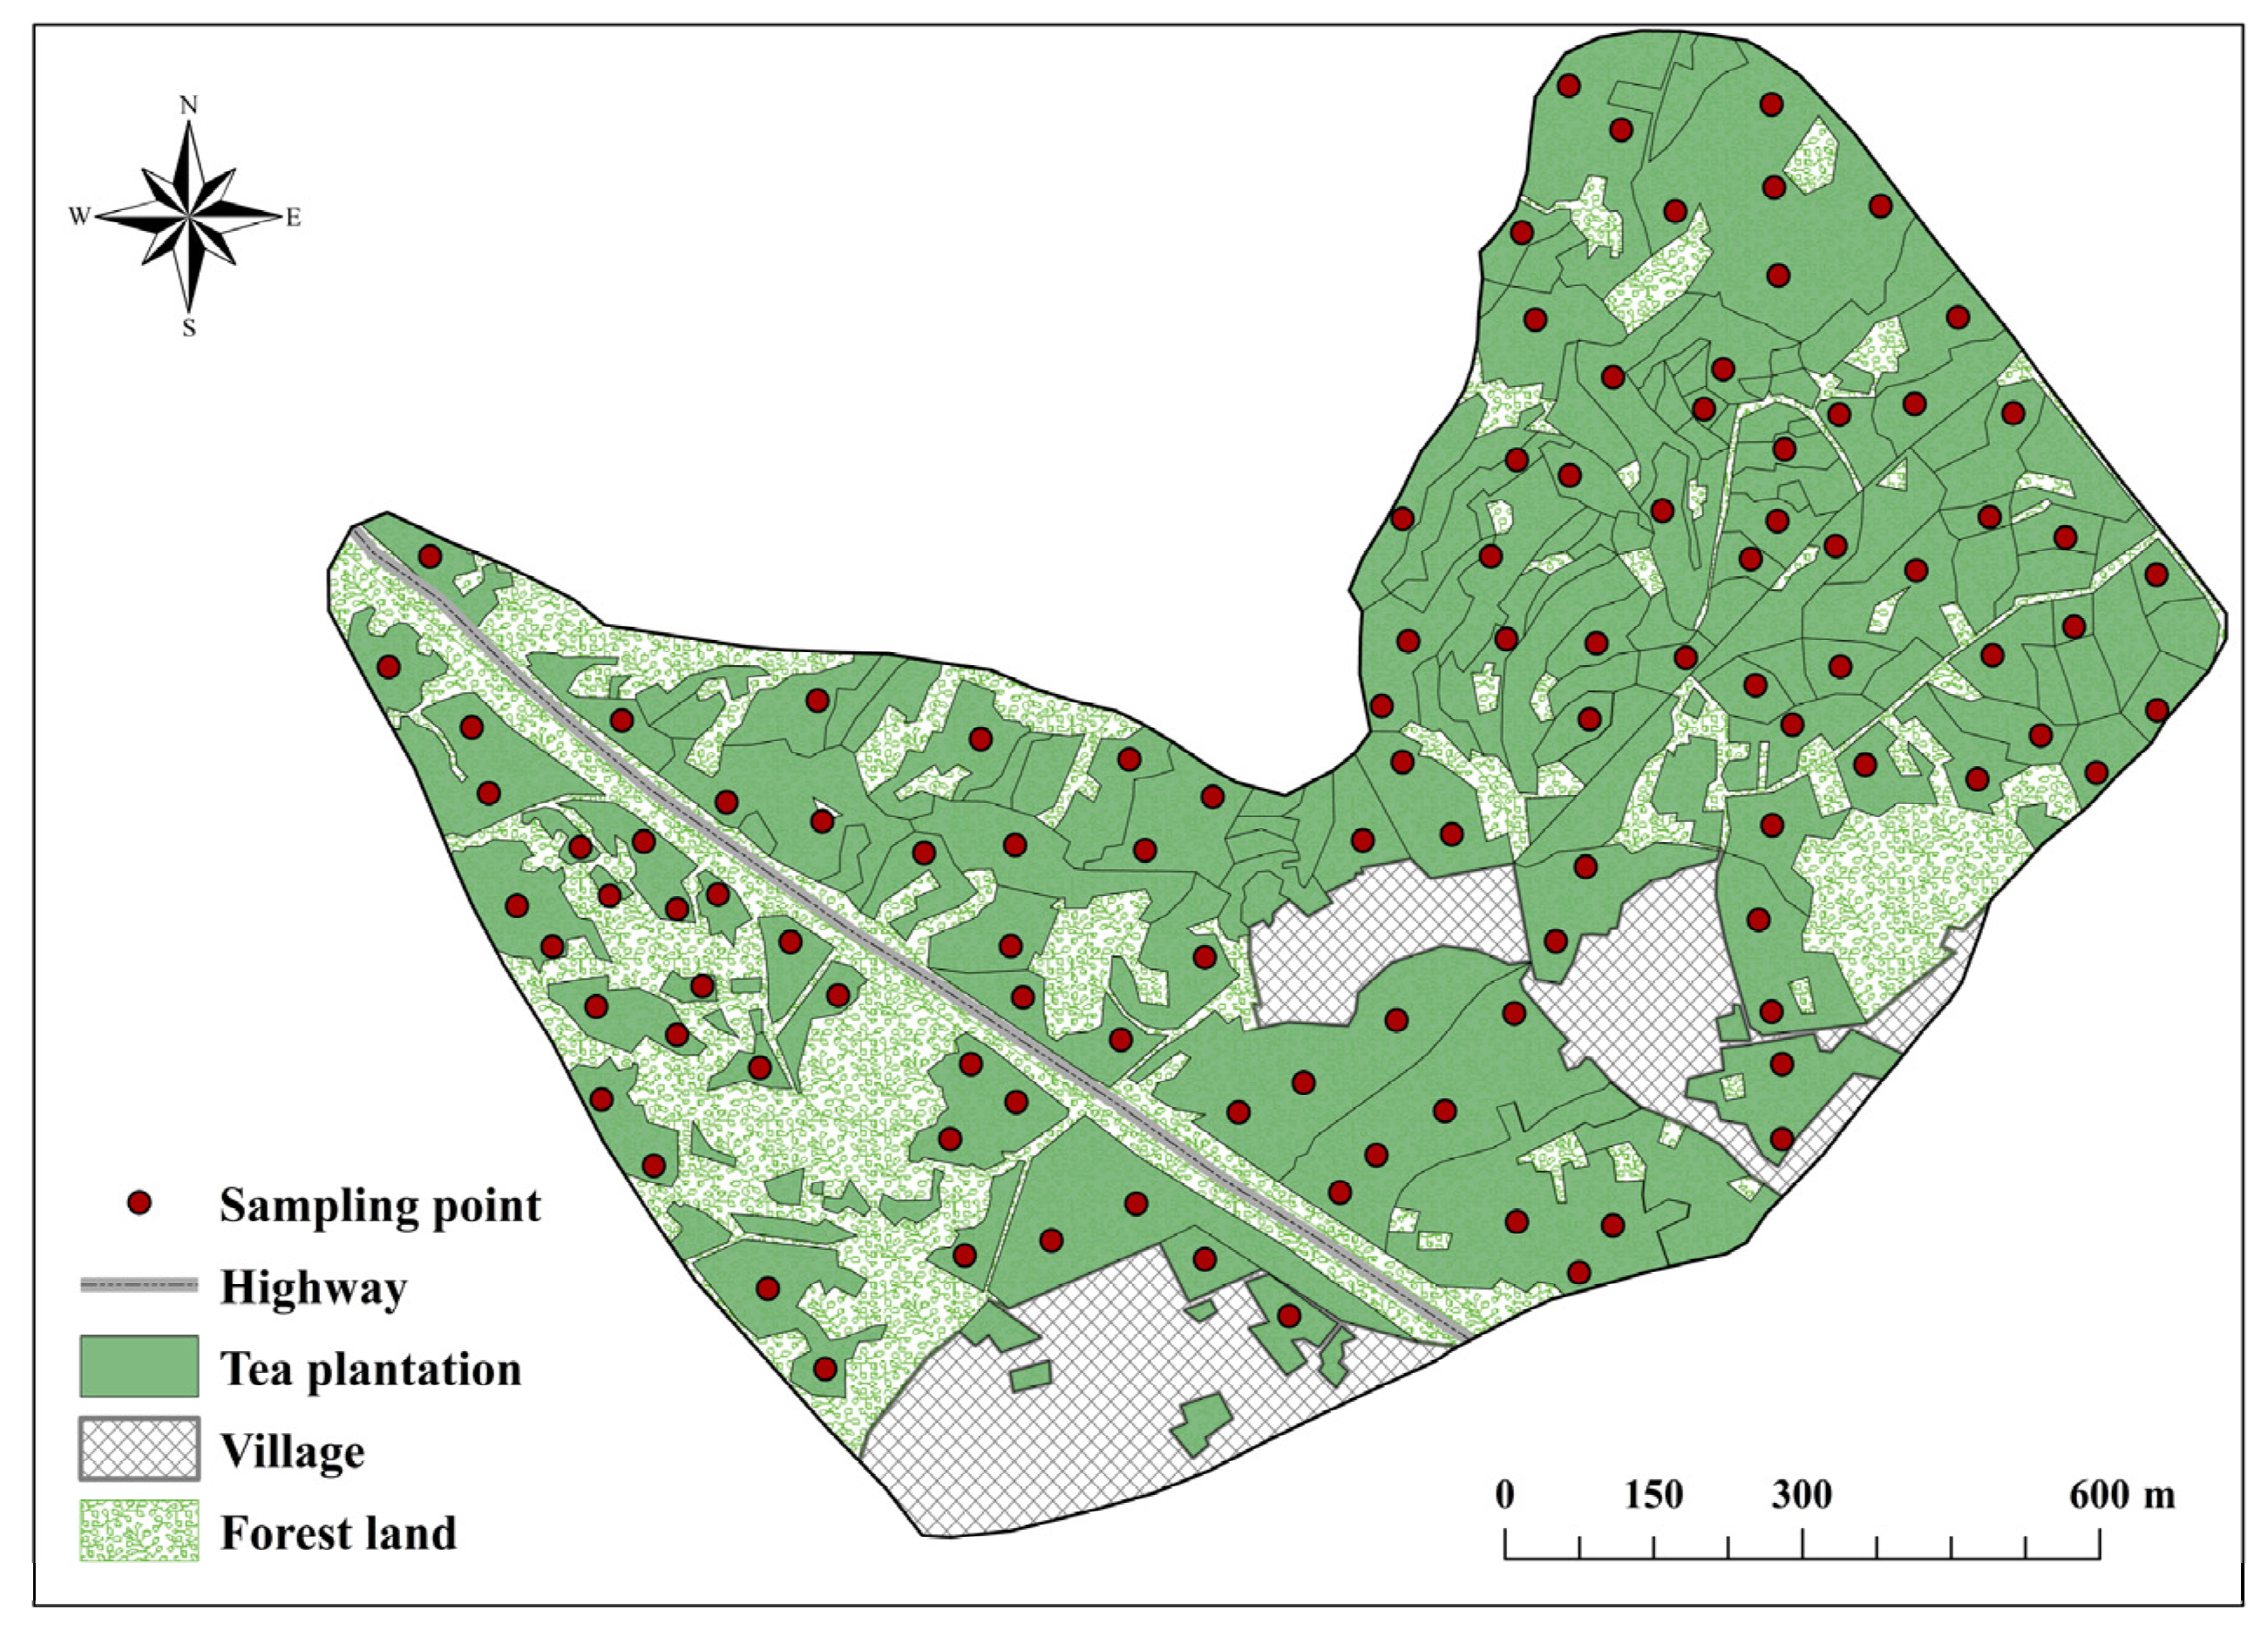
2.1. Study Area, Soil Collection, and Chemical Analysis

The study area is located in the southwestern part of Zhejiang Province, classified as a low-mountainous and hilly-terrain region. It belongs to subtropical monsoon climate with average annual temperature of 17.8 °C and a frost-free period of 236 days throughout the year [16]. The study area is dominated by red and paddy soil types whose parent material primarily consists of acidic magmatic weathering products, resulting in a wide distribution of acidic soils and being suitable for the growth of tea plants. Tea cultivation in the study area can be traced back to the Three Kingdoms period (over 1800 years ago), when it was renowned for its abundant tea production and unique tea quality. Its tea production then peaked during the Ming and Qing dynasties, and still enjoys a prestigious reputation today [17].
The soil and plant samples were collected from an 88 hm2 tea plantation area with a grid density of the plots of 100 m × 100 m at the mature stage of the tea plants. The soil sampling method followed an “S”-shaped technique, and soil samples were collected from the surface layer (0–20 cm) at a distance of 5–10 cm from the tea tree fertilization trench. Each soil sample consisted of a composite of five soil cores, totaling approximately 1.5 kg, which were placed into sealed plastic bags. Two top tea leaves and one bud of each tea plant were collected. Finally, a total of 108 soil samples were collected from the tea plantation soil, and the sampling points are depicted in Figure 1.
The soil samples were air-dried, ground, and passed through a 20-mesh nylon sieve for determination of the soil physicochemical properties. The soil samples were further passed through a 100-mesh nylon sieve for determination of the total concentration of soil PTEs. The fresh tea samples were rinsed with deionized water to remove dust, then oven-dried at 105 °C for 30 min and 50 °C to a constant weight. The dry tea samples were ground and passed through a 20-mesh nylon screen for a full analysis of the PTEs.
The soil pH was measured using a pH meter (Mettler Toledo, FE28, Ohio, USA) with a soil-to-water ratio of 1:2.5 (w/v). Soil organic matter (SOM) was determined using the potassium dichromate heating method. The soil samples were digested with HF-HNO3-HClO4 (7:5:1, v/v/v) at 160 °C, and the tea samples were digested with HNO3 at 180 °C [18]. Then, the total concentration of PTEs in the soil and tea samples was measured using inductively coupled plasma optical emission spectroscopy (ICP-OES, Leeman Prodigy 7, Ohio, USA). The quality control procedures for PTE concentrations in soil and tea were performed with a standard soil sample (GSS-14) and green tea (GBW10052). The results showed that the recovery rate of PTEs ranged from 93.0 to 105.3% in tea samples and from 93.2 to 108.2% in soil samples. The relative deviations of duplicate samples were controlled to be less than 10%.

2.2. Spatial Analysis Methods

(1) Variogram Function: Variogram functions are used to describe whether a variable within the study area is influenced by random factors or structured factors [19]. They reflect the variation in soil properties between observed values at different distances within the study area and are an effective tool for exploring spatial variation patterns [20].
(2) Kriging Interpolation: Kriging interpolation is a method that utilizes the original data of regionalized variables and the structural characteristics of the variogram function to obtain unbiased optimal estimates within a certain regional range based on a limited number of samples. It is commonly used as a primary method to interpret the spatial distribution of soil indicators by combining field sampling with laboratory analysis.

2.3. Potentially Toxic Elements Source Apportionment Models

The positive matrix factorization (PMF) model is a multivariate factor analysis tool that decomposes the receptor content data matrix into a factor contribution matrix and a factor distribution matrix under non-negative constraints. The goal of PMF is to resolve pollution sources and their contributions based on the synthesized dataset. The calculation method is as follows [21,22]:
X i j = k = 1 p G i k F k j + E i j
In the equation:
Xij represents the content matrix of the jth PTEs in the ith sample.
Gik represents the contribution of the kth source to the ith sample.
Fkj represents the characteristic value of the kth source for the content of PTEs jth, where p is the number of factors. Eij represents the residual.
The PMF model is constrained and iteratively computed based on weighted least squares. The factor contribution and distribution were obtained by minimizing the objective function Q of the PMF model [23]. The calculation method is as follows [21]:
Q = i = 1 n j = 1 m E i j U i j 2
In the equation:
Uij represents the uncertainty magnitude of the jth element in the ith sample.
The PMF model operates using both concentration data and uncertainty data, which encompass sampling and analysis errors [24]. In this study, the concentrations (Cij) of five soil PTEs, namely, Cd, Cr, Pb, As, and Hg, all exceed the method detection limit (MDL). The uncertainty (Unc) calculation method is as follows [21]:
When the concentration of a chemical element is below or equal to the corresponding method detection limit (MDL), the uncertainty is calculated as:
U n c = 5 6 × M D L
Otherwise, it is calculated as:
U n c = θ × C i j 2 + M D L 2
In the equation:
Cij represents the concentration of PTEs i in the jth sample.
MDL is the method detection limit for the sample.
θ represents the relative standard deviation.

2.4. Potentially Toxic Elements Risk Assessment Models

(1) Potential Ecological Risk Index Method: The potential ecological risk index method integrates PTE content with environmental ecological effects and toxicological effectiveness. The calculation method for the potential ecological risk index is as follows [25,26]:
E r i = T r i × C i S i
RI = i = 1 n E r i
In the equation:
Cirepresents the measured value of element i in the sample.
Si represents the evaluation standard for element i.
E r i represents the potential ecological risk coefficient of a certain PTE.
T r i represents the toxicity response coefficient for PTEs (Cd, Cr, Pb, Hg, and As are 30, 2, 5, 30, and 10, respectively).
RI represents the comprehensive potential ecological hazard index of multiple PTEs.
The grading criteria for E r i and RI are as follows:
E r i ≤ 40 indicates low potential risk; 40 < E r i ≤ 80 indicates moderate potential risk; 80 < E r i ≤ 160 shows moderate to high potential risk; 160 < E r i ≤ 320 indicates high potential risk; E r i > 320 indicates extremely high potential risk; RI ≤ 150 indicates a slight ecological hazard; 150 ≤ RI ≤ 300 indicates a moderate ecological hazard; 300 ≤ RI ≤ 600 indicates a strong ecological hazard; and RI > 600 indicates a very strong ecological hazard.
(2) Human Health Risk Assessment: To quantitatively assess the adverse effects of PTEs on human health in the study area, this study has adopted the multi-media, multi-pathway risk assessment model developed by USEPA for health risk assessment. The main routes of entry of PTEs into the human body are through the food chain and through daily contact, inhalation, and skin contact. This study has mainly considered three main exposure pathways: oral ingestion, dermal contact, and inhalation. The calculation of exposure levels for adults and children in the study area is as follows [27,28]:
SER OI = OSIR × ED × EF × ABS o BW × AT × 10 6
SER DC = SAE × SSAR × ED × EF × E v × ABS d BW × AT × 10 6
SER P I = PM 10 × DAIR × ED × AF × ( fspo × EFO + fs × EFI ) BW × AT × 10 6
In the equation, SEROI, SERDC, and SERPI represent the exposure doses of PTEs through oral ingestion, dermal contact, and inhalation pathways, respectively. The exposure parameters adopt USEPA’s recommended parameters for exposed populations and relevant research results from previous studies [29]. The meanings and values of the relevant exposure parameters are presented in Table 1.
PTEs can accumulate in the human body, leading to chronic non-carcinogenic risks and carcinogenic risks. In this study, non-carcinogenic and carcinogenic risks were assessed for human health due to exposure to PTEs in farmland soil. These are represented, respectively, by THI and TCR:
T H I = H Q i j = S E R i j × C i R f D i j × S A F
T C R = C R i j = S E R i j × S F i j × C i
In the equation:
SERij represents the exposure dose of PTEs i through exposure pathway j.
RfDij represents the reference dose of PTEs i through exposure pathway j.
SAF is the soil exposure adjustment factor, set to 0.5.
HQij is the non-carcinogenic risk of PTEs i through exposure pathway j, with THI representing the total non-carcinogenic risk from all PTEs.
SFij represents the slope factor of PTEs i through exposure pathway j for carcinogenic risk assessment.
CRij is the carcinogenic risk of PTEs i through exposure pathway j, with TCR representing the total carcinogenic risk from all PTEs.
The values of RfD and SF are based on relevant research findings from previous studies. The meanings and values of the relevant parameters are given in Table 2.

2.5. Statistical Analysis

The data were subjected to descriptive statistical analysis using Excel 2003 and SPSS 22.0 software. For data not following a normal distribution, logarithmic transformation or Box-Cox transformation using Minitab 18 software was employed to achieve normality. Spatial variation structure analysis and the establishment of optimal theoretical models were conducted using GS+ 9.0 software. Source apportionment of PTEs was determined with the PMF model (EPA PMF 5.0). Kriging interpolation analysis was performed using Geostatistical Analyst Tools in the Spatial Statistics module of ArcGIS 10.2 software. Correlation analysis was carried out with Origin 2022 software.

3. Results and Discussion

3.1. Soil Properties and Accumulation of Potentially Toxic Elements in Soils and Tea Leaves

The pH, SOM, and PTE contents in the tea garden soil of the study area are presented in Table 3. The soil pH ranged from 4.06 to 4.78, with a mean value of 4.39, which revealed overall acidity with minimal variation. Soil acidification not only affects plant nutrient absorption, but also influences the migration and transformation of metals such as Cu, Zn, Cd, and Fe in the soil [30]. Attention shall be given to improvement of acidified soil through soil amendments (biochar, attapulgite, etc.) [31,32].
The SOM contents of the soils ranged from 6.45 to 46.60 g kg−1, with a mean value of 32.06 g kg−1, which is in the range of high soil quality for tea gardens (20 g kg−1) according to fertility grading standards of tea garden soil (NY/T 853-2004 which was published by Ministry of Agriculture and Rural Affairs of the People’s Republic of China) The average Cd content of the soil was 0.19 mg kg−1, which is approximate to the background value of soil in Zhejiang Province, and is considered as uncontaminated soil according to the soil environmental quality standards of agricultural soils in China [33]. However, its maximum value was 1.49 mg kg−1, which exceeds the risk screening value (0.3 mg kg−1) by 4.97 times. Additionally, 6.48% were polluted sites.
The contents of Cr, Pb, Hg and As in the soil samples ranged from 23.10 to 62.50 mg kg−1, 16.80 to 66.60 mg kg−1, 0.02 to 0.09 mg kg−1, and 8.09 to 33.60 mg kg−1, respectively. All of their maximum values were lower than the risk screening value of the soil environmental quality standards for agricultural soils in China (GB 15618-2018), showing no pollution of Cr, Pb, Hg, or As in the tea garden soil. The PTE concentrations of tea leaves (Table 4) were low and met the tea safety standard published by the Ministry of Agriculture and Rural Affairs of the People’s Republic of China.
The coefficient of variation (CV), which is the ratio of the standard deviation to the mean, reflects the variability and dispersion of elements in the soil. The coefficients of variation for Cd, Cr, Pb, Hg, and As were 132.43%, 27.74%, 27.04%, 49.08%, and 34.43%, respectively. The results indicated that the contents of Cd at the sampling points exhibited significant variability, likely attributable to discrete input of human activities, natural factors, or external influences [33].

3.2. Spatial Characteristics of Potentially Toxic Elements in Tea Garden Soil

3.2.1. Spatial Structure Characteristics of Potentially Toxic Elements in Tea Garden Soil

Geostatistical methods were employed for the analysis of the spatial variation characteristics of PTEs in tea garden soil. As presented in Table 3, The K-S values for Pb and Hg were higher than 0.05 (Table 3), showing normal distribution. After logarithmic transformation, the Cd followed a normal distribution after logarithmic transformation, while Cr and As followed a normal distribution after Box–Cox transformation. There was a semi-variogram structure in the PTEs of tea garden soil (Table 5). The nugget variance values for Cr and Hg were close to 0 from the perspective of nugget variance, which indicates that they were less affected by random factors and were mainly influenced by structural factors such as parent material, climate, and topography. Conversely, the nugget variances for Cd, Pb, and As were relatively large, showing a significant influence from random factors such as cultivation and fertilization. The optimal models for Cr, Hg, and As were Gaussian models, with ranges of 95.26, 400.10, and 398.37 m, respectively. The Cd exhibited an exponential model with a range of 657.00 m, while Pb showed a linear model with a range of 719.56 m. The nugget effect values for Cr, Hg, and As were all less than 25%, which revealed strong spatial correlation and primarily originated from soil parent material, topography, and climatic variations. The nugget effect values for Cd and Pb ranged from 25% to 75%, which demonstrated moderate spatial variation, and this was influenced by structural factors such as soil parent material and topography as well as by random factors such as fertilization and cultivation.

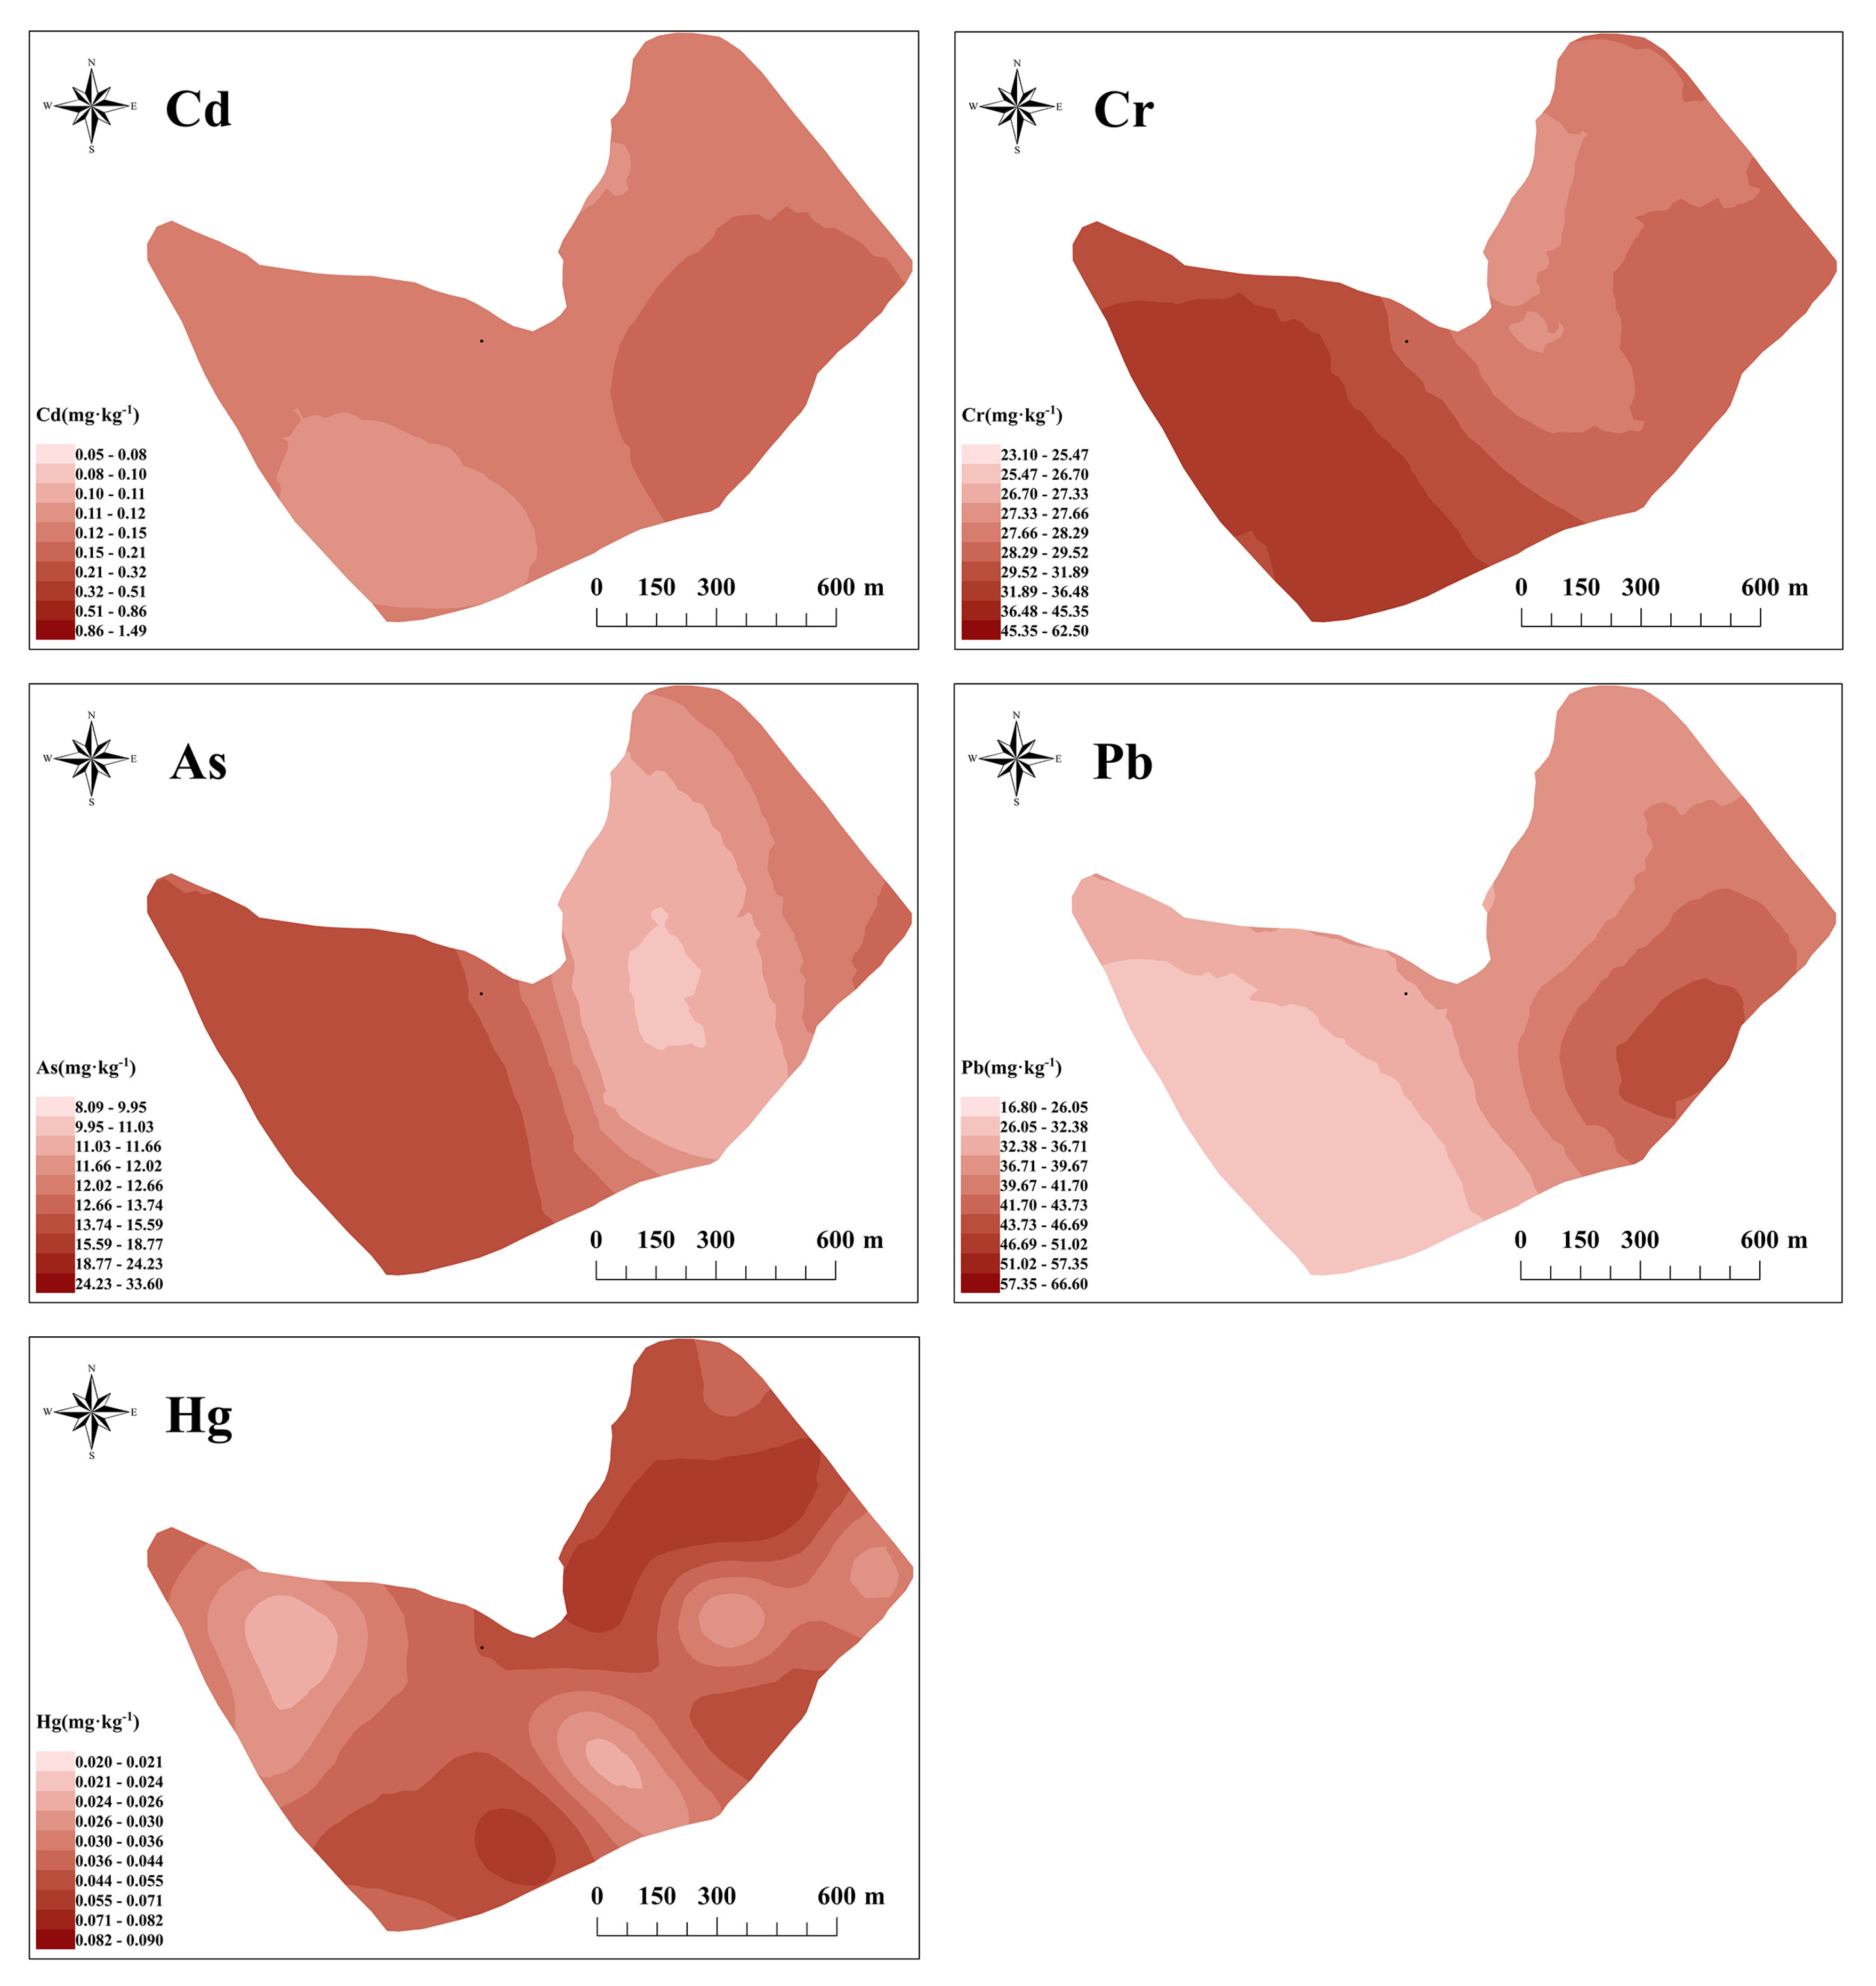
3.2.2. Spatial Distribution Characteristics of Potentially Toxic Elements in Tea Garden Soil

The data for each element conformed to a normal distribution after processing of logarithmic transformation and Box–Cox. The Kriging interpolation was used to spatially interpolate the soil PTE content at each sampling point in the study area. The spatial interpolation results for each element are displayed in Figure 2. The spatial distribution of Cd and Pb reveals that high-value areas were concentrated in the southwest direction and low-value areas were concentrated in the southeast part of the study area, exhibiting a declining trend from high to low values. The spatial distribution of Cr and As displayed that high-value areas were concentrated in the west of the study area and low-value areas were concentrated in the central part of the study area. The spatial distribution of Hg exhibited a patchy pattern overall, with no apparent distribution pattern.

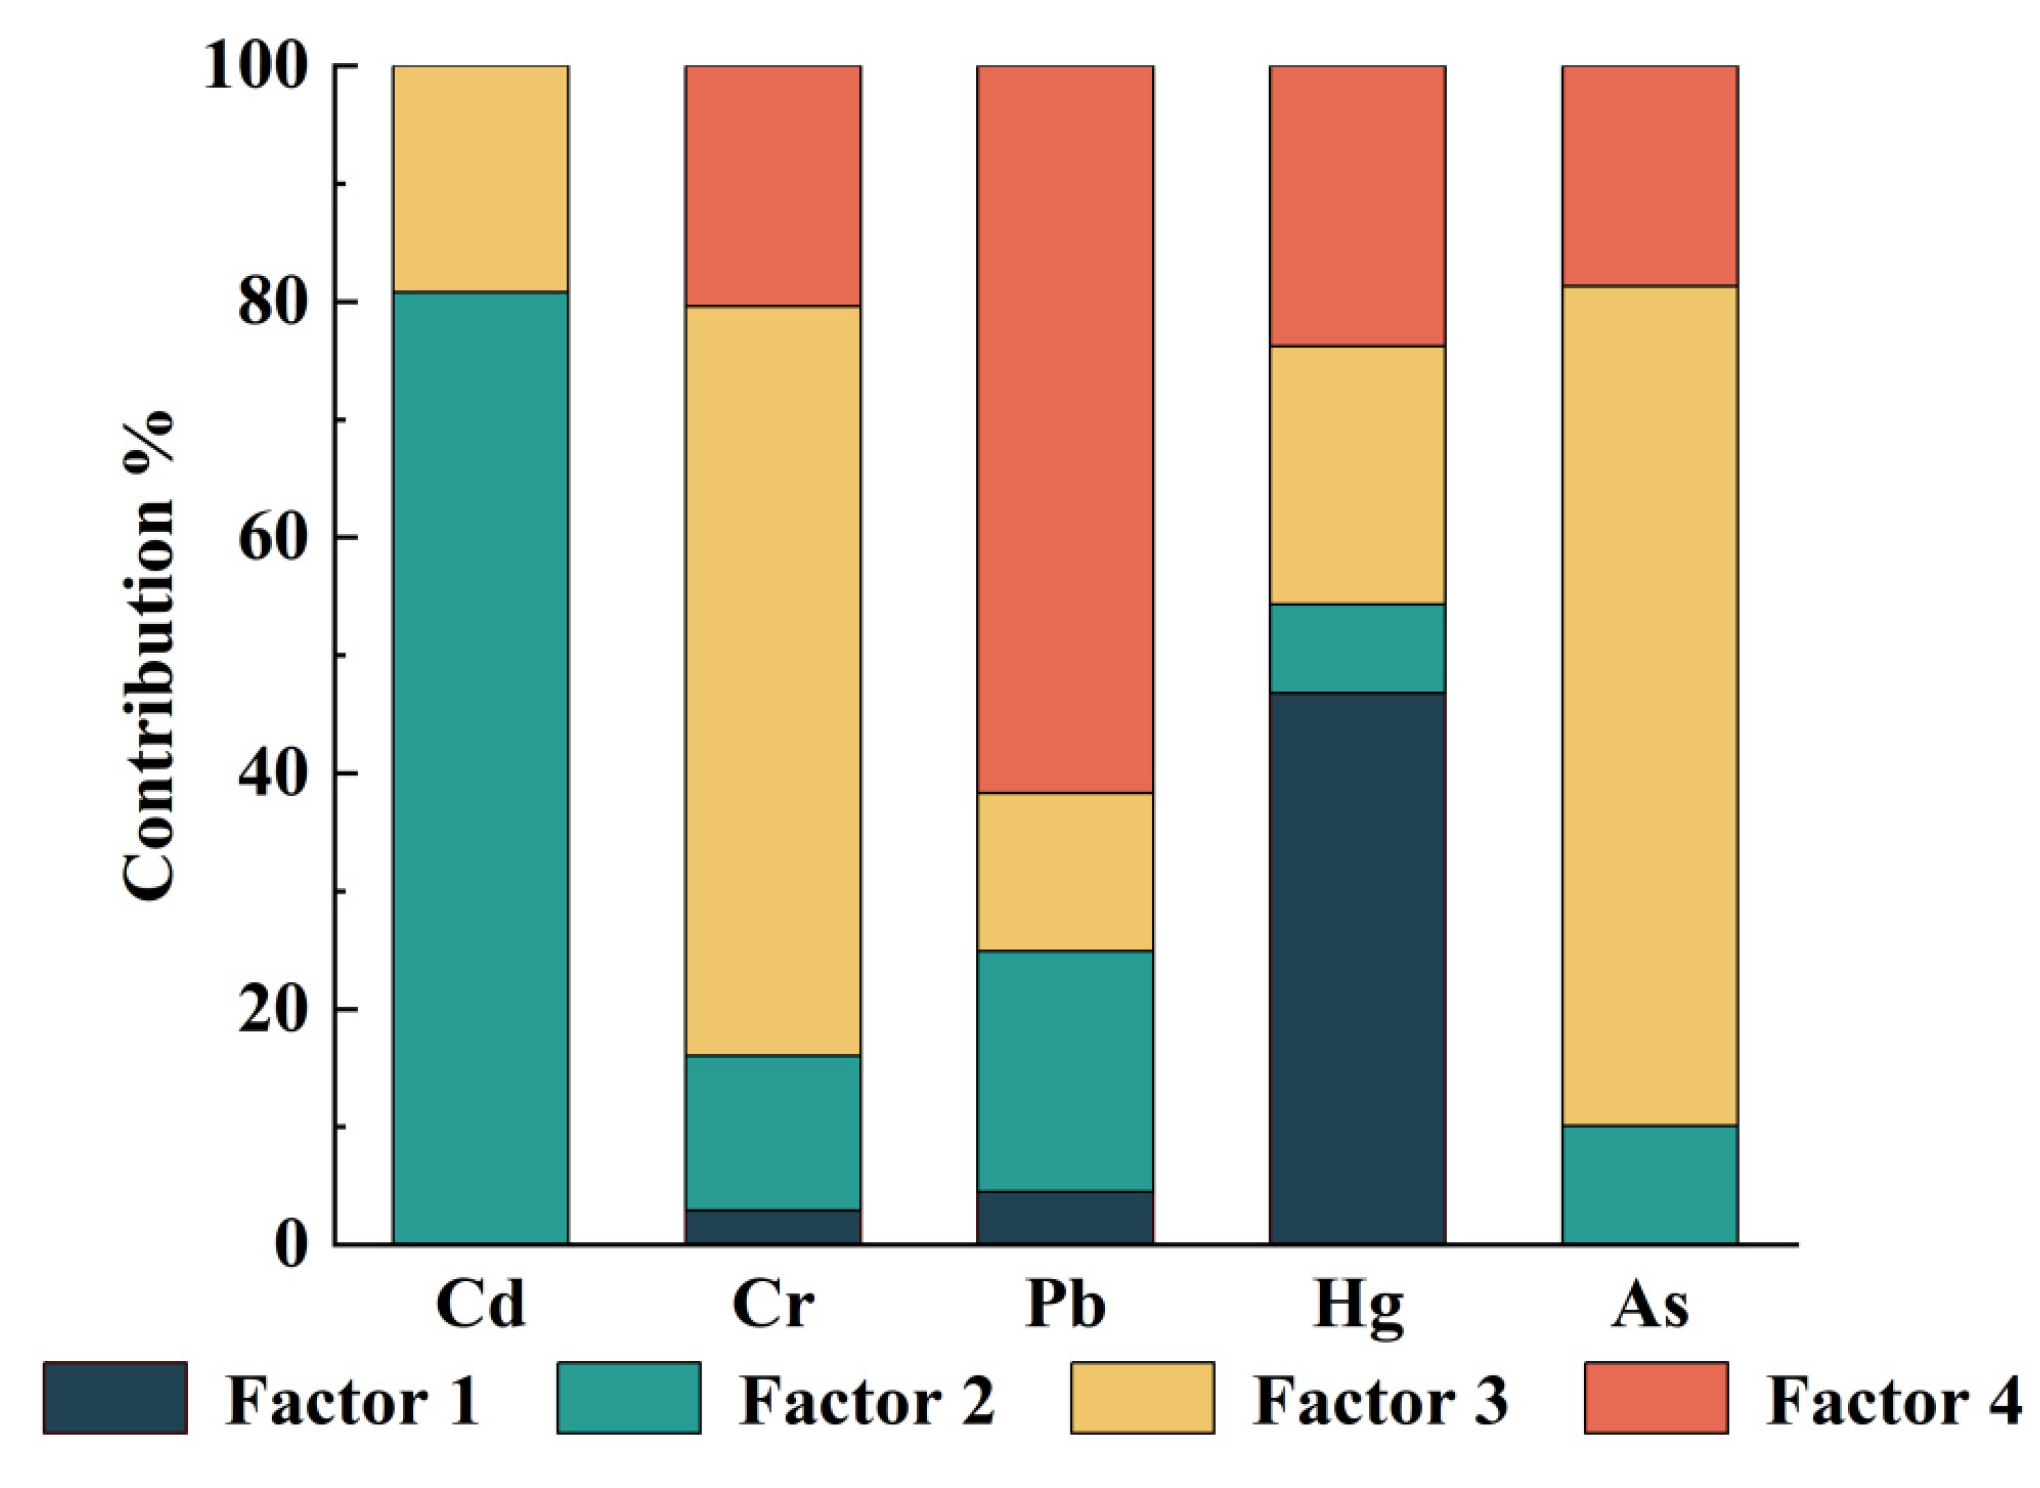
3.3. Source of Potentially Toxic Elements in Tea Garden Soil

The spatial structural characteristics of five PTEs elements in the study area were elucidated; however, their sources and influence factors are still unclear. The aim of this study was to determine whether there was co-pollution or composite pollution among PTE elements by analyzing their interrelationships, thereby further identifying the pollution sources [34,35]. The Pearson correlation analysis in SPSS 22.0 was employed to evaluate the similarities and differences between elements. The PMF model was used to identify sources of PTEs.
The Cd was significantly positively correlated with Pb and showed significant positive correlations with pH and SOM (Table 6). However, they exhibited no correlation with other three PTEs. The Cr and As showed significant positive correlations, but they were significantly negatively correlated with Pb. The Pb and As displayed significant negative correlations. Hg showed no correlation with other PTEs. These results revealed that Cd and Pb may have the same or similar sources and are significantly correlated with soil nutrients, which may possibly be related to agricultural activities. The Cr and As may have the same or similar sources.
The PMF model computations were conducted with factor numbers set from 2 to 4, and the process was repeated 20 times with EPA PMF 5.0 software. The optimal number of factors was determined to be 4 after comprehensive evaluation of the Q values (Figure 3). The Hg was primarily an element in Factor 1, with a contribution of 46.8%. According to the results of the semi-variance function, structural factors primarily contributed to the spatial variability of Hg, which exhibited a patchy pattern without a clear spatial regularity. Moreover, Hg showed no direct correlation with other PTEs, which illustrated that the potential origin of Hg was the soil properties. Therefore, Factor 1 was inferred as having originated from natural sources.
The Factor 2 was dominated by Cd, contributing 80.8% to its presence, which revealed that this factor represents the primary source of soil Cd pollution in the study area. This may be due to the application of fertilizers, especially phosphate fertilizers, having introduced Cd into agricultural soil [36,37,38]. Moreover, a significant positive correlation was observed between Cd and SOM. Thus, Factor 2 was speculated to have originated from agricultural sources.
The Factor 3 was predominantly loaded with As and Cr, with contributions of 71.2% and 63.6%, respectively. Previous research studies have concluded that As is associated with industrial activities (mining and fossil fuel combustion) and agricultural application (As-containing pesticides) [39,40]. Mining activities were observed in the study area, and As showed a highly significant negative correlation with SOM; therefore, the As came from industrial inputs. The Cr content in the soil was significantly affected by the parent material, and with a block kriging effect of 7.3%, it belonged to structural factor influence [41,42]. Hence, Factor 3 is speculated to be a mixed source of industrial and natural origins.
The Factor 4 was primarily associated with Pb, contributing 61.7% due to its presence. It has been reported that emissions from vehicle exhaust, tire wear, and particle deposition can lead to significant Pb accumulation [43,44]. Moreover, combined with the spatial distribution results, high Pb values were concentrated around villages and areas with heavy traffic flow. Therefore, Factor 4 was inferred to have originated from traffic emissions.

3.4. Assessment of Potentially Toxic Elements Risks in Tea Garden Soil

3.4.1. Potential Ecological Risk Assessment

The average values of the potential ecological risk index for Cd, Cr, Pb, Hg, and As were 28.28, 0.73, 0.07, 8.52, and 8.99, respectively, based on the calculation results of the potential ecological risk index. The single-factor ecological risks were classified as low potential risks of all PTEs. The range of the comprehensive potential ecological index (RI) was 26.24 to 246.59, with an average value of 46.58, which showed a slight ecological hazard in the tea garden (Table 7); however, the maximum value reached a high potential risk level, which should be given attention. The single-factor potential ecological risk values showed the following order: Cd > As > Hg > Cr > Pb, displaying Cd as the highest potential ecological risk. Thus, Cd should be focused on during the evaluation of PTEs in tea garden soil.

3.4.2. Human Health Risk Assessment

The Human Health Risk Assessment revealed that the average hazard quotients (HQs) of PTEs for both adults and children were all less than 1, indicating that there is no non-carcinogenic risk to human health from individual PTEs in the study area (Table 8). However, the maximum HQ value for children’s exposure to As was >1, which suggests a potential non-carcinogenic risk to children in some areas of the study region. For both adults and children, the overall HQ oral intake (HQois) values were higher than the HQ dermal contact (HQdcs) and HQ pulmonary intake (HQpis) values, which indicates that oral ingestion is the main exposure pathway for non-carcinogenic risk to adults and children in the study area [45,46].
The mean and maximum values of target hazard index (THI) for adults in the study area were 2.63 × 10⁻¹ and 5.37 × 10⁻¹, respectively, and the mean and maximum values for children were 1.51 and 3.12, respectively. The acceptable non-carcinogenic risk threshold value was 1 according to USEPA policies; thus, it did not show a non-carcinogenic risk to adults (THI < 1). However, it did demonstrate a non-carcinogenic risk to children (THI > 1) in the study area. This may be due to the high susceptibility of children to toxicity of PTEs in the stages of growth and development, which increases the non-carcinogenic risk to children with long-term exposure [47,48].
The maximum CR values of Cd and As for adults and children in our study area were less than 1.0 × 10⁻⁶, indicating no carcinogenic risk (CR) through oral ingestion, dermal contact, or inhalation pathways according to USEPA (Table 9). The maximum values of Cr for adults and children were 9.57 × 10⁻⁶ and 3.98 × 10⁻⁶, respectively. The mean values were 5.01 × 10⁻⁶ and 2.08 × 10⁻⁶, respectively, which were greater than 1.0 × 10⁻⁶ but less than 1.0 × 10⁻⁴, which belongs to acceptable range according to USEPA’s recommended carcinogenic risk levels. The overall values of CR oral intake (CRois) were higher than the overall values of CR dermal contact (CRdcs). The CR pulmonary intake (CRpis) indicates that oral ingestion was the main pathway for carcinogenic risk of PTEs in the study area. The mean and maximum values of CR for both adults and children were between 1.0 × 10⁻⁴ and 1.0 × 10⁻⁶, which reveals that the carcinogenic risk of the soil in the study area was at an acceptable level.
Spatial interpolation of the THI and TCR data for adults and children is presented in Figure 4, showing a similar distribution pattern, with low values concentrated in the central part of the study area and high values concentrated in the northwest region.

4. Conclusions

Pollution due to Cr, Pb, Hg, and As was not observed in the tea garden soil of the study area. However, Cd pollution sites comprised 6.48% of sampling points, which exceeded the risk screening value of soil environmental quality standards of agricultural soils in China. The management of soil PTEs in tea gardens shall emphasize the effects of agricultural sources on soil Cd. The Cd and Pb exhibited moderate spatial autocorrelation, while Cr, Hg, and As demonstrated strong spatial auto-correlation. The main sources of PTEs in the study area comprised a mixture of industrial sources, natural sources, agricultural sources, and exhaust gas emission on the basis of the PMF model. The comprehensive ecological risk in the study area revealed slight ecological hazards, and non-carcinogenic risks to children were identified. The high-risk location is located in the northwest of the study area. It is recommended to enhance control and monitoring and to implement relevant safety measures for the area of study.

Author Contributions

Conceptualization, Y.X. and Y.W.; methodology, Y.X.; validation, Y.X.; formal analysis, Y.X.; investigation, Y.X.; resources, D.L.; data curation, Y.X.; writing—original draft preparation, Y.X.; writing—review and editing, A.S., L.H. and M.H.; visualization, Y.X. and Y.W.; supervision, D.L.; project administration, D.L.; funding acquisition, D.L., L.H. and M.H. All authors have read and agreed to the published version of the manuscript.

Funding

This research was funded by the Natural Science Foundation of China, grant numbers 42107021 and 42307022; Science and Technology Program of Zhejiang Province, grant number 2023C02020.

Data Availability Statement

The data presented in this study are available on request from the corresponding author.

Conflicts of Interest

The authors declare no conflict of interest.

References

  1. Mao, C.; Song, Y.; Chen, L.; Ji, J.; Li, J.; Yuan, X.; Yang, Z.; Ayoko, G.A.; Frost, R.L.; Theiss, F. Human health risks of heavy metals in paddy rice based on transfer characteristics of heavy metals from soil to rice. Catena 2019, 175, 339–348. [Google Scholar] [CrossRef]
  2. Xu, W.; Hou, S.; AmanKhan, M.; Chao, Y.; Xiao, L.; Ruan, Z.; Hong, L.; Chen, Z.; Ceng, S.; Ye, Z.; et al. Effect of water and fertilization management on Cd immobilization and bioavailability in Cd-polluted paddy soil. Chemosphere 2021, 276, 13016. [Google Scholar] [CrossRef]
  3. Zhang, H.; Zhao, F.; Gai, X.; Cai, J.; Zhang, X.; Chen, X.; Zhu, Y.; Zhang, Z. Astilbin attenuates apoptosis induced by cadmium through oxidative stress in carp (Cyprinus carpio L.) head kidney lymphocyte. Fish Shellfish Immunol. 2022, 125, 230–237. [Google Scholar] [CrossRef] [PubMed]
  4. Ali, W.; Zhang, H.; Mao, K.; Shafeeque, M.; Aslam, M.W.; Yang, X.; Zhong, L.; Feng, X.; Podgorski, J. Chromium contamination in paddy soil-rice systems and associated human health risks in Pakistan. Sci. Total Environ. 2022, 826, 153910. [Google Scholar] [CrossRef] [PubMed]
  5. Tête, N.; Afonso, E.; Bouguerra, G.; Scheifler, R. Blood parameters as biomarkers of cadmium and lead exposure and effects in wild wood mice (Apodemus sylvaticus) living along a pollution gradient. Chemosphere 2015, 138, 940–946. [Google Scholar] [CrossRef] [PubMed]
  6. Kim, H.; Lee, J.; Woo, H.D.; Kim, D.W.; Oh, J.H.; Chang, H.J.; Sohn, D.K.; Shin, A.; Kim, J. Dietary mercury intake and colorectal cancer risk: A case-control study. Clin. Nutr. 2020, 39, 2106–2113. [Google Scholar] [CrossRef] [PubMed]
  7. Lee, C.H. Pathophysiology of arsenic-induced adverse health effects. Hong Kong J. Dermatol. 2017, 25, 171–177. [Google Scholar]
  8. Yang, S.; Yang, D.; Taylor, D.; He, M.; Liu, X.; Xu, J. Tracking cadmium pollution from source to receptor: A health-risk focused transfer continuum approach. Sci. Total Environ. 2023, 867, 161574. [Google Scholar] [CrossRef] [PubMed]
  9. He, M.; Shangguan, Y.; Zhou, Z.; Guo, S.; Yu, H.; Chen, K.; Zeng, X.; Qin, Y. Status assessment and probabilistic health risk modeling of polycyclic aromatic hydrocarbons (PAHs) in surface soil across China. Front. Environ. Sci. 2023, 11, 1114027. [Google Scholar] [CrossRef]
  10. Zhang, L.; Zhu, Y.; Zhang, Y.; Zhong, J.; Li, J.; Yang, S.; Ta, W.; Zhang, Y. Characteristics, source analysis, and health risk assessment of potentially toxic elements pollution in soil of dense molybdenum tailing ponds area in central China. Environ. Geochem. Health 2024, 46, 129. [Google Scholar] [CrossRef]
  11. Huang, C.C.; Cai, L.M.; Xu, Y.H.; Wen, H.H.; Jie, L.; Hu, G.C.; Chen, L.G.; Wang, H.Z.; Xu, X.B.; Mei, J.X. Quantitative analysis of ecological risk and human health risk of potentially toxic elements in farmland soil using the PMF model. Land Degrad. Dev. 2022, 33, 1954–1967. [Google Scholar] [CrossRef]
  12. Gan, L.; Wang, J.; Xie, M.; Yang, B. Ecological risk and health risk analysis of soil potentially toxic elements from oil production plants in central China. Sci. Rep. 2022, 12, 17077. [Google Scholar] [CrossRef]
  13. Liu, W.; Tang, Y.; Ma, J.; Zhang, W.; Liao, S.; Cui, S.; Ye, Z.; Liu, D. Effects of biochar and inorganic amendments on soil fertility, tea yield, and quality in both Pb-Cd-contaminated and acidified tea plantations. J. Soils Sediments 2023, 23, 3275–3284. [Google Scholar] [CrossRef]
  14. Huang, X.; Wang, X.; Wu, Q.; Zhang, Z.; Yang, H.; Wen, X. Effects of multiple-metal-compound contamination on the soil microbial community in typical Karst tea plantations. Forests 2023, 14, 1840. [Google Scholar] [CrossRef]
  15. Pourramezani, F.; Mohajeri, F.A.; Salmani, M.H.; Tafti, A.D.; Sadrabad, E.K. Evaluation of heavy metal concentration in imported black tea in Iran and consumer risk assessments. Food Sci. Nutr. 2019, 7, 4021–4026. [Google Scholar] [CrossRef]
  16. Wang, Y.; Shi, J.; Wu, Y.; Zhang, W.; Yang, X.; Lv, H.; Xia, S.; Zhao, S.; Tian, J.; Cui, P.; et al. Selection of flagship species and their use as umbrellas in bird conservation: A case study in Lishui, Zhejiang Province, China. Animals 2023, 13, 1825. [Google Scholar] [CrossRef]
  17. Li, C. Research on the Development of Tea Culture Tourism in Lishui, Zhejiang. Master’s Thesis, Northwest Normal University, Lanzhou, China, 2020. [Google Scholar] [CrossRef]
  18. Xu, W.; Xie, X.; Li, Q.; Yang, X.; Ren, J.; Shi, Y.; Liu, D.; Shaheen, S.M.; Rinklebe, J. Biochar co-pyrolyzed from peanut shells and maize straw improved soil biochemical properties, rice yield, and reduced cadmium mobilization and accumulation by rice: Biogeochemical investigations. J. Hazard. Mater. 2024, 466, 133486. [Google Scholar] [CrossRef]
  19. Seyedmohammadi, J.; Navidi, M.N.; Esmaeelnejad, L. Geospatial modeling of surface soil texture of agricultural land using fuzzy logic, geostatistics and GIS techniques. Commun. Soil Sci. Plant Anal. 2019, 50, 1452–1464. [Google Scholar] [CrossRef]
  20. Wang, J.; Ouyang, J.; Zhang, M. Spatial distribution characteristics of soil and vegetation in a reclaimed area in an opencast coalmine. Catena 2020, 195, 104773. [Google Scholar] [CrossRef]
  21. Jiang, Y.; Chao, S.; Liu, J.; Yang, Y.; Chen, Y.; Zhang, A.; Cao, H. Source apportionment and health risk assessment of heavy metals in soil for a township in Jiangsu Province, China. Chemosphere 2017, 168, 1658–1668. [Google Scholar] [CrossRef] [PubMed]
  22. Yang, D.; Yang, Y.; Hua, Y. Source analysis based on the positive matrix factorization models and risk assessment of heavy metals in agricultural soil. Sustainability 2023, 15, 13225. [Google Scholar] [CrossRef]
  23. Jiang, H.H.; Cai, L.M.; Wen, H.H.; Hu, G.C.; Chen, L.G.; Luo, J. An integrated approach to quantifying ecological and human health risks from different sources of soil heavy metals. Sci. Total Environ. 2020, 701, 134466. [Google Scholar] [CrossRef]
  24. Tan, J.; Duan, J.; Ma, Y.; He, K.; Cheng, Y.; Deng, S.-X.; Huang, Y.-L.; Si-Tu, S.-P. Long-term trends of chemical characteristics and sources of fine particle in Foshan City, Pearl River Delta: 2008–2014. Sci. Total Environ. 2016, 565, 519–528. [Google Scholar] [CrossRef]
  25. Min, X.B.; Xie, X.D.; Chai, L.Y.; Liang, Y.J.; Li, M.; Ke, Y. Environmental availability and ecological risk assessment of heavy metals in zinc leaching residue. Trans. Nonferr. Metal. Soc. 2013, 23, 208–218. [Google Scholar] [CrossRef]
  26. Zhao, Z.; Yan, S.; Duan, M.; Fu, J.; Wang, Q.; Liu, Z.; Song, F.; Tang, B.; Li, C.; Qin, G.; et al. Assessing heavy metal pollution and potential ecological risk of tea plantation soils. Int. J. Agric. Biol. Eng. 2019, 12, 185–191. [Google Scholar] [CrossRef]
  27. Wang, Y.; Wang, R.; Fan, L.; Chen, T.; Bai, Y.; Yu, Q.; Liu, Y. Assessment of multiple exposure to chemical elements and health risks among residents near Huodehong lead-zinc mining area in Yunnan, southwest China. Chemosphere 2017, 174, 613–627. [Google Scholar] [CrossRef]
  28. Wu, Q.; Hu, W.; Wang, H.; Liu, P.; Wang, X.; Huang, B. Spatial distribution, ecological risk and sources of heavy metals in soils from a typical economic development area, Southeastern China. Sci. Total Environ. 2021, 780, 146557. [Google Scholar] [CrossRef]
  29. Cao, Y.; Cao, W.; Li, W.; Ma, T.; Xu, L.; Xia, M. Risk assessment of heavy metals in farmland soils in an agricultural region in the Yangtze River Delta. J. Agro-Environ. Sci. 2021, 40, 1441–1450. [Google Scholar] [CrossRef]
  30. Chen, L.; Guo, L.; Zhou, Q.; Liu, M.; Zhan, S.; Pan, X.; Zeng, Y. Response of soil fertility and Cu and Cd availability to biochar application on paddy soils with different acidification levels. Biomass Convers. Biorefin. 2022, 12, 1493–1502. [Google Scholar] [CrossRef]
  31. He, L.; Meng, J.; Wang, Y.; Tang, X.; Liu, X.; Tang, C.; Ma, L.Q.; Xu, J. Attapulgite and processed oyster shell powder effectively reduce cadmium accumulation in grains of rice growing in a contaminated acidic paddy field. Ecotox. Environ. Saf. 2021, 209, 111840. [Google Scholar] [CrossRef]
  32. He, L.; Zhong, H.; Liu, G.; Dai, Z.; Brookes, P.C.; Xu, J. Remediation of heavy metal contaminated soils by biochar: Mechanisms, potential risks and applications in China. Environ. Pollut. 2019, 252, 846–855. [Google Scholar] [CrossRef]
  33. Shi, B.; Yang, X.; Liang, T.; Liu, S.; Yan, X.; Li, J.; Liu, Z. Source apportionment of soil PTE in a northern industrial county using PMF model: Partitioning strategies and uncertainty analysis. Environ. Res. 2024, 252, 118855. [Google Scholar] [CrossRef]
  34. Alharbi, T.; El-Sorogy, A.S. Risk assessment of potentially toxic elements in agricultural soils of Al-Ahsa Oasis, Saudi Arabia. Sustainability 2023, 15, 659. [Google Scholar] [CrossRef]
  35. Wang, J.; Gao, B.; Yin, S.; Liu, L.; Xu, D.; Li, Y. Comprehensive evaluation and source apportionment of potential toxic Elements in Soils and Sediments of Guishui River, Beijing. Water 2019, 11, 1847. [Google Scholar] [CrossRef]
  36. Al Mamun, S.; Sultana, N.; Hasan, M.; Latif, M.B.; Islam, A.; Tusher, T.R. Phytoaccumulation of Cadmium in Leafy Vegetables Grown in Contaminated Soil under Varying Rates of Compost and Phosphate Fertilizer Application. Commun. Soil Sci. Plant Anal. 2021, 52, 2161–2176. [Google Scholar] [CrossRef]
  37. Wang, W.; Lu, N.; Pan, H.; Wang, Z.; Han, X.; Zhu, Z.; Guan, J. Heavy metal pollution and its prior pollution source identification in agricultural soil: A case study in the Qianguo Irrigation District, northeast China. Sustainability 2022, 14, 4494. [Google Scholar] [CrossRef]
  38. Moghtaderi, T.; Shakeri, A.; Rodríguez-Seijo, A. Potentially toxic element content in arid agricultural soils in south Iran. Agronomy 2020, 10, 564. [Google Scholar] [CrossRef]
  39. Wu, J.; Li, Z.; Huang, D.; Liu, X.; Tang, C.; Parikh, S.J.; Xu, J. A novel calcium-based magnetic biochar is effective in stabilization of arsenic and cadmium co-contamination in aerobic soils. J. Hazard. Mater. 2020, 387, 122010. [Google Scholar] [CrossRef]
  40. Xu, C.; Lu, X.; Huang, C.; Sun, R.; Gu, A.; Pan, W.; He, L.; Bao, J.; Zou, R.; Fu, C.; et al. Positive matrix factorization as source apportionment of paddy soil heavy metals in black shale areas in western Zhejiang Province, China. Sustainability 2023, 15, 4547. [Google Scholar] [CrossRef]
  41. Guo, G.; Wang, Y.; Zhang, D.; Lei, M. Source-specific ecological and health risks of potentially toxic elements in agricultural soils in Southern Yunnan Province and associated uncertainty analysis. J. Hazard. Mater. 2021, 417, 126144. [Google Scholar] [CrossRef]
  42. Yuan, B.; Cao, H.; Du, P.; Ren, J.; Chen, J.; Zhang, H.; Zhang, Y.; Luo, H. Source-oriented probabilistic health risk assessment of soil potentially toxic elements in a typical mining city. J. Hazard. Mater. 2023, 443, 130222. [Google Scholar] [CrossRef] [PubMed]
  43. Sun, L.; Guo, D.; Liu, K.; Meng, H.; Zheng, Y.; Yuan, F.; Zhu, G. Levels, sources, and spatial distribution of heavy metals in soils from a typical coal industrial city of Tangshan, China. Catena 2019, 175, 101–109. [Google Scholar] [CrossRef]
  44. Zhou, T.; Wang, Y.; Qin, J.; Zhao, S.; Cao, D.; Zhu, M.; Jiang, Y. Potential risk, spatial distribution, and soil identification of potentially toxic elements in Lycium barbarum L. (Wolfberry) fruits and soil system in Ningxia, China. Int. J. Env. Res. Public Health 2022, 19, 16186. [Google Scholar] [CrossRef] [PubMed]
  45. Yan, L.; Franco, A.-M.; Elio, P. Health risk assessment via ingestion and inhalation of soil PTE of an urban area. Chemosphere 2021, 281, 130964. [Google Scholar] [CrossRef] [PubMed]
  46. Reyes, A.; Cuevas, J.; Fuentes, B.; Fernández, E.; Arce, W.; Guerrero, M.; Letelier, M.V. Distribution of potentially toxic elements in soils surrounding abandoned mining waste located in Taltal, Northern Chile. J. Geochem. Explor. 2021, 220, 106653. [Google Scholar] [CrossRef]
  47. Rinklebe, J.; Antoniadis, V.; Shaheen, S.M.; Rosche, O.; Altermann, M. Health risk assessment of potentially toxic elements in soils along the Central Elbe River, Germany. Environ. Int. 2019, 126, 76–88. [Google Scholar] [CrossRef]
  48. Ma, W.; Ding, M.; Bian, Z. Comprehensive assessment of exposure and environmental risk of potentially toxic elements in surface water and sediment across China: A synthesis study. Sci. Total Environ. 2024, 926, 172061. [Google Scholar] [CrossRef]
Figure 1. Distribution of soil sampling points in tea plantations in the study area (n = 108).
Agronomy 14 01599 g001
Figure 2. Spatial interpolation of soil PTEs.
Agronomy 14 01599 g002
Figure 3. Analysis of soil PTE source factors and contribution rates.
Agronomy 14 01599 g003
Figure 4. Soil’s non-carcinogenic risk and carcinogenic risk.
Agronomy 14 01599 g004
Table 1. Health risk assessment parameters.
ParameterParameter Meaning and UnitAdultChildren
OSIRdaily soil intake (mg d−1)100200
EDexposure duration (a)246
BWbody weight (kg)61.819.2
SAEexposed skin area (cm2)53742848
SSARsoil adherence factor to skin (mg cm−2 d−1)0.070.2
EVdaily skin contact event frequency (d a−1)11
EFexposure frequency (d a−1)350350
PM10particulate matter concentration in air (mg m−3)0.1190.119
DAIRdaily inhalation volume of air (m3 d−1)14.57.5
AFproportion of inhaled soil particles retained in the body 0.750.75
fspoproportion of soil particles in outdoor air 0.80.8
fsproportion of soil particles in indoor air 0.50.5
EFOoutdoor exposure frequency (d a−1)87.587.5
EFIindoor exposure frequency (d a−1)262.5262.5
ATnon-carcinogenic effect average time (d)87602190
ATcarcinogenic effect average time (d)27,74027,740
ABSooral intake absorption efficiency factor 11
ABSddermal contact absorption efficiency factor As: 0.03, others: 0.001
Table 2. RfD and SF take parameters.
PTEsRfD/(mg kg−1·d−1)SF/(mg kg−1·d−1)
Oral
Ingestion
InhalationDermal ContactOral
Ingestion
InhalationDermal Contact
Cd1.00 × 10−31.00 × 10−32.50 × 10−50.386.10.38
As3.00 × 10−43.00 × 10−43.50 × 10−41.518.31.5
Cr3.00 × 10−32.86 × 10−57.50 × 10−5 42
Pb3.50 × 10−33.50 × 10−35.30 × 10−5
Hg3.00 × 10−48.57 × 10−52.10 × 10−5
Table 3. Descriptive statistical characteristics of soil pH, SOM (g kg−1), and PTEs (mg kg−1).
Soil
Index
MinMaxMeanSDCVBackground Value aScreening Value a Exceedance RateK-S
pH4.064.784.390.194.31 0.85
SOM6.4546.6032.068.2025.58 0.99
Cd0.051.490.190.25132.430.200.36.480.52 *
Cr 23.1062.5032.709.0727.749015000.28 **
Pb 16.8066.6036.039.7427.04357000.53
Hg0.020.090.040.0249.080.151.300.26
As8.0933.6012.504.6434.43154000.18 **
Note: * indicates results after logarithmic transformation, ** indicates results after Box–Cox transformation. For Cr, the λ value is −3, and for As, the λ value is −0.5. a Data from a national standard (GB 15618-2018) which was published by Ministry of Ecology and Environment of the People’s Republic of China.
Table 4. Concentrations of PTEs in tea leaves (mg kg−1).
Plant IndexMinMaxMeanSDCVTea Safety Standard *
Cd0.0030.0580.0190.01577.721.0
Cr0.0370.5500.2930.10635.995.0
Pb0.0830.4000.2200.06629.855.0
Hg0.0100.0150.01040.00110.090.3
As0.0790.2100.1390.03424.642.0
Note: * Data from industrial standards (NY5244—2004 and NY659—2003) which were published by Ministry of Agriculture and Rural Affairs of the People’s Republic of China.
Table 5. Semi-covariance function model for soil PTEs and related parameters.
Soil IndexModelNuggetSillRange (m)Nugget/Sill (%)R2
CdExponential37.792.4657.0040.80.574
CrGaussian0.00550.074995.267.30.612
PbLinear29.603194.9838719.5631.20.615
HgGaussian0.000110.00052400.1021.20.944
AsGaussian6.426.42398.3724.20.577
Table 6. Correlation analysis of pH, SOM, and PTEs.
Soil IndexpHSOMCdCrPbHgAs
pH1.000
SOM0.1891.000
Cd0.471 **0.324 *1.000
Cr0.020−0.555 **0.0631.000
Pb0.388 **0.714 **0.650 **−0.477 **1.000
Hg−0.0220.1770.007−0.0460.0811.000
As0.049−0.625 **−0.0960.895 **−0.536 **−0.1441.000
Note: * and ** indicate significant differences at p < 0.05 and p < 0.01, respectively.
Table 7. Evaluation of potential ecological risk indices.
Soil IndexMinMaxMeanEcological Risk
Cd7.05223.528.28Low potential risk
Cr0.511.390.73Low potential risk
Pb0.030.100.07Low potential risk
Hg4.0018.028.52Low potential risk
As5.3922.108.99Low potential risk
RI26.24246.5946.58Mild ecological hazard
Table 8. Evaluation of non-carcinogenic health risks of PTEs in soil.
IndexHQoisHQdcsHQpisHQ
AdultChildAdultChildAdultChildAdultChild
CdMean5.85 × 10−43.77 × 10−38.80 × 10−54.29 × 10−44.35 × 10−67.25 × 10−66.77 × 10−44.20 × 10−3
Max4.62 × 10−32.98 × 10−26.96 × 10−43.39 × 10−33.44 × 10−55.73 × 10−55.35 × 10−33.32 × 10⁻²
CrMean3.38 × 10−22.18 × 10−15.09 × 10−12.48 × 10−22.64 × 10−24.40 × 10−26.53 × 10−22.86 × 10−1
Max6.47 × 10−24.16 × 10−19.73 × 10−14.74 × 10−25.05 × 10−28.40 × 10−21.25 × 10−15.48 × 10⁻¹
PbMean3.19 × 10−22.06 × 10−17.94 × 10−13.87 × 10−22.38 × 10−43.96 × 10−44.01 × 10−22.45 × 10−1
Max5.91 × 10−23.80 × 10−11.47 × 10−27.15 × 10−24.39 × 10−47.32 × 10−47.42 × 10−24.52 × 10⁻¹
HgMean4.41 × 10−42.84 × 10−32.37 × 10−51.15 × 10−41.15 × 10−51.91 × 10−54.76 × 1042.97 × 10−3
Max9.32 × 10−46.00 × 10−35.01 × 10−52.44 × 10−42.43 × 10−54.04 × 10−51.01 × 10−36.28 × 10⁻³
AsMean1.39 × 10−18.98 × 10−11.57 × 10−27.67 × 10−21.04 × 10−31.73 × 10−31.56 × 10−19.76 × 10−1
Max3.48 × 10−12.243.92 × 10−21.91 × 10−12.59 × 10−34.31 × 10−33.89 × 10−12.43
THIMean2.06 × 10−11.332.89 × 10−21.41 × 10−12.77 × 10−24.61 × 10−22.63 × 10−11.51
Max4.30 × 10−12.775.33 × 10−22.60 × 10−15.32 × 10−28.86 × 10−25.37 × 10−13.12
Table 9. Evaluation of the health risk for cancer of PTEs in soil.
IndexCRoisCRdcsCRpisCR
AdultChildAdultChildAdultChildAdultChild
CdMean3.51 × 10−85.65 × 10−81.32 × 10−101.61 × 10−104.19 × 10−91.74 × 10−93.94 × 10−85.84 × 10−8
Max2.77 × 10−74.46 × 10−71.04 × 10−91.27 × 10−93.31 × 10−81.38 × 10−83.11 × 10−74.61 × 10⁻⁷
AsMean9.91 × 10−61.59 × 10−51.12 × 10−61.36 × 10−68.99 × 10−73.74 × 10−71.19 × 10−51.76 × 10−5
Max2.47 × 10−53.97 × 10−52.79 × 10−63.40 × 10−62.24 × 10−69.33 × 10−72.97 × 10−54.40 × 10⁻⁵
CrMean 5.01 × 10−62.08 × 10−65.01 × 10−62.08 × 10−6
Max 9.57 × 10−63.98 × 10−69.57 × 10−63.98 × 10−6
TCRMean9.95 × 10−61.60 × 10−51.12 × 10−61.36 × 10−65.91 × 10−62.46 × 10−61.70 × 10−51.98 × 10−5
Max2.50 × 10−54.01 × 10−52.79 × 10−63.40 × 10−61.18 × 10−54.93 × 10−63.94 × 10−54.81 × 10⁻⁵
Disclaimer/Publisher’s Note: The statements, opinions and data contained in all publications are solely those of the individual author(s) and contributor(s) and not of MDPI and/or the editor(s). MDPI and/or the editor(s) disclaim responsibility for any injury to people or property resulting from any ideas, methods, instructions or products referred to in the content.

